
Abstract
The indoor air quality (IAQ) of five low-energy London apartments has been assessed through the measurement of 16 key pollutants, using continuous and diffusive methods across heating and non-heating seasons. This case study approach aimed to assess the presence of pollutants within low-energy apartments and to better understand the role of ventilation and seasonal variations in indoor air quality. The results indicate strong seasonal variations, driven by increased natural ventilation rates over the summer monitoring period. A combined metric for indoor and outdoor pollutants (Itot) suggests that the IAQ in the winter (Itot = 17.7) is more than twice as bad as that seen in the summer (Itot = 8.6). Formaldehyde concentrations were lower in the non-heating season, indicating increased ventilation rates more than offset increased off-gassing, in contrast to findings in other studies. However, increased summertime ventilation rates were observed to increase the proportion of outdoor pollutants entering the internal environment. This resulted in higher indoor concentrations of NO2 in the summer than the winter, despite significant reductions in outdoor concentrations. These results demonstrate the impact of ventilation practices upon IAQ, the influence of occupant actions and the complex relationship ventilation rates play in balancing indoor and outdoor sources of air pollution.
Keywords
Introduction
Improving indoor air quality (IAQ) within people’s homes remains a key challenge, not just because of the potential levels of exposure and significant proportion of time spent at home, but because indoor air is comprised of a complex mix of both indoor and outdoor sources of pollutants. This means a building, and the building services in place, should act to dilute, disperse and remove indoor pollutants whilst limiting the ingress of outdoor pollutants into the internal environment. This balancing act is further complicated by the fact that, for both a building designer and occupant, strategies for managing good IAQ must compete with the need to provide thermal comfort, avoiding overheating and noise pollution, economic costs, and to meet energy use and carbon reduction targets.
Previous studies examining domestic IAQ have been carried out in a range of countries, varying in scale, methods and aims. Large-scale studies (>100 homes) have measured ranges of indoor and outdoor pollutants across representative samples of national housing stocks.1–3 Typically these studies have used sampling methods that report a single, mean value across the measurement period (typically a single measurement or an aggregated value taken over a few days to weeks) and may involve either single pollutants4,5 or a wide range of targeted pollutants.1,3,6,7 Statistical analysis of such large-scale measurements can then help to determine the influence of building and occupant characteristics. For example, differences have been observed between apartments and houses, 6 ventilation systems,8–11 ventilation rates,1,6,12–14 or dwellings with gas cookers, 3 renovations, 15 smokers or even the additional emissions associated with the storage of paints and cleaning materials within attached garages. 1 Significantly, these studies have indicated the influence upon IAQ of occupancy and human activity,1,16,17 the presence of indoor sources of pollutants,3,10,18 and ventilation rates.1,6,12,19–22 Measurement and numerical studies have examined the impact of air purifiers, upon various pollutants within apartments.23,24 Seasonal variations have been identified and may be associated with occupant ventilation behaviour, outdoor conditions, ventilation rates1,25 or varying emission rates from building products.26–28
Continuous, time-based, measurements tend to have been used in smaller studies but can provide further insight into these dynamic relationships and behaviours. Typically, due to equipment costs, maintenance, deployment logistics and disruption to occupants, continuous measurements have been used to assess a smaller number of pollutants, in a smaller number of locations. 29 Recently, developments in sensing technology have improved performance at low concentrations, reduced costs and allowed smaller and less-intrusive monitors to be deployed. These recent studies30,31 have shown that the performance of novel technologies is comparable to that of certified instrumentation at levels commonly encountered in indoor microenvironments, although not without limitations and potential bias. As a result of these types of developments, more recent studies of IAQ have conducted continuous measurements of two to three pollutants over periods of several months.32–34 These sensor developments increase the possibility to continuously monitor across a wider number of locations and range of pollutants for longer periods. Continuous measurements may then provide a clearer examination of the dynamics the external environment, building operation and occupant behaviour might have upon IAQ.
Recent studies have examined IAQ in both conventional and low-energy dwellings in a number of countries.11,16,35,36 However, such comparisons have not been made within the UK context, where the most significant study of 867 homes occurred between 1997 and 1999, 3 with low-energy and ventilation practices having moved on significantly in the subsequent 20 years. Within this context, the implications of a shift towards low-energy, airtight and mechanically ventilated dwellings upon IAQ needs to be better understood, both in respect to the relationship with outdoor air and the need to control emissions inside dwellings.37,38 A more recent small UK Government survey of 10 new homes indicated high concentrations of total volatile organic compounds (TVOC), formaldehyde and carbon dioxide (CO2), but only included seven-day passive sampling, one apartment dwelling and did not any capture seasonality. 39 Despite advances in measurement technologies, a recent review of Passivhaus studies indicated very few studies included physical IAQ measurements beyond CO2.40,41 This indicates a lack of comprehensive UK-based IAQ studies on low-energy dwellings including apartments. 42
Meanwhile, the recent IEA-EBC Annex 68, ‘Indoor Air Quality Design and Control in Low Energy Residential Buildings’, has contributed to the definition of IAQ metrics, identified key pollutants from previous studies and developed guidelines for the design and operational strategy of domestic dwellings. 43 This work has included setting target exposure limit values (ELVs) corresponding to the concentration thresholds, above which exposure potentially presents a risk to health. This allows an assessment of the measured concentrations against their respective health risks, providing a clearer comparison across pollutants. However, defining appropriate ELVs is not straightforward, varying between regions, exposure periods and evolving health risks. Whilst debate over these values remain, this study aligns itself with the ELV values set in IEA Annex 68 by Abadie et al. 44
Using this work as a framework, whilst taking advantage of the latest advancements in sensor technologies, this study aims to investigate the underlying mechanisms that affect indoor air quality in the context of five case study, low-energy apartments. It is proposed that within low-energy, airtight, modern dwellings, ventilation practices become increasingly influential over IAQ in both heating and non-heating seasons. Both continuous IAQ and diffusive sampling measurements have been combined with measurements of ventilation rates and the internal thermal environment. The apartments represent a typical but challenging case, situated within a noisy and polluted urban environment, where aspirations for a low-energy building must be balanced against both IAQ and broader indoor environmental quality (IEQ). The aims of the paper are as follows: Establish the presence of key pollutants within the indoor environment. Examine the influence of ventilation strategies and ventilation rates upon both indoor and outdoor sources of pollutants. Examine seasonal differences between the heating and non-heating seasons.
Research method
Case study apartments
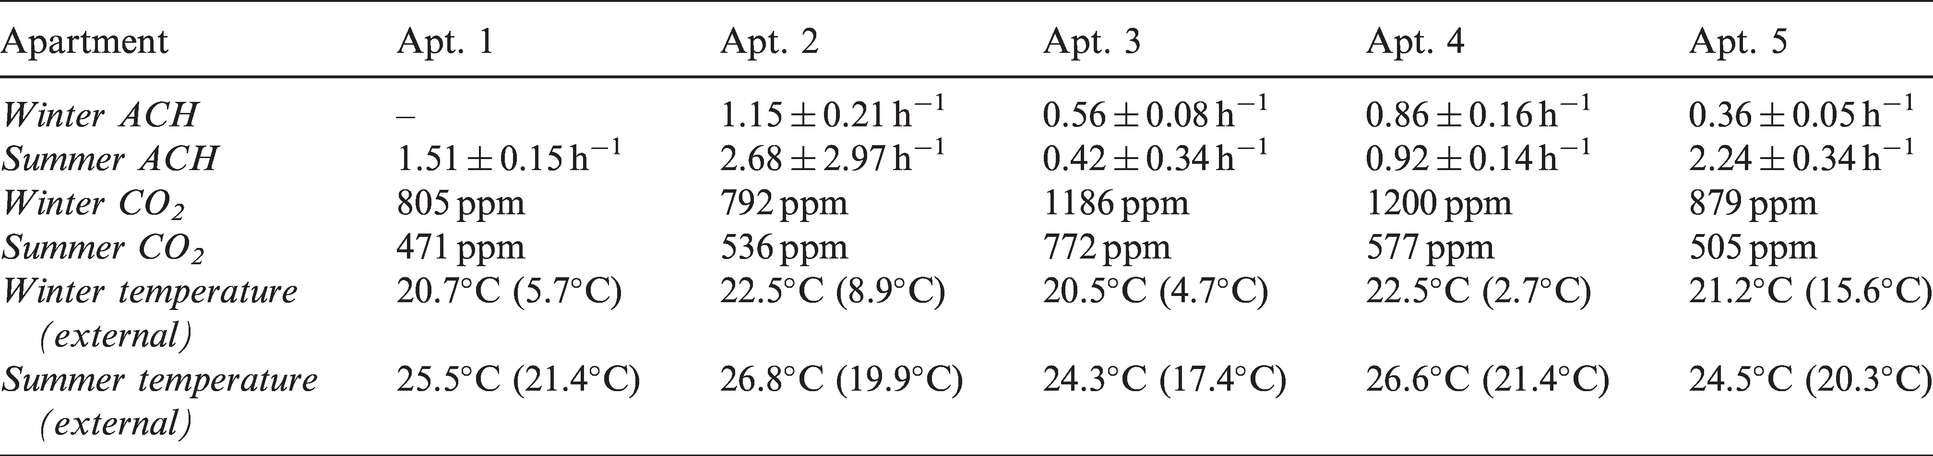
The five apartments selected for this study are located in two adjacent apartment blocks, denoted A and B, part of the same residential development and completed in 2015. Basic environmental monitoring (temperature, humidity, CO2) took place during the second year after completion with in-depth IAQ measurements then taking place three years after completion. The apartment blocks are located next to each other and at the junction of two main roads in the London Borough of Tower Hamlets in East London. There are 98 flats and maisonettes (two-storey apartments) in these blocks. Building fabric U-values are around 40% better than the limits prescribed by the 2013 edition of the Building Regulations. The buildings were also designed with target air permeability between 2 and 3 m³/h/m2 at 50 Pa pressure difference which is significantly lower than 10 m³/h/m2 limit set out in the Building Regulations. 45 Consequently, mechanical ventilation with heat recovery (MVHR) was specified as a low-energy system to ensure adequate background ventilation is provided to these apartments (design air change rate = 0.5 h−1). Importantly, this background MVHR does not provide sufficient ventilation to deal with summer heat gains and overheating and there is no mechanical cooling. Openable windows provide additional natural ventilation, particularly in the non-heating season (i.e. the period in which no heating is used). Although floor plans and openings varied between dwellings, all living rooms included openable balcony doors, with openable top hung windows available in all other rooms. Windows did not include trickle vents and whilst the openable angle of windows is limited, typically to a 60 mm reach by safety restrictors, onsite investigations found these are often bypassed by the residents. Filtration within the mechanical ventilation system (Class G3) only sufficiently filters against coarse dust particles (>10 µm). Table 1 provides background information on the sample apartments included in this study. The air permeabilities reported are based on pressure test results carried out on these apartments after building completion.
Background information for sample apartments.
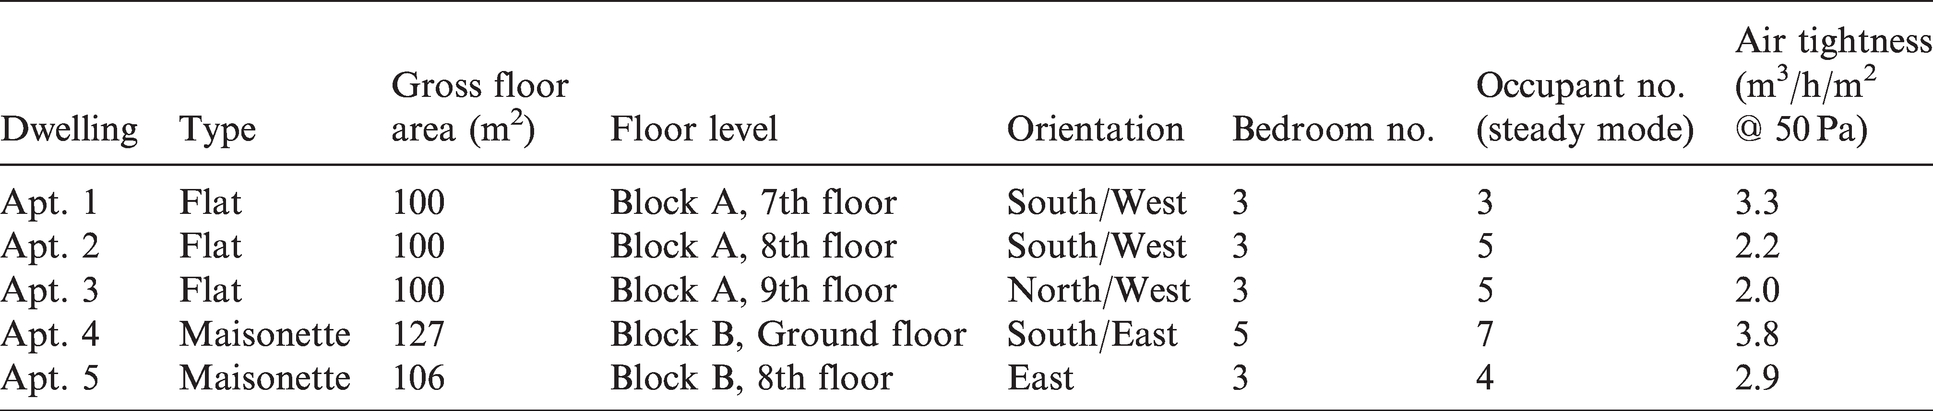
Monitored apartments were selected to be representative of the 97-apartment development as a whole, based on their floor height, orientation, number of occupants, number of bedrooms and layout. However, the study and selection were limited by the recruitment process and the sample size. An example apartment floorplan with measurement locations is shown in Figure 1.
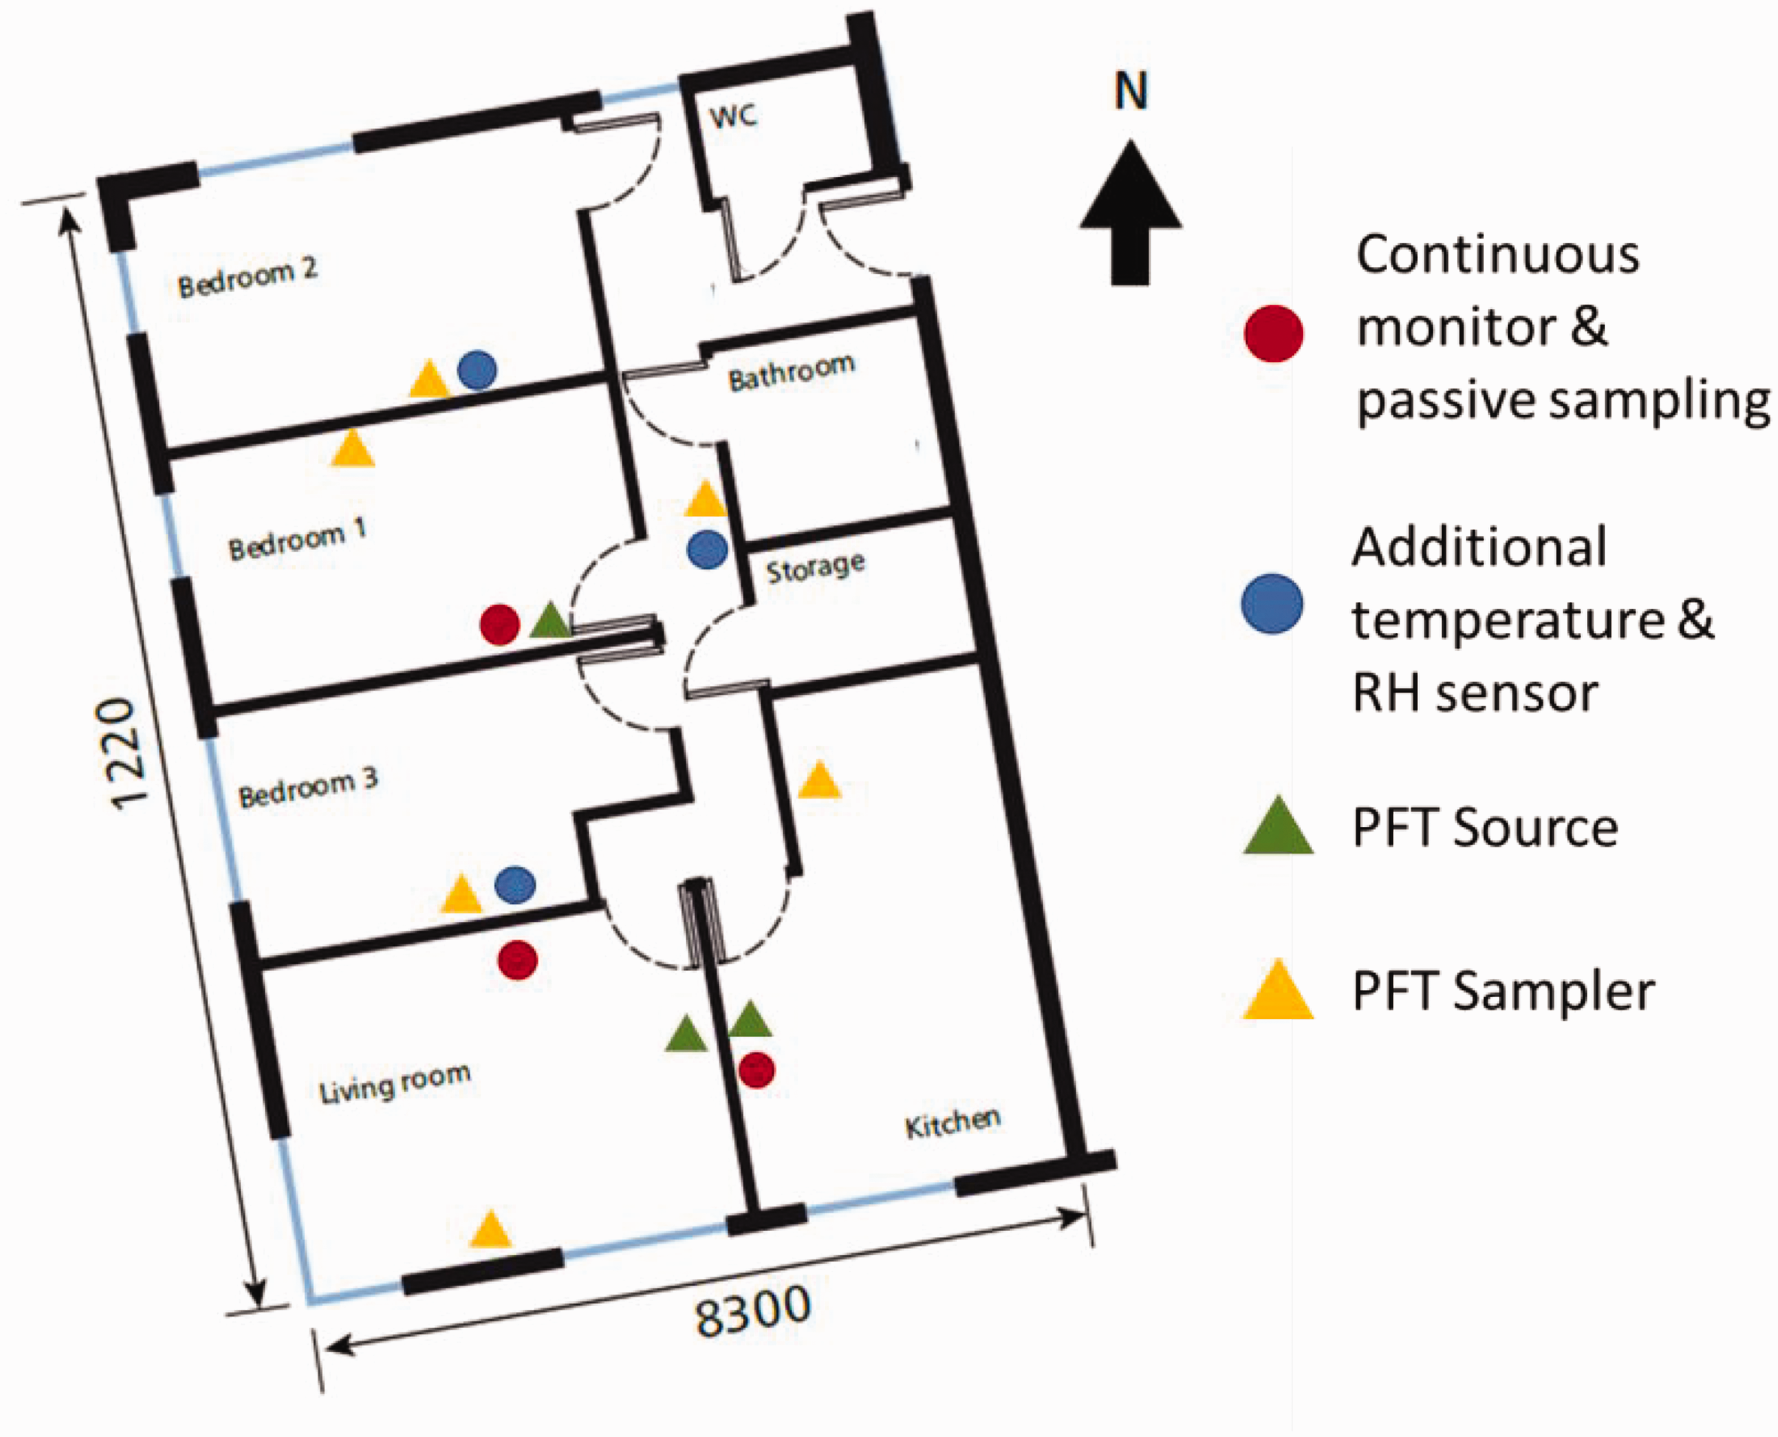
Example floor plan with continuous, passive and PFT measurement locations identified.
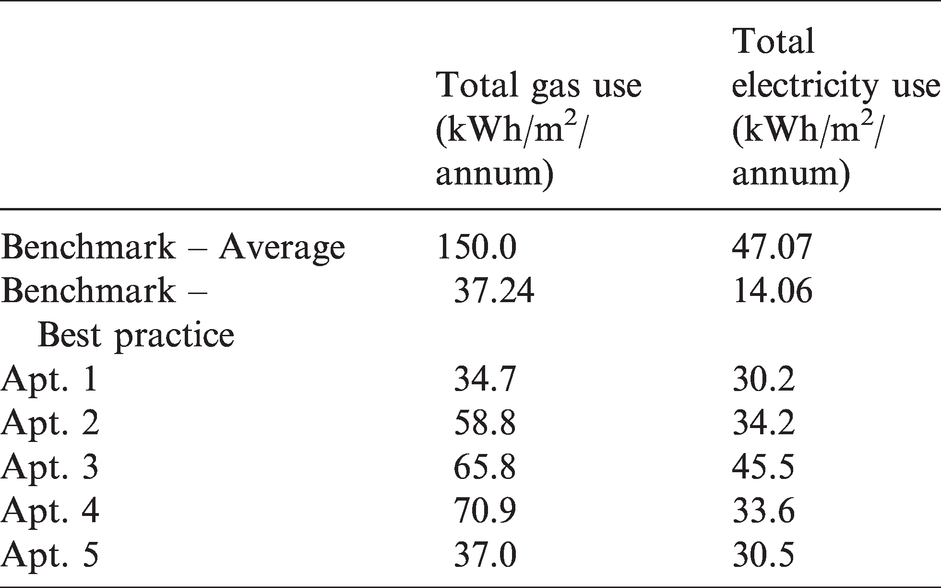
The actual energy use of the case study apartments, from the year of long-term environmental monitoring, can be seen and compared to typical and best practice benchmarks for UK apartments in Table 2. The results indicate that whilst all apartments perform better than typical apartments, electricity consumption is above best practice benchmarks. It can also be seen that there is significant variation in energy use between apartments.
Measured energy consumption of case study apartments in comparison to average and best practice benchmarks (Benchmarks based upon Domestic Energy Assessment and Reporting Methodology, DomEARM Tool). 46
The two apartment blocks are located on a corner plot, with major transport networks surrounding the site. A 4-lane road lies directly adjacent to the east, whilst further 8-lane roads lie directly adjacent to the north and 150 m to the west of the site. The nearest London Air Quality Network stations report annual mean concentrations of both roadside and urban background PM2.5 (13.2–12.2 µg/m3), PM10 (23.7–21.1 µg/m3) and roadside NO2 (50.9 µg/m3) above World Health Organisation (WHO) limits (PM2.5 – 10 µg/m3, PM10 – 20 µg/m3). 47 Short-term, 24-h, limits for background PM2.5 are breached 23 times annually. Annual mean urban background NO2 (31.9 µg/m3) is reported at three-quarters of the WHO limit (40 µg/m3), with significant seasonality, dropping from around 35 µg/m3 in the heating season to 25 µg/m3 in the summer months. Modelled noise maps then indicate significant daytime (65–74.9 LAeq,16h) and night-time (60–64.9 Lnight) noise pollution from local traffic and rail sources, 48 potentially impacting acoustic comfort and natural ventilation practices.
Long-term environmental measurements
Long-term environmental monitoring was carried out in the five apartments over a period of 12 months, proceeding short-term, more intensive IAQ measurements. Measurements of indoor air temperature, relative humidity and carbon dioxide (CO2) were carried out at 5-min intervals in the kitchen, living room and one bedroom of each apartment. Whilst the long-term and short-term measurements were not taken over the same period, these measurements provide an overall context for in-depth IAQ measurements, particularly seasonal variations across the 12-month monitored period.
Short-term IAQ measurements
Short term, in-depth IAQ measurements were carried out in all five apartments across 1–2 week intervals in the heating and non-heating seasons, with just these two seasons typically considered within UK-based studies. Measurements during the heating season were carried out between January and February 2018, with non-heating season measurements then taking place between June and September later that same year. These monitoring periods combined continuous time-based monitoring of carbon dioxide (CO2), particulate matter (PM2.5 and PM10), nitrogen dioxide (NO2), carbon monoxide (CO) and total volatile organic compounds (TVOC). Further diffusive sampling of specific gaseous pollutants was based upon potential health risks and measured concentrations in previous studies (see Table 3). Measurements were conducted externally and within the living room, kitchen and bedrooms of each apartment. Only a limited range of continuous measurements (temperature, humidity and CO2) were conducted in bedrooms due to the additional noise created by sensor fans.
Selected pollutants, measurement methods and cited indices studies.
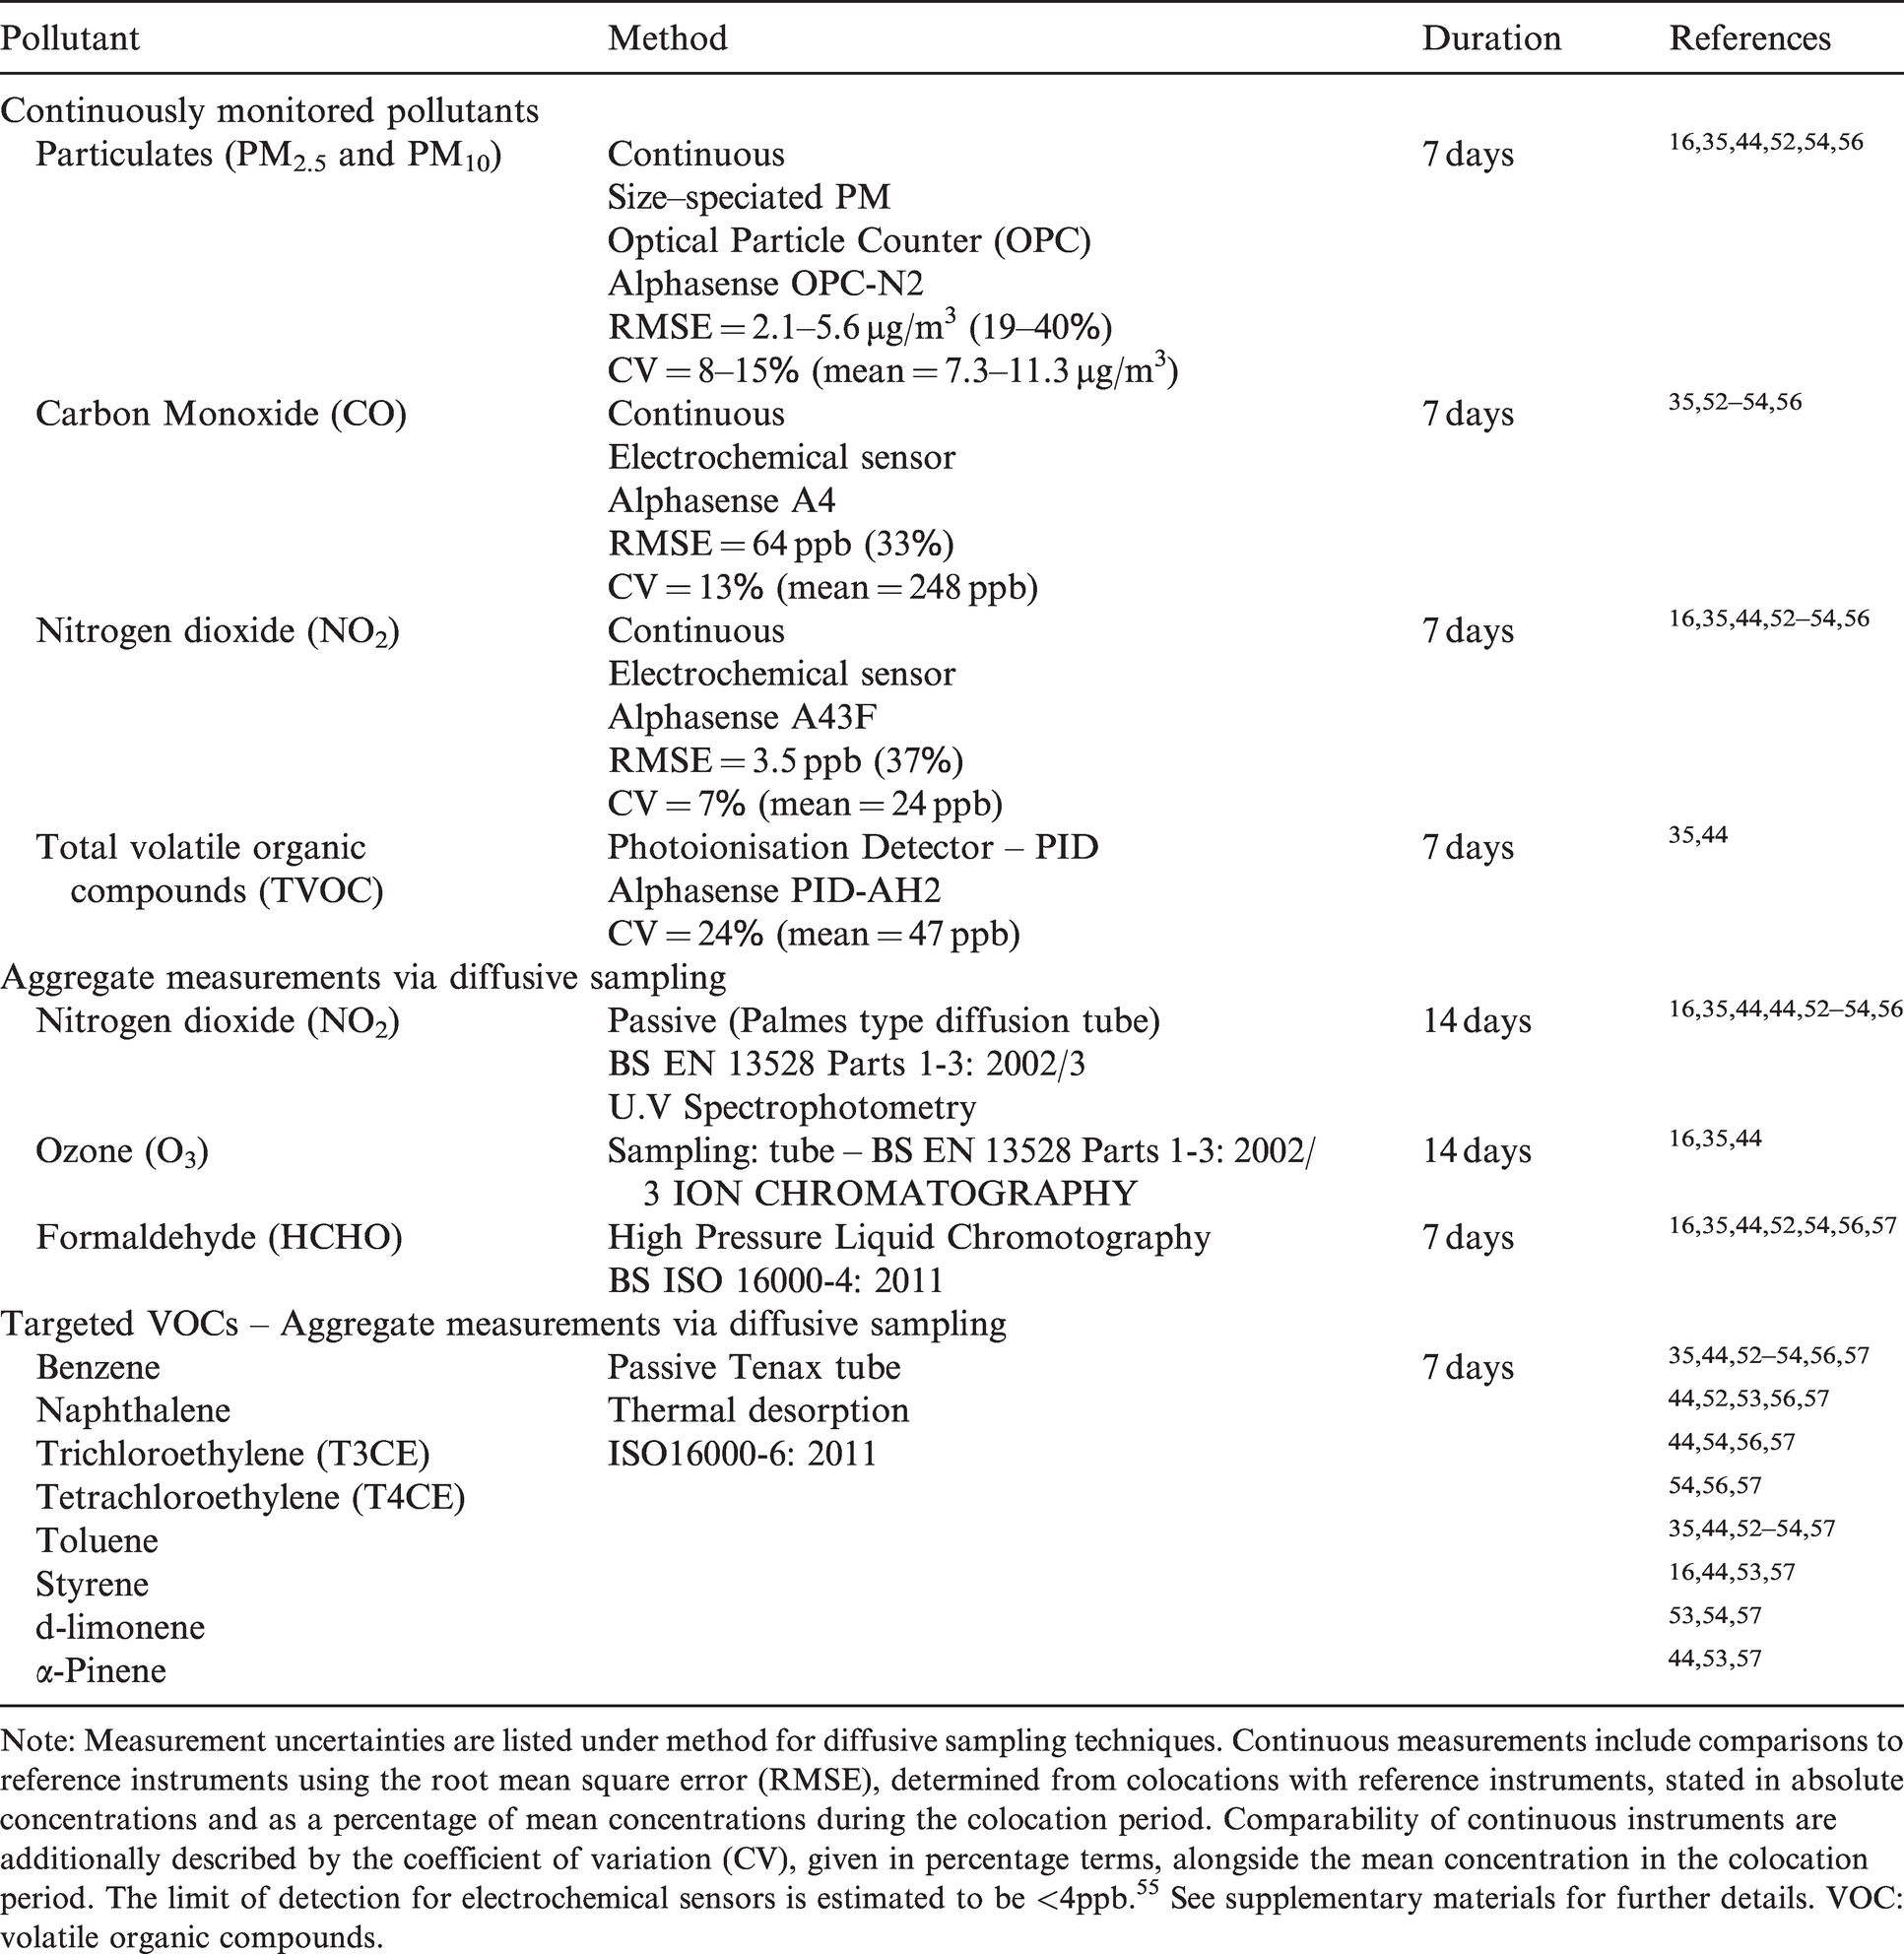
Note: Measurement uncertainties are listed under method for diffusive sampling techniques. Continuous measurements include comparisons to reference instruments using the root mean square error (RMSE), determined from colocations with reference instruments, stated in absolute concentrations and as a percentage of mean concentrations during the colocation period. Comparability of continuous instruments are additionally described by the coefficient of variation (CV), given in percentage terms, alongside the mean concentration in the colocation period. The limit of detection for electrochemical sensors is estimated to be <4ppb. 55 See supplementary materials for further details. VOC: volatile organic compounds.
A small number of studies into domestic IAQ have coupled air quality measurements with ventilation measurements, using either perfluorocarbon tracer gas techniques (PFT) measurements2,19,25 or night-time CO2 mass balances.1,6 Here, to provide further context to IAQ monitoring results, a PFT gas method was used to infer the average air exchange rates in the monitored zones of sample apartments.49,50 This was again performed in both seasons alongside intensive measurements of pollutants.
Selection of measured pollutants
Given the range of internal pollutants that can be found in residential buildings, criteria for pollutant inclusion is based upon both the health risk posed and the likely levels to be encountered in a residential setting. Under IEA-EBC Annex 68, Abadie et al.44,51 reviewed several studies that had aimed to create priority indices and metrics for residential buildings.16,52–54 Table 3 details the pollutants selected as part of this study, their measurement method, reproducibility and accuracy, as well as previous studies of residential IAQ where each pollutant has been cited as a key measurement.
Excluded pollutants and associated study limitations
The measured pollutants listed in Table 3 are not exhaustive, with several pollutants identified in the studies above omitted. It should be noted that ammonia, xylene and acetaldehyde are identified as ‘low priority’ in the Index study 53 and feature within Public Health England guidance for indoor air. 57 Sulphur dioxide may represent a significant ambient source in some worldwide locations, although in London mean annual ambient concentrations of just 1.9 µg/m3 and a 15-min maximum of 11.3 µg/m3, 47 are well below WHO guidelines and its absence in this study is unlikely to be significant.Further, PAHs feature as key pollutants identified by the WHO, 58 whilst IEA Annex 68 further included Acrolein and mould within its full scope. 51 Finally, Radon is identified as a key pollutant by the WHO, 56 and a key pollutant within new UK homes where radon measures have been found to fail. 59 The significance of Radon’s omission in this study is likely reduced as the site is in a low radon zone and all but one apartment is located above the sixth floor. However, the absence of these pollutants means that significant pollutants may have been missed by this study, which in turn may influence the conclusions and balance between indoor and outdoor sources.
Top 5 VOC sampling
Additionally, passive VOC sampling was designed to qualitatively identify the five compounds detected with the highest concentrations present in each location. Although quantitative measurement of VOC concentrations is not possible via this method, this identification of the ‘top 5’ VOCs casts a wider net and acts to identify any compounds missed amongst targeted pollutants, helping to increase understanding of the compounds present within a residential setting. However, as the concentration at which a compound becomes harmful varies, certain compounds may be present above recommended levels, but themselves are masked by unharmful compounds found at higher concentrations.
Continuous IAQ sampling
As part of the intensive monitoring periods, integrated IAQ sensors 60 were installed to measure the concentration levels of CO2, particulate matter (PM1, PM2.5, PM10), CO, NO2 and total volatile organic compounds (TVOC) in both the living rooms and kitchens of the five apartments. A sample of integrated sensor units (n = 4) have been co-located with reference instruments to obtain linear correction factors for sensor offsets and sensitivities, following the approach taken by Chatzidiakou et al., 30 which were then extrapolated to all sensor platforms (n= 9) in both indoor and outdoor co-locations. Metrics for sensor performance are listed in Table 3 with further details provided in the supplementary material.
Results and discussion
Long-term environmental monitoring
The results from long-term environmental monitoring are shown in Figure 2, highlighting key aspects of the environmental performance of the apartments and the variation seen across these 12 months. Internal temperatures show a significant increase during the summer months, with summertime overheating a prevalent issue in modern, low-energy apartments in the UK.61,62 Across July and August, living room and bedroom temperatures are above 25°C for 49% of all hours and 63% of occupied hours (determined by CO2 concentrations). Internal temperatures were then above 28°C for 7% of total hours and 4% of occupied hours across this period. This indicates the potential for overheating and thermal discomfort within the case study apartments, along with drivers for increased natural ventilation during the summer period.
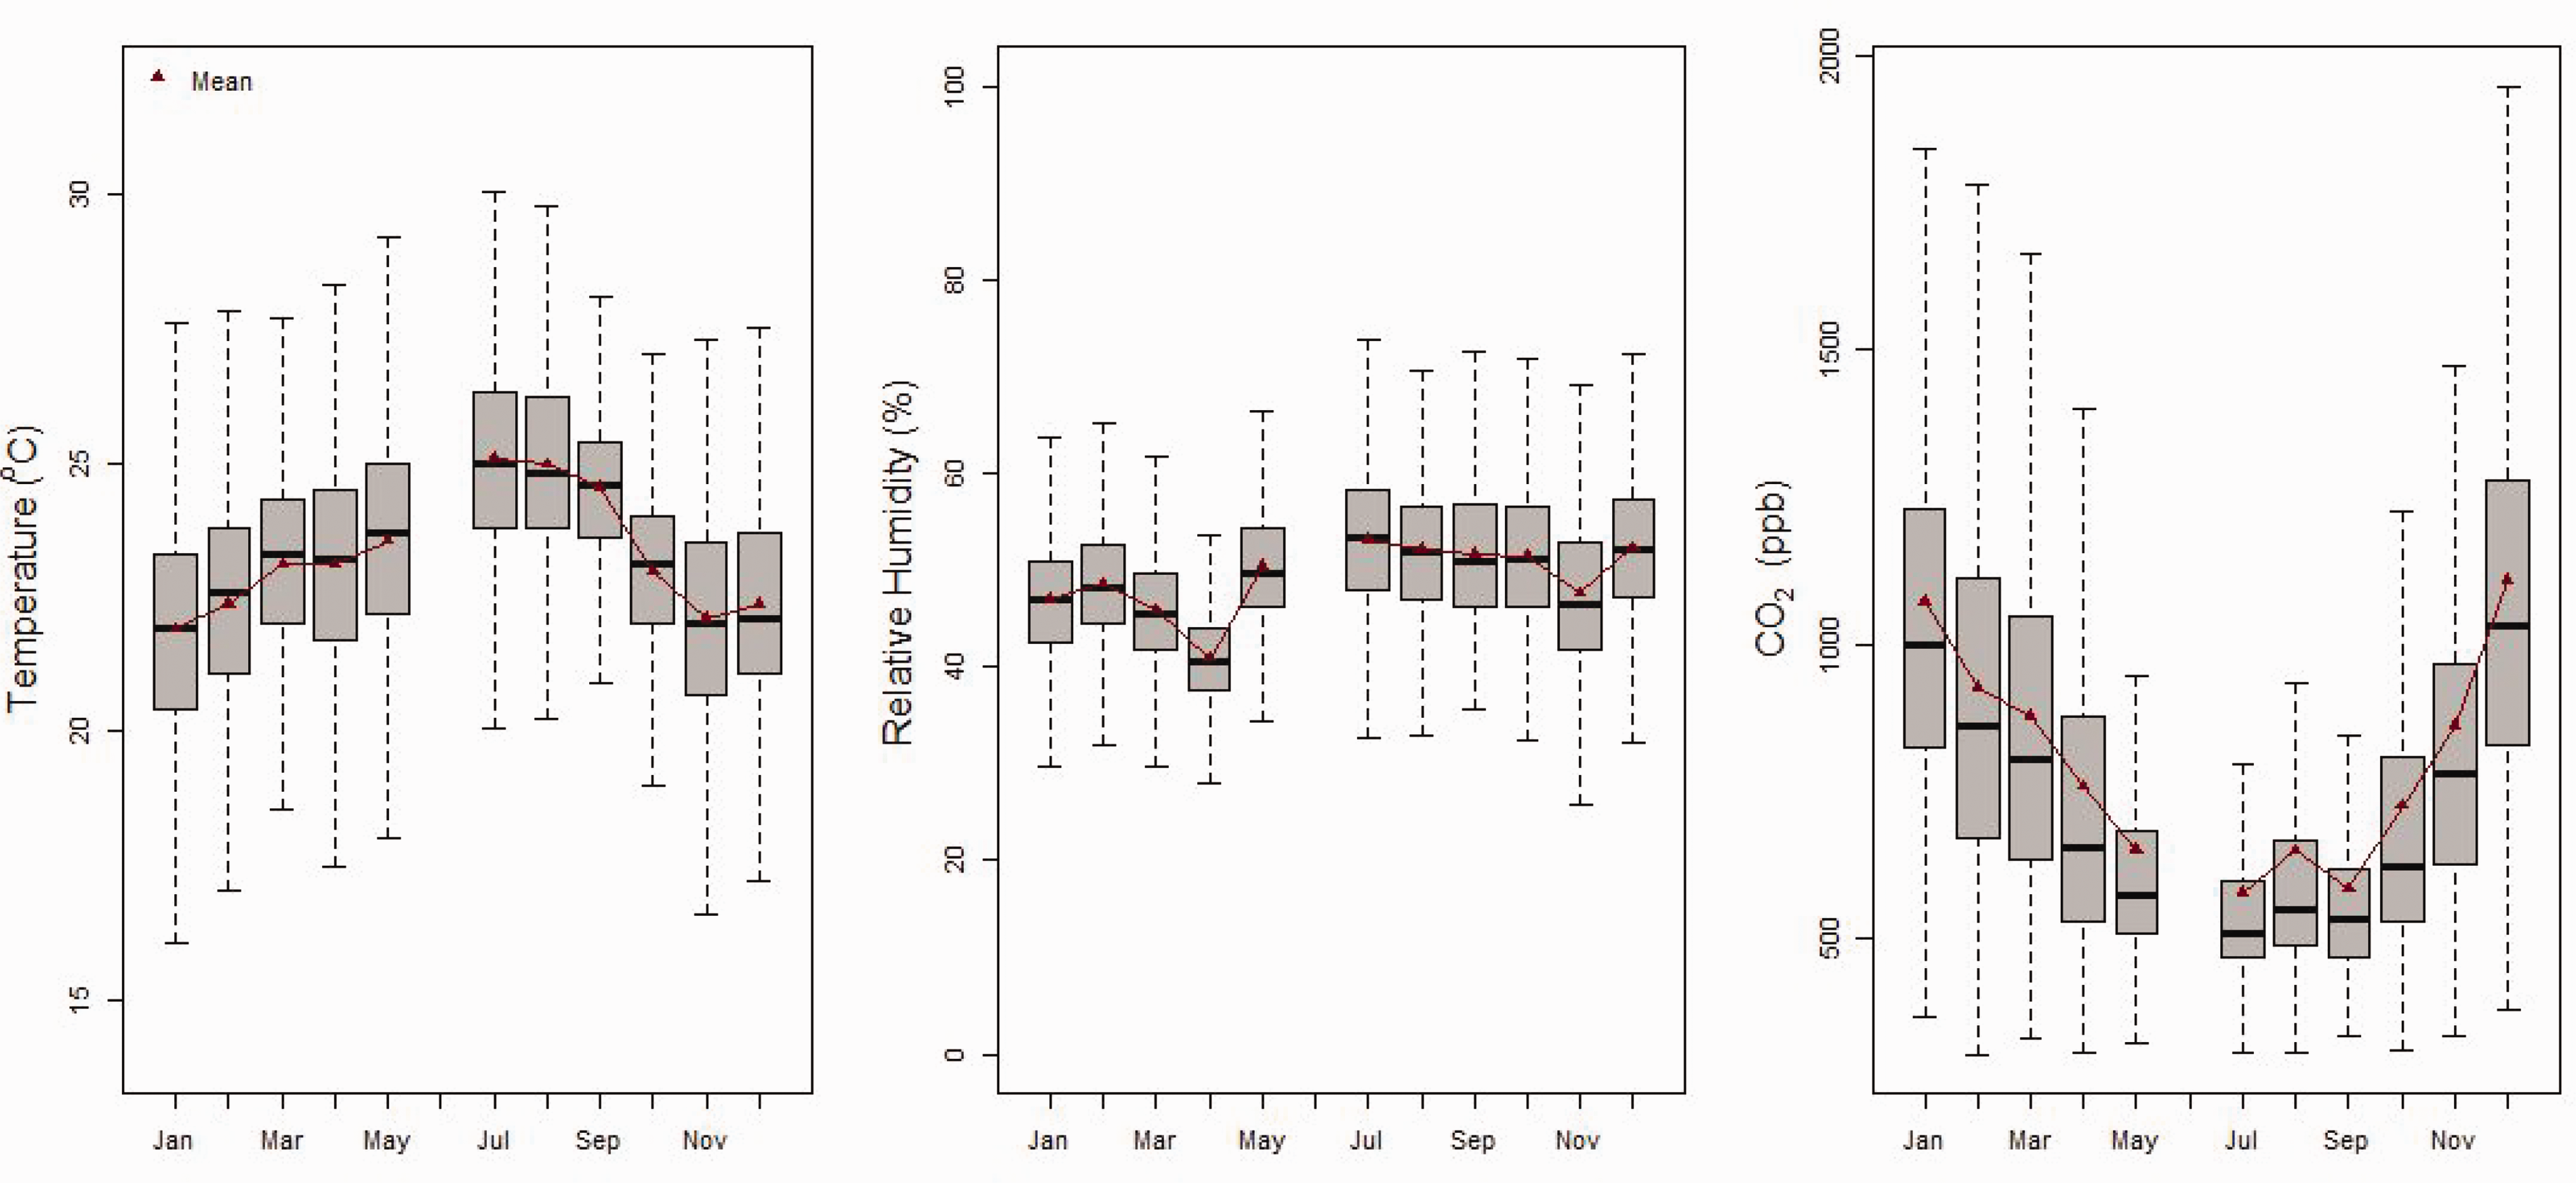
Monthly environmental conditions from long-term monitoring (one year) in all three locations (kitchen, living room, bedroom) across five case study apartments. No data were gathered in the month of June. Marginal increase in CO2 concentrations in August is likely due to some increased occupancy during school holidays.
Following this, strong seasonal patterns can then be observed within CO2 concentrations, with mean summertime concentrations significantly below those during the heating season and only marginally above external levels. The indication here is that there is a significant increase in window opening and natural ventilation during the summer to provide additional cooling and air movement, a strategy to combat the rising internal temperatures. Conversely, across the heating season, CO2 concentrations approach 1,000 ppm, indicating that significantly lower ventilation rates are achieved when background MVHR is operating alone during the winter. This may then lead to a higher build-up of internal contaminants across the heating season.
Short-term measurements of targeted pollutants
Details of measured concentrations for each targeted pollutant are detailed in Table 4. Best practice exposure limit value (ELV) associated with each pollutant, based on those defined under IEA Annex 68 and Abadie et al., 44 is also listed within Table 4.
ELVs and summary statistics for each pollutant measured across all indoor locations, both seasons.
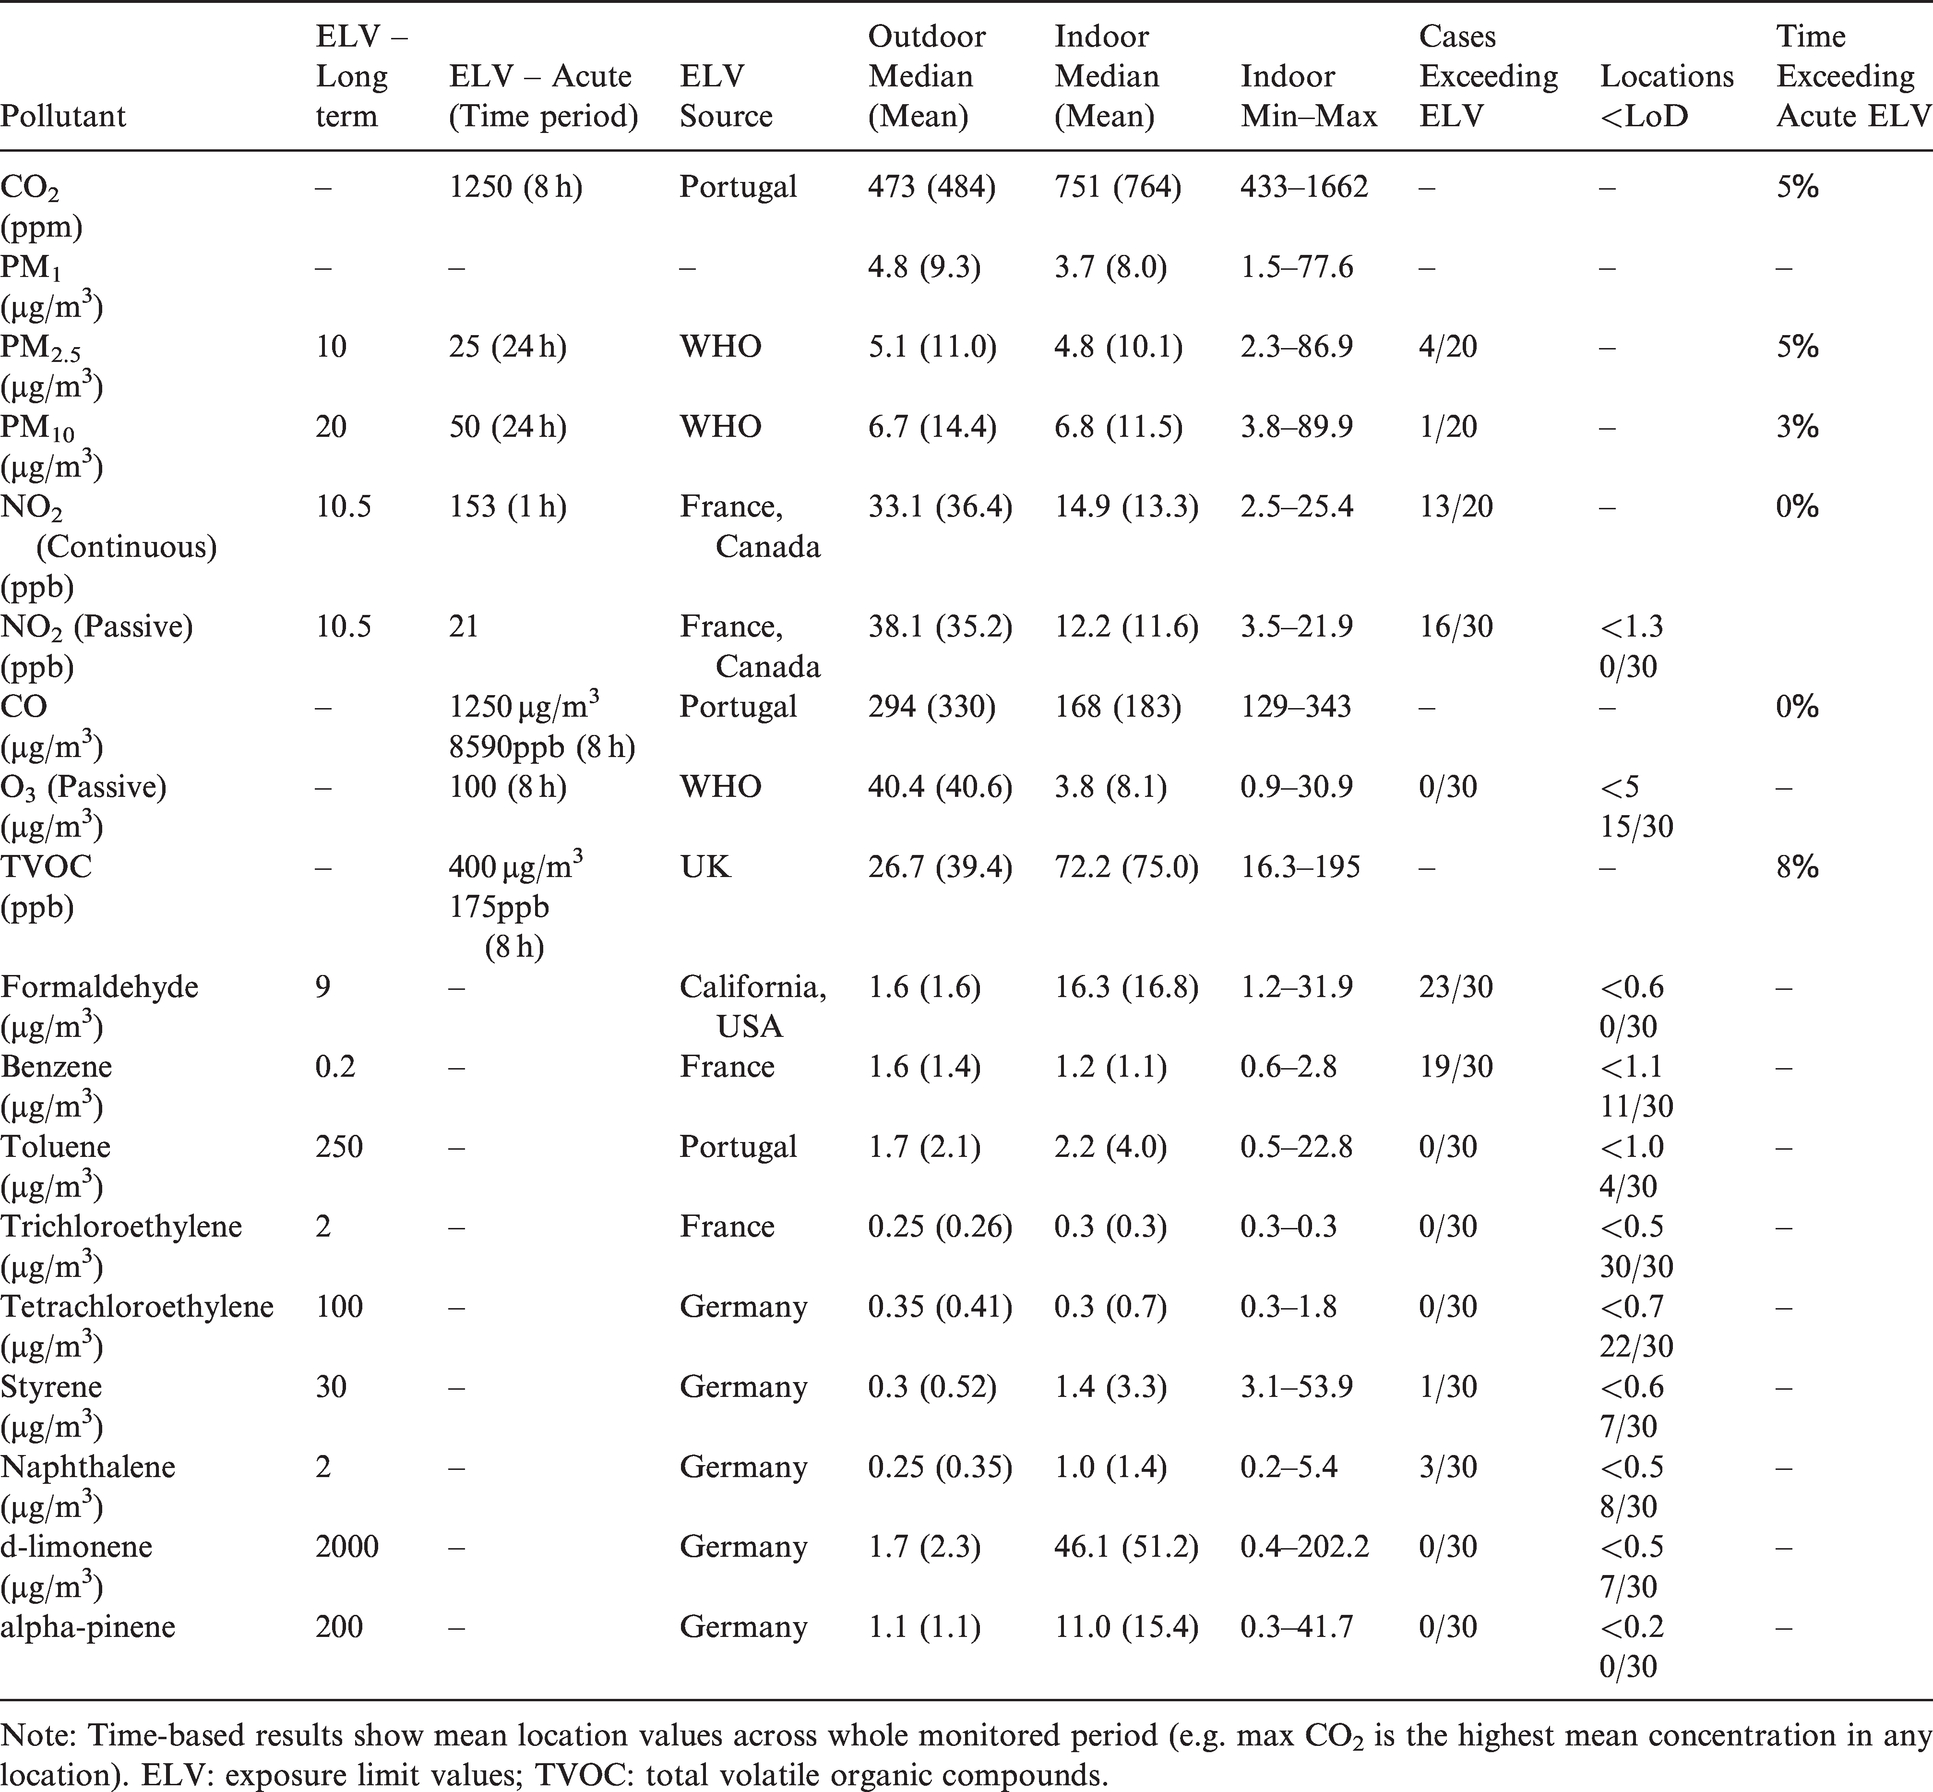
Note: Time-based results show mean location values across whole monitored period (e.g. max CO2 is the highest mean concentration in any location). ELV: exposure limit values; TVOC: total volatile organic compounds.
For further discussion, results are subsequently discussed in terms of ambient concentrations and then indoor concentrations split into predominantly outdoor sources (Figure 3) and predominantly indoor sources of pollutants (Figure 4).
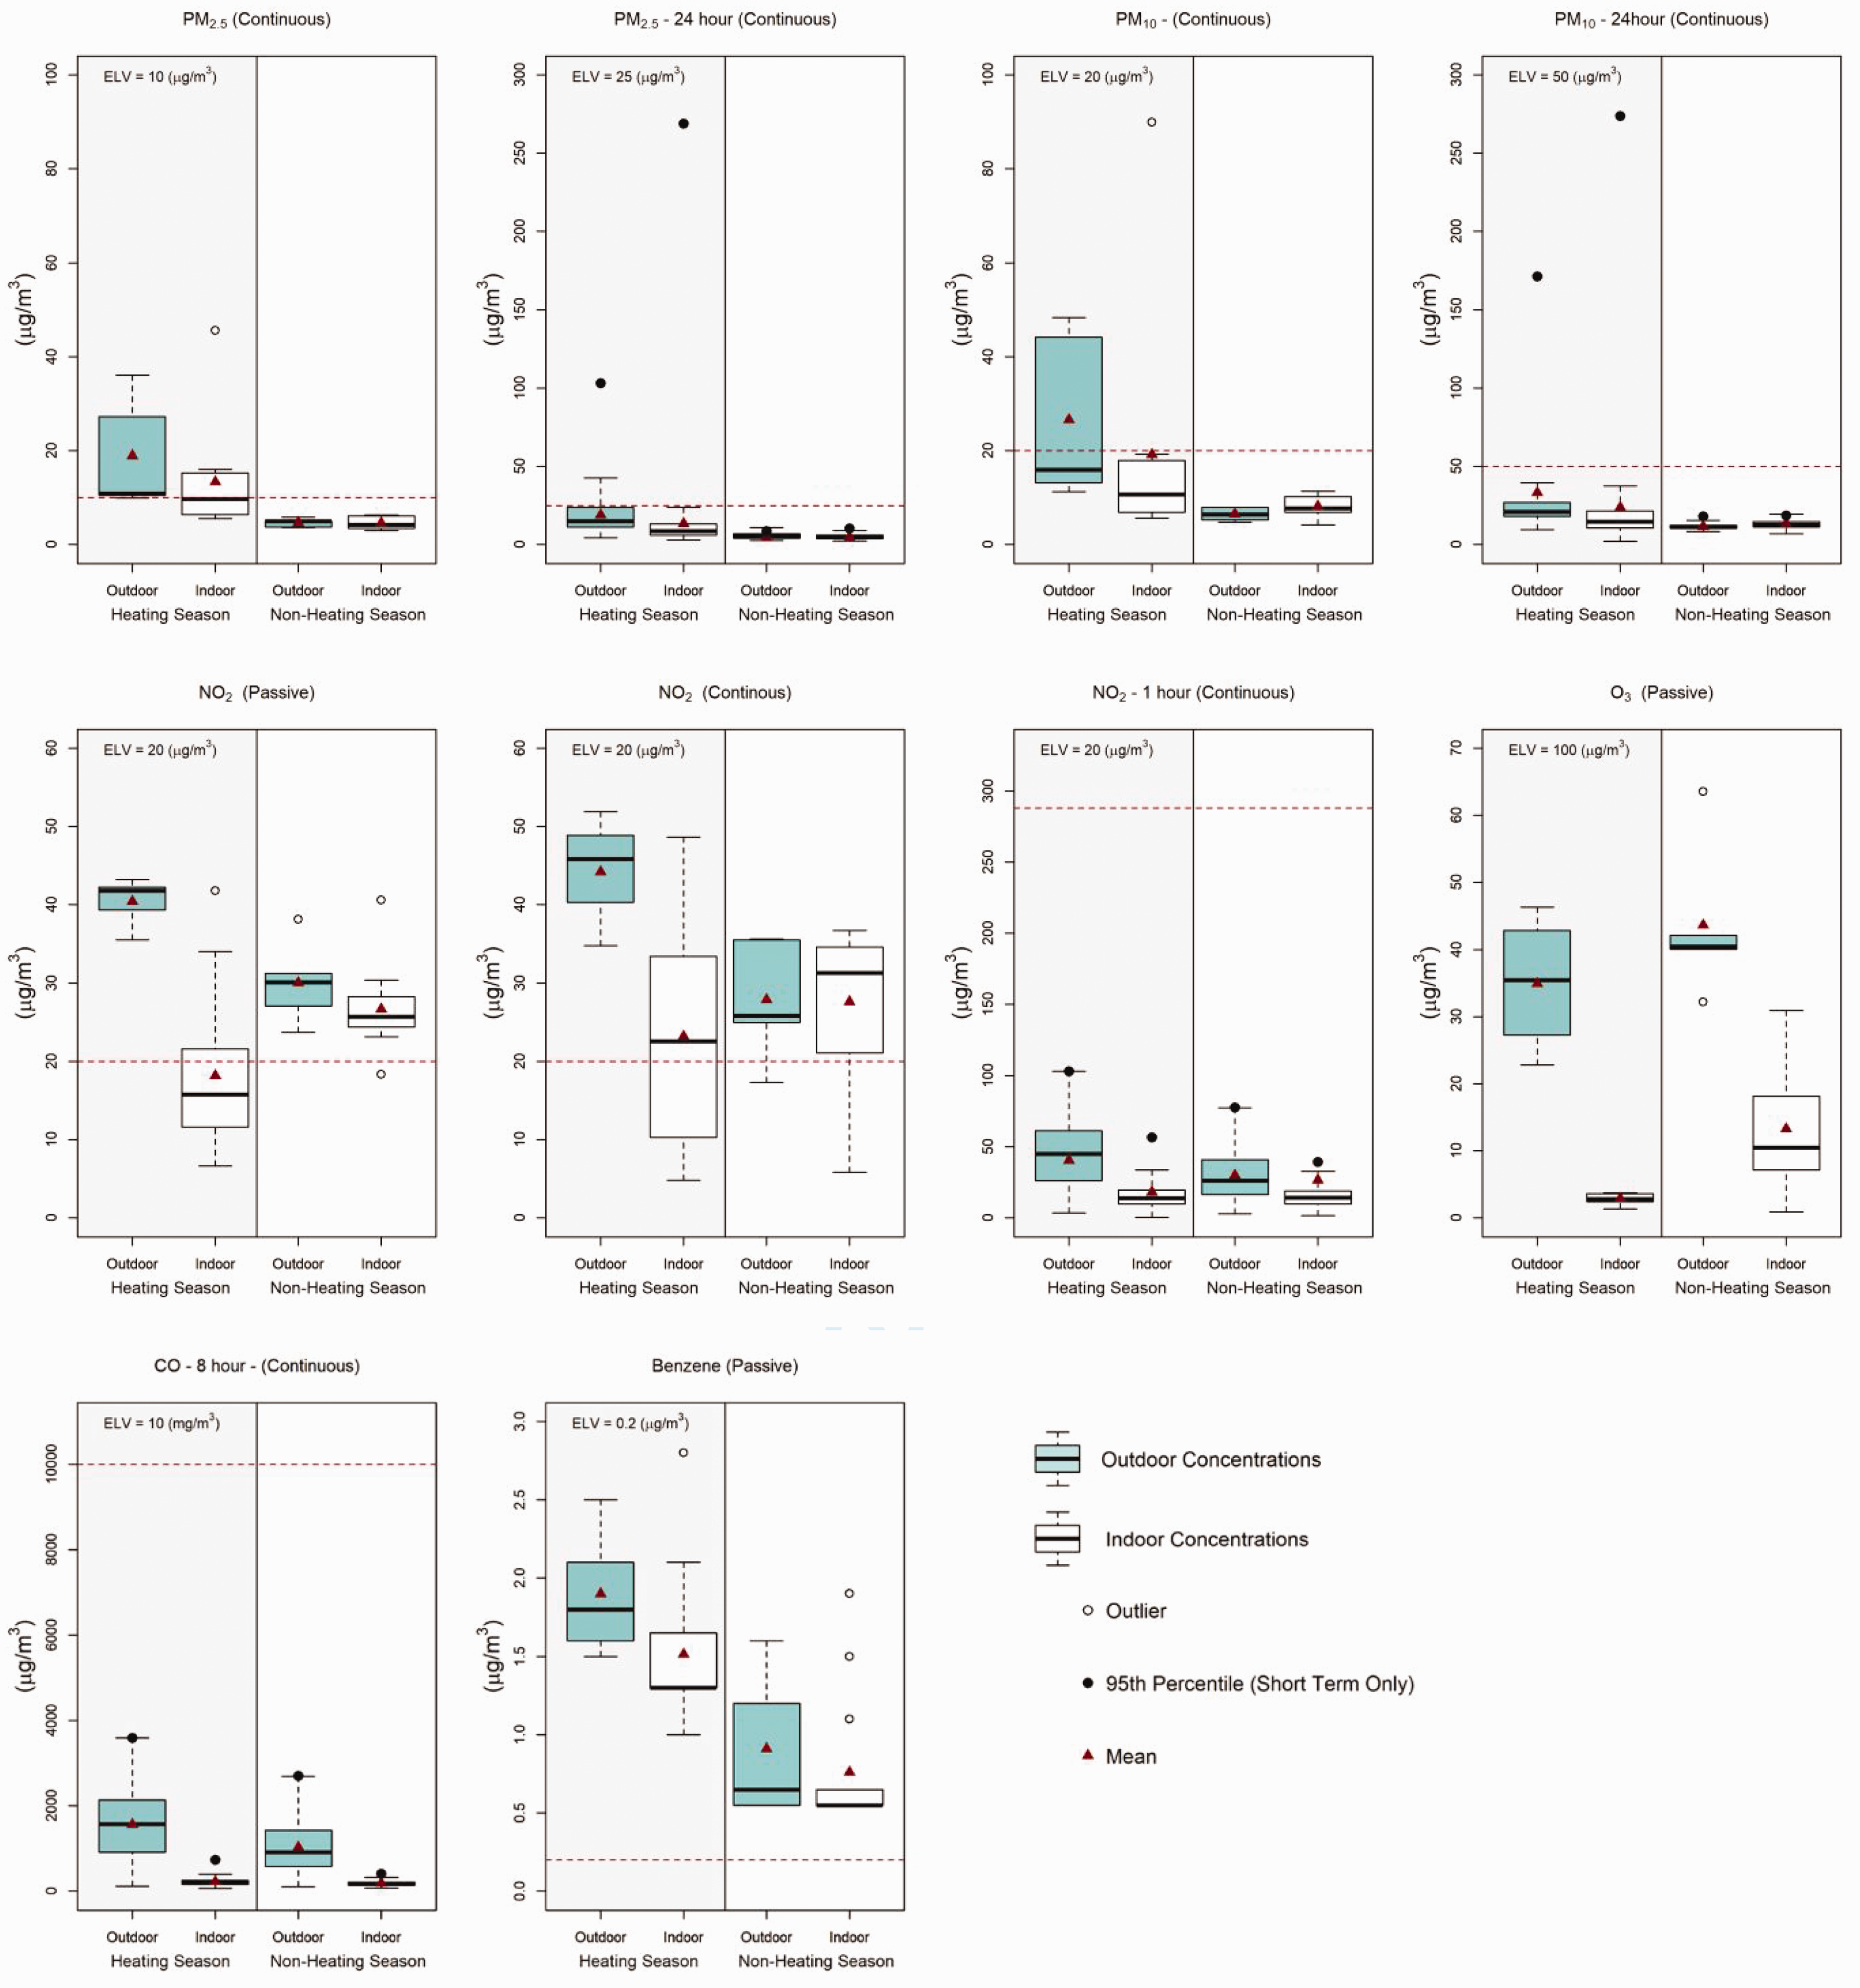
Comparison of measured indoor concentrations (five flats – three locations per flat) against ELVs for predominantly outdoor sources of pollution. Measurements of all zones within all apartments for heating and non-heating seasons are shown. Values below the limit of detection (LoD) or limit of quantification (LoQ) were replaced by LoD/2 or LoQ/2, respectively. 1
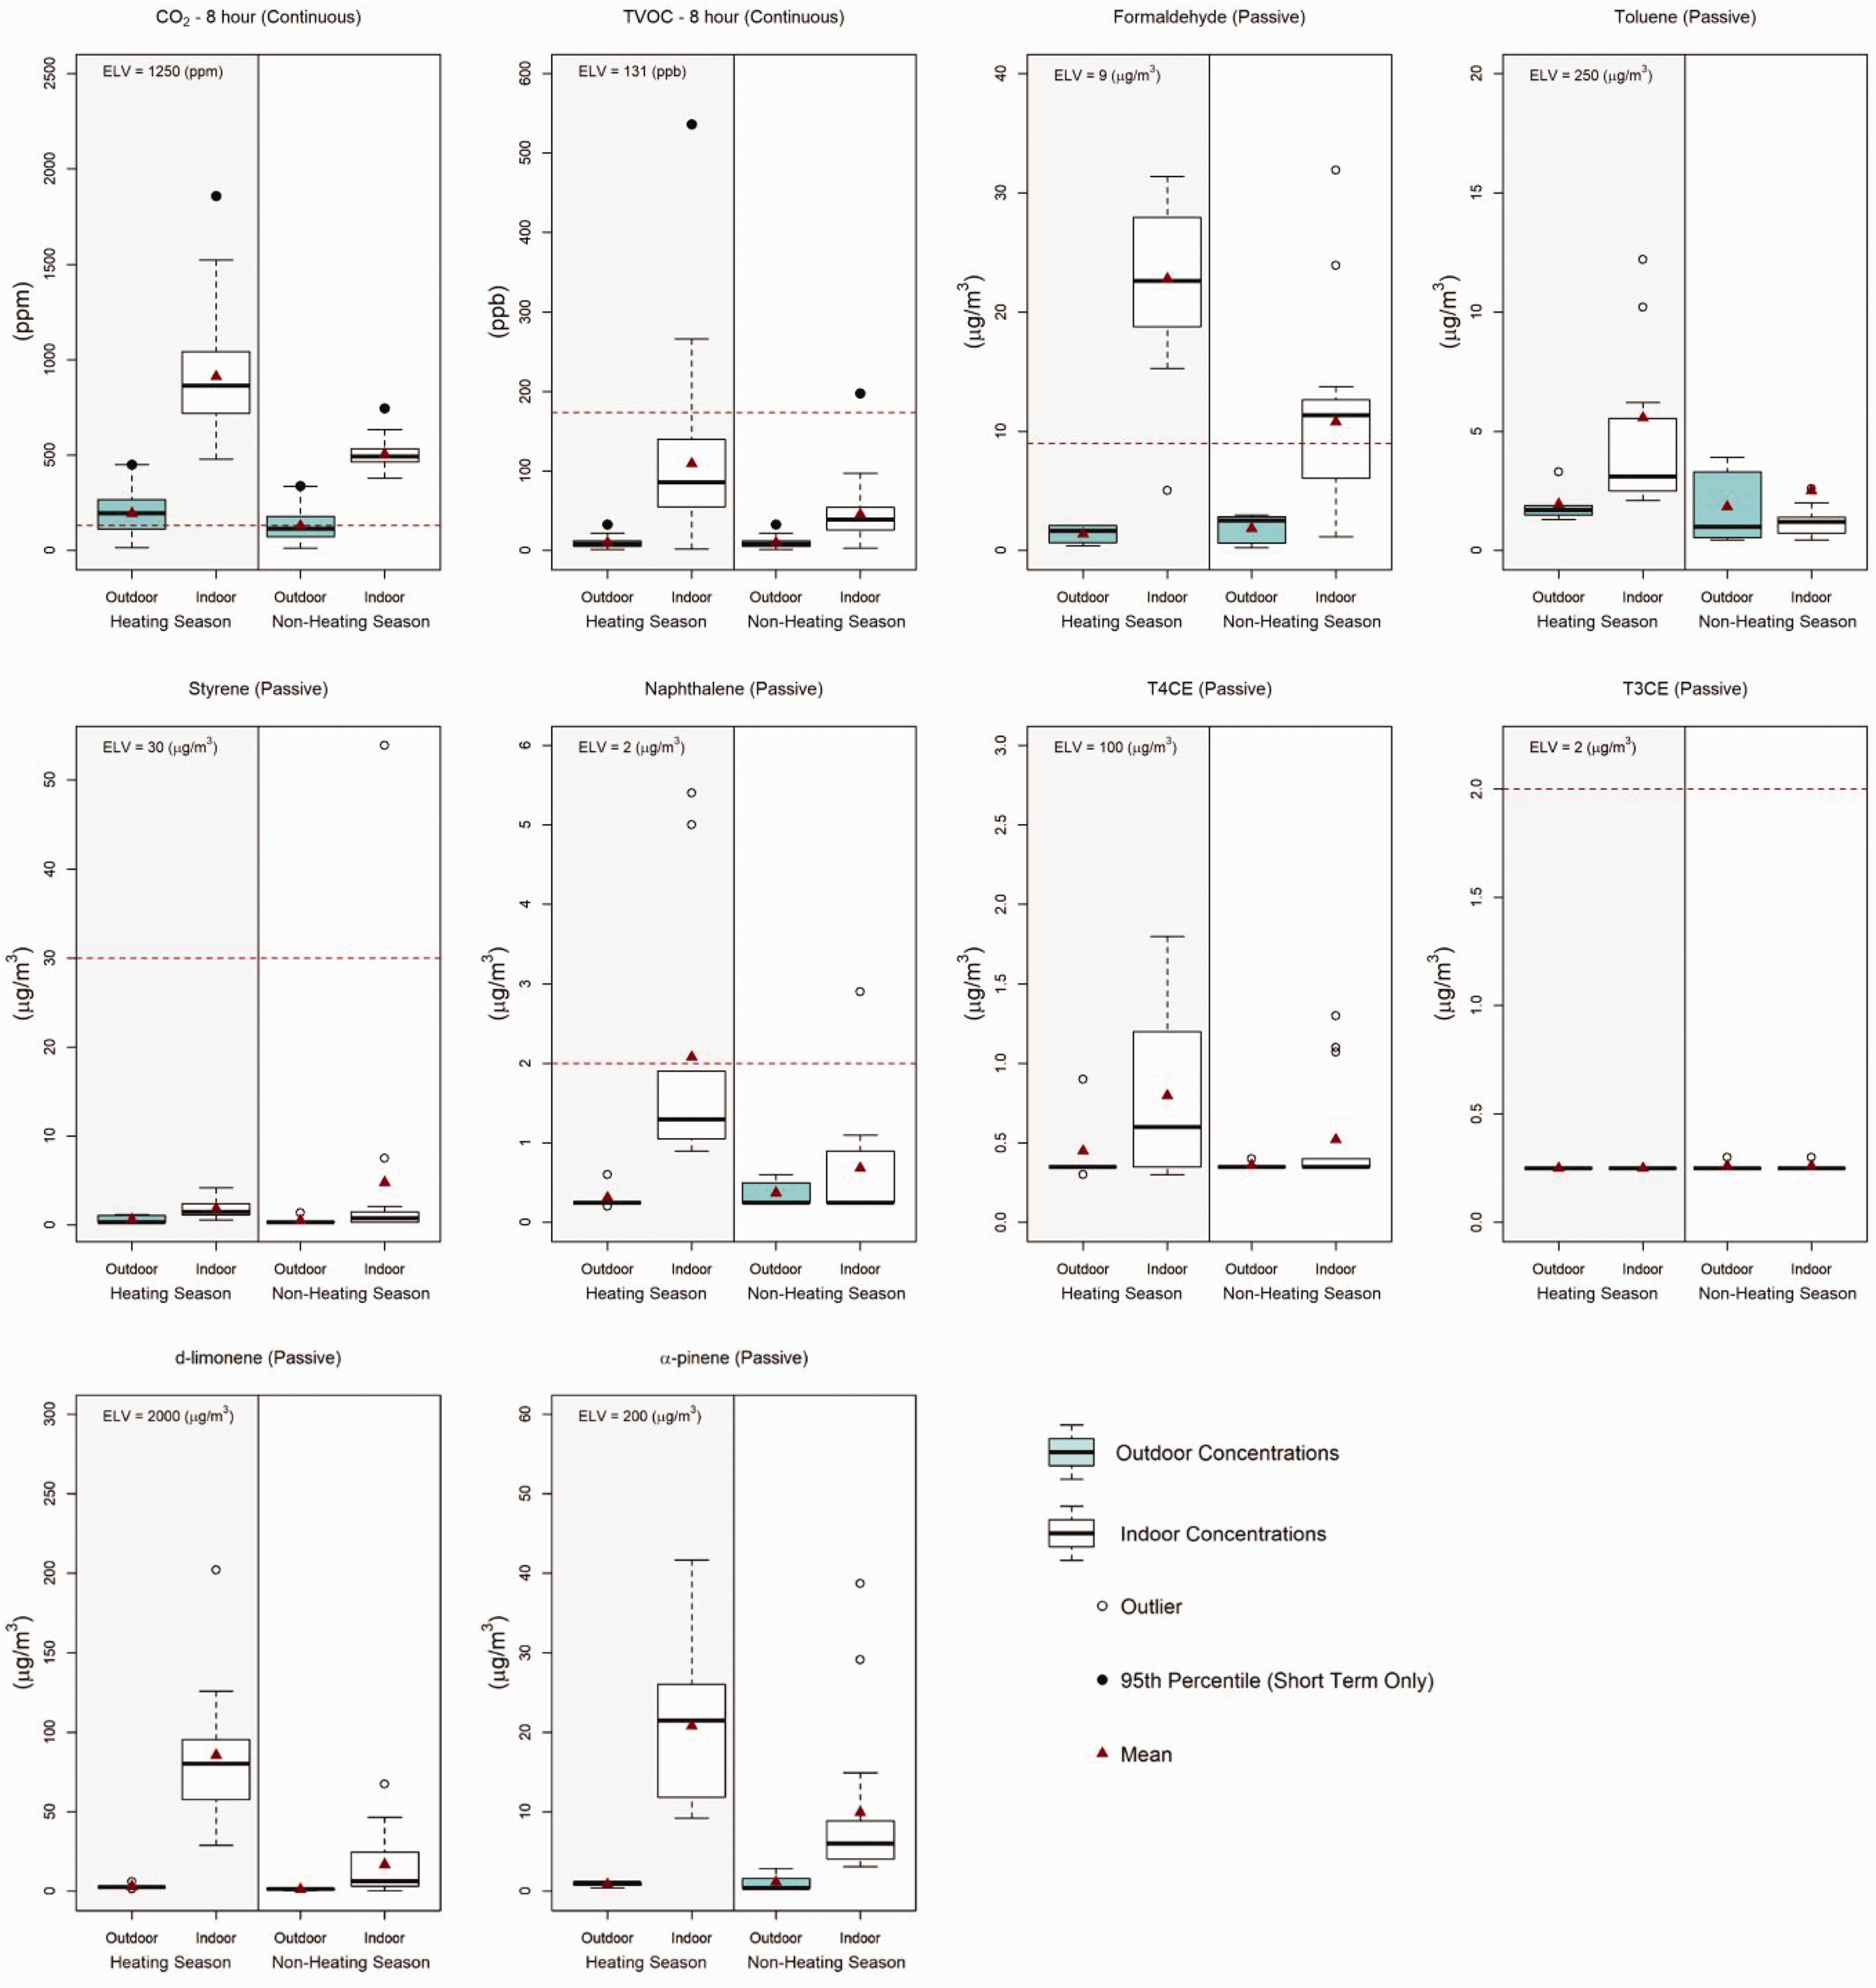
Comparison of measured indoor concentrations against ELVs for predominantly indoor sources of pollution. Includes measurements of all zones within all apartments for heating and non-heating seasons. TVOC 8 hours above limit 13% of winter and 1% of the summer monitoring period.
Ambient concentrations
Ambient concentrations recorded in the heating and non-heating seasons can be seen alongside indoor concentrations in both Figures 3 and 4, with those pollutants with higher outdoor concentrations seen in Figure 3. In all cases, excluding ozone, ambient concentrations were recorded to be higher in the heating than in non-heating season. Mean heating season ambient levels of NO2 are 44 ppb compared to 28 ppb in the non-heating season, whilst ambient PM2.5 concentrations show an even more distinct seasonal difference, decreasing from median concentrations of 14.9 µg/m3 in the heating season to just 5.7 µg/m3 across the non-heating season. Finally, through continuous measurements, comparisons against short-term, acute ELVs can be performed. Calculated 24-h rolling mean PM2.5 and PM10 concentrations exceed short-term, 24-h, ELV targets for 21% and 10% of the monitoring period in the winter, respectively. These ambient results indicate not only this strong seasonal variation, but with ambient concentrations of particulates and NO2 exceeding guideline limits, also the risks posed from the outdoor to the indoor environment.
Indoor air quality – predominantly externally generated pollutants
Corresponding indoor concentrations can be seen for both heating and non-heating seasons in Figure 4. In all cases, reductions upon ambient concentrations are seen. However, with significant local traffic sources and indoor gas-cooking, concentrations of NO2 exceeded the guideline ELV in just over half the measurement locations – 13 of 20 or 16 of 30 when measured continuously or passively, respectively (see Table 4). However, this reduces to just two cases of exceedance when less stringent WHO ambient guidelines (40 µg/m3 or 21 ppb) are adopted. A small number of indoor locations (n = 4) exceeded guideline ELVs for PM2.5, with one outlier related to occasional smoking. Acute 24-h limits are breached for PM25 and PM10 for 10% and 6% of the winter monitoring period, respectively, a significant reduction on outdoor statistics.
Benzene levels exceeded the target ELV in all measurements that were recorded above the limit of detection (19 of 30 indoor locations). However, the limit of detection (LoD) was itself higher than the target ELV, indicating a methodological limitation, with all measurements potentially exceeding the 0.2 µg/m3 threshold. Higher outdoor benzene concentrations indicate that indoor concentrations are likely caused by external traffic and ambient concentrations (see Figure 3).
Seasonal differences in indoor concentrations are highlighted in Figure 3. Whilst most pollutants follow the same pattern as outdoor levels, with winter concentrations above those in the summer, the NO2 measurements surprisingly contradict this. Measured both continuously and passively, indoor NO2 concentrations are higher in the summer despite lower outdoor concentrations across this same period.
Indoor air quality – predominantly internally generated pollutants
Indoor concentrations of primarily internally generated pollutants can be seen in Figure 4. Here, formaldehyde concentrations were above the best practice ELV for the majority of indoor locations (23 of 30; see Table 4), indicating potentially significant off-gassing even after over two years of occupancy and mirroring results in previous studies.11,36,39 This indicates the challenges faced in designing and constructing dwellings to meet this ELV, and guidelines values recently adopted by Public Health England (10 µg/m3), particularly in the absence of clear labelling schemes and inaccurate labelling. 63
Whilst continuous measurements of internal TVOC showed frequent internal sources and 7.6% of total monitored periods above the acute ELV (400 µg/m3 or 174 ppb), measured levels of targeted indoor sources of VOCs were universally low and significantly below recommended ELVs. Only a single measurement of styrene (53.9 µg/m3) and four measurements of naphthalene, taken in a single apartment, were recorded at levels above ELV thresholds. In the case of the naphthalene, the four indoor measurements which exceeded the ELV of 2 µg/m3 (ranging 2.9–5.4 µg/m3) were significantly higher than outdoor measurements, indicating indoor sources, e.g. mothballs, air fresheners, cigarette smoking or incomplete combustion. 58 Remaining, predominately indoor sources of VOCS (Toluene, Trichloroethylene, Tetrachloroethylene, Styrene, d-limonene, alpha-pinene) were then all only a fraction of their respective ELVs and often lower than the limit of detection (LoD).
Seasonal differences can again be seen in indoor source of pollutants in Figure 4. Winter concentrations are higher than summertime concentrations across all measured pollutants. Mean formaldehyde concentrations halved from 22.8 µg/m3 in the winter to 10.8 µg/m3 in summer. Similarly, 8-h exceedances for TVOC reduced from 13% of the monitored period in the winter to just 1% across the summer. This seasonal variation, seen across all pollutants, is expected to be the result of increased ventilation rates, primarily through additional natural ventilation, as indicated in the CO2 concentrations in Figure 4 and previously seen in Figure 2. Formaldehyde results are in contrast to findings in previous studies, where summertime concentrations were found to be significantly higher than in winter concentrations due to the increase in off-gassing. 3 Here, lower summertime levels would indicate that any additional off-gassing at higher temperatures is offset by the increased summertime ventilation rate.
Zonal differences
Spatial difference between kitchens, living rooms and bedrooms may be associated with differing activities, ventilation practices and pollutant sources. Figure 5 compares measured concentrations of a selected range of pollutants within each zone. With the presence of cooking activities within kitchen settings, particulate and NO2 concentrations demonstrated higher peaks, increasing the mean concentrations in these zones, although for particulates the median concentration remains close to that of living rooms. Kitchens demonstrated higher O3 concentrations, resulting from either a higher ingress of outdoor pollutants or associated with chemical reactions with higher NO2 concentrations. Bedrooms then demonstrated higher CO2 and formaldehyde concentrations, which may be linked to lower ventilation rates or an increase in indoor sources.
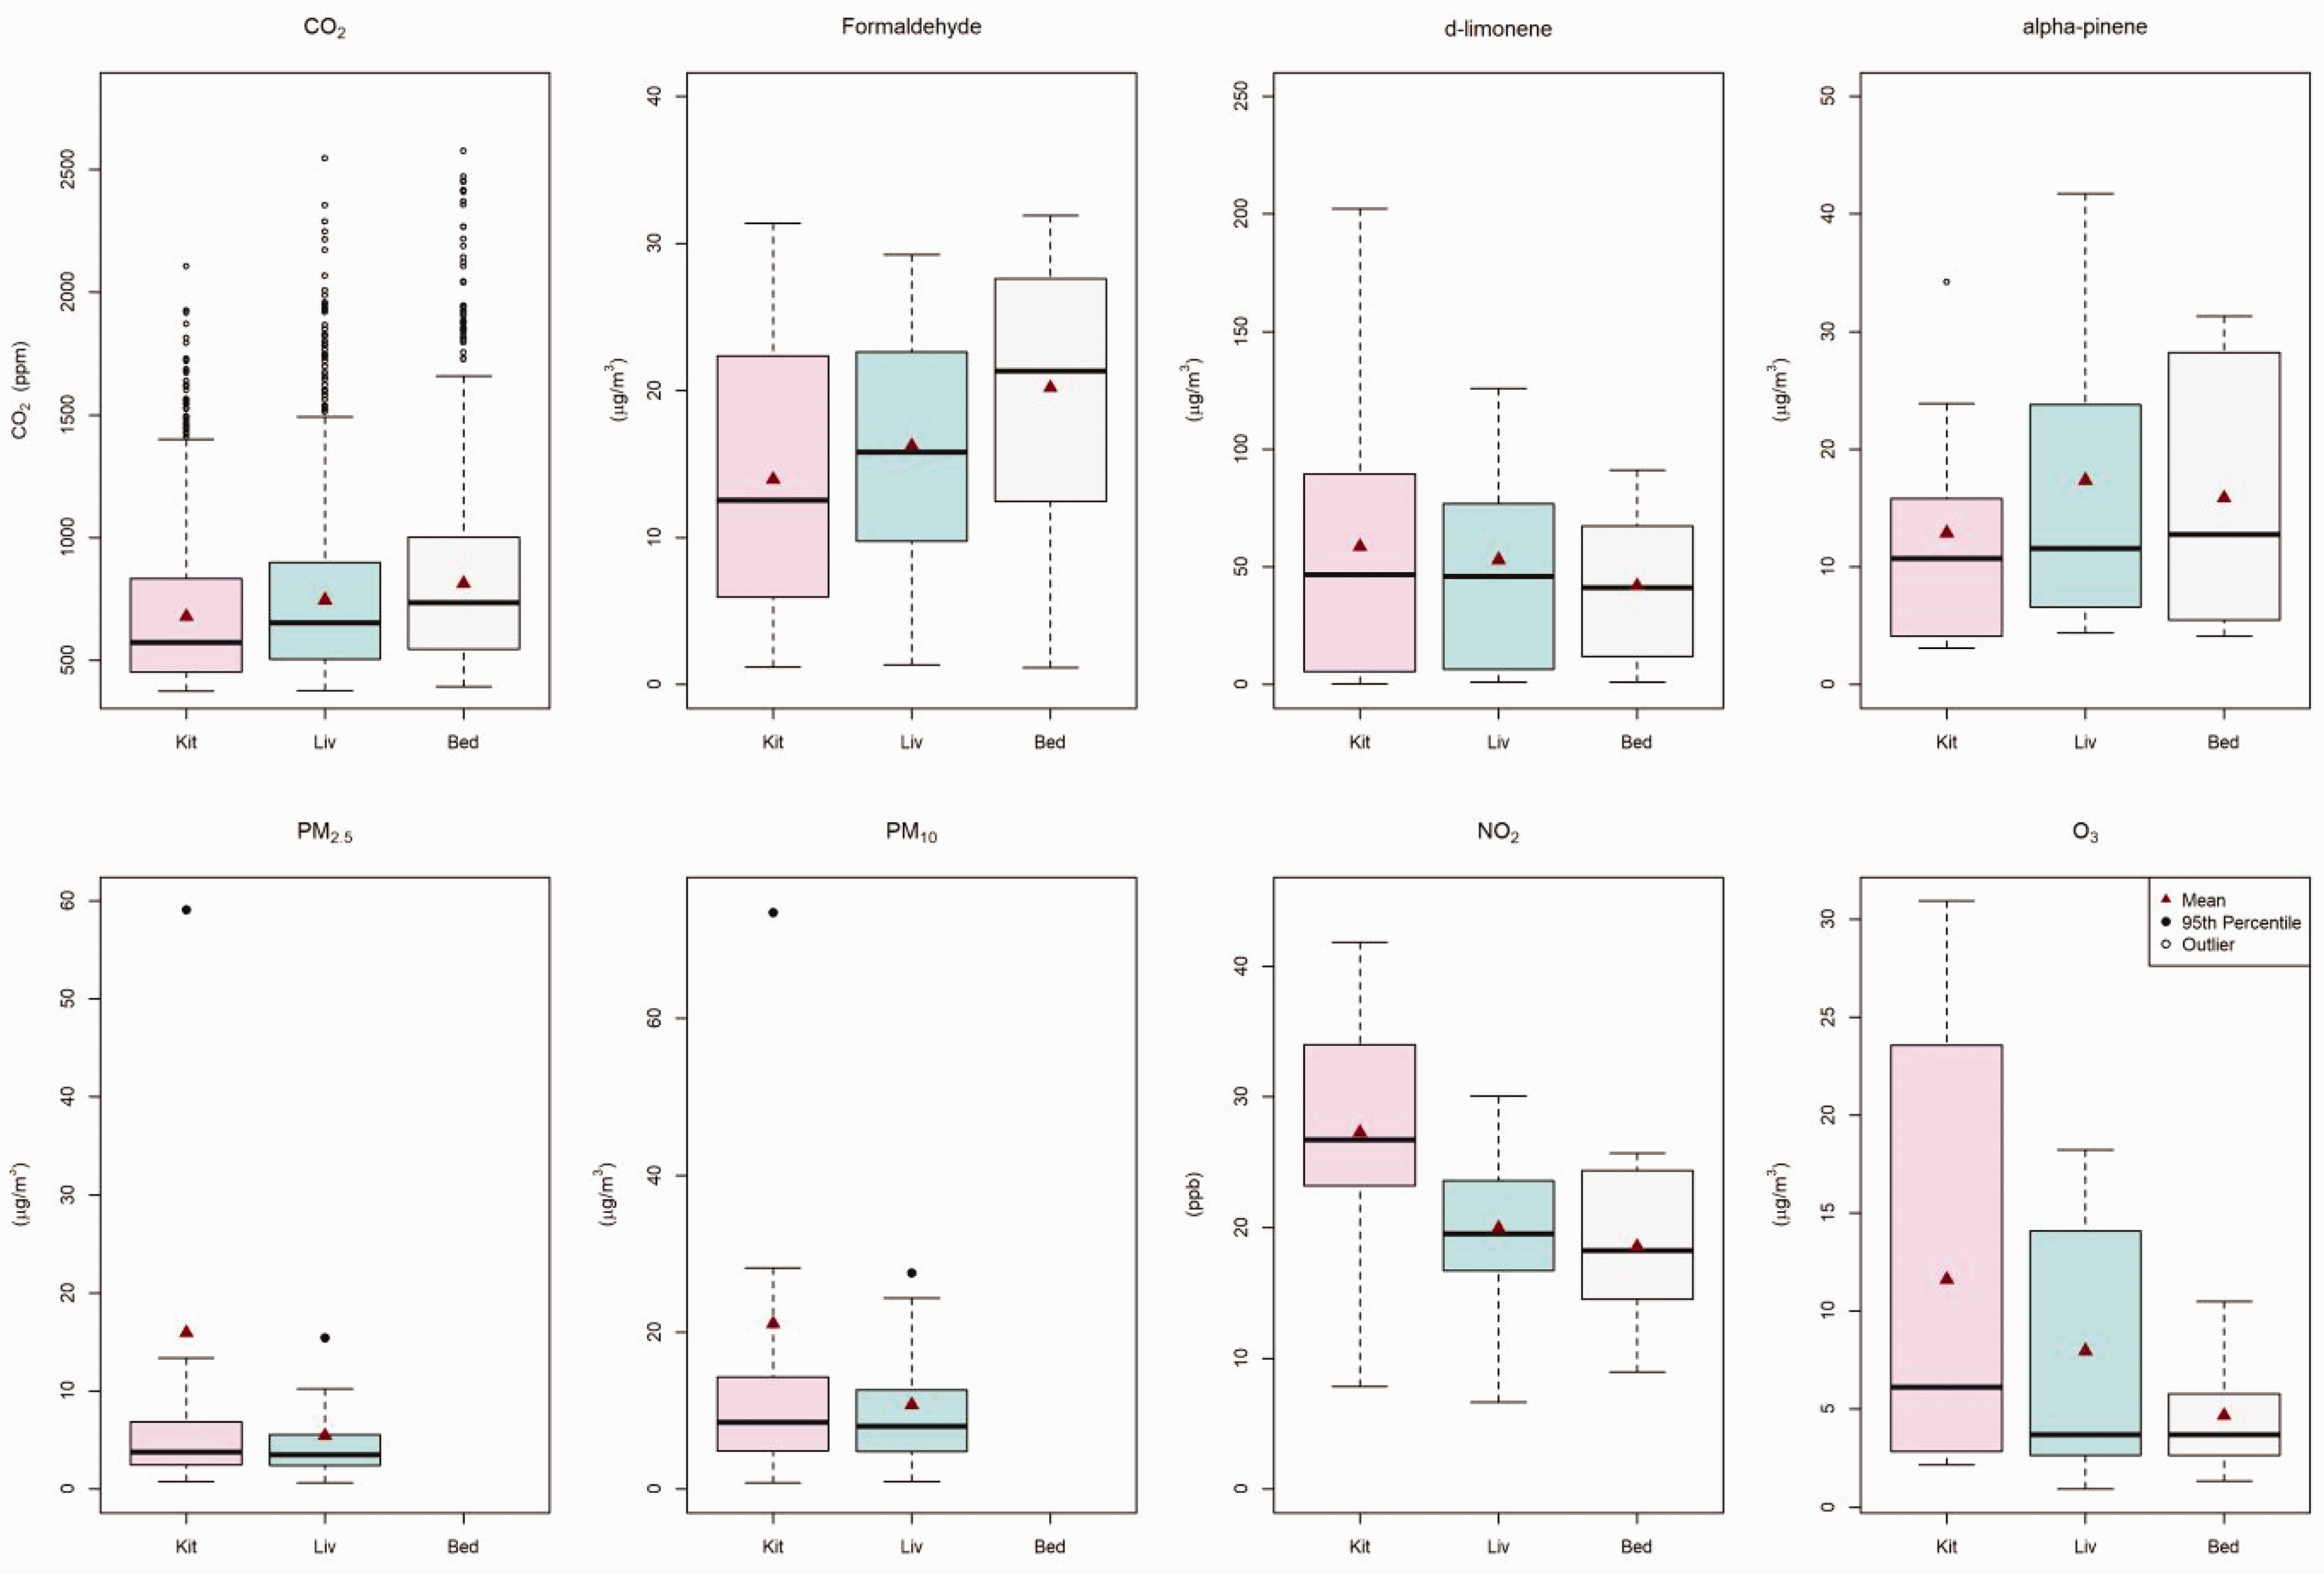
Measured concentrations within different zones for a selected range of pollutants.
Spatial differences between ambient monitoring sites can be defined by the coefficient of divergence (COD), where COD > 0.2 is defined as spatially heterogeneous distributions and COD < 0.2 indicates spatially homogeneous pollutants. 64 Such an approach applied to continuously measured parameters provides minimum-mean-maximum CODs for PM2.5 (0.13–0.23–0.58), PM10 (0.23–0.30–0.53), NO2 (0.12–0.22–0.40), CO (0.05–0.15–0.36), TVOC (0.08–0.17–0.36). The indication is that at least several sets of zones may be considered heterogeneous. However, given the measurement uncertainty between two sets of measurements (see supplementary material), this cannot be conclusive.
‘Top 5 VOCs’
From the qualitative analysis of the top five VOCs in each indoor location (n = 30), limonene was identified in the highest number of locations (n = 17), although as seen earlier, this is at levels much lower than the adopted ELV. Further commonly identified VOCs relate to cleaning products (Acetic acid – n = 10), fragrances (Nonanal – 17; Diethyl phthalate – 6; Benzaldehyde – 9) and various solvents (2-chloropropane – 6; 3-methylpentane – 6; Decanal 3 – 10).
Cyclopentane, a highly evaporative gas with chronic and acute health risks, 65 was identified in a number of indoor locations (n = 12). Cyclopentane is used as a blowing agent within the building’s rigid PIR (polyisocyanurate) insulation. Detection of Cyclopentane within outdoor sampling locations on apartment balconies, as well as indoor, would indicate that this was the primary source and may warrant further investigation in subsequent studies. There is then evidence of traffic related pollutants entering inside the case study dwellings, through the presence of Decane (4), m/p-Xylene (2), Ethylbenzene (2) and Methylcyclopentane (2).
These results also inform TVOC measurements. Both Cyclopentane and acetic acid were found frequently within the sample apartments, with both having a strong weighting within TVOC measurements, having response factors of 10 and 28, respectively (see supplementary material). This points to one of the limitations in this aggregated metric overlaying varied and complex weighting factors.
Ventilation rates and indoor–outdoor ratios (I/O)
Long-term monitoring had indicated higher ventilation rates during the non-heating season, with increased window opening being adopted as a strategy to avoid overheating and provide thermal comfort. Perfluorocarbon tracer gas (PFT) measurements taken across short-term monitored periods further reveal significant seasonal differences in measured ventilation rates. Whilst background MVHR provided most of the fresh air within the heating season, significant additional natural ventilation was used in the non-heating season, resulting in the mean household ventilation rate doubling from 0.7 h−1 in the heating season to 1.6 h−1 in the non-heating season, with CO2 concentrations dropping from 972 ppm to 572 ppm accordingly (Table 5).
Air exchange rate (AER) from PFT measurements and mean CO2 levels.
This provision of additional summertime natural ventilation has a significant impact upon the relationship between indoor and outdoor pollutants. Figure 6 shows the range in calculated indoor–outdoor ratio (I/O) across all apartments and measurement locations, again separating out the two different seasons. Across all pollutants, excluding CO2 which is included to indicate differences in ventilation practices, the I/O ratio is significantly higher in the non-heating season than during the heating season. The median I/O ratio increases from the winter to the summer from 0.32 to 0.70 for PM2.5, 0.50 to 1.42 for PM10 and 0.55 to 0.98 for continuously measured NO2 and 0.39 to 0.85 for passively measured NO2. This last results helps explain the unexpectedly higher indoor NO2 levels seen in the summer, with increased ventilation rates increasing the proportion of ambient NO2 entering the indoor environment (Figure 6).
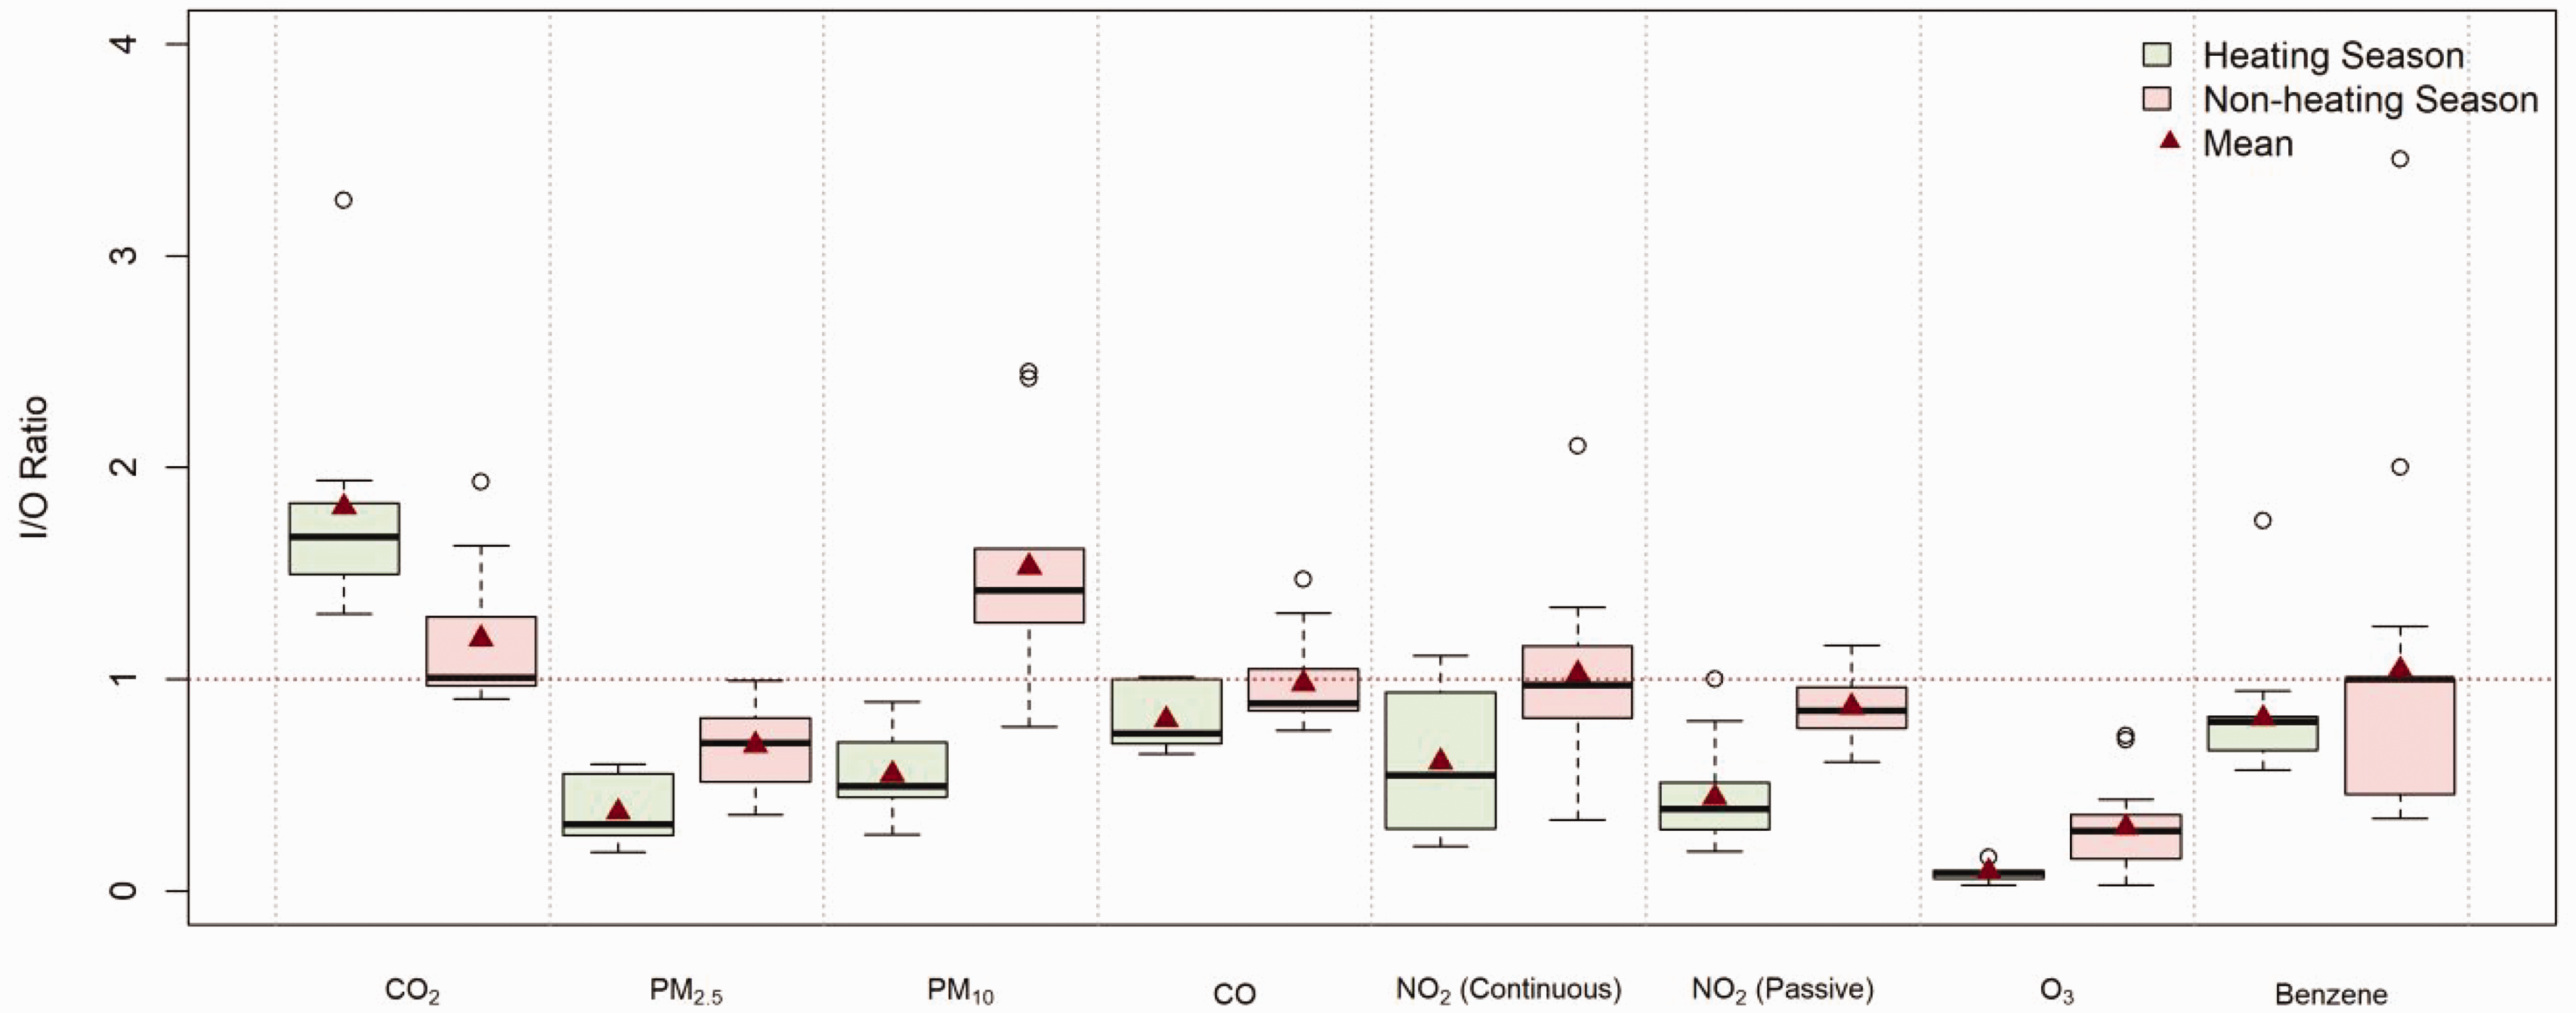
Indoor–outdoor ratios in heating and non-heating seasons.
Significant positive correlations (p <0.01) between indoor concentrations and CO2 concentrations were observed for TVOC (R2 = 0.61), formaldehyde (R2 = 0.46), naphthalene (R2 = 0.39), d-limonene (R2 = 0.45) and alpha-pinene (R2 = 0.37), with lower CO2 and higher ventilation rates leading to lower internal concentrations. These results follow significant association between ACH and formaldehyde also found in Swedish 6 and Canadian dwellings 66 as well as for TVOC in the UK. 19
Conversely, for NO2 a significant inverse relationship was observed, with higher ventilation rates lead to a higher ingress of outdoor pollutants. Therefore, whilst increased ventilation rates act to dilute many internal pollutants, this is somewhat offset by the increased exposure to NO2 from the ambient air. A negative relationship between I/O ratio and CO2 levels was observed for NO2 (R2 = 0.50, p-value <0.01), PM2.5 (R2 = 0.50, p-value <0.01) and PM10 (R2 = 0.58, p-value <0.01), further indicating the relationship between the ingress of external pollutants and ventilation rates.
Combined ELVs
Various approaches have been suggested to provide a combined index for multiple measured pollutants, with Kirchner et al.
54
and more recently Renaud-Salis et al.
67
reviewing and classifying different approaches. Most simply, a simple summation of the mean measured concentration against ELV can be adopted for each measured pollutant, equation (1)68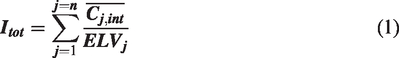
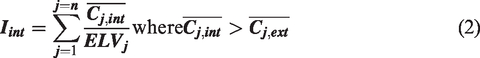
In the QUAD-BB study,
68
measured pollutants were grouped by source type, but here pollutants are grouped into two groups, internal pollutants, Iint (where
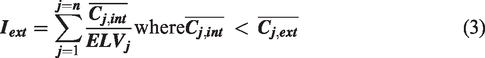
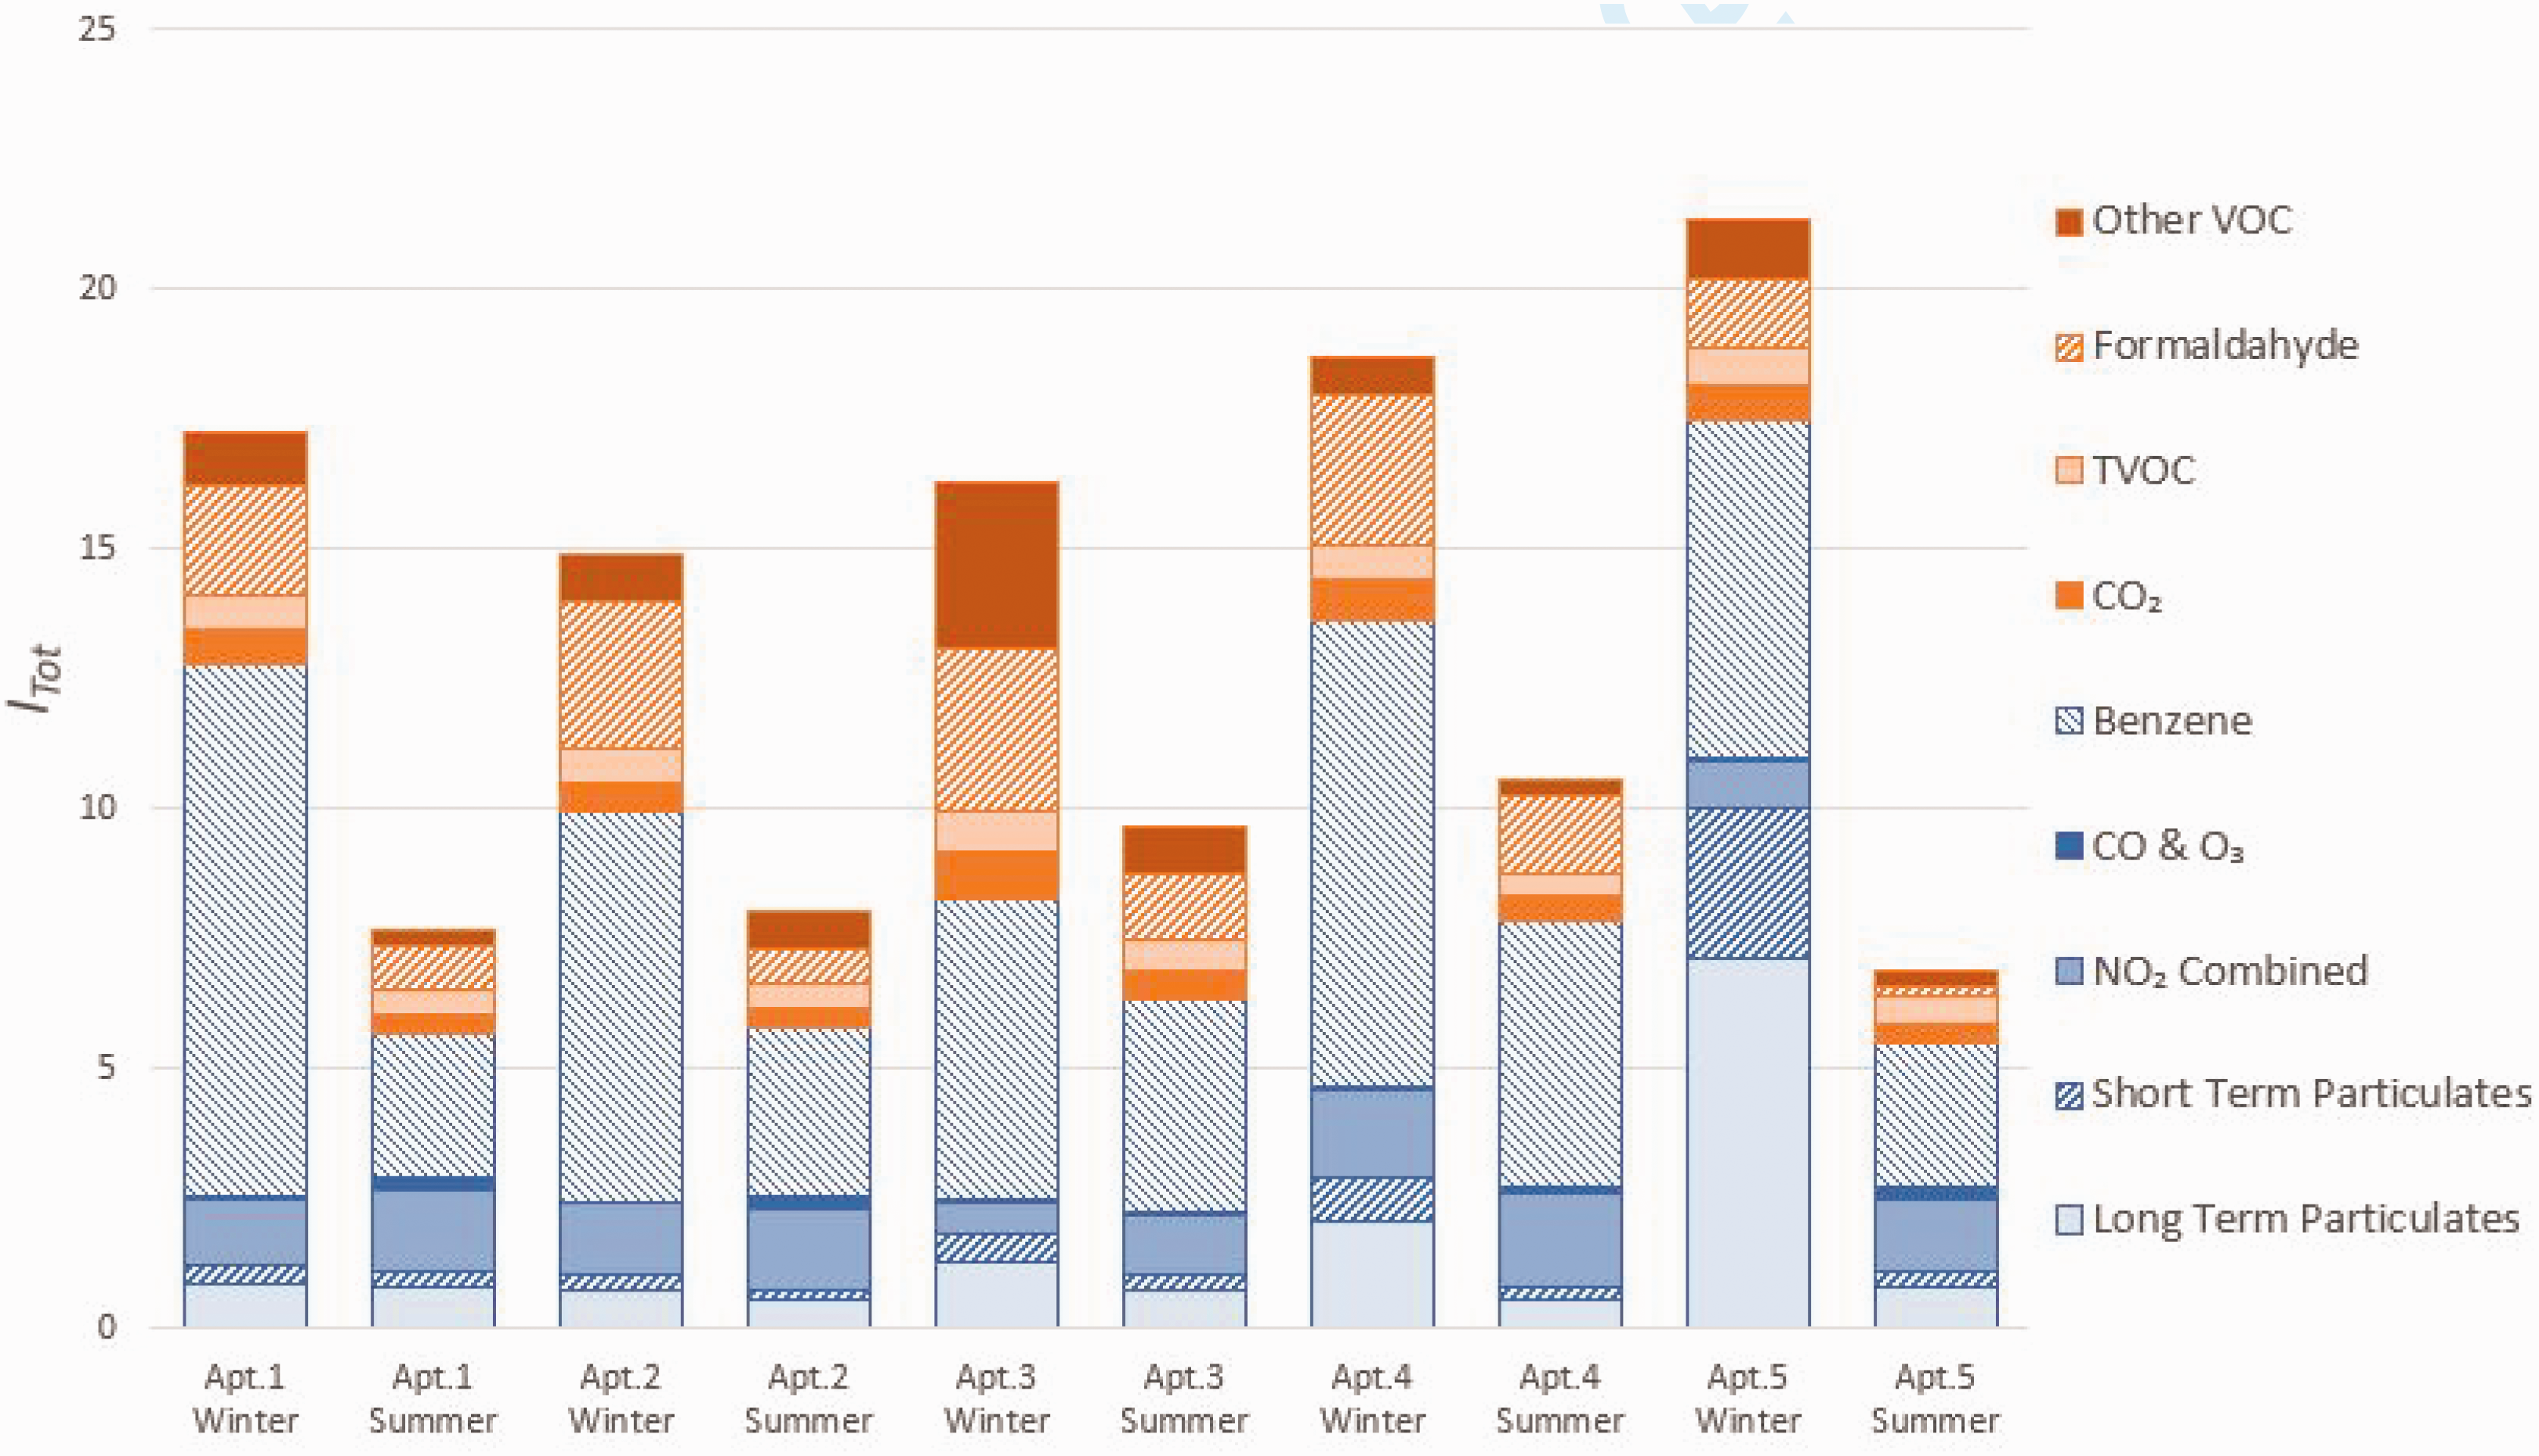
This approach proves useful in further highlighting two patterns already explored in this paper. First, Figure 7 shows Itot and its constituent parts across all apartments and across both seasons. The range between different dwellings is found to vary between Itot = 6.8–10.6 in the non-heating season and from 14.9 to 21.3 in the heating season, indicating differences between apartments, their activities and pollutant sources. However, a much higher seasonal variation within apartments can be seen. The average Itot shows indoor air quality is over twice as bad in the winter (Itot = 17.6) as the summer (Itot = 8.6). This can be accounted for by both the lower ambient concentrations and resulting indoor concentrations in the summer, and by the higher ventilation rates seen in the summer acting to further reduce indoor sources. If Itot is defined only by predominantly indoor sources of pollutants (i.e. excluding NO2, particulates, CO, benzene, ozone), the resultant Iint indicates a correlation with CO2 levels and therefore expected ventilation rates (Figure 8).
Combined Itot for all apartments across both seasons.
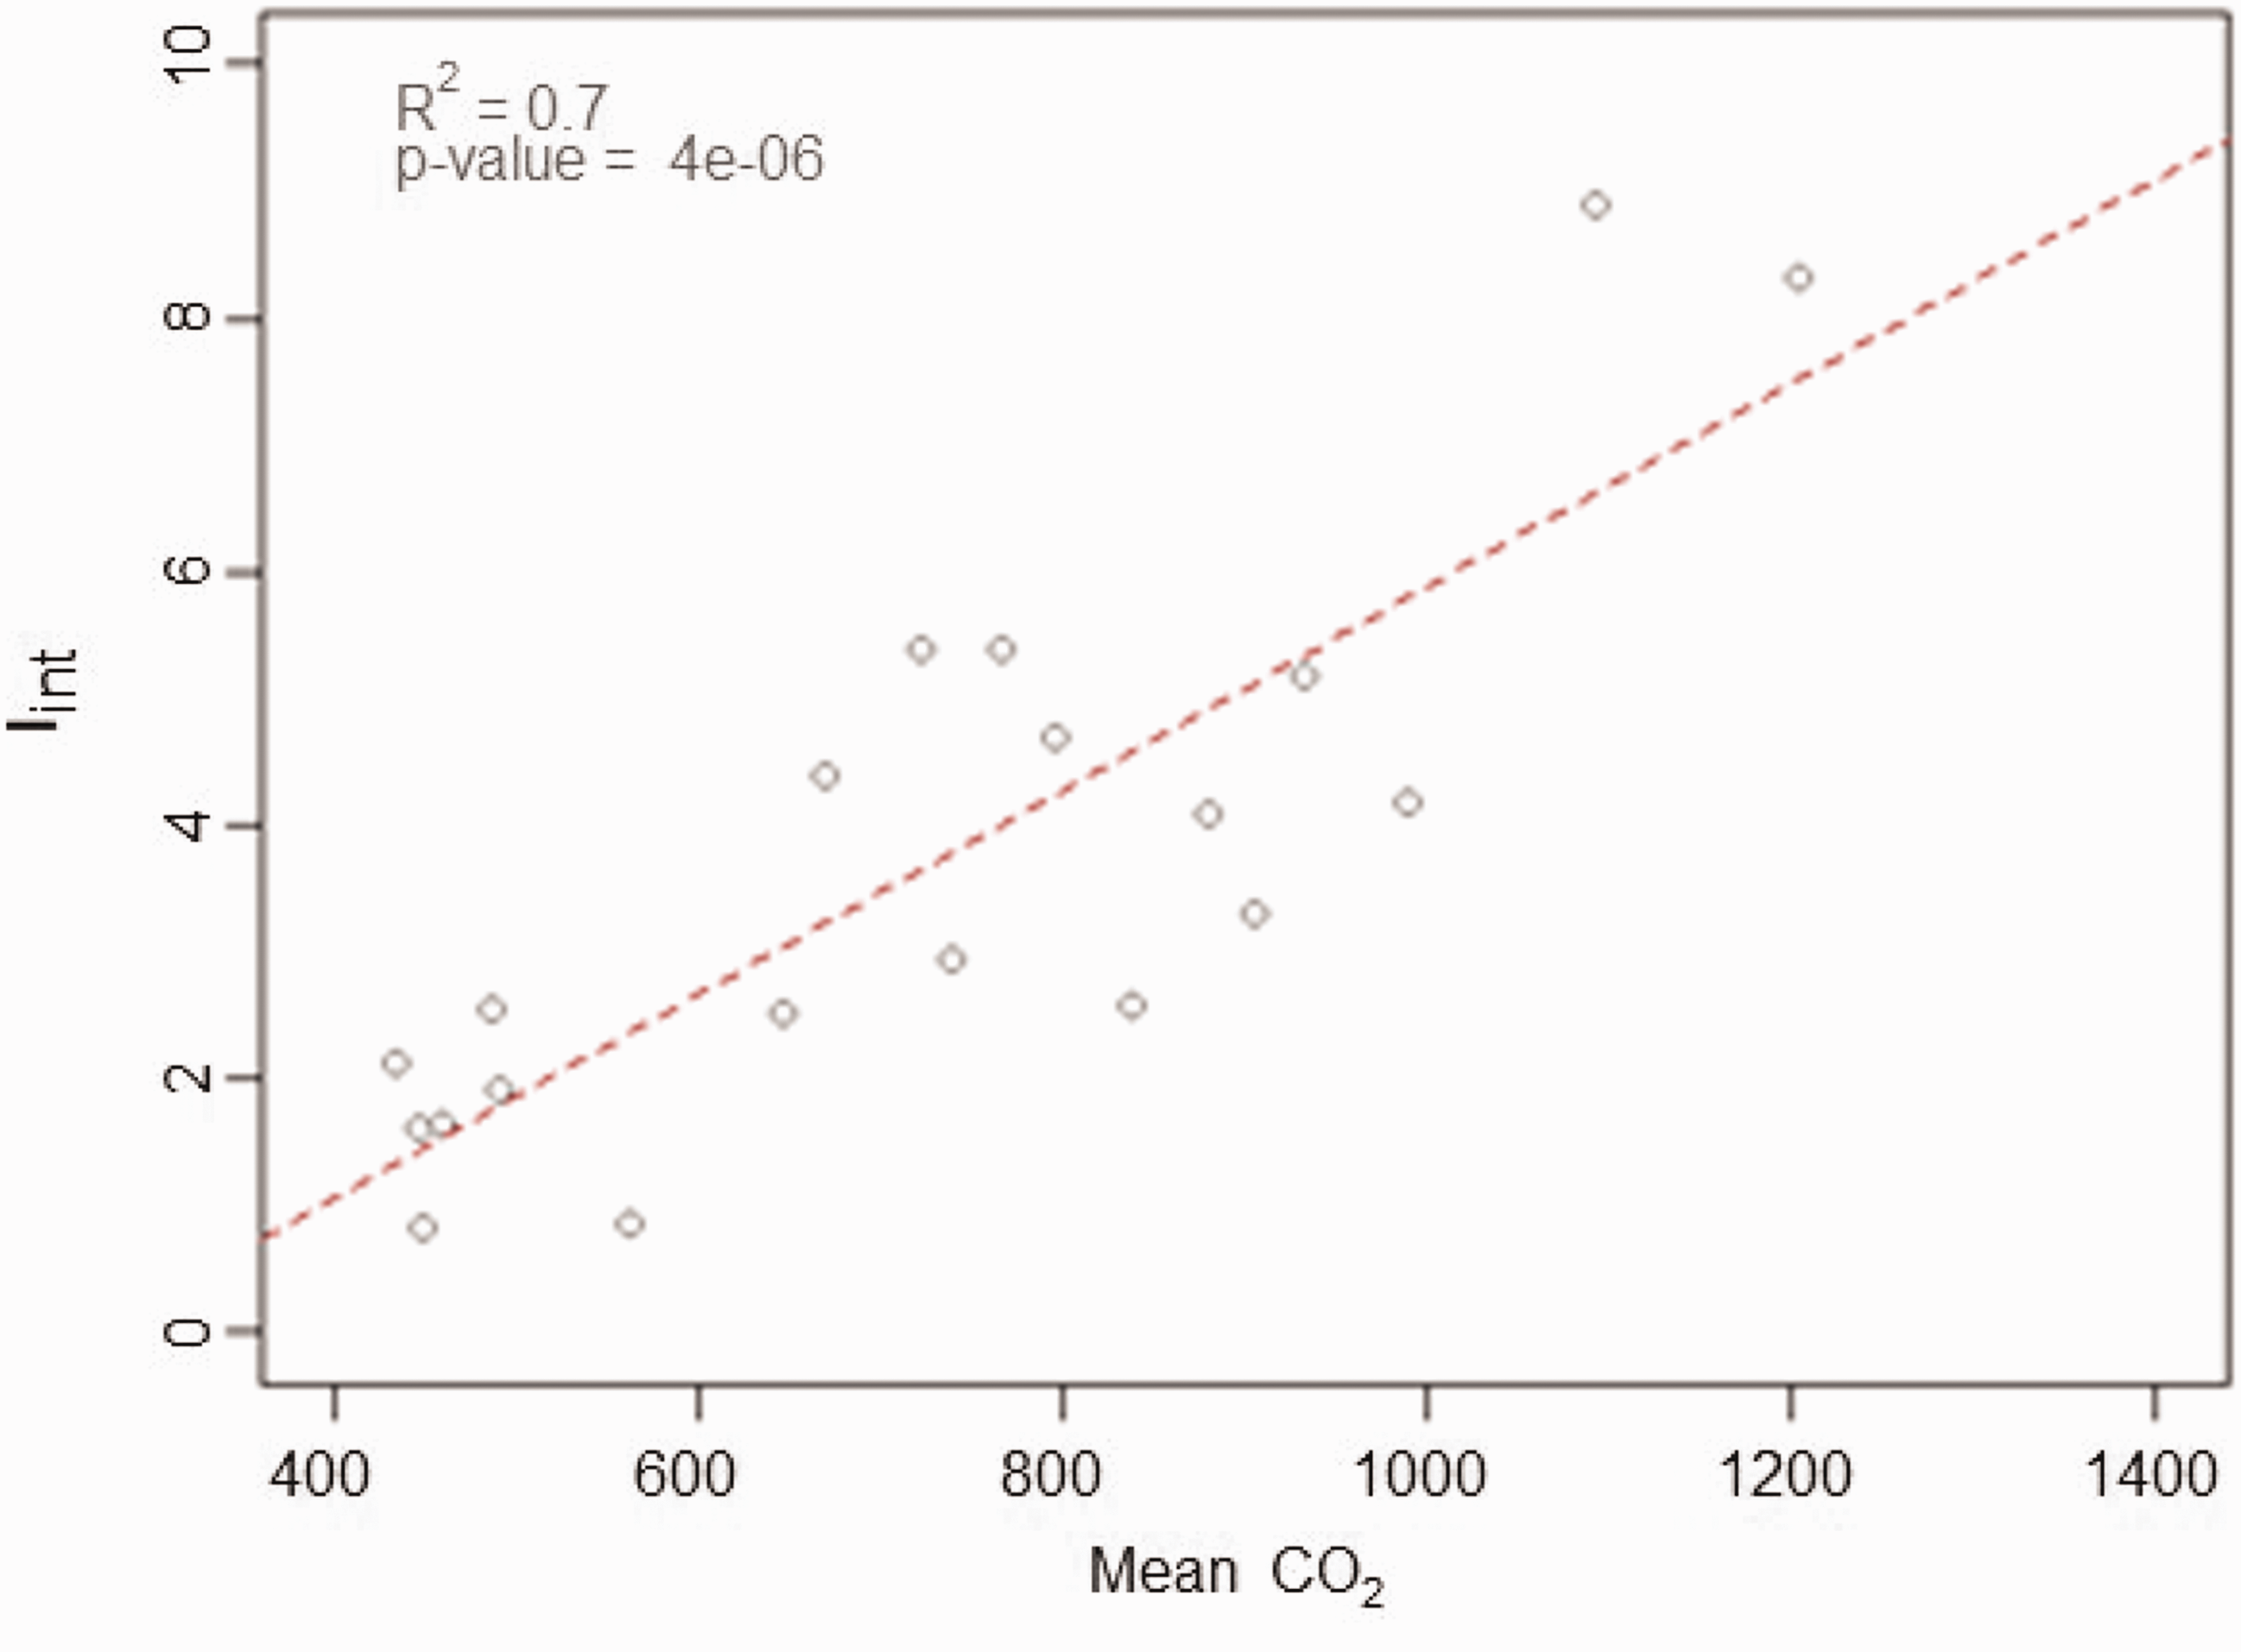
Combined total indoor air quality metric, Iint vs. mean CO2 concentration, for all zones.
Conclusion
Indoor air quality measurements, incorporating both diffusive sampling and continuous measurements, have been conducted in five East London low-energy apartments. Along with 12-months basic environmental monitoring, measurements of a total of 16 targeted pollutants were made for between two and two weeks, covering both the heating and non-heating seasons. Key findings of the study indicate: Of the 16 measured pollutants, the majority of measurements were recorded below best practice guideline ELVs. However, levels of benzene, formaldehyde, NO2 and a small number of cases PM2.5 exceeded these guidelines values. Strong seasonal differences in ventilation practices were seen, with increased natural ventilation doubling the average ventilation rate from 0.7 h−1 in the heating season to 1.6 h−1 in the summer. Similar seasonal effects were observed in indoor CO2 concentrations. Indoor concentrations of formaldehyde, naphthalene, TVOC, alpha-pinene and overall indoor ELVs, Iint, were all observed to correlate positively with indoor CO2 concentrations, indicating the benefit of increased ventilation rates. As a result, mean formaldehyde concentrations halved from 22.8µg/m3 in the winter to 10.8 µg/m3 in summer. Conversely, indoor NO2 concentrations were found to be higher in the non-heating period, where indoor concentrations were between 4 and 8 ppb higher than in the heating season, despite ambient concentrations reducing by 16 ppb. Additionally, median I/O ratios increased between heating and non-heating seasons for other pollutants, including: PM2.5 (0.32 to 0.70), PM10 (0.50 to 1.42) as well as for NO2 measured both continuously (0.55 to 0.98) and via passive measurements (0.39 to 0.85) Overall, a
Practically, the study points at the need for improved MVHR filtration for dwellings in polluted urban environments. This should include improved filtration of fine particulates and further consider measures to reduce or control NO2. Results here would additionally indicate that at present modern dwellings will struggle to achieve best practice guidelines for formaldehyde. As increased ventilation rates, which lowered formaldehyde concentrations, increased outdoor penetration of NO2, source control of formaldyde and other indoor pollutants remain a key strategy. Equally, given the impact of window opening behaviour seen here, strategies for maintaining for summertime thermal comfort without introducing higher proportions of ambient pollution need to be adopted. . Finally, the integration between low-energy, IEQ and air quality objectives must be more holistically considered, potentially with mechanisms to better inform occupants of the impact of their actions upon IAQ.
Supplemental Material
sj-pdf-1-ibe-10.1177_1420326X211017175 - Supplemental material for Seasonal variations and the influence of ventilation rates on IAQ: A case study of five low-energy London apartments
Supplemental material, sj-pdf-1-ibe-10.1177_1420326X211017175 for Seasonal variations and the influence of ventilation rates on IAQ: A case study of five low-energy London apartments by Samuel Stamp, Esfand Burman, Clive Shrubsole, Lia Chatzidiakou, Dejan Mumovic and Mike Davies in Indoor and Built Environment
Footnotes
Acknowledgements
We wish to acknowledge the many participating industry partners, without whom the project would not be possible.
Authors’ contribution
DM and MD conceived of the research project and design. EB, CS and SS contributed with the data collection and fieldwork in the case study buildings. LC and SS contributed with the sensor performance and sensor data. SS led on the article drafts and analysis, with all authors critically reviewing and providing input to the paper structure, text and analysis. All authors contributed greatly to the creation of this paper.
Declaration of conflicting interests
The author(s) declared no potential conflicts of interest with respect to the research, authorship, and/or publication of this article.
Funding
The authors disclosed receipt of the following financial support for the research, authorship, and/or publication of this article: The authors gratefully acknowledge the financial support from ‘The “Total Performance” of Low Carbon Buildings in China and the UK’ (‘TOP’) project funded by the UK EPSRC (grant number EP/N009703/1). We would like to acknowledge Dr Mikael Bjorling of Pentiaq for supporting the PFT measurements.
References
Supplementary Material
Please find the following supplemental material available below.
For Open Access articles published under a Creative Commons License, all supplemental material carries the same license as the article it is associated with.
For non-Open Access articles published, all supplemental material carries a non-exclusive license, and permission requests for re-use of supplemental material or any part of supplemental material shall be sent directly to the copyright owner as specified in the copyright notice associated with the article.