
Abstract
The hybrid philosophy behind the mixed-mode (MM) strategy aims at achieving energy-efficient buildings and sustainable development. A performance-based open-plan office design facilitates the handling of multiple design parameters to identify optimal design solutions for effective MM offices. This research presents a method of open-plan office design for an improved natural ventilation potential and reduced supplementary heating/cooling loads in the early design stage within a Mediterranean climate. Different design variables including office size, layout aspect ratio, window orientation and fraction of window opening, with several factor levels, were studied. The design of experiment developed by the Taguchi method was applied to define the most informative simulation scenarios. Analysis of variance was utilised to indicate the effectiveness of each design parameter, while the signal-to-noise ratio approach identified the near-optimal level combinations that support informed decision-making. Suggested by the EN 15251:2007 standard, the hourly dynamic simulations were conducted using TAS Engineering. The measurement criteria included airflow rate, carbon dioxide (CO2) levels, adaptive thermal comfort and air-conditioning (AC) loads. The calculated indicator was the number of hours in which a specific performance criterion is met during the occupancy period and the AC loads.
Keywords
Introduction
ISO 3382-3:2012 1 defines open-plan offices as ‘offices and similar spaces in which a large number of people can work, have a conversation, or concentrate independently in well-defined work stations’. The open-plan office space is a modern design concept used to facilitate teamwork, creativity and innovation. Open-plan offices are highly recommended by many technology innovators as a method to promote collaborative behaviours and improve employees’ collective intelligence. The environmental perception of office employees is imminently important and differs according to the office type. Danielsson and Bodin 2 distinguish between several types of offices, including the ‘cellular’ and various ‘open-plan’ offices. Based on their size and accommodating capacity, open layout offices can be divided into small (4–9 people), medium (10–24 people) and large (more than 24 people) offices. 2 Despite continuous discussions on open-plan offices, specifically whether they boost collaboration and productivity or negatively affect employees’ satisfaction level, this mode of office space design has been trending over the past decades.3–8
Indoor air quality (IAQ) and thermal comfort (TC) are major aspects of indoor environmental quality (IEQ) that directly affect office occupants’ health, comfort and productivity.9–11 In the previous century, mechanical systems provided acceptable TC and healthy indoor conditions for office users, resulting in large amounts of energy usage and carbon dioxide (CO2) generation. Global warming’s severity and the United Nation’s sustainability goals necessitate a reduction in energy consumption and foster the use of passive strategies, such as natural ventilation (NV) and solar architecture. As a response to this urgent need, a combination of NV and a supplementary mechanical air-conditioning (AC) has been proposed, called mixed-mode (MM) cooling (or hybrid ventilation). 12 MM refers to a hybrid strategy for space conditioning that employs NV through openable windows or passive vents (either manually or automatically controlled), as well as utilise the advantages of mechanical AC to satisfy indoor TC requirements when NV is insufficient.13–16
The hybrid philosophy behind MM buildings aims at maximising the energy saving opportunity in buildings. In this system, NV performs the dual function of ventilation and space cooling, aimed at simultaneously preserving the indoor air and TC qualities. The mechanism of NV performs on the basis of the pressure or thermal differences between openings, or between the outside and inside, 17 while thermostat setpoints for cooling and heating define and control the working range of mechanical AC. The MM strategy is characterised by low energy consumption, low running costs, accurate temperature control and improved TC.13,14,18,19 Furthermore, the MM system is used for both ventilation (natural and mechanical ventilation) and cooling (natural ventilation and air-conditioning) strategies. This study investigates the potential of NV, and consequently, only implements the MM cooling strategy with NV to supply fresh air.
Previous studies addressed open-plan offices primarily from sociological and psychosocial perspectives,2–8 with a few of them dealing with the indoor environmental performance.9,20–23 Nevertheless, IEQ aspects affect open-plan office employees’ health, comfort and productivity. 9 The design of the open-plan office is an early design task; hence, a method of assessing the effects of multiple design parameters on predetermined performance objectives and determining optimal factor level combinations can enhance informed decision-making. This study presents a performance-based approach to open-plan office design for improved NV performance – concerning indoor air and thermal conditions – and reduced AC loads within a MM strategy. In this research, the application of the method was limited to a Mediterranean climatic condition; nevertheless, it can be applied in other contexts with different climatic conditions. Several design variables and their levels were investigated involving office size, layout aspect ratio, window orientation, window opening.
Mixed-mode conditioning and open-plan office performance
Measuring the level of indoor CO2 concentration has been widely employed when assessing ventilation and indoor air performance.10,24–26 The World Health Organisation (WHO) 27 suggests a threshold of 1000 ppm as the acceptability limit of indoor CO2 contaminant concentration. Similarly, the European Standard EN 15251:200728 defines four categories for different expectations assuming 350–450 ppm outdoor CO2 level. Long-term exposure to high CO2 levels results in sick building syndrome (SBS) 29 at which point occupants may suffer from headaches and other health problems.
Montgomery et al. 30 argue that a hybrid ventilation system is a better response to IAQ requirements in offices. To assess indoor TC in air-conditioned spaces, the predicted mean vote (PMV) model by Fanger 31 is applied, which is based on the steady state heat balance of the human body. Field studies have proven the appropriateness of the adaptive comfort model for naturally ventilated spaces,32–35 which accounts for human adaptation mechanism in response to the prevailing outdoor temperatures. Regardless, the descriptions of current standards (i.e. the European standard EN 15251:200728 and American standard ASHRAE 55–201736) still categorise MM buildings under the air-conditioned group, in which system operation is restricted to the steady state PMV range of indoor thermal sensations.12,37 MM buildings, in which both NV and AC modes are utilised to maximise energy efficiency, are much more complicated. Based on the specific weather condition, NV can be in operation most of the time, while AC works as a supplementary strategy during drastic outdoor environmental conditions.37,38 Recent field studies claim that the adaptive comfort model can be applied when evaluating indoor TC in MM buildings when NV mode is in operation,13,37,39,40 with evidence of good correlations observed between Fanger’s model and subjective thermal sensations in AC mode. 12
Chinese researchers 9 investigated work productivity in university open-plan research offices in terms of several aspects of IEQ. The results confirm a positive correlation of these aspects to office employees’ levels of satisfaction and productivity. One study 11 proposed a method of automated control of the indoor environment for energy and comfort management. The authors claim that energy costs and occupants’ work productivity can be optimised by considering occupants’ thermal preferences and IAQ. In addition, the building envelope has a greater effect on indoor thermal environment in naturally ventilated buildings (including MM buildings), particularly windows.10,41,42
Findings of a field study, conducted by Rowe 38 in an academic office building, showed that occupants could adapt to a range of temperatures using different adaptation mechanisms and passive means. However, when they had access to auxiliary cooling and heating, they typically preserved the indoor temperature between 20°C and 27°C, occasionally preferring 29°C. Another longitudinal field study 37 examined the potential of adaptive TC in MM subtropical offices and found that the adaptive comfort model is more accurate in NV mode and applicable in AC mode. A similar study 39 of MM buildings confirmed that the PMV model was inadequate for assessing TC conditions in such buildings. Deuble and de Dear 12 argue that subjective thermal perceptions are influenced by the mode in operation, and the steady state TC model is inadequate to describe the objective thermal perceptions in MM academic office buildings. Therefore, the authors define MM buildings as ‘NV, with operable windows and supplementary cooling/heating during peak periods’. 12
A comparative parametric study 18 of NV, AC and MM in hot–humid climates suggested that an adequate amount of NV (20 ACH, air changes per hour) offers 45% and 69% availability ratios of ventilative cooling (VC) for hot–humid and very hot–humid climates, respectively. The study’s findings showed that using only NV conditioning, the overheating frequency exceeds the threshold of 5% suggested in the EN 15251 standard, while the MM conditioning eliminated the risk of overheating and reduced cooling energy demand by 5%–6% compared to fully air-conditioned strategy. Energy consumption of an MM system is estimated to require less than a quarter compared to the situation when the same space is fully air-conditioned. 43 Therefore, MM conditioning can be a far more energy-efficient strategy than fully AC with a novel selection of design parameters. A numerical and experimental study 16 of local TC in an open-plan office with an automatically controlled NV system revealed a risk of local thermal dissatisfaction under low outdoor temperature and extreme airflows.
The operation of windows in open-plan offices can be more complex than in a cell-office due to the accommodation of a larger number of people with diverse thermal sensitivities. 20 Research shows that the probability of a window being opened is very high when the outdoor air temperature is between 22°C and 30°C, while windows are hardly opened when it exceeds 34°C. 20 Researchers 13 studied TC in MM and fully-air conditioned office buildings in a hot and humid climate. The authors claimed that occupants made inappropriate use of the AC when they had full environmental control over selecting modes, which in return could negatively affect their thermal sensation. Another finding was that both MM and AC showed similar results in which thermal discomfort did not exceed 20% in any of the modes. Finally, due to its greater possibility of air movement, the MM case provided a higher level of TC and user satisfaction; such results were also reported by similar studies.44,45 Dhalluin and Limam 46 state that the automated window opening system is an efficient solution for MM conditioning. The results of a study 47 confirmed that AC usage was significantly influenced by the AC managerial scheme in hybrid-conditioned classrooms, in which the mean operative temperature under central management was 2.9°C less than the value recorded in user management.
The literature survey evidences the lack of institutional knowledge on the part of building users concerning window operation and building management in naturally ventilated buildings, which is described as the gap of sociotechnical agenda in buildings. 48 In this study, the NV strategy was implemented through an automated window opening and controlled AC scheme within a designed MM system, in accordance with the recommendations of previous studies and relative standards. Moreover, mechanical ventilation was not utilised as a part of the MM system; however, for reference, in the Eastern Mediterranean region, mechanical ventilation can increase energy demand by about 20%. 45
Methodology
Methods, measurements and indicators
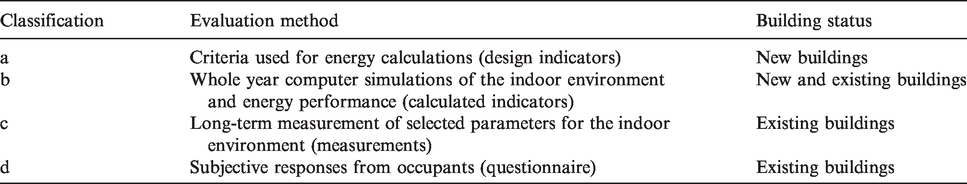
The EN15251:2007 standard 28 in Annex I classifies the indoor environmental assessments by building status, as outlined in Table 1. This study addresses the early design of open-plan offices in a Mediterranean climate by examining the effect of different architectural design parameters on the indoor environment and energy performance of a MM strategy; therefore, in light of the method classification as stipulated by the EN15251:2007 standard, a year-round hourly dynamic computer simulations method was performed. Due to the nature of this research, field studies (e.g. measurements and subjective perceptions) were not used, owing to difficulties in finding multiple existing open-plan offices with different architectural design parameters sharing the same floor areas, ceiling heights, envelope characteristics and building orientations in the same study location. Furthermore, one objective of this study is to guide early design decision-making and apply building performance simulations from the very beginning of the design process as a performance-based design approach.
Classification of methods used in the indoor environmental assessment in the EN 15251:2007 standard. 28
The evaluation of an open-plan office design in the Mediterranean region was based on the MM system’s performance in the climatic conditions of Famagusta, North Cyprus, while the method can be applied in other weather conditions also. Field studies manifest that the adaptive TC model can accurately describe occupants’ thermal sensations in MM buildings, particularly during NV hours. Accordingly, this study evaluates the open-plan office design in terms of its VC potential for indoor thermal and air performance, and the amount of supplementary heating/cooling loads required to maintain the indoor environment when NV is not sufficient due to extreme weather conditions.
According to the EN 15251:2007 standard, 28 the calculated indicators of indoor environment method include different indicators, namely: the (1) simple indicator, (2) hourly criteria, (3) degree hours criteria and (4) overall TC criteria (weighted PMV criteria). In this study, the hourly criteria indicator was implemented, for which building performance can be evaluated by calculating the number of hours (h) and/or percentage of time (%) when the criteria is met or not.
Nevertheless, the ventilative cooling method49,50 was used – as an ‘objective validation technique’ of the mathematical procedure 51 – to validate dynamic simulations of indoor environment calculations on an hourly basis.
Taguchi design of experiments and ANOVA approach
The design of experiment (DOE) often involves a large number of factors or design variables; consequently, a full factorial design (FFD) requires a significant number of experiments. One way to reduce the number of experiments to a practical level, without compromising the results of all possibilities, is using the Taguchi method
52
of standard orthogonal arrays. As a partial fraction experiment, the method selects a small set of design scenarios representing all the possibilities and producing the most sensitive information. This special set of arrays is known as orthogonal arrays that specify the manner of conducting the minimal number of experiments based on the degree of freedom (DF) approach, which is calculated by equation (1)
Using this standard method, the DOEs are generated based on judgmental sampling aimed at reducing time, cost and resources, while studying whole process parameters with only minimum balanced experiments.
The study investigated three different sizes of open-plan offices with three possible layout proportions (the aspect ratio). In reference to the open-plan office classification by Danielsson and Bodin, 2 the hypothetical scenarios were a small, medium and large size open-plan office with floor areas of 50.0 m2, 100.0 m2 and 250.0 m2. Considering 10 m2 per person as recommended by the relevant standards and guidelines,53,54 the studied offices accommodate 5, 10 and 25 persons, respectively. A ceiling height of 3 m was fixed in all design scenarios as the standard floor-to-ceiling height specified by local building regulation in North Cyprus. 55 The common office layout aspect ratios can be summarised and assumed as 1:1, 1:1.5 and 1:2. In the study location, the minimum ratio of the window-to-floor area is 10%. 55 However, open-plan offices normally have larger size windows, and cross-ventilation is recommended for such spaces. 56 Therefore, a 20% window-to-floor ratio (WFR) was selected for all scenarios; to achieve cross-ventilation, the specified window area was divided between a pair of windows located on opposite walls. To test the effect of window orientation on NV performance, different window orientations were evaluated. Windows facing prevailing wind directions improve ventilation and cooling capacities of NV strategy. 10 The window aspect ratio was fixed at 1:1 with the windows being placed at the middle of the external walls on the floor level (i.e. ±0.00), as illustrated in Figure 1.
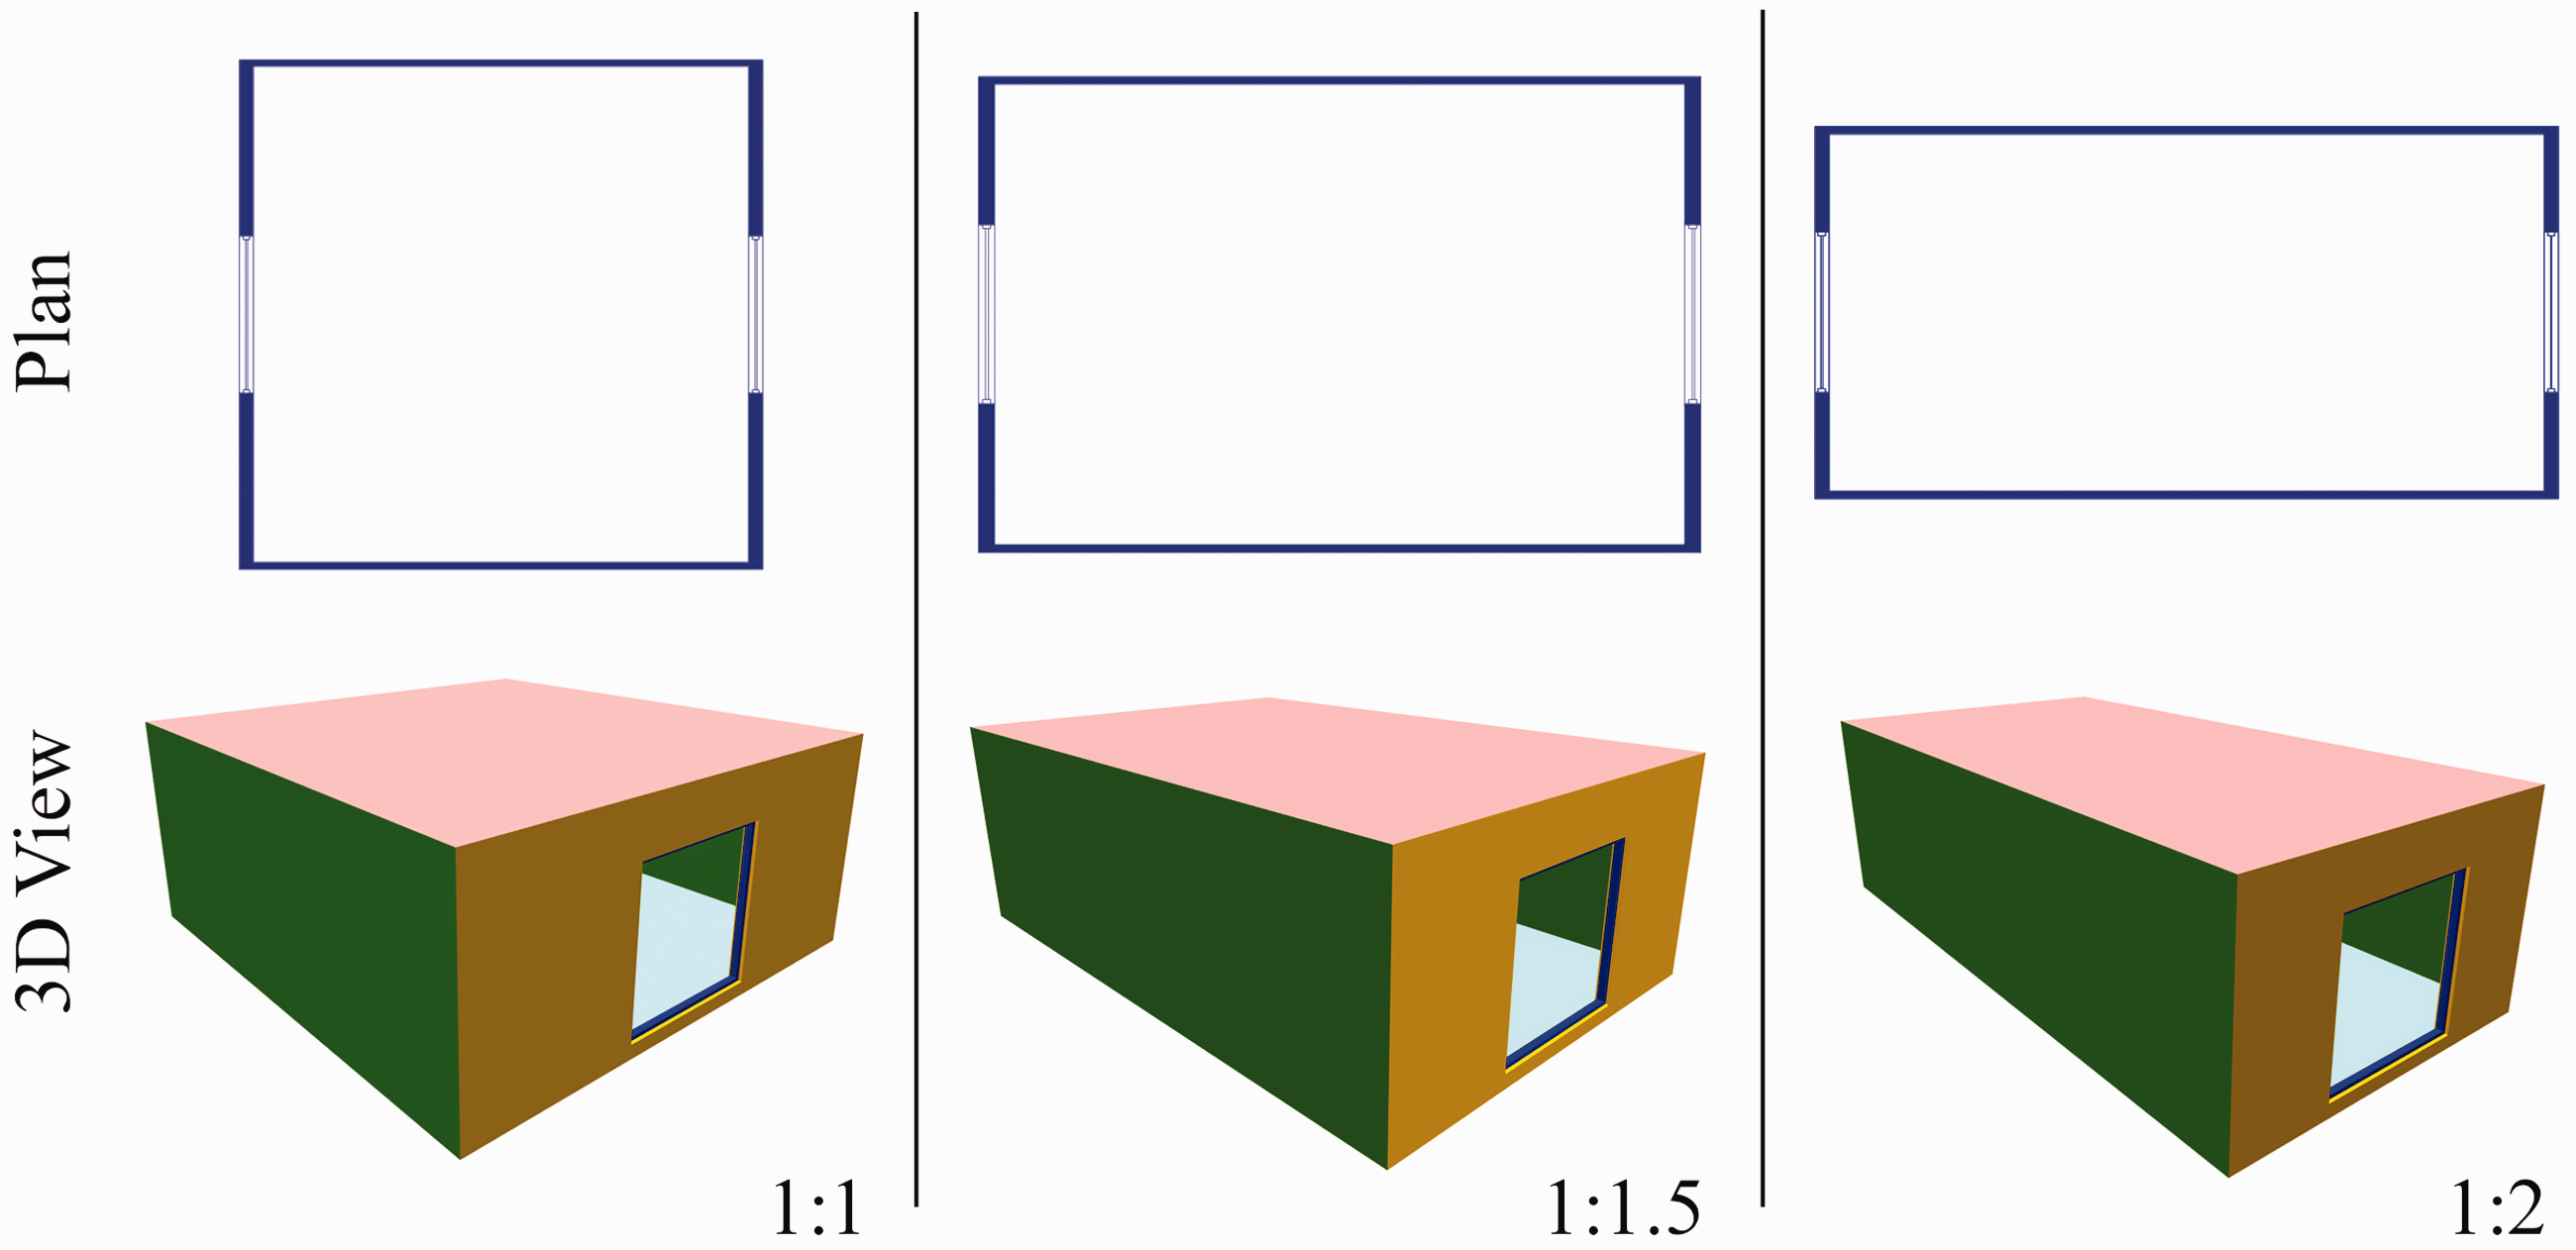
Different open-plan office layout proportions for ‘small’, ‘medium’ and ‘large’ size office.
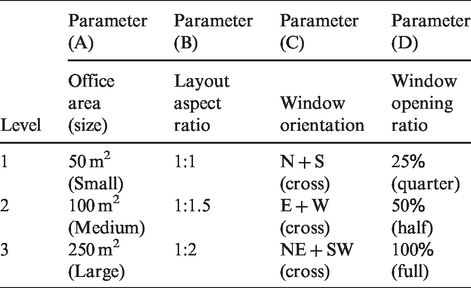
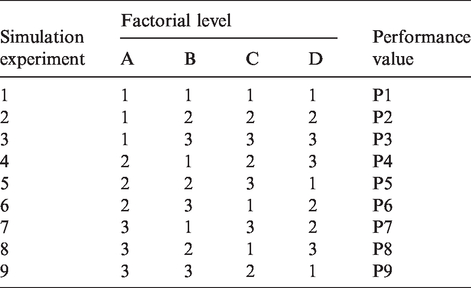
Table 2 outlines the considered design parameters and their levels in this study. In the case of having four design variables with three levels each, the most suitable Taguchi orthogonal array is L9 (34). Accordingly, Table 3 presents the required simulation experiments for providing the necessary information about all the design possibilities, similar to those acquired by an FFD (81 simulation runs).
The studied design variables of open-plan office and their levels.
Simulation scenario design based on a Taguchi L9 (34) standard orthogonal array.
To evaluate the effect of the variables on the intended performance criteria, analysis of variance (ANOVA) was used, including the DF, the sum of squares value (SSV), the total sum of squares (SSTO), the mean sum of squares variable (MSV), the mean sum of square of error (MSE) and factor effectiveness (percentage contribution).
57
The SSV, SSTO, MSV, MSE and percentage contribution were calculated using equations (2) to (6), respectively. Using the signal-to-noise (S/N) ratio, the near-optimal level combinations of the design variables can be identified through a logarithmic transformation of mean square deviation. In this study, the S/N ratio of larger-is-better was used for performance criteria related to NV and the smaller-is-better was employed for AC loads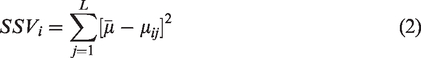


Development of the dynamic simulation model
Climate description and weather data
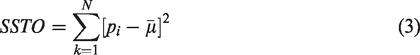
According to the international climate zone classification provided in ASHRAE 90.1–2019, 58 Famagusta (35.1149° N, 33.9192° E) is defined as warm-humid, for which cooling design-days above 10°C are expressed as SI 2500 < CDD10°C < 3500. Additionally, the Köppen–Geiger climate system classifies Famagusta’s weather under the CSA: Mediterranean climate. 59 This climate has dry, hot summers and cold, rainy, rather changeable, winters in which January and July are the coldest and warmest months in the year, respectively. The climatic conditions, namely dry bulb temperature (°C), relative humidity (%), wind speed (m/s), wind direction (°), global solar radiation (w/m2), diffuse solar radiation (w/m2) and cloud cover (0–1), for all the hours of the representative day of January and July are presented in Figure 2. Figure 3 shows wind rose of the study location.
Climatic conditions of Famagusta on (a) 21 January and (b) 21 July generated from the weather file data.
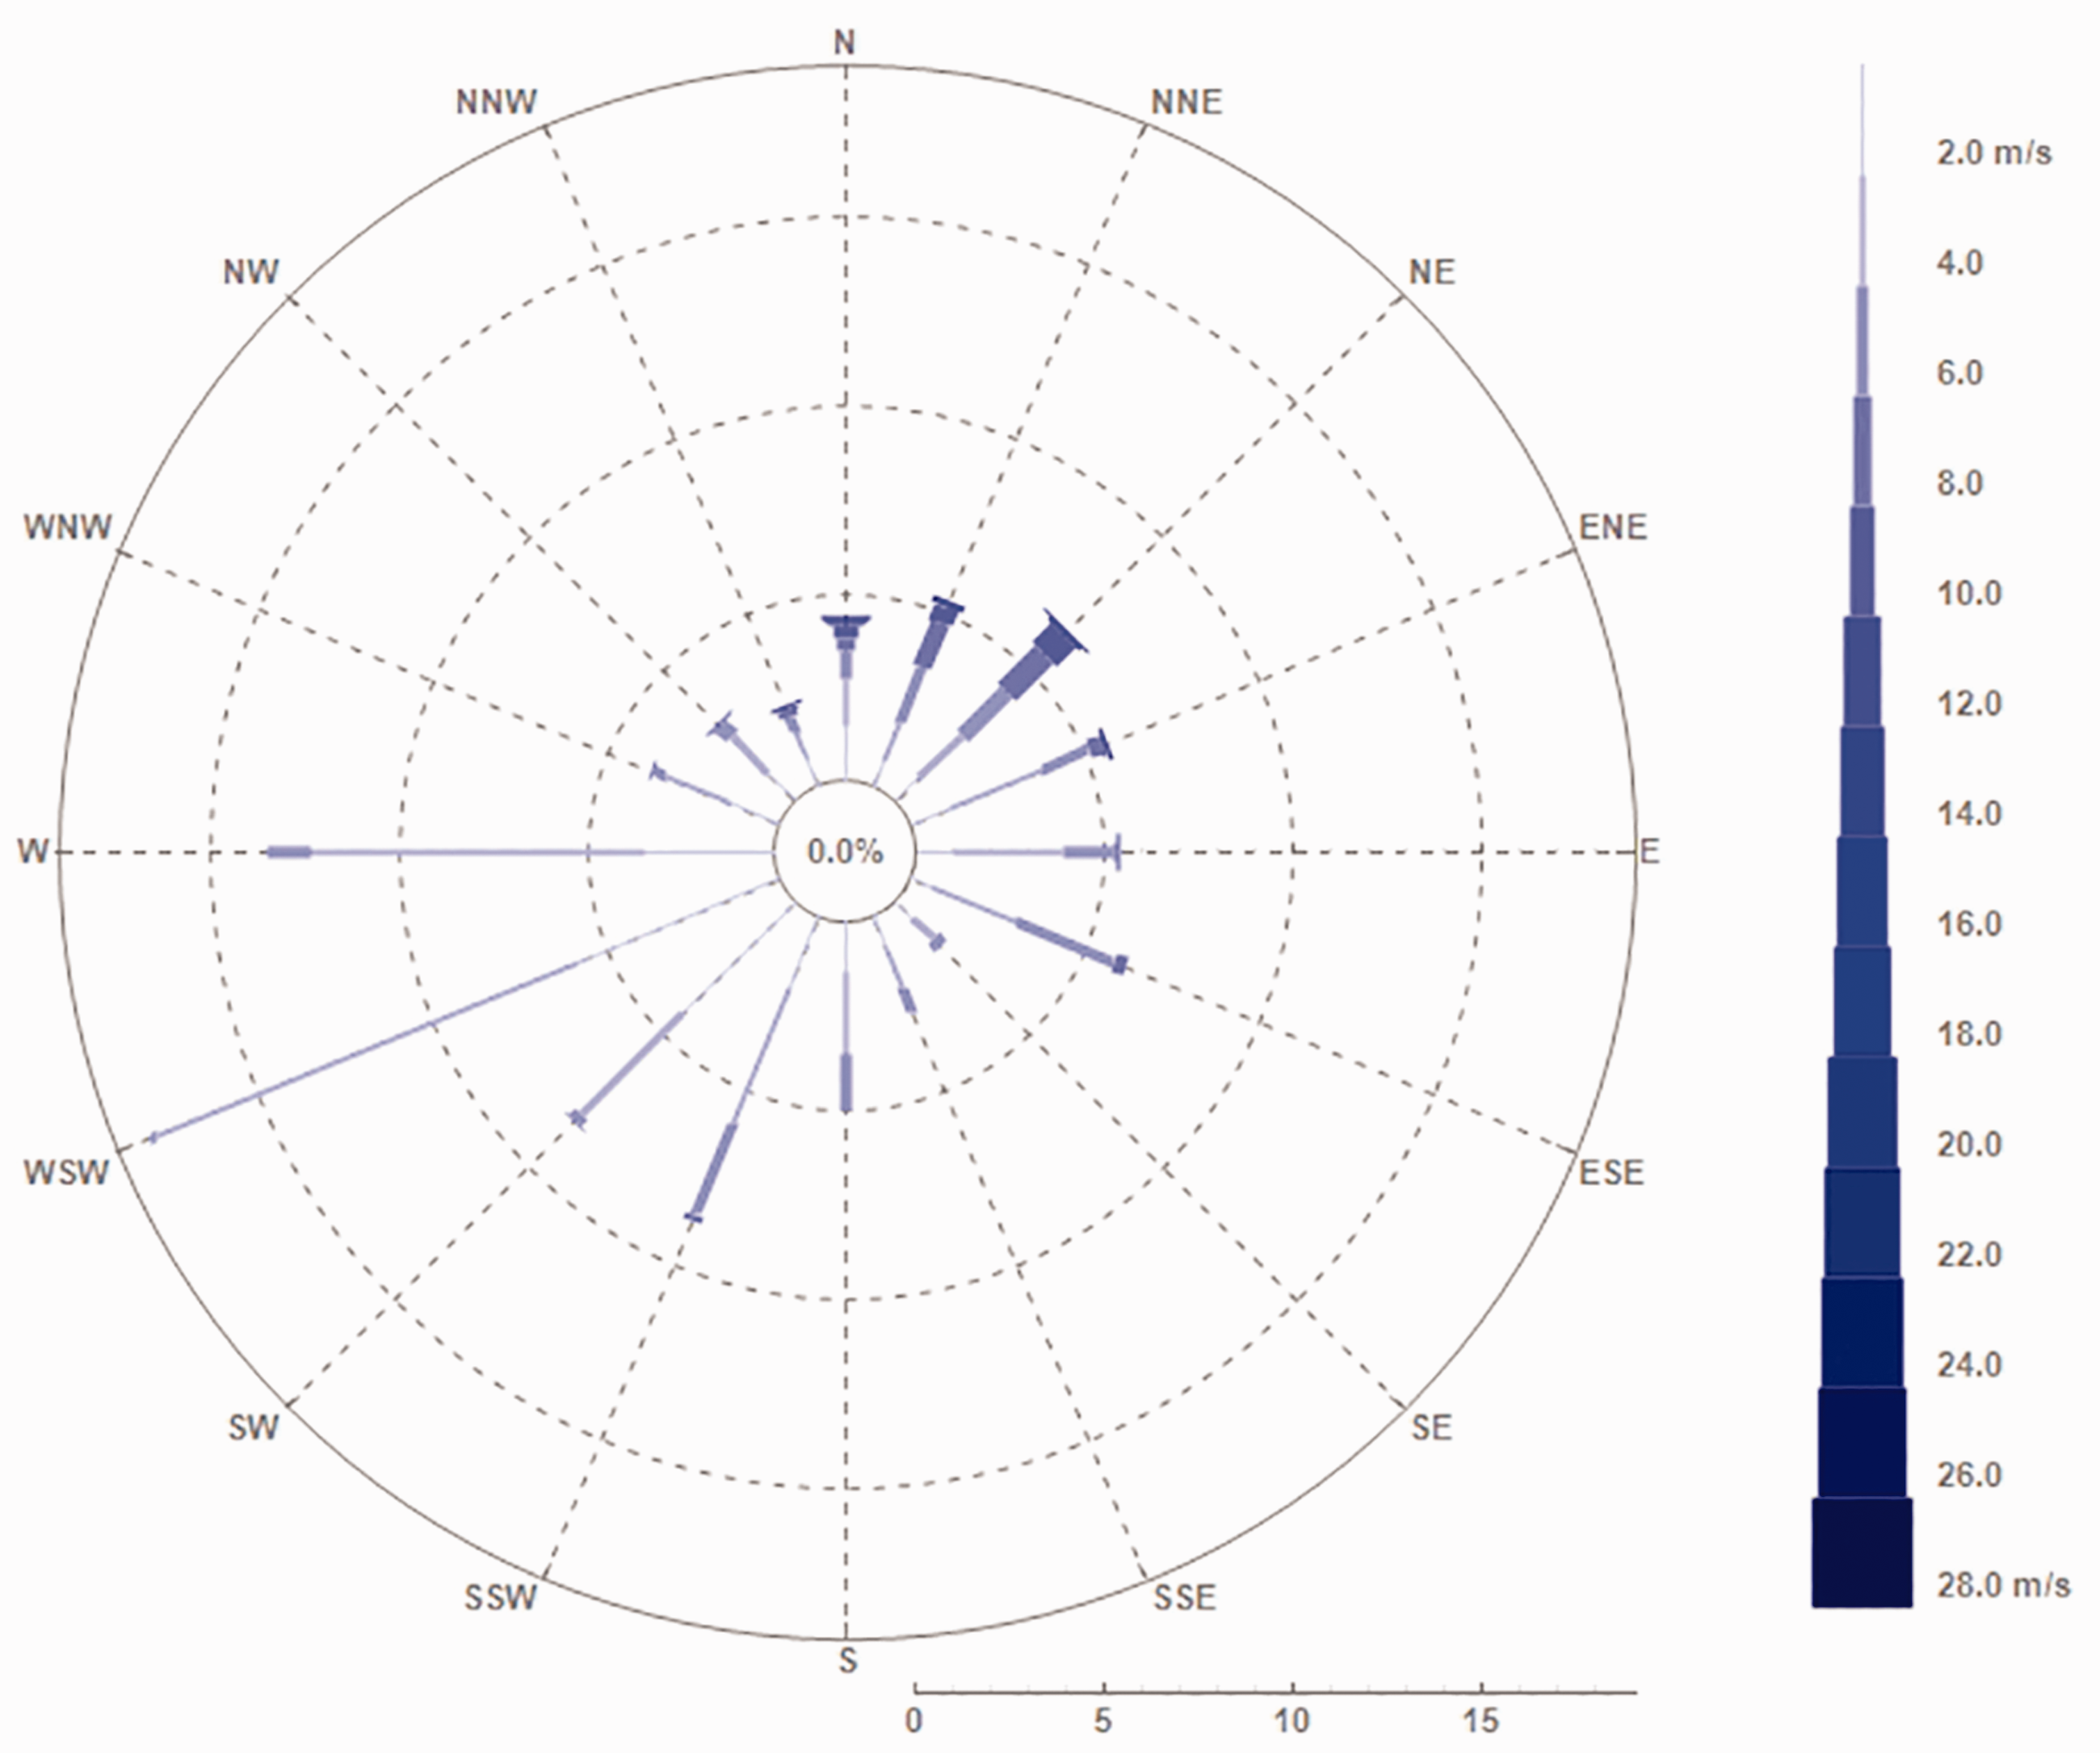
The wind rose of Famagusta, showing wind speed and predominant wind directions.
Although there are not enough studies addressing MM office buildings in the Mediterranean climate, the moderate conditions of this climate facilitate the integration of MM conditioning to maintain indoor air and thermal conditions with optimum NV and energy-saving potentials. For computational energy and thermal simulations, an annual record of climate data using the typical metrological year (TMY) hourly datasets was obtained from the International Weather for Energy Calculations. 60 The TMY-based weather file for Famagusta contains hourly data sets derived from 2004 to 2018.
Benchmark values for internal heat gains and schedules
The building performance simulation method involved using TAS Engineering, 61 by Environmental Design Solutions Limited, to perform dynamic thermal and energy simulations. TAS Engineering is a complete dynamic building simulation package that facilitates a methodical workflow. A single thermal zone was assigned to the studied open-plan office design scenarios. The internal heat gains were determined using the empirical-based benchmark values of the Chartered Institution of Building Services Engineers Guide A: Environmental Design, 56 as outlined in Table 4. The infiltration rate was set to 0.3 ACH, and no mechanical ventilation was assigned in order to determine only the NV potential within an MM system. Corresponding to the highest possible scenario of internal heat gains, full-time schedules (k = 1.0) for occupancy as well as usages of artificial light (maintaining internal lighting at 500 lux) and electrical equipment were accounted for. Therefore, the average total internal heat gain (Qint) from occupants, lighting and devices, was calculated as 42.6 W/m2.
Operation times and average loads for calculating internal heat gains.
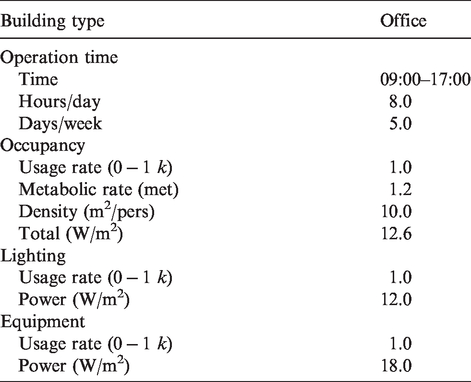
Considering the metabolic rates of 1.0–1.3 met (e.g. sedentary and light office works) stated in the ASHRAE 55 standard 32 and ASHRAE fundamentals, 48 a 1.2 met was estimated, in which an adult office user generates 125.7 W/person – when 1 met equals to 58.2 W/m2 and the body surface area (Du Bois method) 62 of an average adult is 1.8 m2. Hence, such an average-sized person performing sedentary office activities releases 0.0052 dm3/s CO2, as stated in the ASHRAE 62.1 standard 63 (ventilation for acceptable IAQ). Referring to the 10 m2 office area per person benchmark allowance, the total CO2 generation rate is 1.872 dm3/h/m2.
Envelope thermal properties
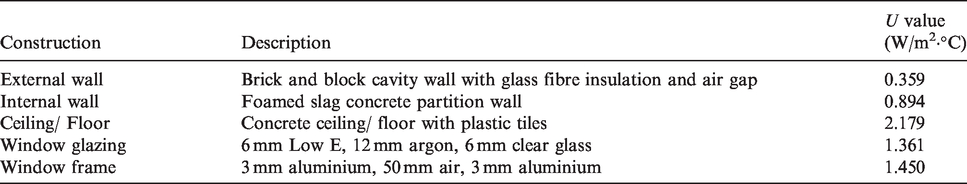
The hypothesised office space for open-plan office designs comprised a single thermal zone assumed to be located on the first floor. The walls that embodied windows were defined as external walls (exposed to outdoor conditions), while the other walls were considered internal walls. In addition, the ceiling and floor were also considered internal surfaces to represent a realistic scenario of a whole office building with other offices next to each other and multiple floors. Table 5 summaries the materials and construction specifications used in the computational building simulations. The selection of construction materials and their properties were compiled into the ASHRAE 90.1–2019 standard 58 building envelope requirements for non-residential buildings in climate zone 3A, including the study location.
The construction materials and their U values.
Airflow model
Using a thermal building-dynamics simulation approach, the airflow model was based on wind pressure coefficients,
64
in which the wind pressure on an aperture is defined by equation (7)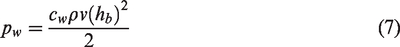
NV flow rates for different design options were calculated in kg/s (as well as ACH), and converted to dm3/s for the purpose of evaluation against the EN 15251 standard airflow categories, which is further explained in the section on evaluation criteria. The potential of NV airflow was assessed for maintaining acceptable indoor air and TC conditions.
Measurement criteria and evaluation methods
The performance criteria for assessing the early-design open-plan offices with a MM conditioning system were airflow rates, CO2 concentration levels, adaptive TC and auxiliary AC loads.
Airflow rate and natural ventilation performance
CO2 concentration and adaptive TC results can denote NV performance and the adequacy of ventilation rates (VRs) in a particular microenvironment, both of which were employed in this study. In addition, the airflow rate can be assessed using relevant standards devoted to IAQ and ventilation acceptability, such as the ASHRAE 62.1,
63
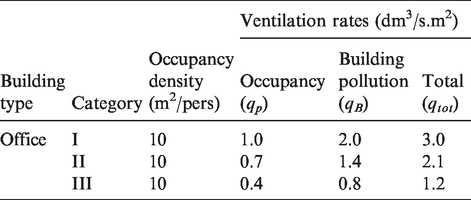
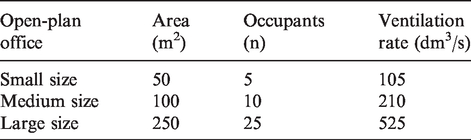
EN 1525128 and EN 1377965 standards. The minimum VRs specified in these standards depend on building type, floor area and/or occupancy. In the ASHRAE 62.1 standard, the breathing zone outdoor airflow (Vbz) is calculated using equation (8); correspondingly, the EN 15251:2007 uses equation (9) in expressing the total VRs (qtot) for indoor space in terms of VRs (qB) for the building emissions. Both standards present a similar logic, but the outputs are not necessarily identical. Due to the geographic characteristics of the study location, the method of VR calculation suggested in the EN 15251:2007 standard was utilised. Table 6 shows the recommended VRs for office buildings. The VR for smoking was not added considering smoking in offices is usually prohibited. Hence, Table 7 outlines the calculated minimum VRs for the different open-plan office designs using the category II limit of the EN 15251 standard

Ventilation rates for non-low polluted office buildings based on the EN 15251 standard. 28
Category II threshold ventilation rates for studied open-plan offices.
CO2 as a surrogate for odourous bioeffluents
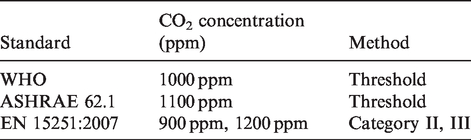
CO2 concentration is considered an adequate indicator to assess the quality of indoor spaces. Previous studies used CO2 concentration to assess the quality of indoor air and ventilation performance of a given space using dynamic building simulations or as a ‘gas tracer’ in field experiments. A few guidelines and standards define benchmark limits for acceptable concentrations of indoor CO2, such as WHO, 27 ASHRAE 62.1, 63 EN 15251 28 and EN 1377965 standards. The WHO suggests a 1000-ppm limit as the threshold at which higher levels of CO2 concentration indicate poor ventilation and the potential for IAQ problems resulting in SBS. 29 Similarly, the EN 15251:2007 standard indicates different categories for indoor CO2 levels. The 1000-ppm threshold specified by the WHO is also recommended by the ASHRAE 62.1 standard, which approximately corresponds to category II of indoor CO2 concentration in the EN 15251:2007 standard. In this study, the WHO’s 1000-ppm threshold was applied to evaluate the NV performance of different open-plan office designs. Table 8 presents different standards addressing the level of indoor CO2.
CO2 concentration thresholds and acceptability limits for 400 ppm outside CO2 level defined by relative standards.
Thermal comfort model
The reviewed field studies criticise current TC standards (i.e. ASHRAE 55 and EN 15251) for classifying the MM system under air-conditioned buildings, claiming the NV mode constitutes the majority of occupied hours. While, in the mentioned TC standards, NV is described as free-running buildings and thus adaptive TC has been developed based on large databases from field studies. Results of recent field surveys confirmed that adaptive TC is more precise in describing occupants’ thermal sensation in MM buildings compared to Fanger’s model (PMV/PPD), which underestimates residents’ various adaptive behaviours in response to changes in outdoor weather conditions. In addition, the use of the adaptive TC is also recommended for climate change impact studies on MM office buildings. 66 Therefore, this study implemented the European adaptive TC, stated in the EN 15251:2007 standard, 28 being less restrictive when explaining the model applicability conditions.
As a MM system, indoor TC involves NV and AC systems, each of which can be evaluated using different TC models, namely the adaptive model and the steady state PMV model, respectively. However, this study focuses on the utility of NV for open-plan offices under an MM strategy; therefore, the indoor TC evaluation was limited to the NV hours (or free-running hours) using the adaptive TC of the EN 15251:2007 standard as presented in equation (10).
28
Indoor comfort operative temperature is defined in relation to an exponentially weighted outdoor running mean temperature. The exponentially weighted outdoor temperature for the previous 7–30 days is calculated using equation (11), in which temperatures become less significant as time progresses depending on the value of constant 

Air-conditioning loads
The internal conditions were designed based on the MM concept – availability of both NV and mechanical AC system in the same space – considering the adaptive comfort model acceptable operative temperature ranges. The MM strategy aims at maximising the potential of NV through operable windows and maintaining indoor thermal performance through supplementary heating/cooling during extreme weather conditions. Consequently, a considerable amount of energy can be saved, as well as lowered greenhouse gas (GHG) emissions.
In a similar hot and humid climate, NV is usually utilised when the outdoor temperature falls in the range of 20°C to 24°C.
16
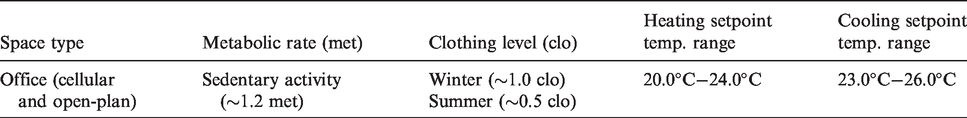
In order to maximise the extent of VC and comply with occupants’ window opening behaviour as described in the adaptive TC model, NV was designed in an automated manner, such that the windows start to open when the indoor air temperature is at 21°C and will be fully open when it reaches 24°C. In actual cases, such a controlling mechanism is integrated into the Building Management System.16,43 To prevent overcooling, the operation of window openings complies with the temperature ranges of heating and cooling recommended by the EN 15251 standard for category II, as reported in Table 9. For air-conditioned spaces, the minimum indoor temperature for heating is 20°C and the maximum temperature for cooling is 26°C. However, in naturally ventilated buildings, occupants accept a wider range of temperatures in relation to outdoor temperatures using various adaptive actions.
67
The operation of AC within the MM system was determined using the minimum heating temperature setpoint of the category II (20°C), while the category II upper limit of the European adaptive comfort was used to define the cooling temperature setpoint, as defined in equation (12). For instance, cooling starts when the indoor operative temperature reaches 31.7°C at an outdoor running mean temperature of 30°C
Temperature ranges for hourly calculation of heating and cooling in category II of the EN 15251:2007 standard. 28
Finally, the number of hours in which the indoor operative temperature appears inside the acceptability limits of the adaptive model were counted, representing the annual comfortable hours provided by NV (free-running hours). The remaining number of office working hours can be satisfied using mechanical AC of the MM system. Therefore, cooling setpoint temperature for each of discomfort hours was determined in accordance with the outdoor running mean temperature using equation (12). Thus, the total heating and cooling loads of the AC period were measured for each design scenario based on an hourly simulation and analysis. In order to compare the performance of the MM system with a fully AC scenario, a comparative study was performed for a particular design solution, using the temperature ranges for heating and cooling defined in Table 9, specifically 20°C and 26°C for heating and cooling of the fully air-conditioned case, respectively.
Assessment of ventilation potential
Derived from the National Institute of Standards and Technology 49 and further developed within the framework of International Energy Agency Annex 62, 50 the VC method was utilised to validate NV performance relative to comfort hours predicted by dynamic building simulation. The emergence of this method refers to the continuous interest towards low energy buildings and low GHG emissions. It provides a useful estimate when evaluating the climate potential of NV in the early design phase by considering the building envelope’s thermal properties, internal heat gains (i.e. occupancy, lighting, equipment gains and solar radiation gains) and the required amount of airflow rates to retain IAQ and TC conditions based on the relevant regulation and standard. Such local climatic condition-based analysis supports designers when important decisions about building layout and envelope configurations are being made.
The algorithmic model processes hourly annual climatic conditions, taking into account the intended TC criteria. It was deduced from the energy balance of a well-mixed single zone, assuming the accumulation term of the energy balance can be negligible, if either the thermal mass of the space is insignificantly small or the indoor temperature is kept relatively constant. Under these conditions, the thermal response of the zone is defined as the steady state model, approximating the VC potential of a specific climate, as expressed in equation (13)
According to this method, the heating balance point temperature (To-hbp) establishes the outdoor air temperature below which heating must be introduced to preserve indoor air temperatures at a required internal heating setpoint temperature (Ti-hsp). When outdoor temperatures exceed the heating balance point temperatures, direct VC can be sufficient to offset internal heat gains and sustain indoor air and thermal conditions within the comfort range. While at or below To-hbp, VC is no longer useful, although the minimum required VR must be provided for acceptable and healthy indoor air, as recommended by the relevant IAQ standards, such as the ASHRAE 62.1 and EN 15251:2007.
In air-conditioned buildings, the minimum and maximum Ti-hsp is limited to steady state values taking into account building types, such as the recommended indoor temperature ranges for office heating and cooling presented in Table 9. However, as discussed in the TC model, the adaptive comfort model is developed in relation to outdoor temperature variations; hence, Ti-hsp is calculated using adaptive comfort acceptability limits (ASHRAE 55) or categories (EN 15251). As explained previously, this study focuses on category II of the adaptive TC and thus the same conditions were applied to the VC analysis. Figure 4 illustrates the mean and maximum outdoor temperatures in relation to category II of the adaptive model for office working days.
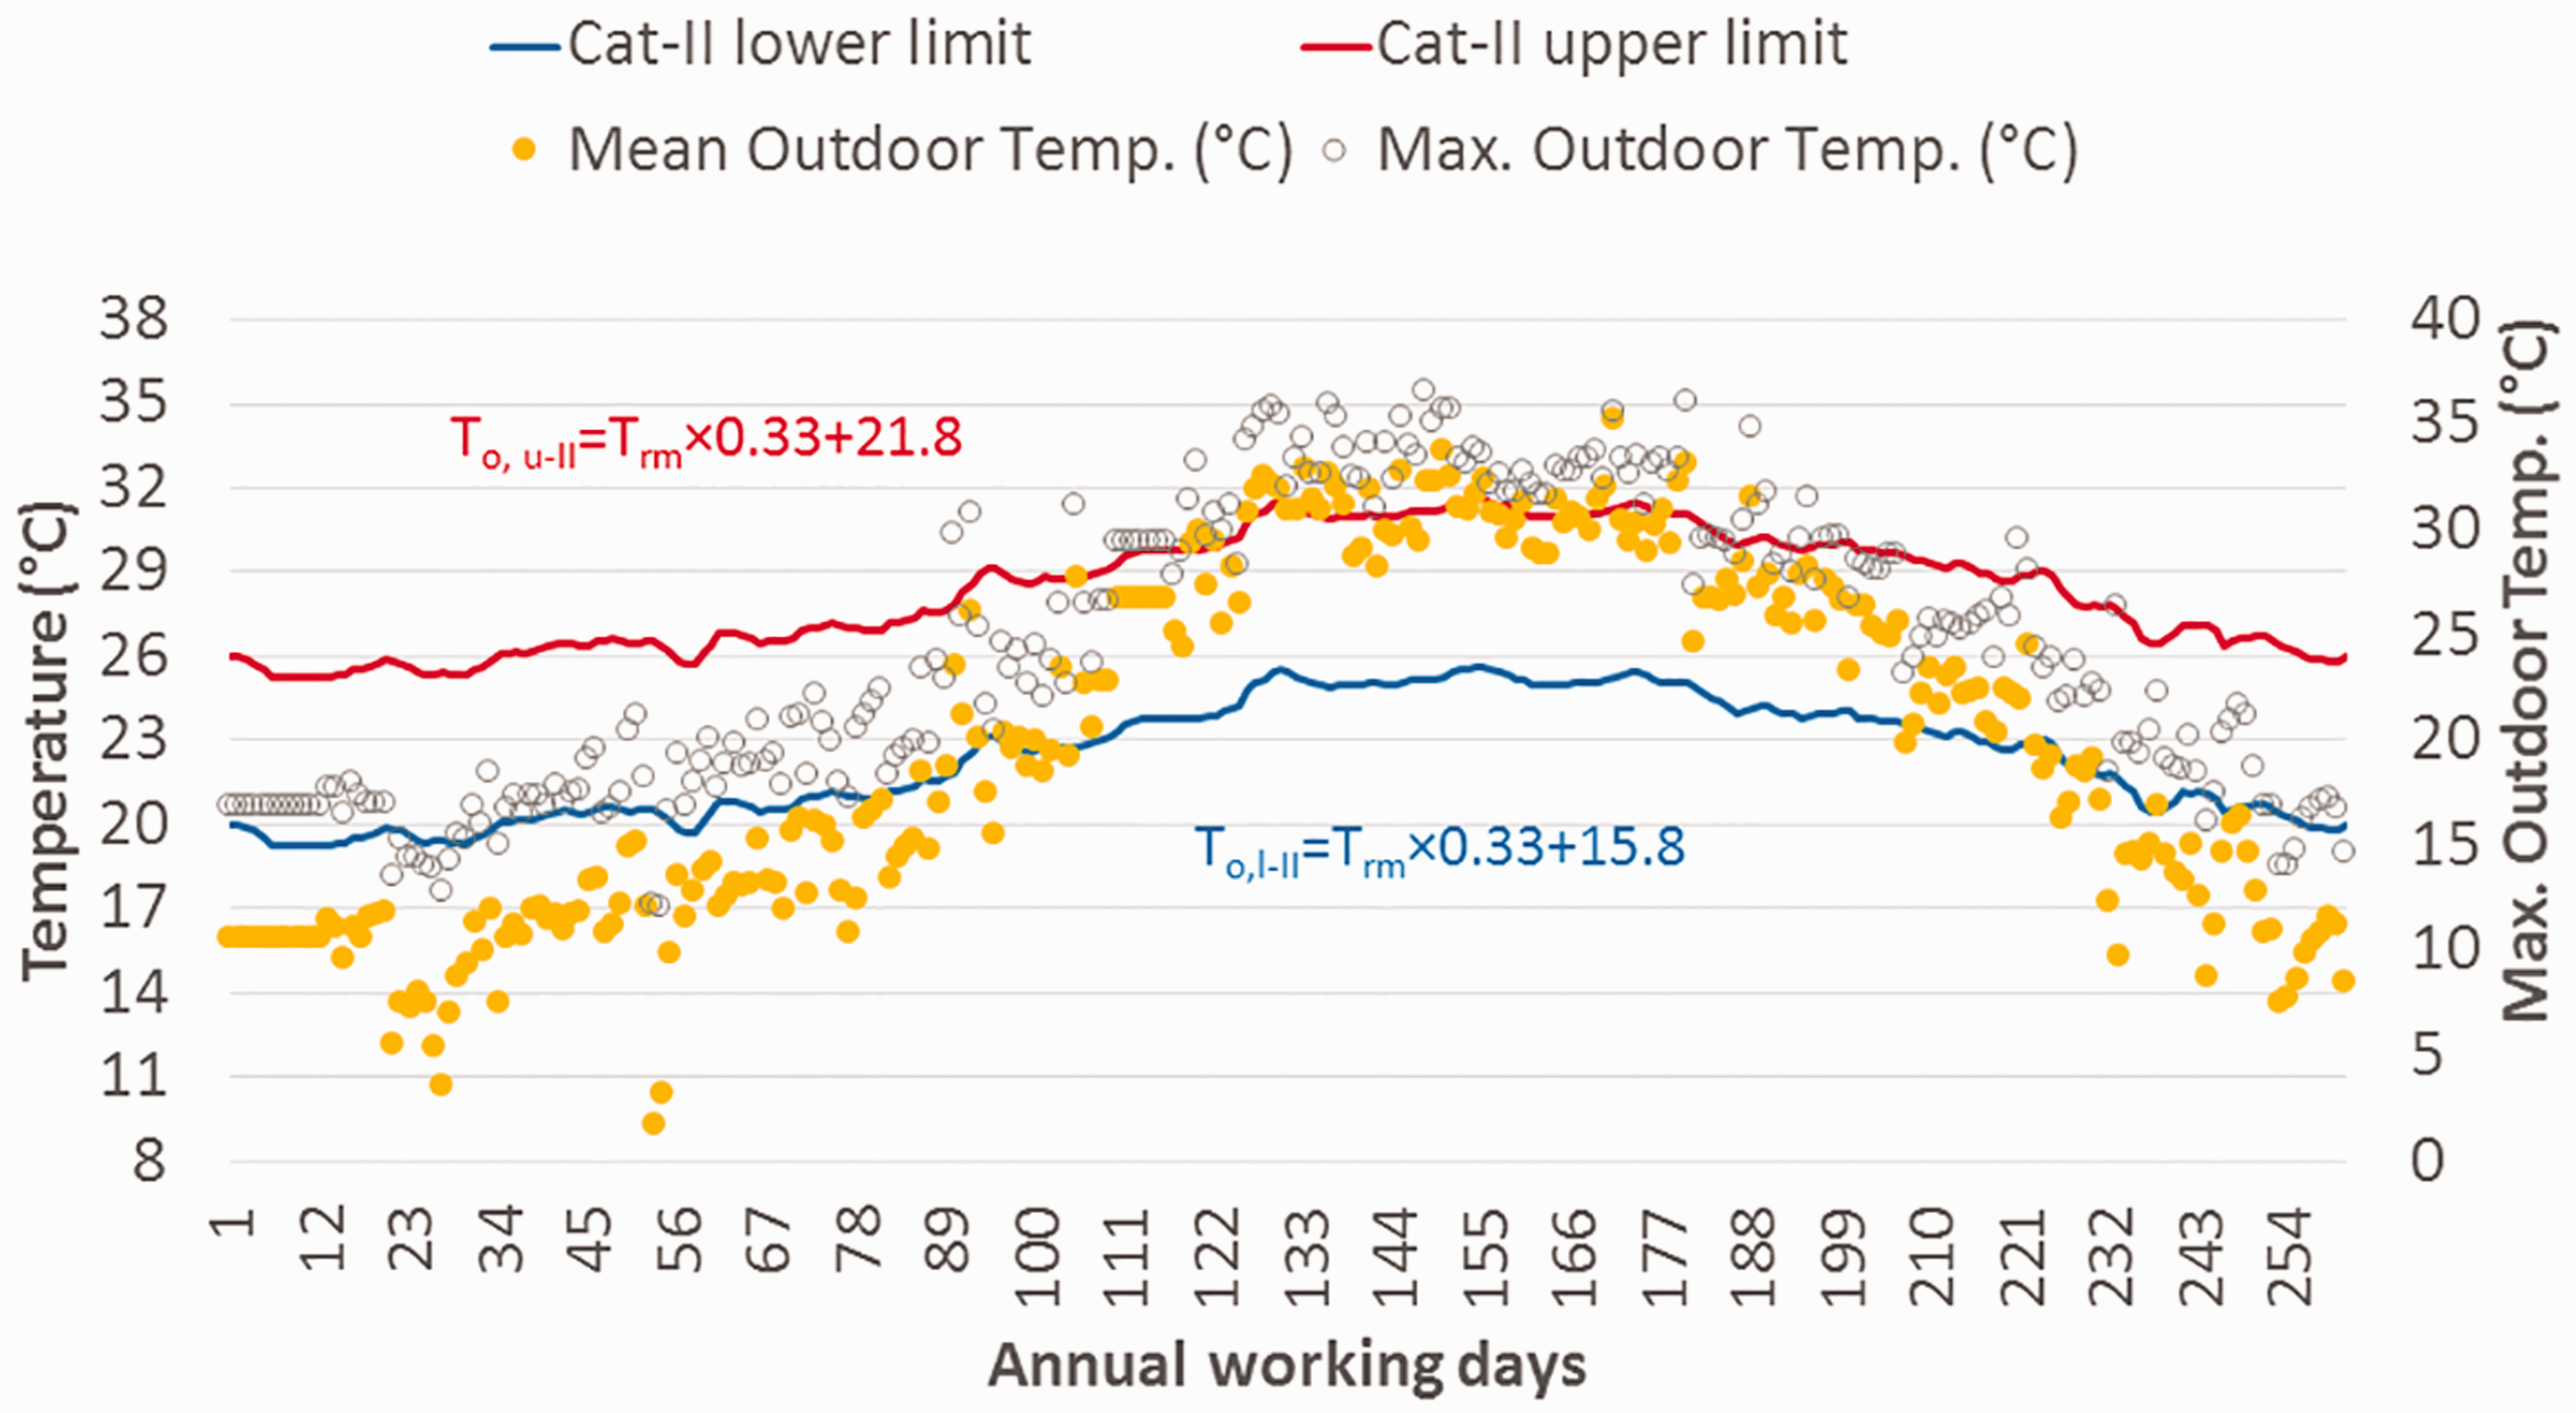
Daily mean and maximum outdoor temperature with allowable adaptive thermal comfort upper and lower limits suggested in category II in the EN 15251 standard during office working days.
To compare the results of dynamic simulations with the VC method, the direct VC with increased airflow rate that can potentially ensure comfort conditions when the outdoor temperature is within the range of comfort zone temperature needs to be calculated taking into account the particular category’s temperature ranges (i.e. category II of the EN 15251 standard). Assuming conductive losses during warm months are typically small relative to internal gains (i.e. ∑UA(Ti-max – To-db) < qi), the VR required to provide comfort hours is computed as in equation (14)
Results and discussion
Effect of design parameters on the measured performance criteria
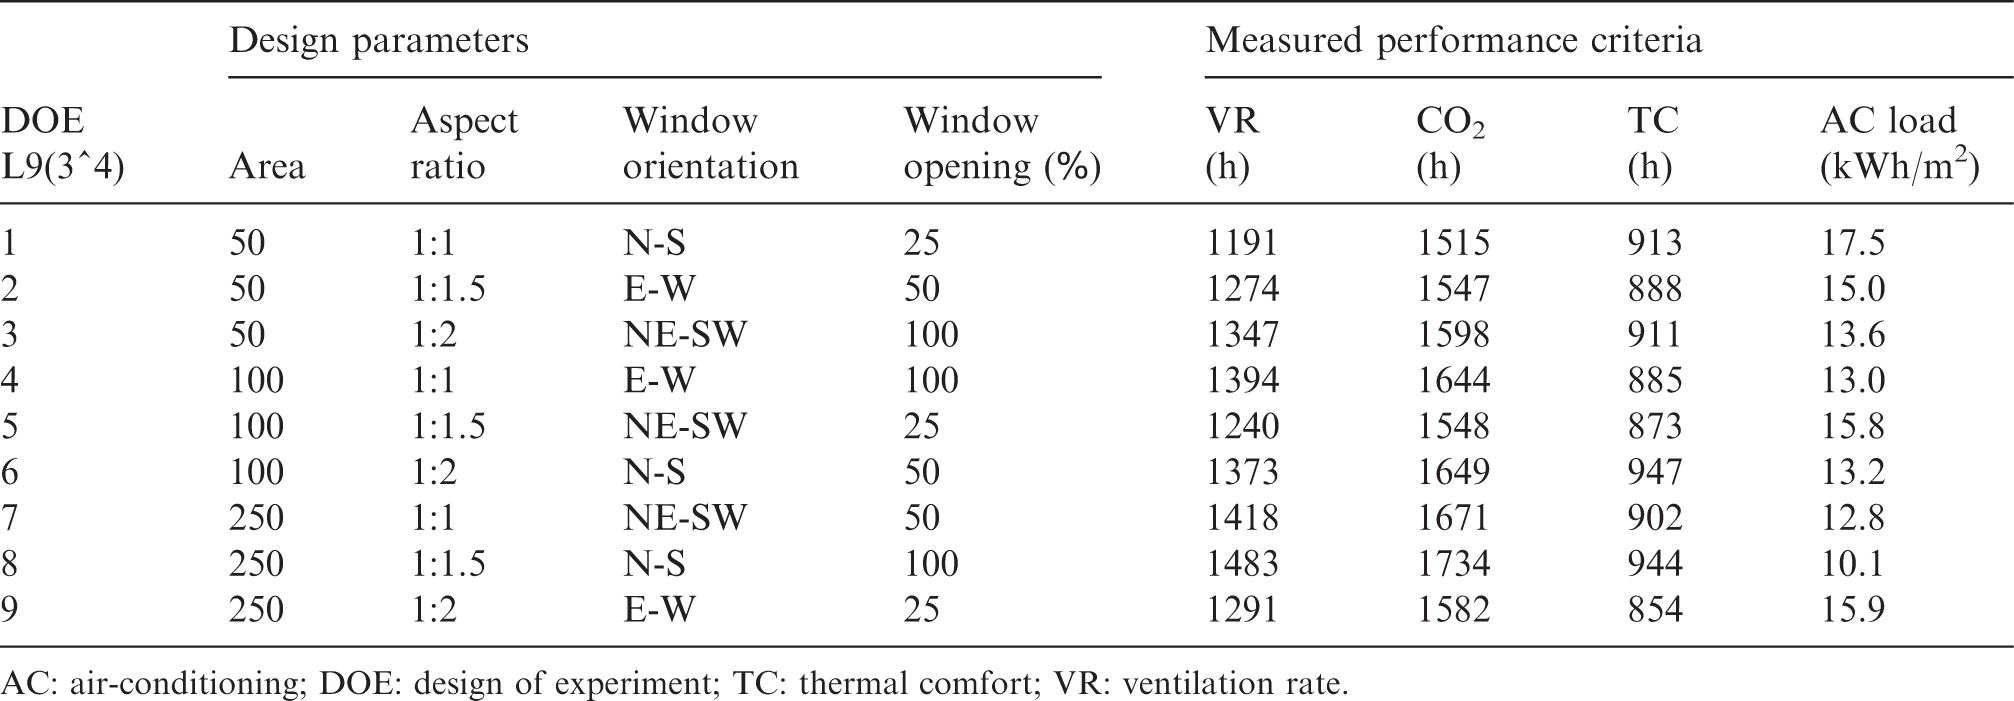
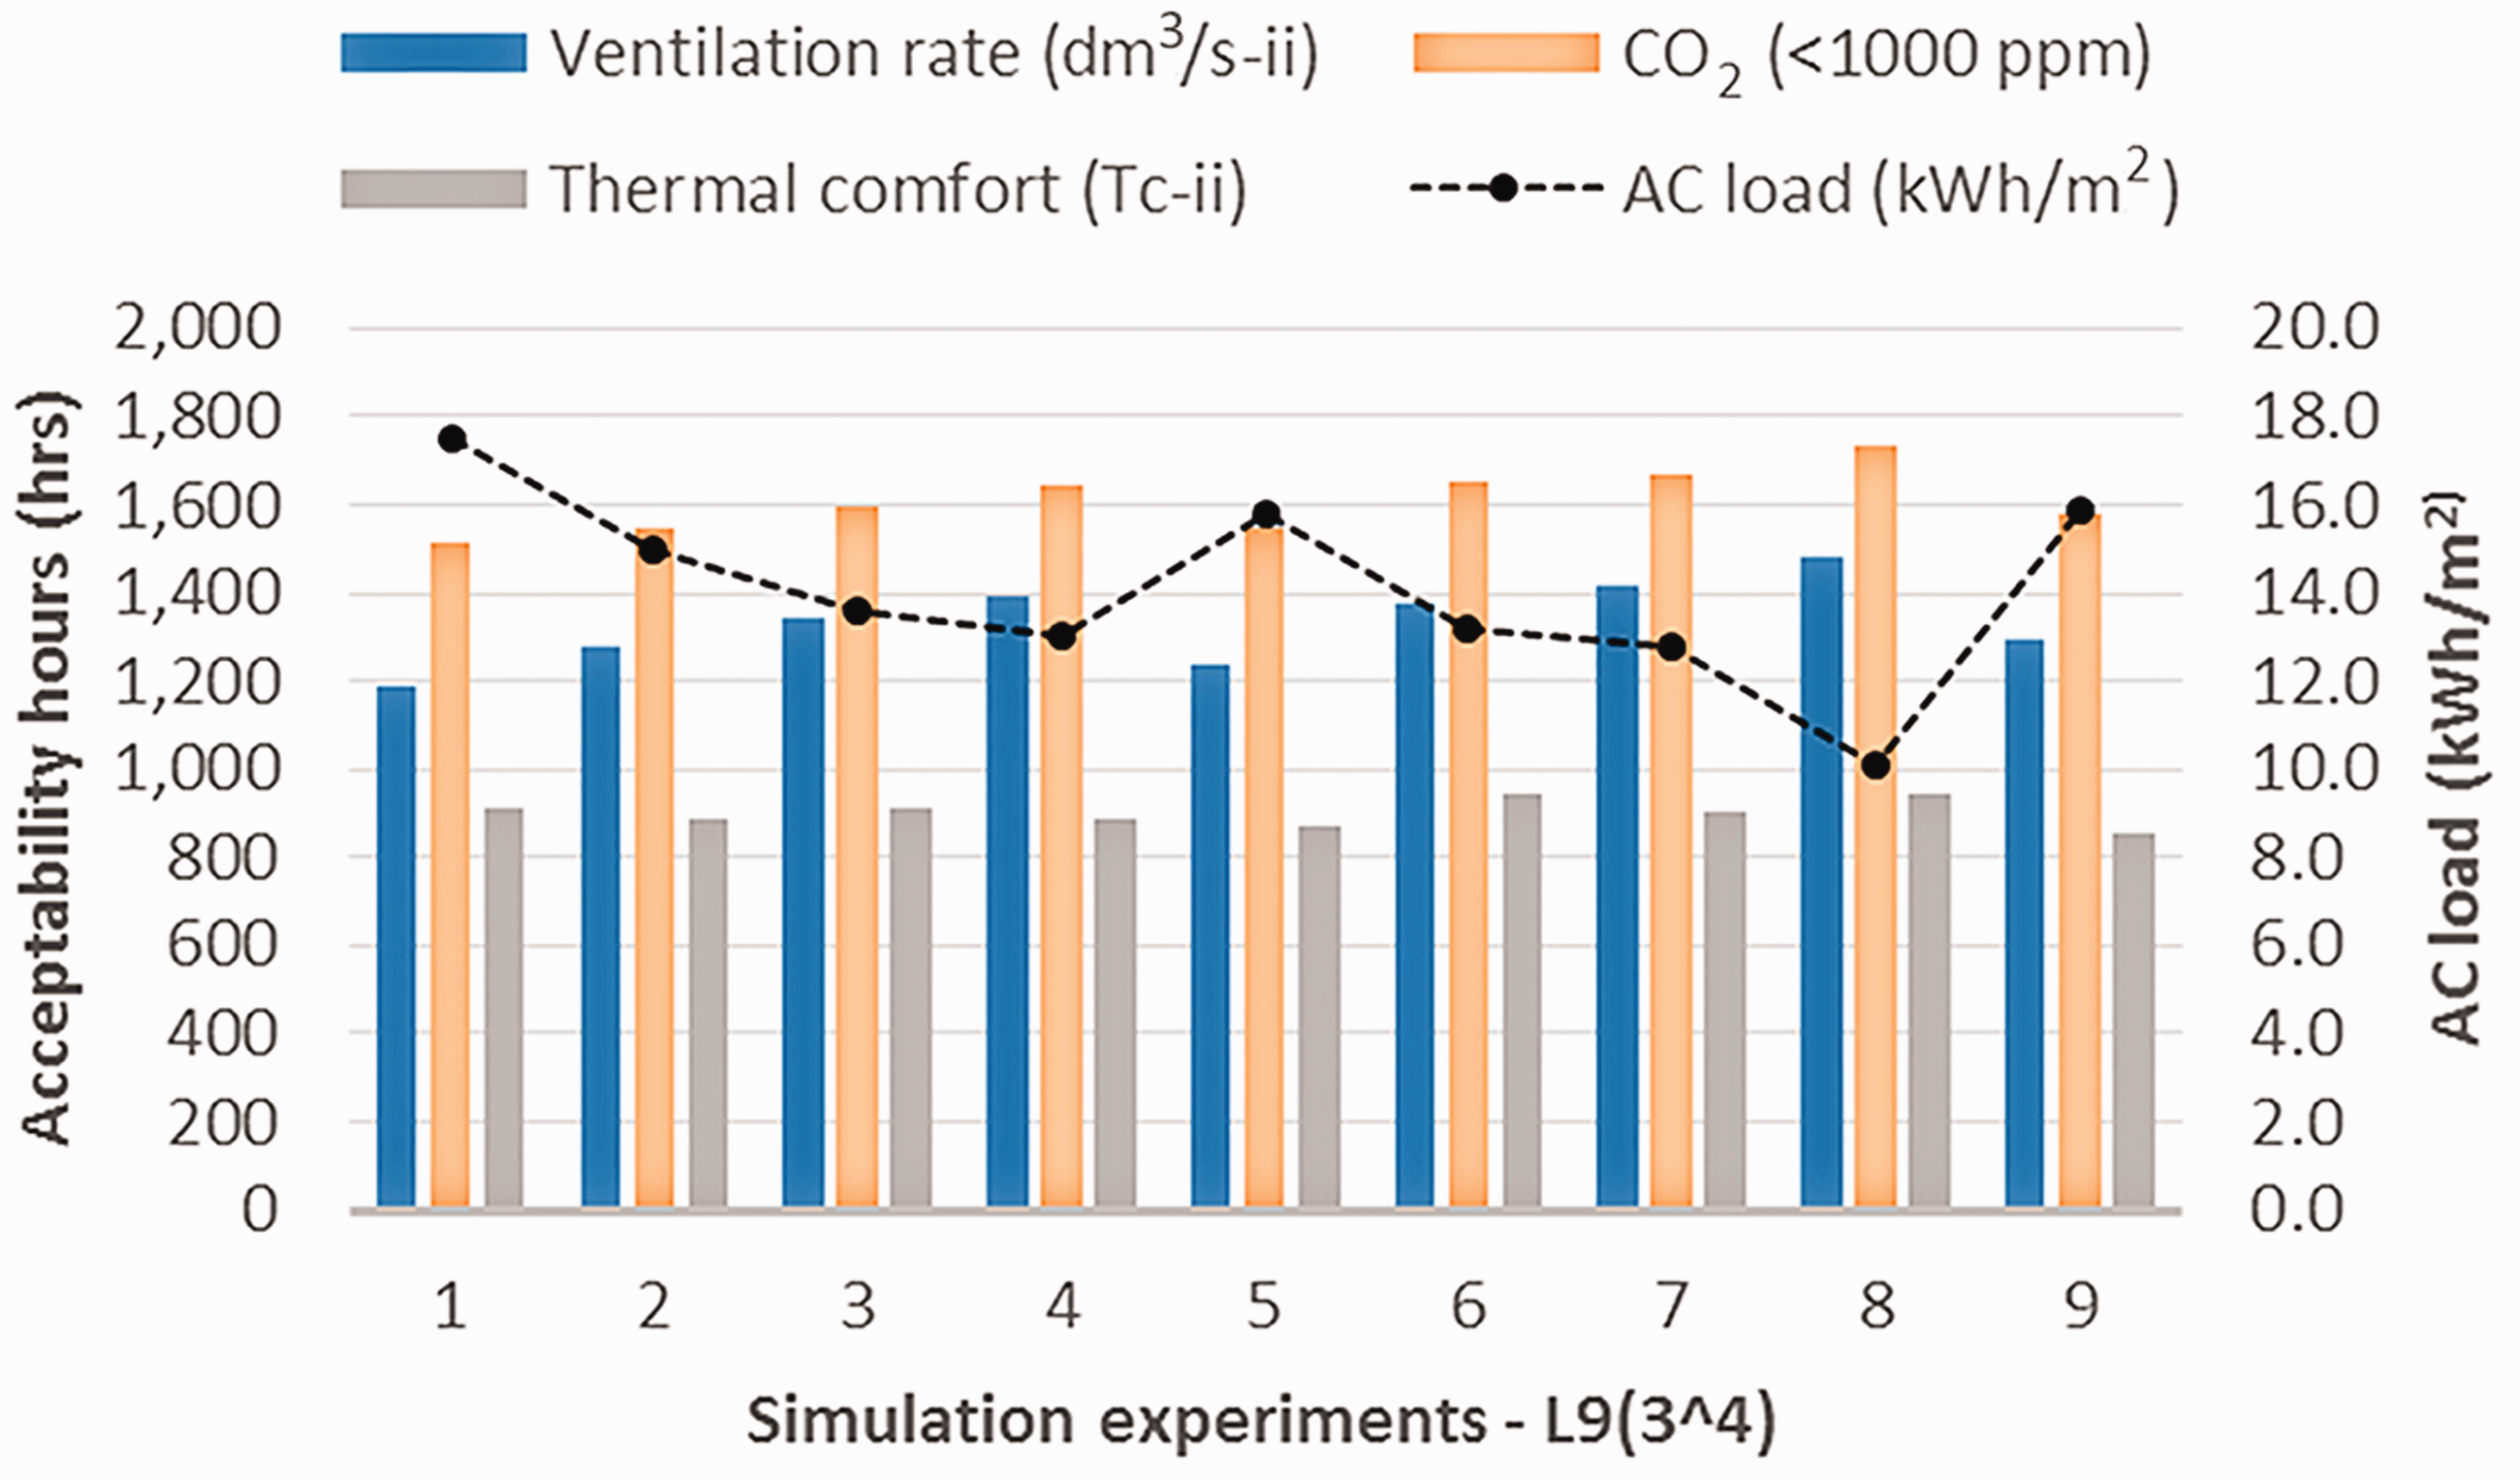
The objective functions measured to assess the influences of the design variables on the open-plan office design were the amount of VRs, CO2 concentration, TC acceptability ranges and supplementary heating/cooling loads (AC loads) within a MM system. In order to evaluate the design parameters and their levels, the annual acceptable hours – based on the category ranges or recommended thresholds explained in the methodology – for VR, CO2 level of concentration and adaptive TC were calculated. In addition, the annual AC load for each design experiment, determined by the Taguchi’s L9 (34) orthogonal array, was recorded and presented in Table 10 and Figure 5.
The total annual acceptable hours and AC loads of the measured performance criteria for the set of Taguchi L9 (34) simulation cases.
AC: air-conditioning; DOE: design of experiment; TC: thermal comfort; VR: ventilation rate.
Summary of the results for the selected performance criteria of the nine simulation experiment runs suggested by the Taguchi L9 (34) orthogonal array.
The simulation results, as well as the four studied design parameters and their three levels, were used to perform ANOVA. Using the ANOVA method, the percentage contributions (factor effect) of the design variables were determined, as shown in Tables 11to 14. Results show that the fracture of the window opening has the highest influence on the performance of airflow, CO2 concentration and AC loads by 63.34%, 47.98% and 66.80%, respectively, followed by open-plan office size and window orientation. Conversely, the percentage contribution of the design factors shows different patterns when the adaptive TC acceptable hours are considered, in which window orientation comes at the first rank at 71.05%, followed by a window opening ratio of 28.31%. Office size and aspect ratio share a similar effectiveness percentage. Therefore, the role of solar radiation is significant on indoor thermal conditions, particularly in the absence of solar shading means. Furthermore, the office aspect ratio has the least effect on the selected performance criteria, for which the percentage contribution does not reach 1.0% in any cases.
ANOVA analysis and factor effect percentages to acceptable hours of ventilation rate.
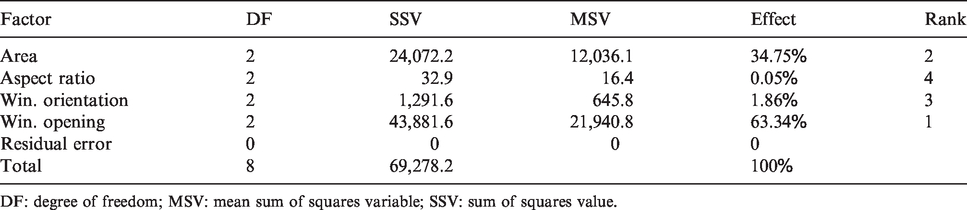
DF: degree of freedom; MSV: mean sum of squares variable; SSV: sum of squares value.
ANOVA analysis and factor effect percentages to acceptable hours of CO2 level.
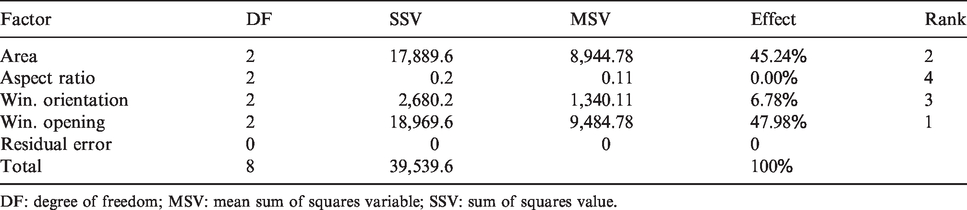
DF: degree of freedom; MSV: mean sum of squares variable; SSV: sum of squares value.
ANOVA analysis and factor effect percentages to acceptable hours of adaptive thermal comfort.
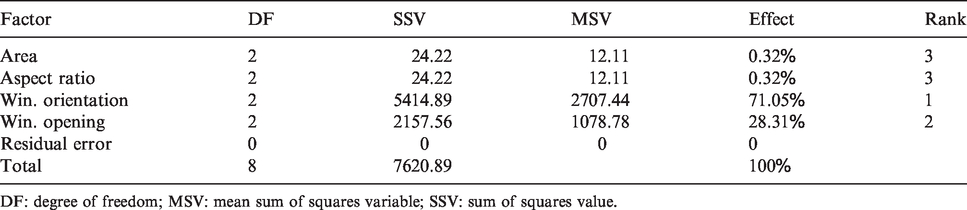
DF: degree of freedom; MSV: mean sum of squares variable; SSV: sum of squares value.
ANOVA analysis and factor effect percentages to air-conditioning loads.
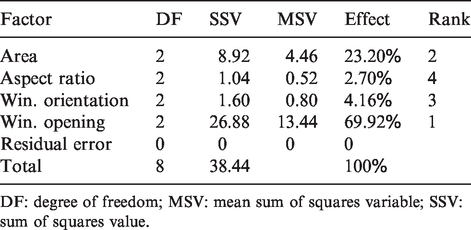
DF: degree of freedom; MSV: mean sum of squares variable; SSV: sum of squares value.
Identifying optimal design using the signal-to-noise ratio method
Using the S/N ratio method, the most significant levels of each design parameter can be identified. The most influential level combinations represent a near-optimal design scenario, not necessarily the optimal case as discrete level options of the variables were implied in the analysis. For the S/N ratio of larger-is-better, higher values indicate greater effectiveness within a particular parameter in terms of achieving the intended objective function. Alternatively, lower values are preferable in the S/N ratio of smaller-is-better.
Figure 6 presents the S/N ratios for three levels of each measured performance criteria. Figure 6(a) to (c) is produced based on the S/N of greater-is-better, while (d) implements the smaller-is-better S/N ratio. By looking at Figure 6(a) and (b), the optimal level combinations for both VR and CO2 performance are identical, confirming the relationship of direct proportionality between the amount of airflow and indoor air pollutants. A greater number of category II adaptive comfort hours can be provided by the large size open-plan office with a 1:1.5 aspect ratio that has north/south cross-windows at full opening potential, specifically 944 h or 45% of office working hours. Nevertheless, in the multi-objective optimisation concept, the near-optimal level combinations should be prescribed by selecting trade-offs between different objective functions. Accordingly, the most effective level combinations and their overall performance for each criterion are outlined in Table 15.
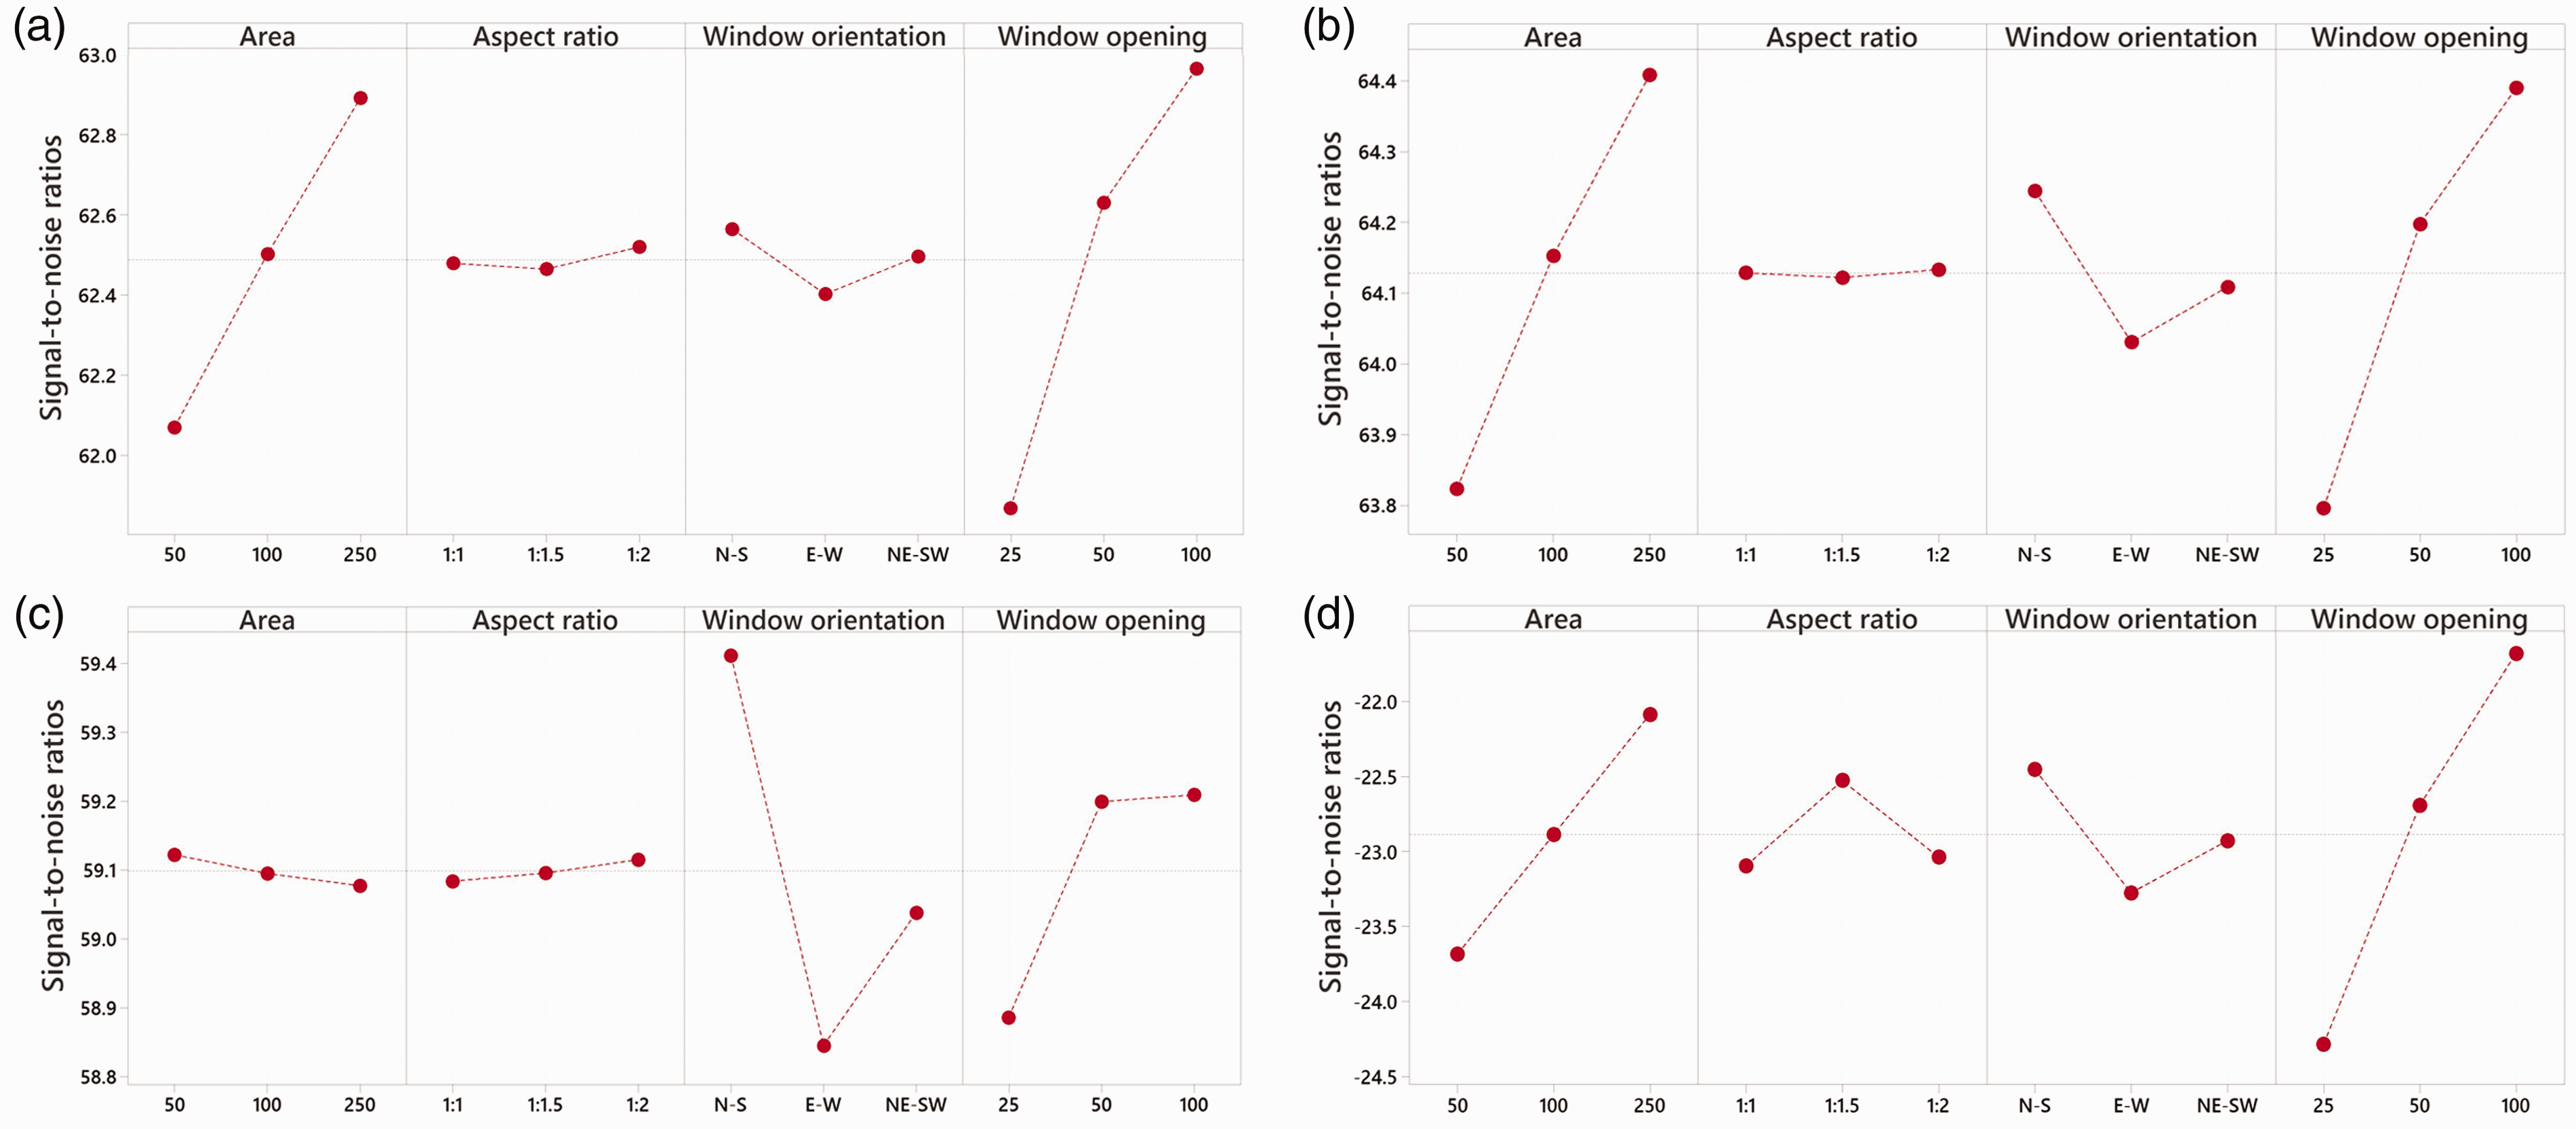
Signal-to-noise ratio plots showing the effects of each level of variables on (a) ventilation rate, (b) CO2 concentration, (c) adaptive thermal comfort and (d) AC loads.
Simulation results for the trade-off design solutions referring to near-optimal cases for different open-plan office sizes.
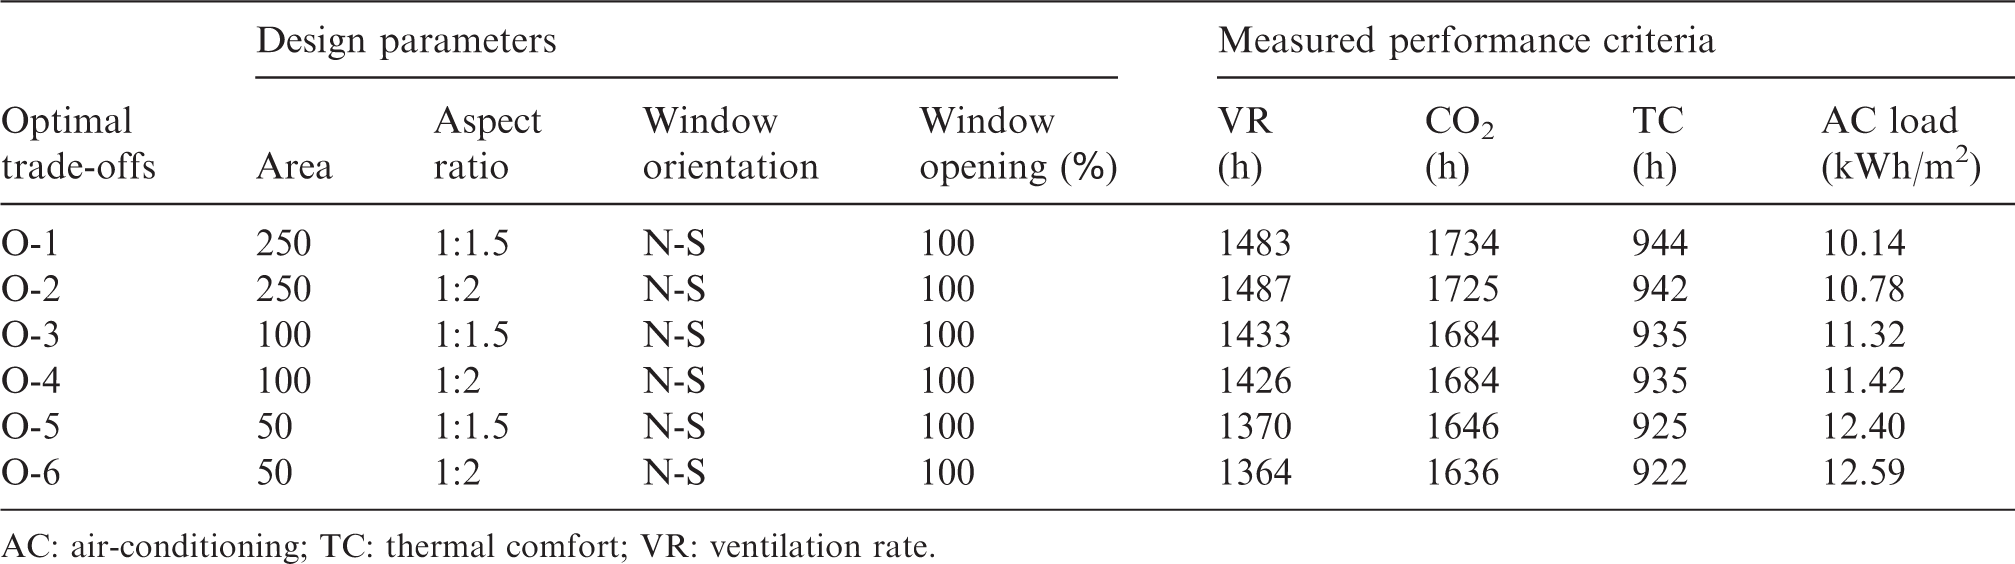
AC: air-conditioning; TC: thermal comfort; VR: ventilation rate.
Airflow rates
The total annual number of hours at which the total VRs (for building pollution and occupancy) were greater than the lower limit of category II (VR ≥ 2.1 dm3/s. m2) of the EN 15251:2007 standard for the selected near-optimal design possibilities are reported in Table 10 and Figure 5. Despite the constant window size (20% of floor area) assigned to all scenarios, the large size offices provide more acceptability hours (more than 1480 h) of VR than medium (about 1430 h) and small (approximately 1370 h) size offices. Overall, the layout aspect ratio had minimal influence on the measured airflow, corresponding to less than 7 h per annum for the selected design combinations. The optimal design solutions for each of the large, medium and small size offices offer 71%, 68% and 65% category II VR hours annually during occupancy time. January and February had lower airflows than the threshold due to the cold outdoor temperature, which keep windows closed most of the time. In this situation, a minimum airflow rate for acceptable IAQ should be provided using a mechanical supply strategy.
Figure 7 presents the monthly VRs for the near-optimal scenarios selected through the ANOVA approach. Figure 7 shows that the proposed window opening scheme and MM cut-off temperature can achieve category II minimum amount of VR for all the months, except for January and February. The amount of VR is considerably high, for which the VC potential of ambient air can be harnessed as a passive cooling strategy in the warm period.
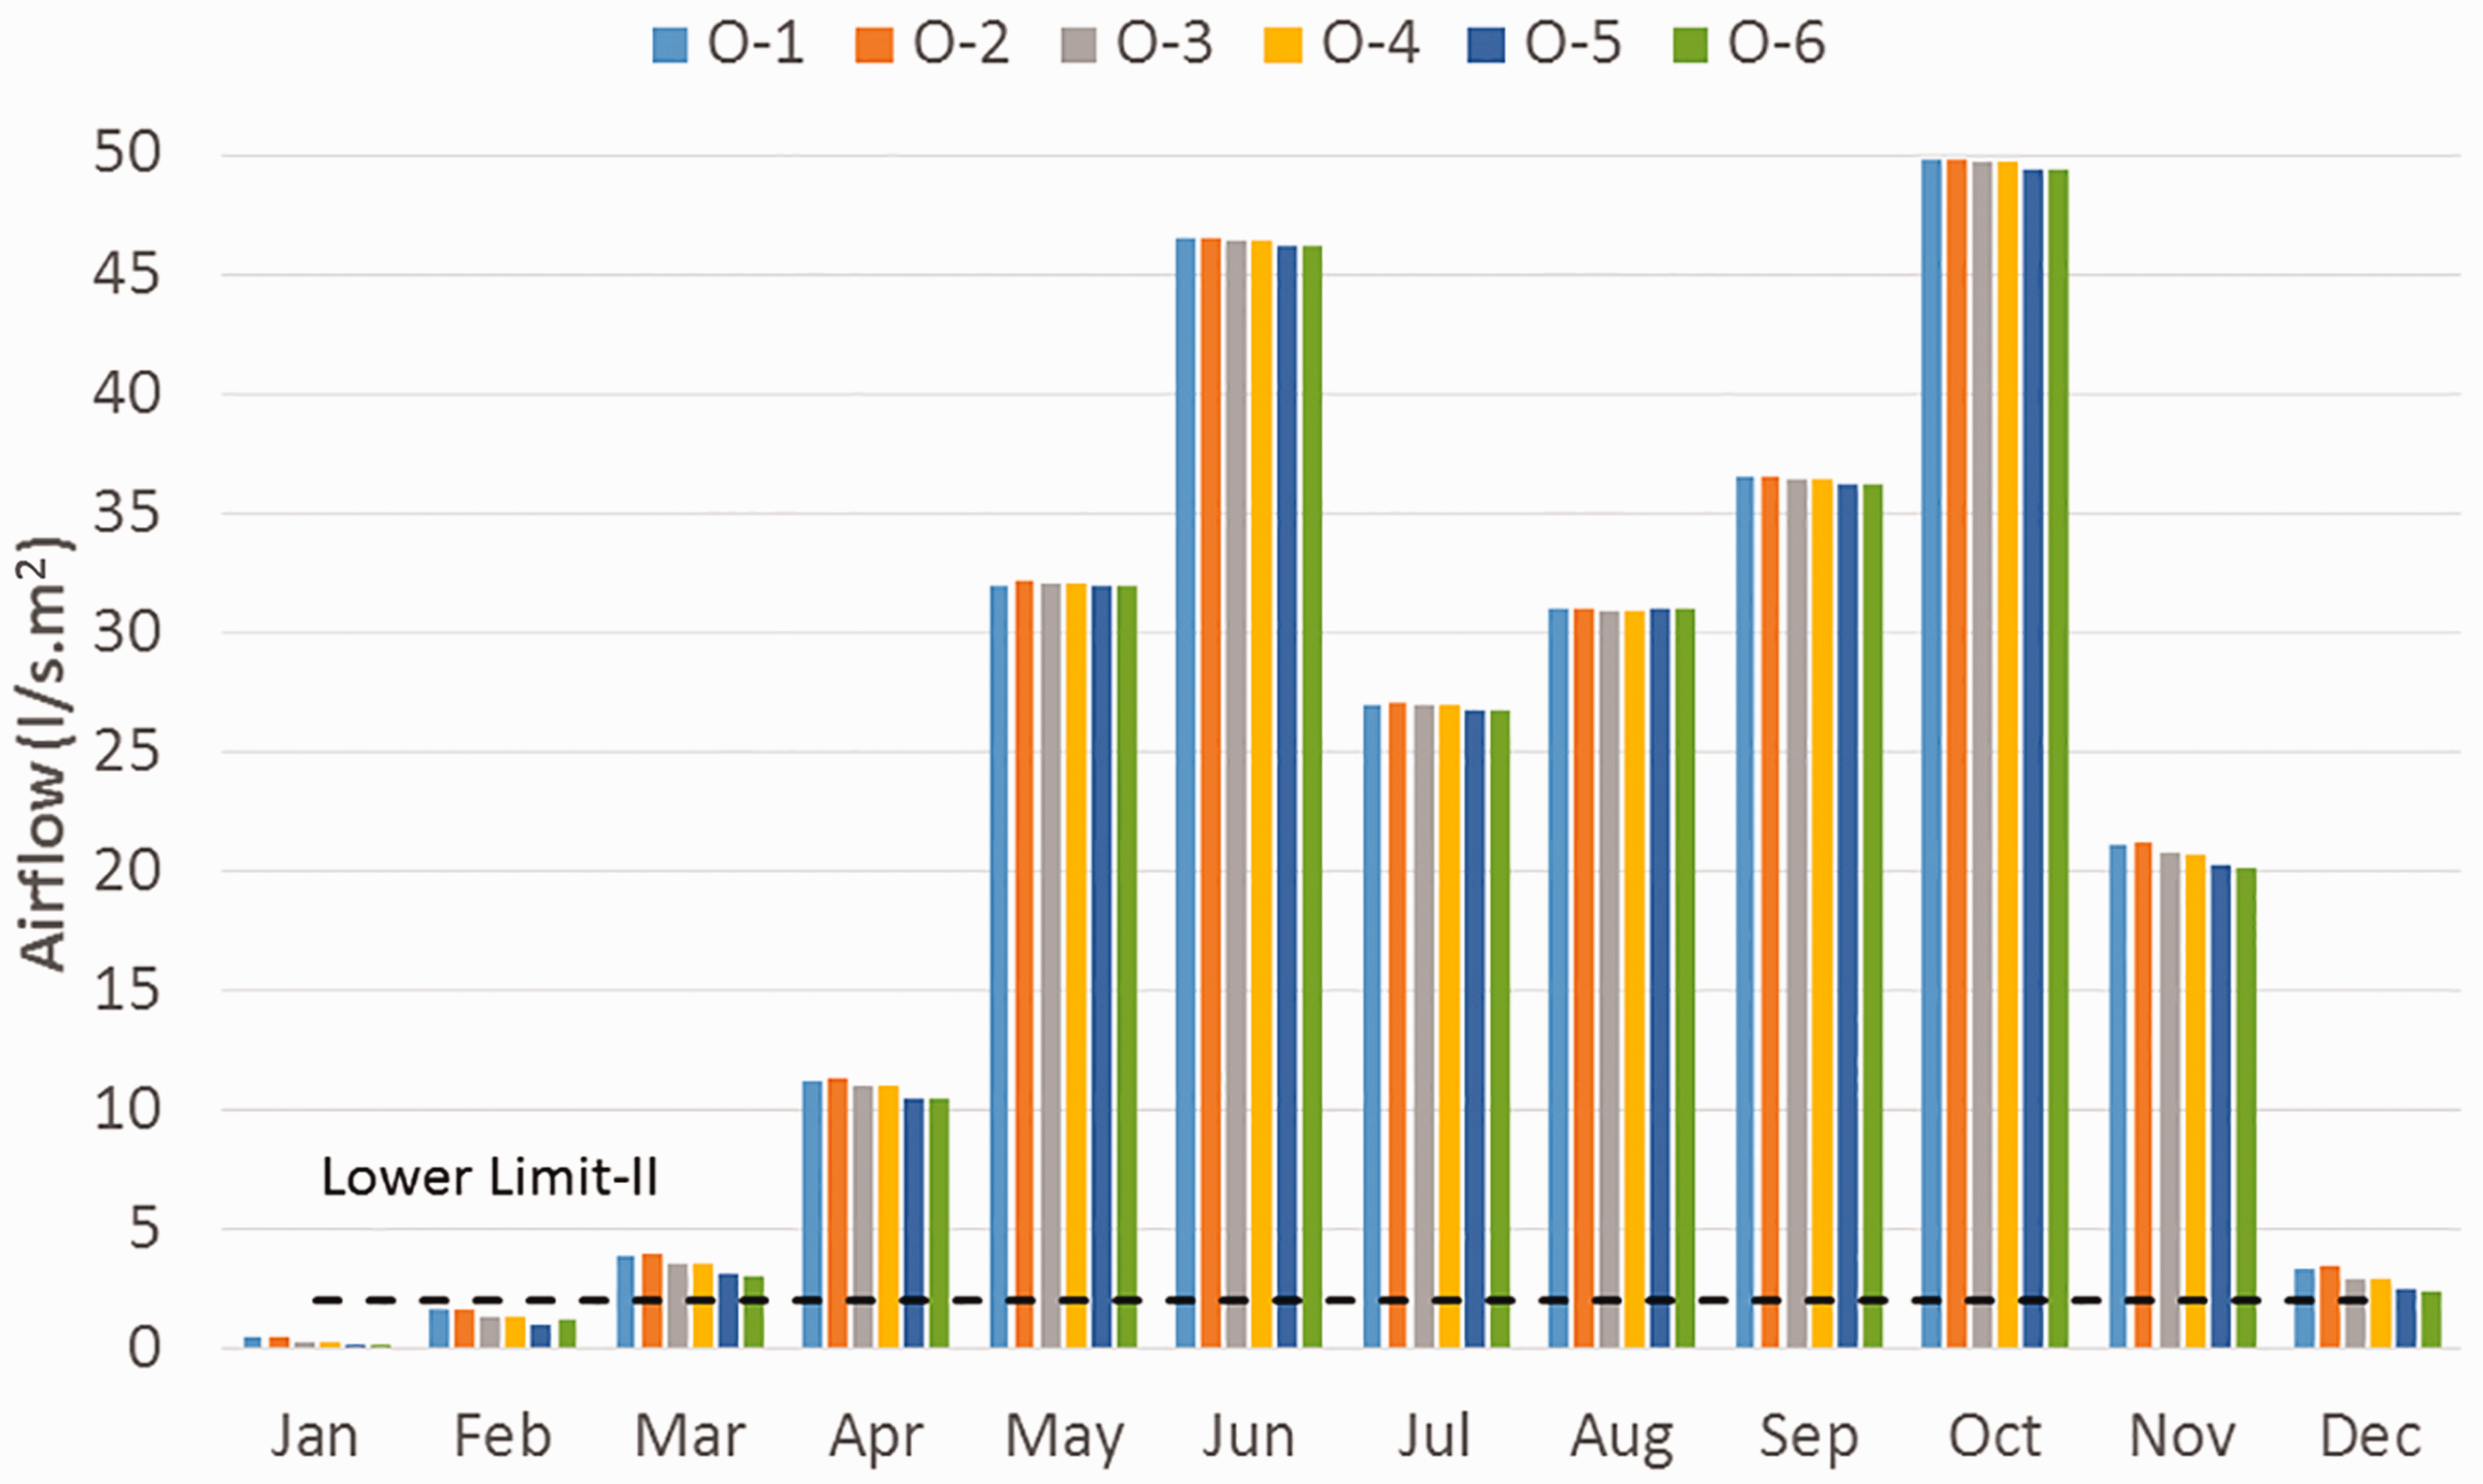
Monthly airflow rates for the selected trade-off cases.
Concentrations of carbon dioxide
Figure 5 outlines the number of hours for which CO2 concentration is below 1000 ppm during office working hours. The large size offices provide around 1730 h, out of 2088 h per annum, corresponding to approximately 83% of the time. Whereas, medium and small size offices offer 80% and 78%, respectively, of the office hours within the CO2 threshold. The average concentration of CO2 in the warm and cool periods is below the WHO threshold. Conversely, when windows are closed during occupancy time, CO2 levels exceeded the recommended limit. For instance, the concentration of CO2 rises to over 1500 ppm in January when the windows of small and medium open-plan offices were closed all the time due to cold outside temperatures, regardless of the office or window proportion and orientation, as illustrated in Figure 8.
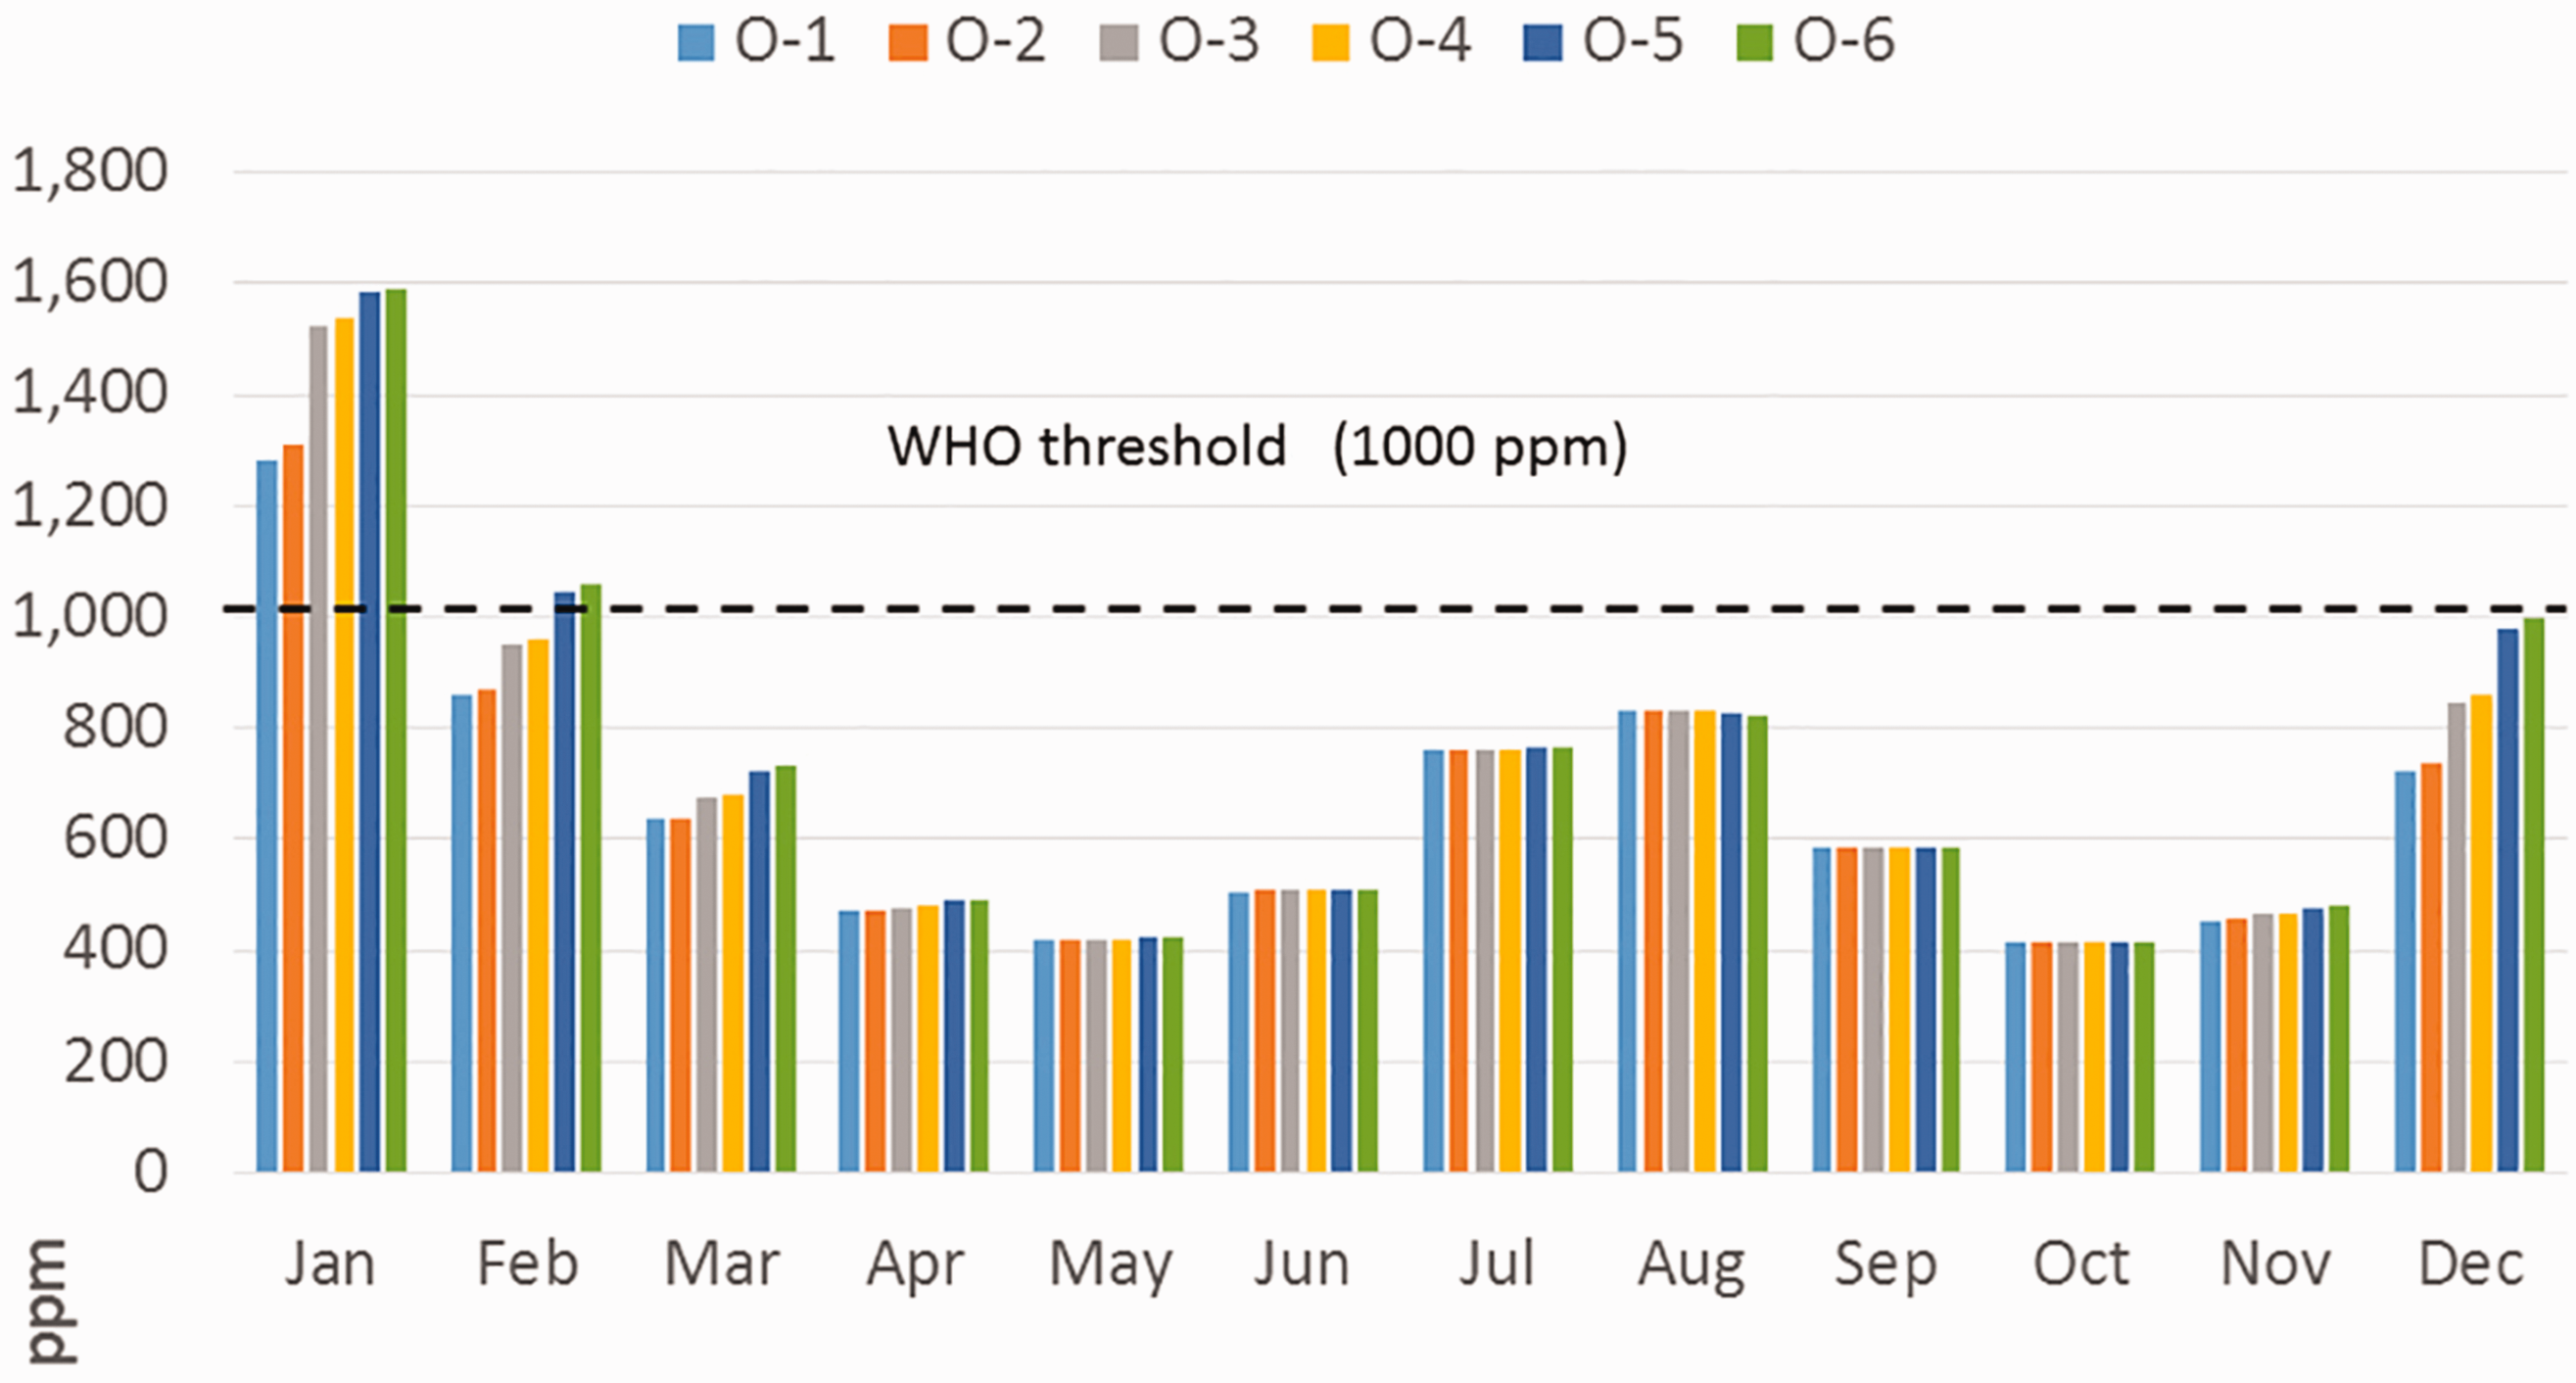
Monthly carbon dioxide concentration levels for the selected trade-off cases.
The MM cut-off temperature of 32°C resulted in closing the windows during the hot days of the summer and thus increasing the level of CO2. Opening only a quarter of the window cannot achieve lower CO2 levels than 1000 ppm in the summer months, particularly July and August, in both cross-window orientations. Nevertheless, increasing the openable portion of the windows to half of the window area can provide an office indoor CO2 level within the WHO threshold throughout the warm period in the case of a pair of north and south cross-windows. While in the case of eastern and western-oriented windows, the 50% window-opening ratio cannot lower the level below the 1000-ppm limit in August. In this study, fractions of openable windows were assumed to be controlled by an automated scheme based on outside temperature conditions and the MM strategy.
In the warm period, different open-plan office sizes as well as nearly all the office aspect ratios performed similarly in terms of indoor CO2 concentration. The large size office offered a slightly lesser amount of CO2 when the windows are placed in the north and south oriented walls. Conversely, placing windows in the east and west orientations made the small office more efficient. Therefore, the window design parameters can be more significant than office layout design, namely proportion and size. In the winter, the large size office performed noticeably better than the medium and small size offices in terms of the level of CO2 concentration. Furthermore, a 1:1.5 layout aspect ratio was found to be more effective at diluting indoor contaminants in all office sizes.
Generally, greater window openings allow more fresh airflow to enter a space, which can reduce the CO2 contamination level. In the case of smaller window openings (i.e. 25%), cross-ventilation from the east- and west-facing windows had a lesser CO2 concentration compared to the north and south window orientations. However, when half of the windows are open, north and south windows could be more effective in removing CO2 pollutants in all open-plan office sizes.
Adaptive thermal comfort results
These results represent only the NV potential for TC when it is applied alone, excluding TC performance during AC hours of the MM system. Thus, the discomfort hours are supposed to be eliminated by the supplementary heating and cooling system. Figure 9 shows that the NV strategy can provide acceptable thermal conditions of adaptive comfort for about half of the occupancy time. The minimum number of comfort hours is found in January (less than 10%), December (less than 20%) and February (less than 25%) in the winter and in July (less than 15%) and August (less than 30%) in the summer, respectively. Therefore, the AC mode needs to be in operation most of the time during these months compared to the rest of the year. Nevertheless, October and May offer approximately 90% to 100% comfort hours, constituting a free-running period, while up to 50%–70% of the working hours appear within the adaptive comfort limits of category II in September, April, June and November.
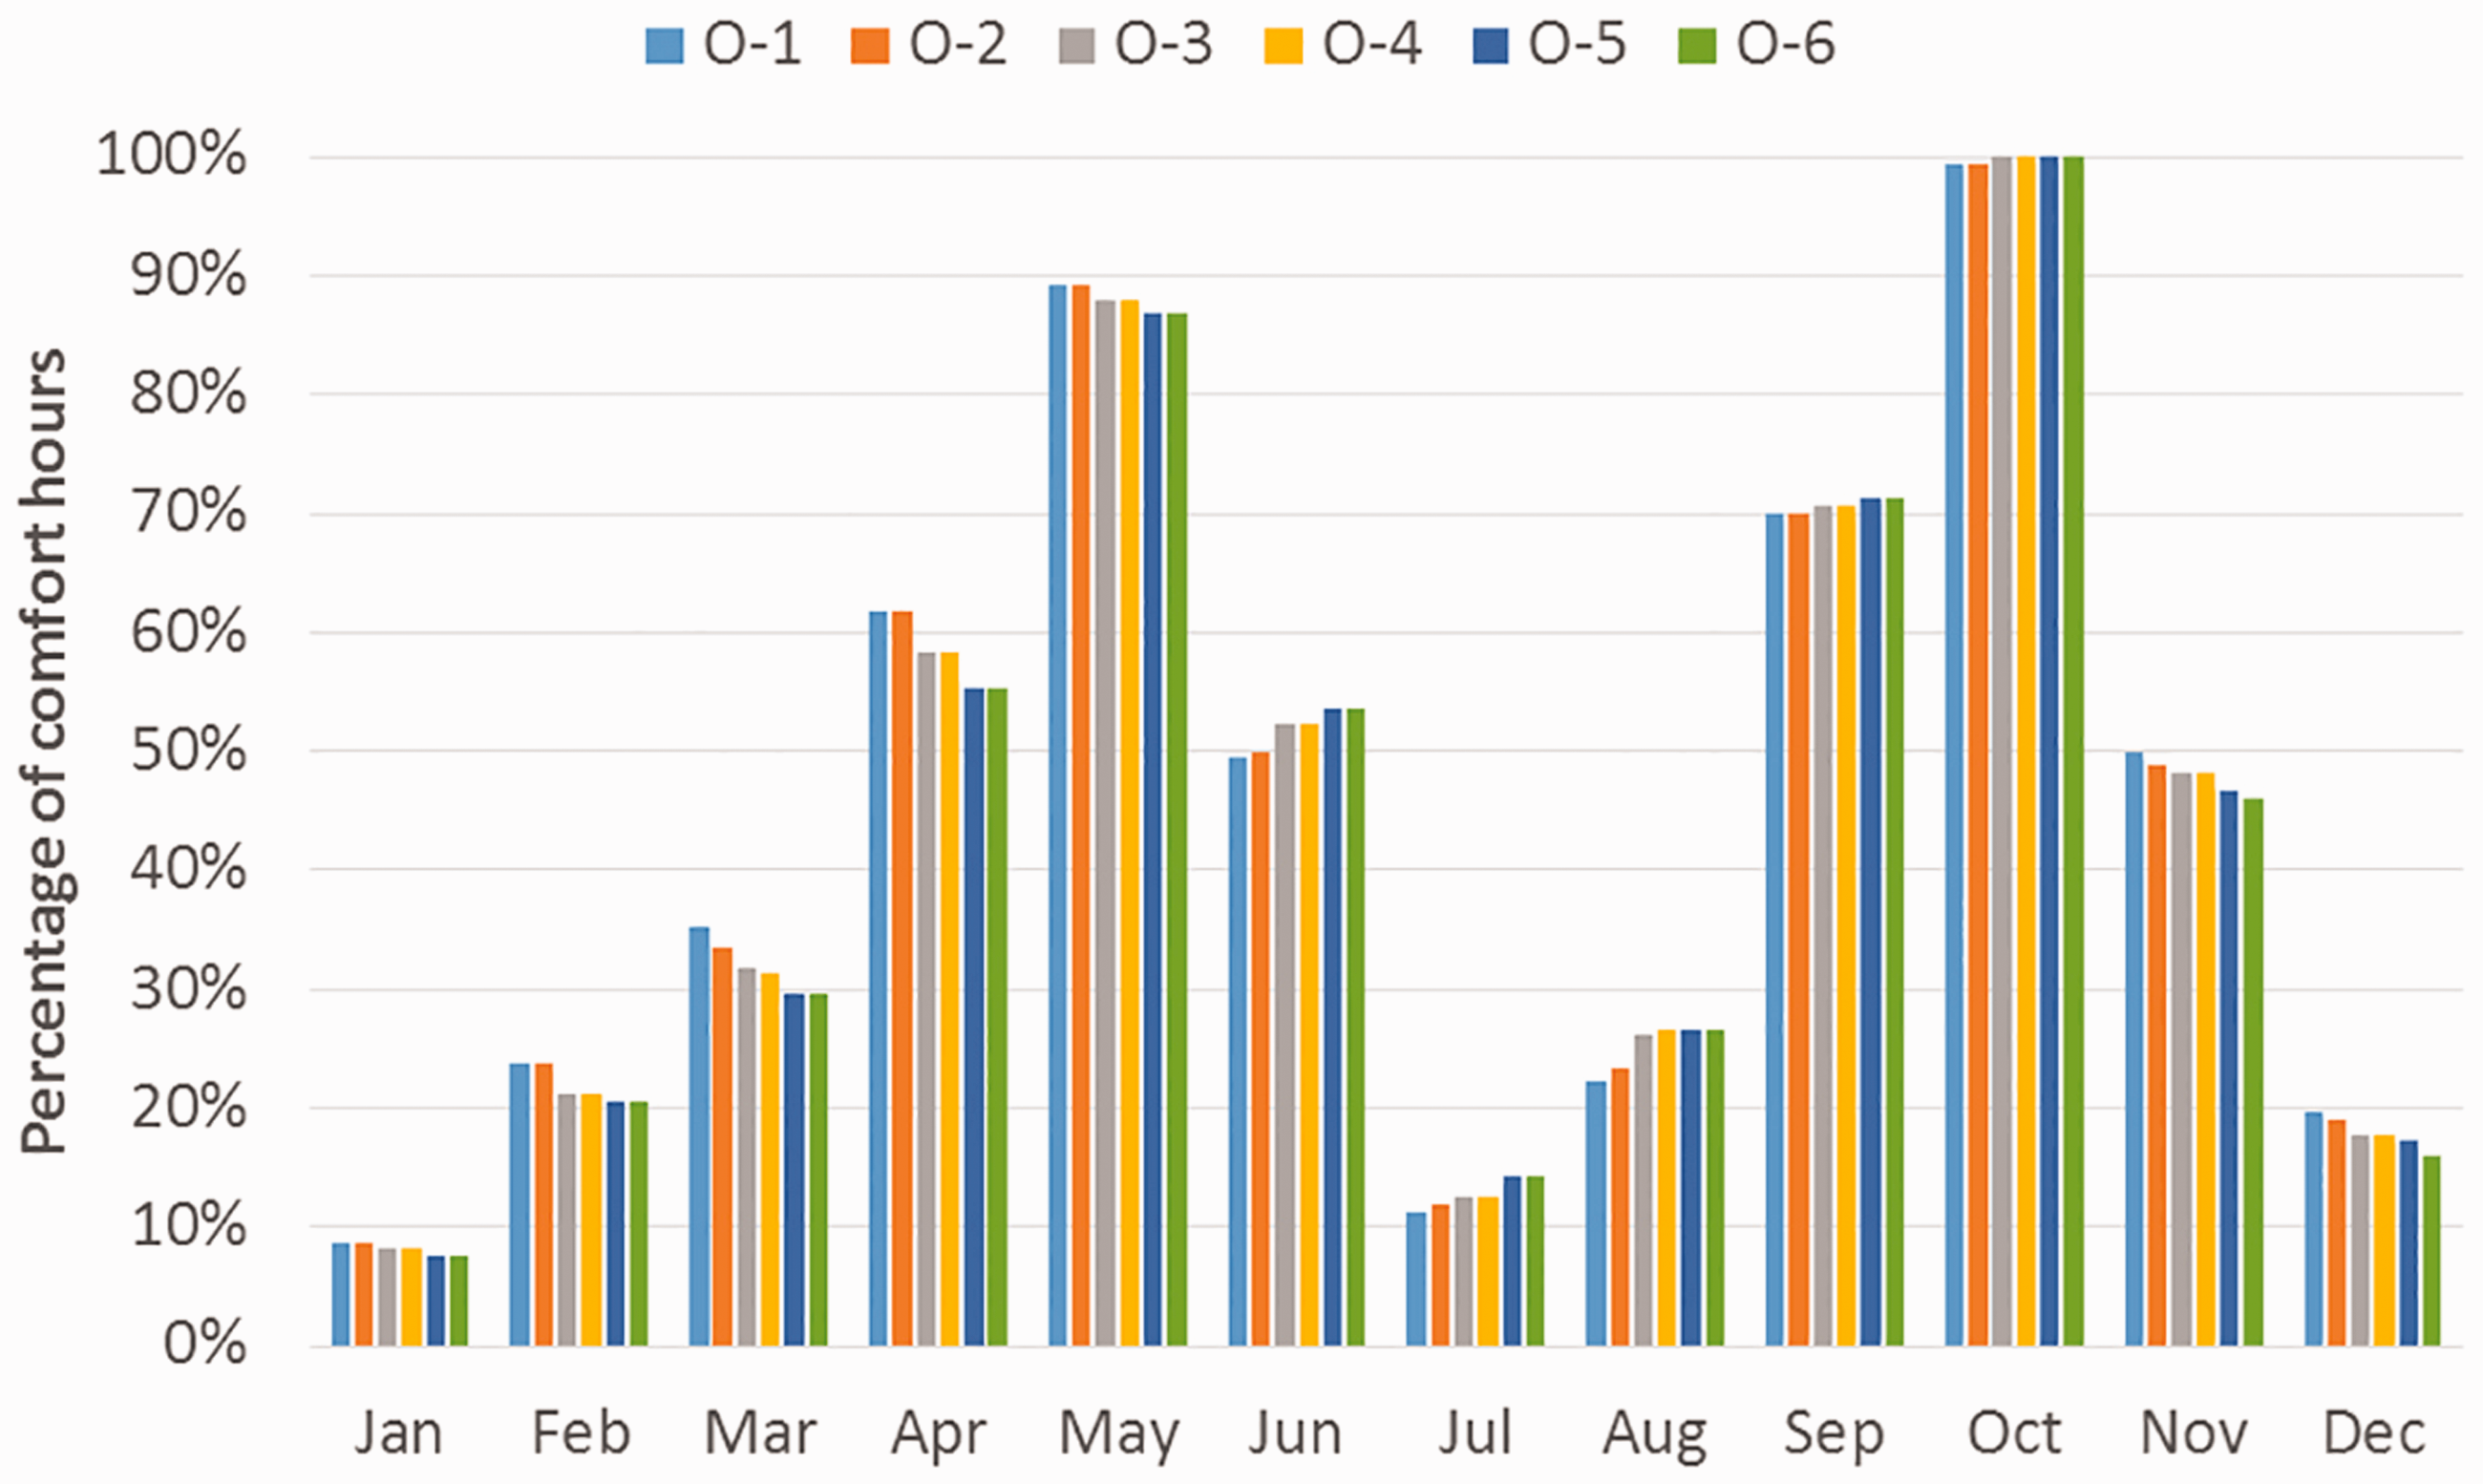
Monthly percentages of comfort hours based on the adaptive comfort limits of category II for the selected trade-offs.
Large and medium sized offices perform better in the cool months, while the small size office is more efficient in warm months. Office proportion does not have a significant effect on indoor TC. Considering category I of the adaptive comfort model, longer offices can offer slightly more acceptable hours, while the case is opposite for categories II and III. In general, an aspect ratio of 1:1.5 is the most effective solution in terms of providing comfort hours. Larger window openings offer more comfort hours in any window orientation. Overall, only east- and west-facing cross-windows can achieve a higher number of acceptability hours in category I; however, north and south windows have more categories II and III acceptable hours. Figure 10 shows the scatter plot of hourly indoor operative temperature in accordance with an outdoor running mean temperature for each month, using the category II upper and lower limits of the EN 15251:2007 standard for the optimal design scenario (i.e. O-1). The hours appearing in between the upper and lower limits represent the acceptable TC hours for category II. The hours below the lower limit are the winter occupancy hours, while those exceeding the upper limit correspond to the summertime, particularly July and August.
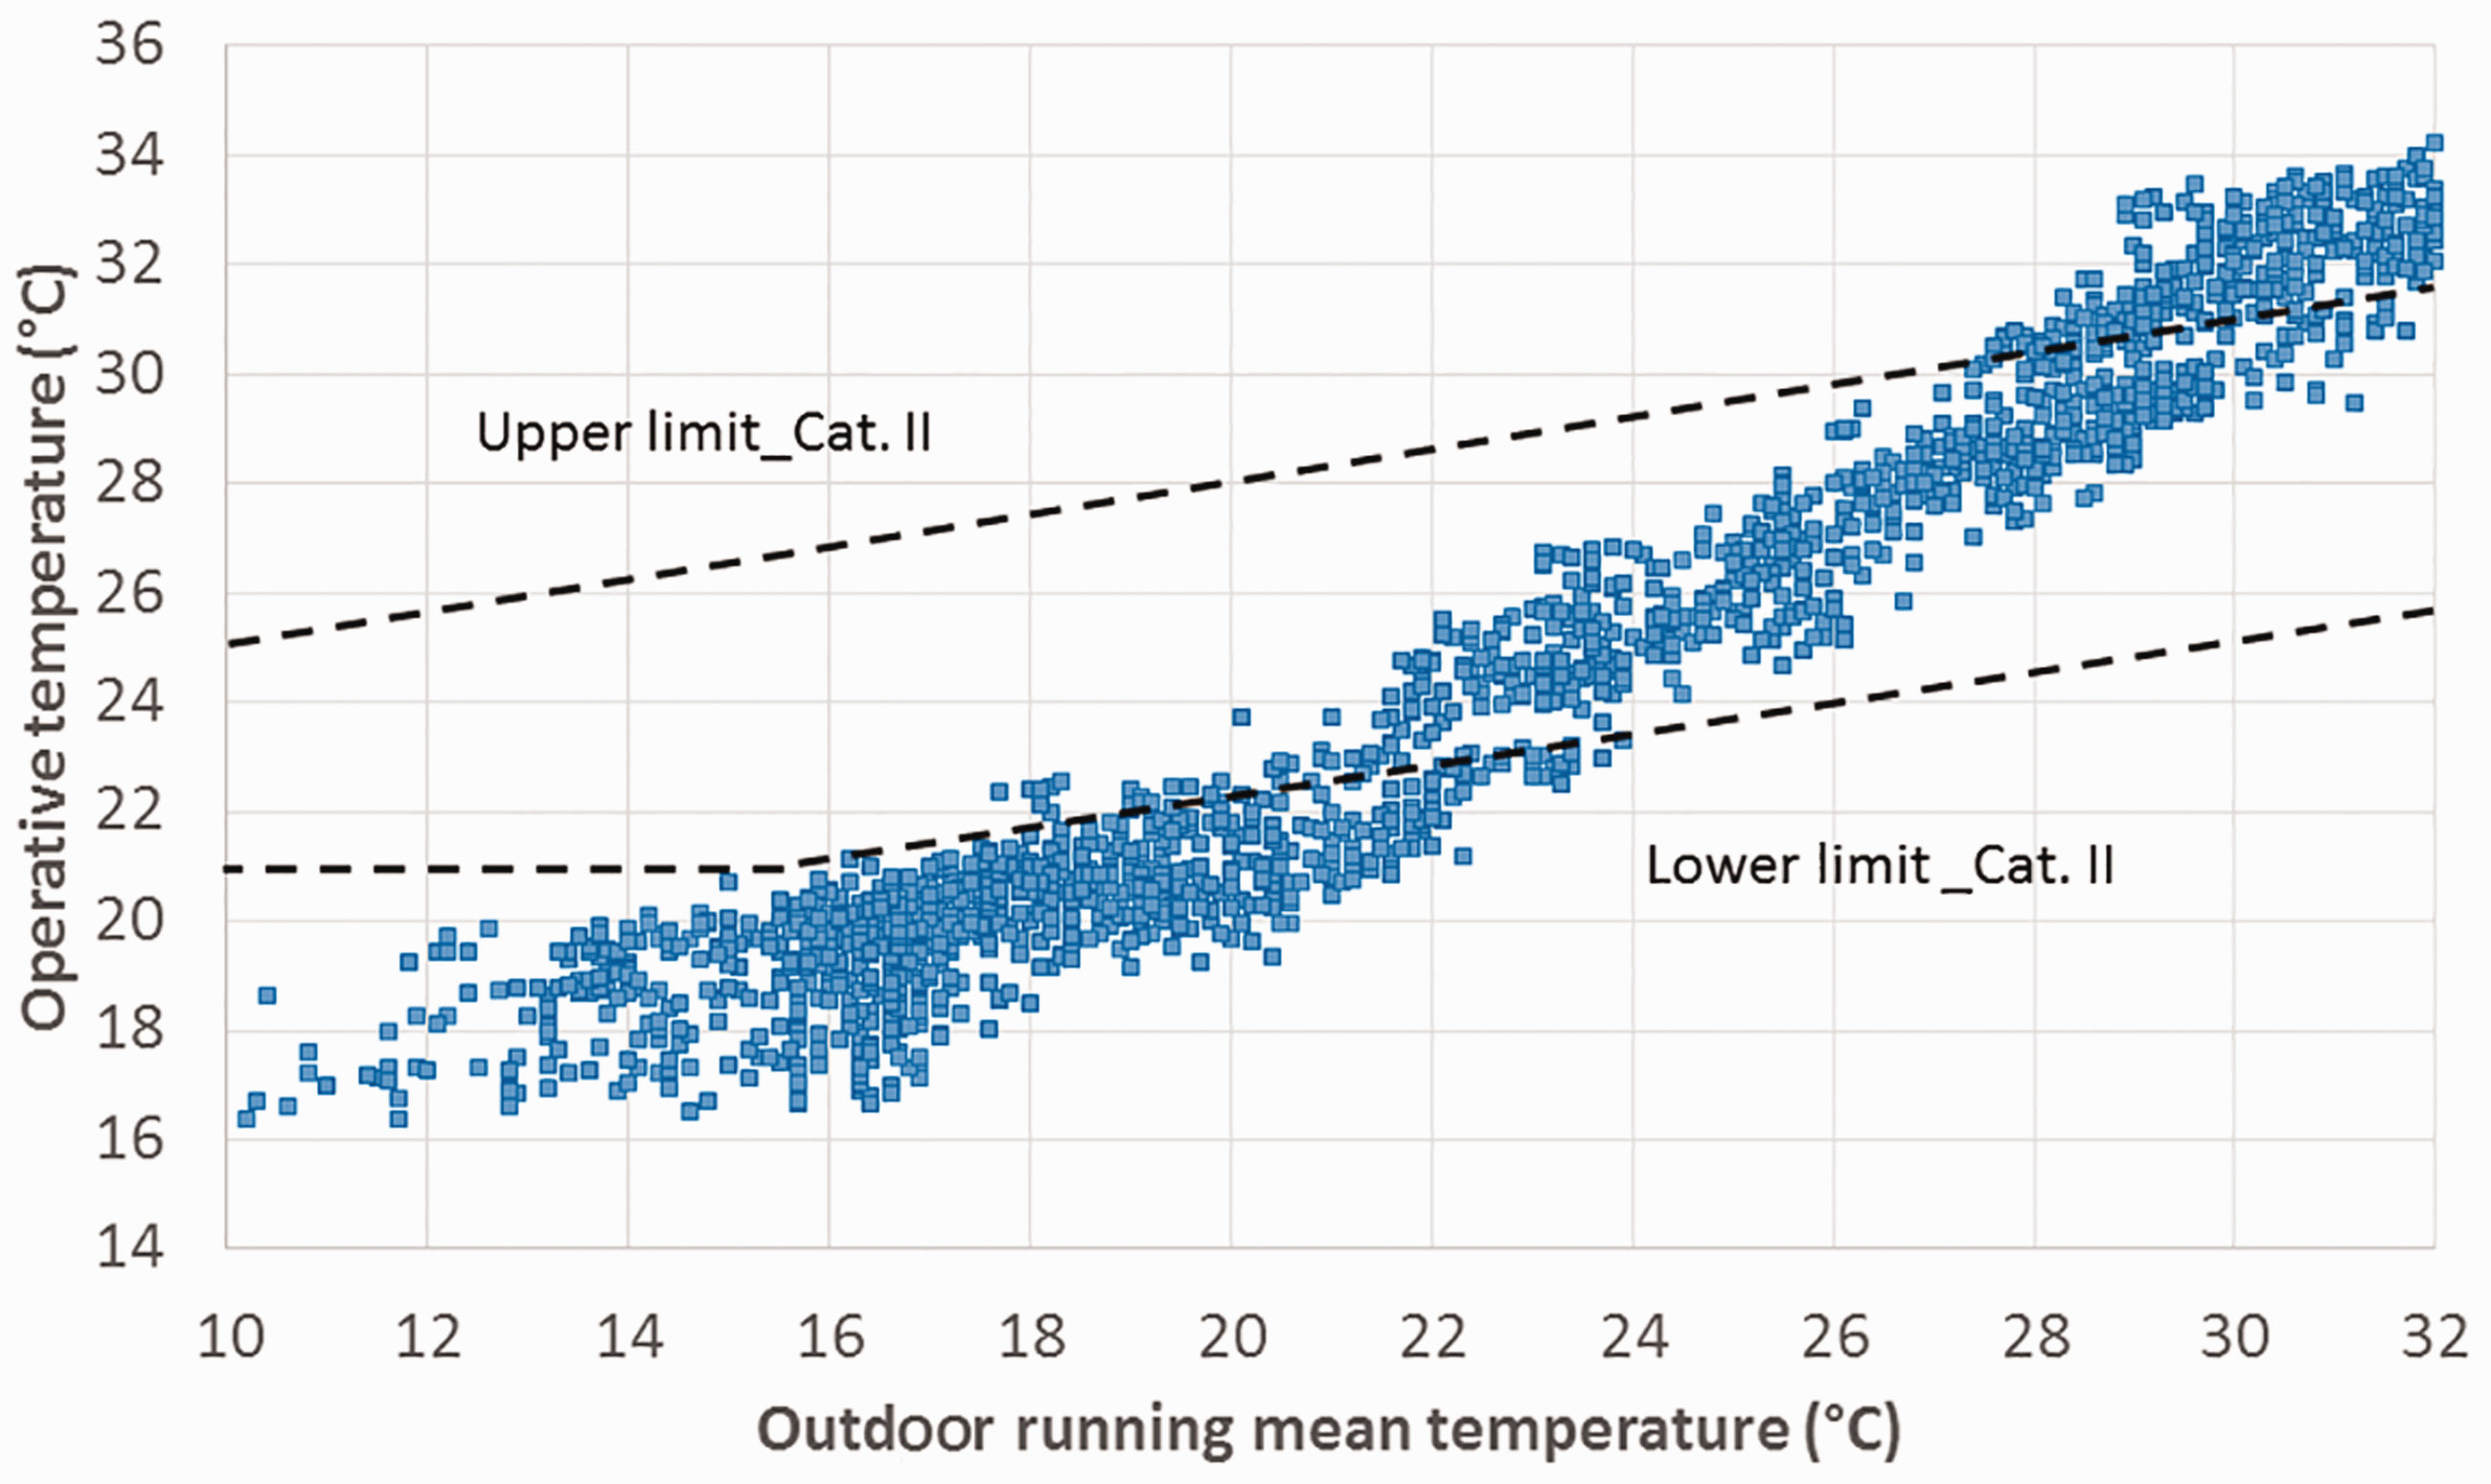
Hourly indoor operative temperature for category II of the adaptive comfort in the case of O-1.
Air-conditioning loads of the mixed-mode strategy and a fully air-conditioned case
The operation of AC within the MM system started when the indoor operative temperature was lower than 20°C in the cool period and higher than 31.7°C in the warm period. It was observed that varying window opening ratios do not change the heating loads for any pair of window orientations in any office aspect ratio. However, initial data analysis showed that larger window openings could reduce the cooling load in the warm period by about 33%, 37% and 40% in the case of north/south oriented windows for the small, medium and large open-plan office, respectively, and about 20% in the case of the east- and west-facing windows for all office sizes and proportions. The heating load rises with increases in the length of the open-plan office, while the cooling load decreases with changes in the space aspect ratios from 1:1 to 1:1.5 to 1:2 in all studied office sizes.
Referring to S/N and ANOVA analysis, as well as the annual sum of the heating and cooling loads per m2, reported in Table 10 and Figure 5, an aspect ratio of 1:1.5 indicates the most efficient office layout proportion, and larger offices are more energy-efficient design solutions than medium and small open-plan offices by 11% and 18%, respectively. Regardless of the office size and proportion, cross-windows in the northern and southern external walls represent the most efficient window orientations. In other words, these windows allow a greater amount of NV to be utilised, thus resulting in less dependence on active systems. Moreover, the heating load of various office sizes and aspect ratios with east and west cross-windows is double that of the same load in the case of north and south windows. An interpretation of this reason might be the higher amount of solar radiation received by east and west window orientations than the northern and southern windows in the absence of shading devices, leading to rising indoor operative temperatures, and subsequently, more energy spent to cool the indoor space. The findings suggest that the deeper spaces of the longitudinal offices receive less solar radiation from the assigned windows in the winter that can heat up the spaces. Conversely, NV can be more effective in longer offices, which results in less cooling demand in the summer months.
Figure 11 presents the monthly AC loads for near-optimal design scenarios. The maximum loads were recorded in July and August, in which high outdoor running mean temperatures result in elevated indoor operative temperatures, meaning that the category II upper limit 31.7°C (cooling setpoint) is exceeded during most of the occupancy time. In all the design cases, April, May, October and November represent free-running months, while in other months, both NV and AC modes of the MM system were reciprocally in use. However, this glimpse is not necessarily identical to a situation where the AC operation is controlled by the adaptive upper and lower thresholds of the intended comfort category. In this study, constant heating and cooling setpoints were applied to AC activation, which can be interpreted as the current dynamic simulation limitations. In this situation, the comfort hours indicator better explains the free-running period.
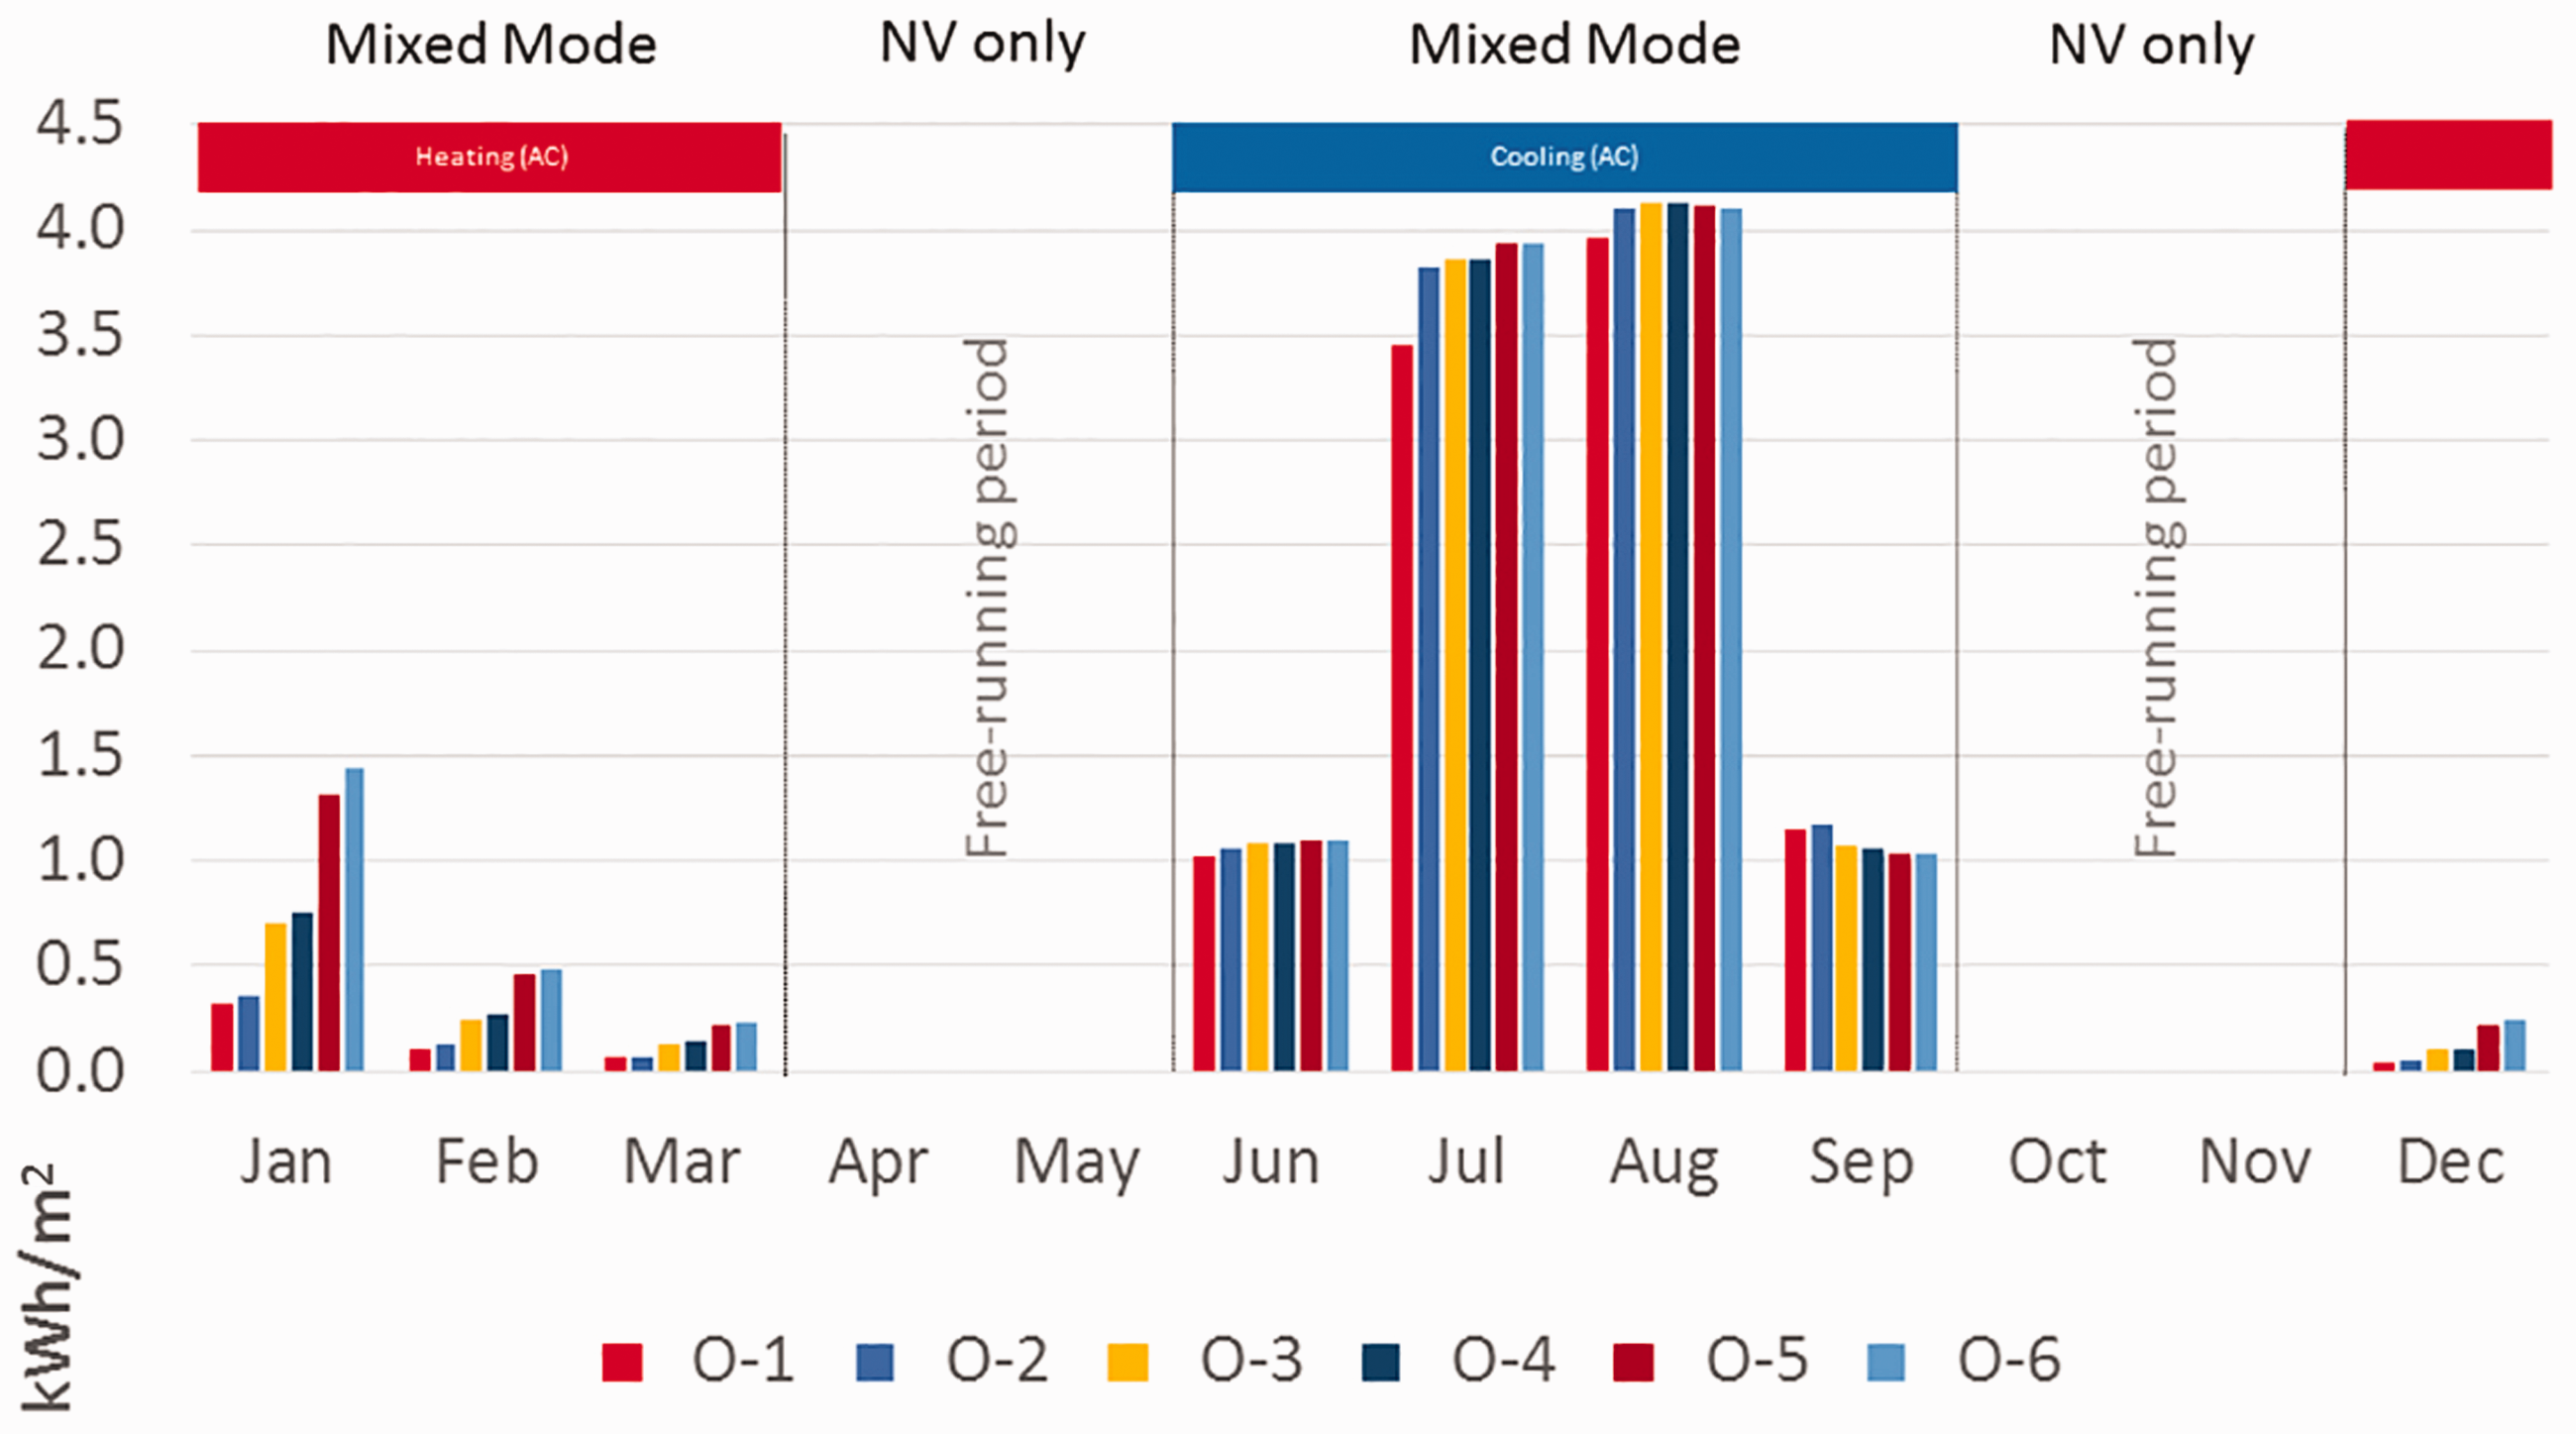
Monthly air-conditioning loads for the near-optimal design solutions.
To evaluate the performance of the MM system in opposition to a fully AC case, the AC loads of an optimal MM solution (i.e. O-1) were compared to a similar design scenario with a mechanically conditioned indoors (no NV is allowed) using the heating and cooling temperature ranges suggested in category II of the EN 15251:2007 standard (20°C−26°C). Figure 12 illustrates the AC loads (kWh/m2) for an O-1 design solution in the case of MM and full AC system. In the heating season, both systems performed similarly by reason of assigning the same heating setpoint for both systems (20°C), noting that the AC system consumed more energy in January, February, March and November. April stands as a free-running month even in the full AC system, which was the same case for the MM strategy. In July and August, the fully air-conditioned case requires approximately 11.0 kWh/m2 with about 7.0 kWh/m2 more compared to the MM strategy. The total annual heating and cooling loads for the MM and fully AC scenarios are 10.14 and 46.82 kWh/m2, respectively. Therefore, the MM strategy can lower heating and cooling loads by 78.34% compared to a fully air-conditioned open-plan office, considering the design specifications of the O-1 scenario in the climatic conditions of Famagusta. An approximately similar reduction amount in AC loads is also reported in the results of a field study, 43 in which the MM office building required less than a quarter of the energy required by a similar fully air-conditioned building.
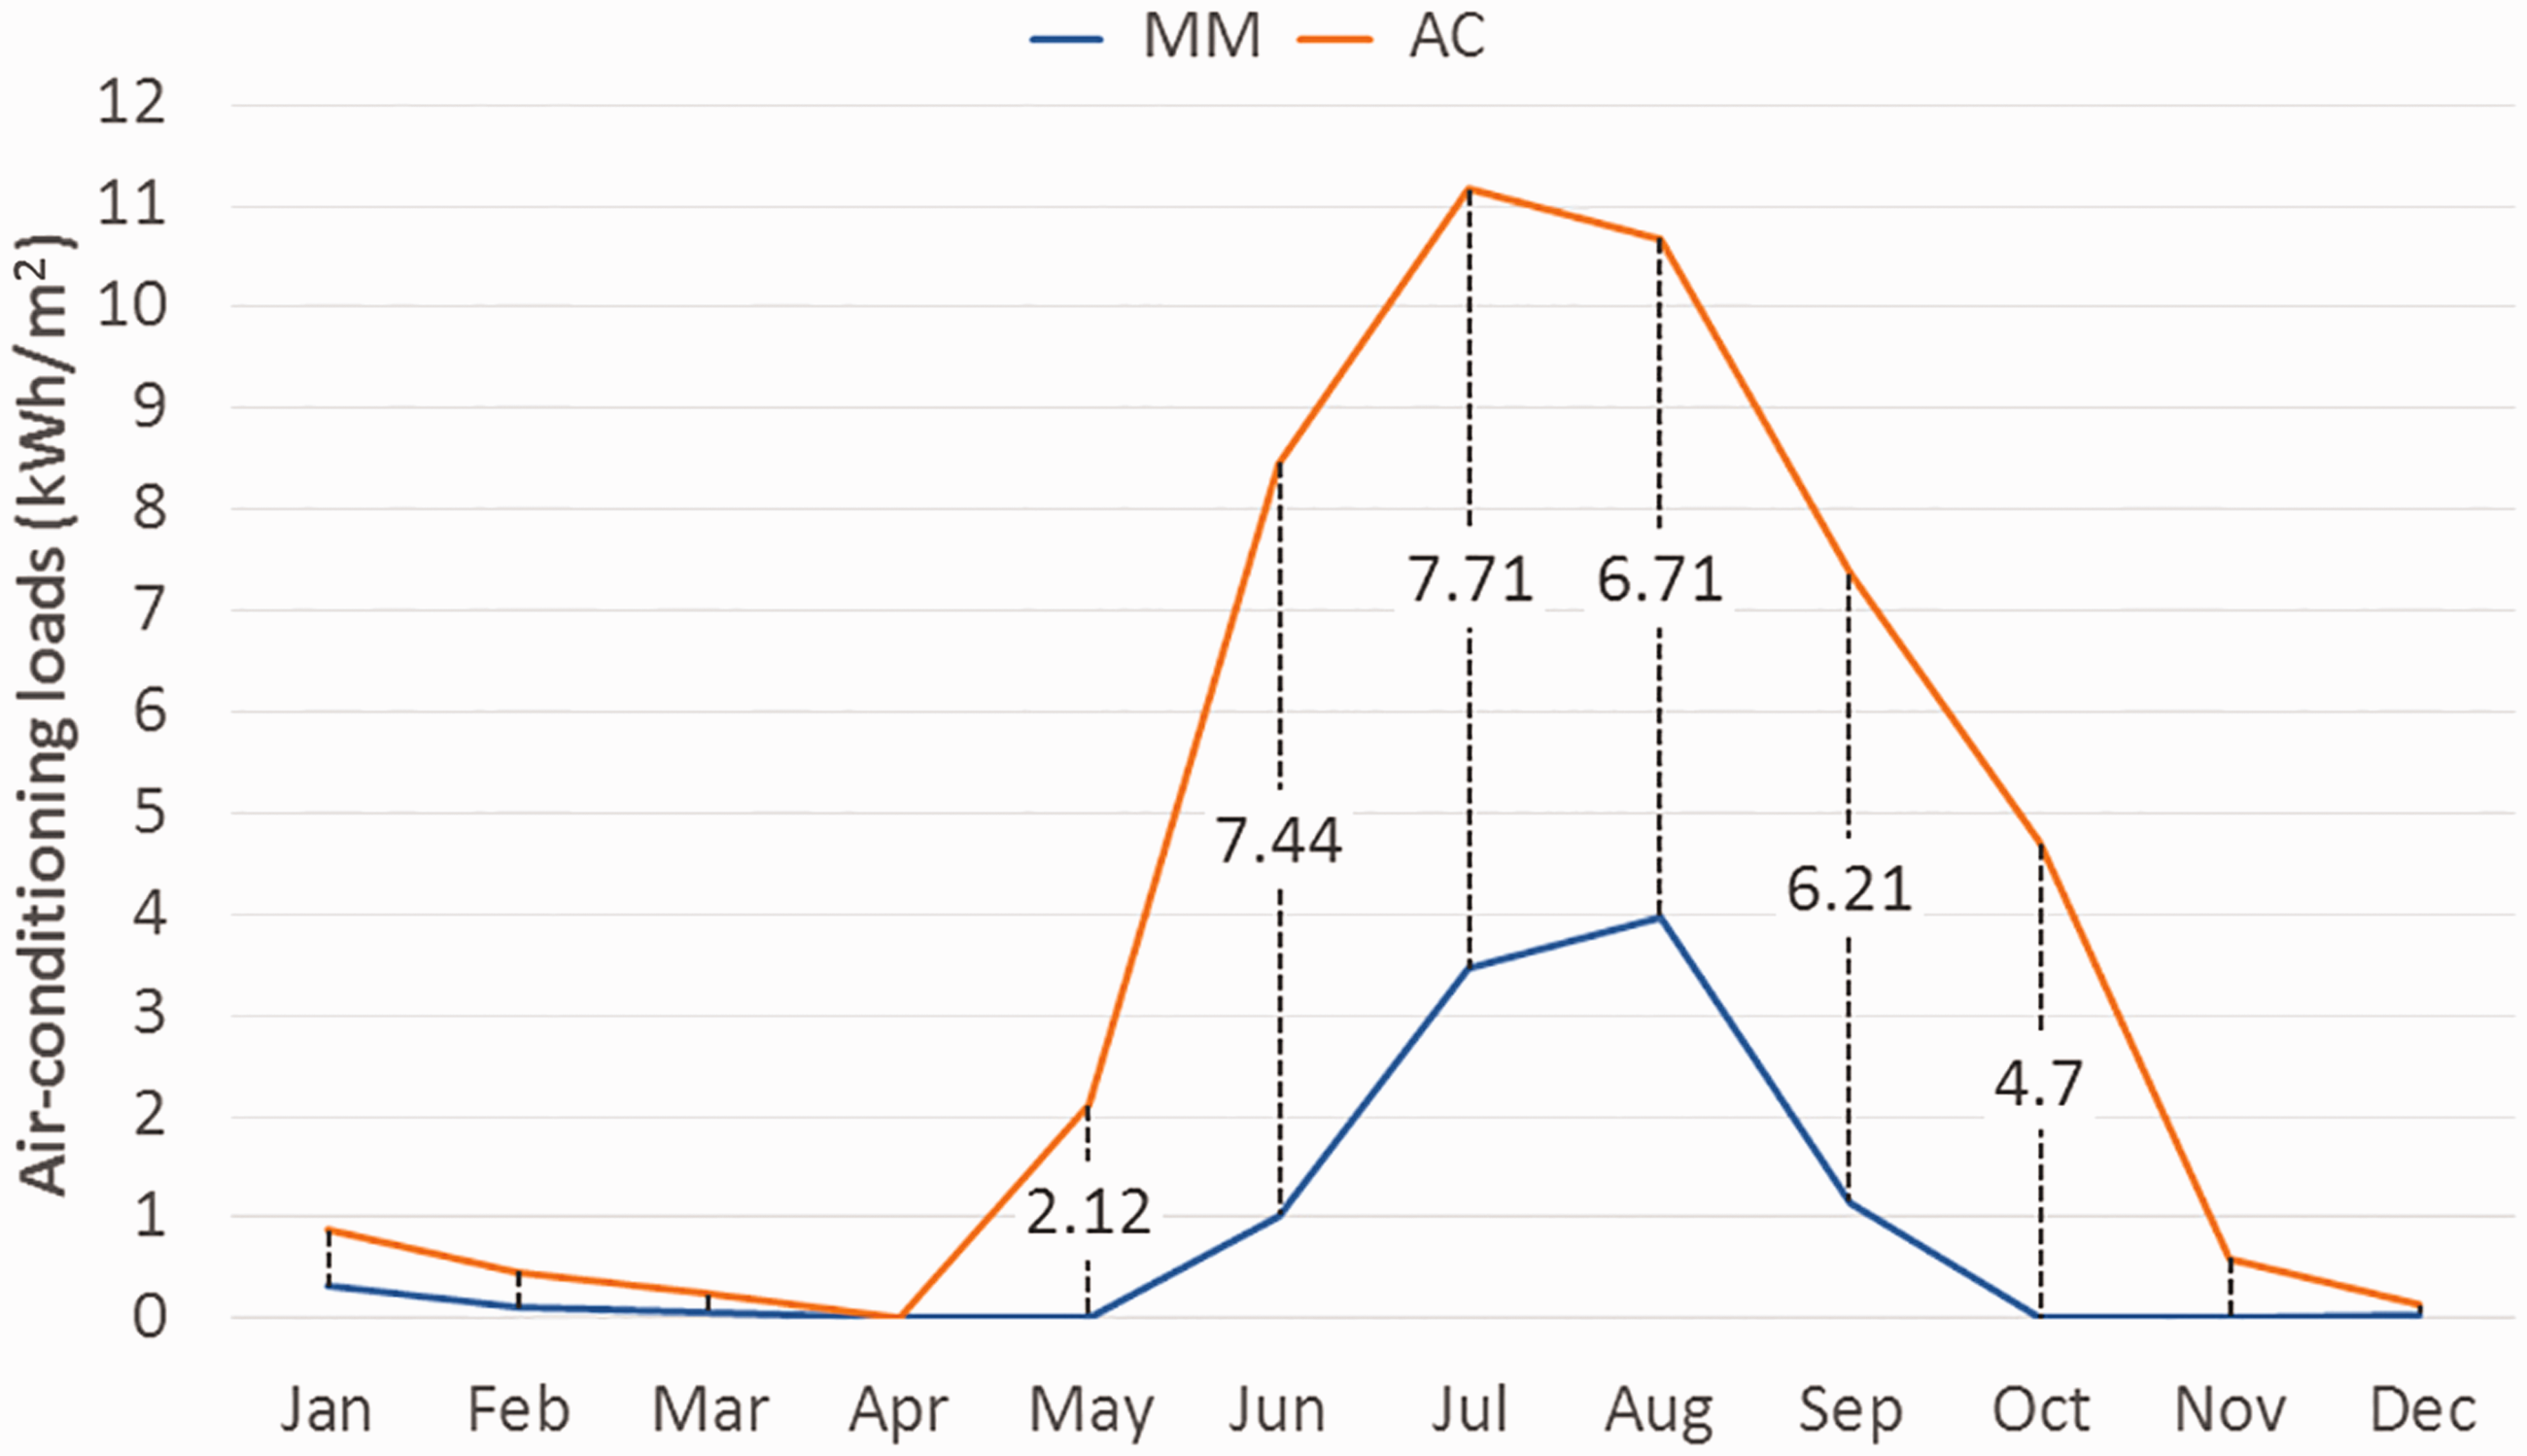
Monthly air-conditioning loads for the O-1 case in MM and fully AC systems.
Validation test: predictions of model simulation and ventilative cooling method to natural ventilation performance
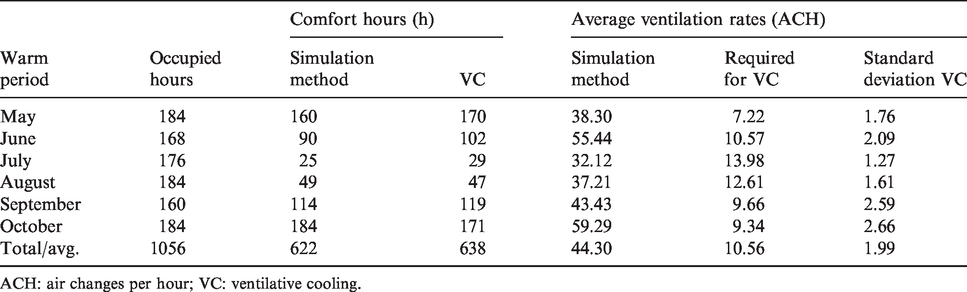
Although there are evidences supporting the accuracy of the data collected from dynamic simulation method when compared to field experiments in similar climatic conditions, 16 a validation test was also performed in this study. The method of ventilative cooling (VC) was used, taking a small office size with the O-5 trade-off characteristics as a representative design scenario for a comparative study. The results of the simulation model associated with NV performance for potential adaptive comfort hours and airflow rates were compared with the results of the VC method. The comparison involves the VC potential for providing comfort hours in the warm period (i.e. May to October). Table 16 reports the required VRs and standard deviation for the VC and the amount of airflow measured in the dynamic simulation, as well as the estimated comfort hours by each of the simulation and VC methods. The minimum airflow rates required by VC to maintain indoor TC within category II of the EN 15251:2007 standard adaptive comfort are surpassed by the designed window opening scheme and MM cut-off temperature. Hence, the window opening behaviour can efficiently provide the effective airflow rate needed for cooling in the summer months when the outdoor temperature permits direct VC.
The number of comfort hours and average airflow rates predicted by dynamic simulation and VC method.
ACH: air changes per hour; VC: ventilative cooling.
Figure 13 shows the percentage of comfort hours for each month predicted by both the simulation and the VC as well as the percentage difference between them. No significant differences were observed between the simulation results and the VC method in terms of the percentage of comfort hours. In the warm period, the prediction difference between the two methods does not exceed a day, specifically 16 h. The total number of office working hours in the studied months is 1056 h. Accordingly, the simulation model and VC method predict 622 and 638 h of comfort, respectively, corresponding to 58.9% and 60.4%. In reference to findings of a study, 50 which claims that the VC method overestimates the number of comfort hours for direct VC, the comparatively lower number of comfort hours predicted by the simulation analysis method in May, June, July and September can be considered as reasonable. In addition, the VC method uses a standard comfort zone for its evaluation criteria, in which the upper limit does not change in accordance with the outdoor temperatures. Thus, an underestimation of the VC potential occurs compared to the adaptive TC-based control utilised in the data analysis of the simulation model, which can be noticed in the cases of August and October. Overall, the results of both approaches present a relatively similar prediction of comfort hours; therefore, the simulation data are evidently reliable.
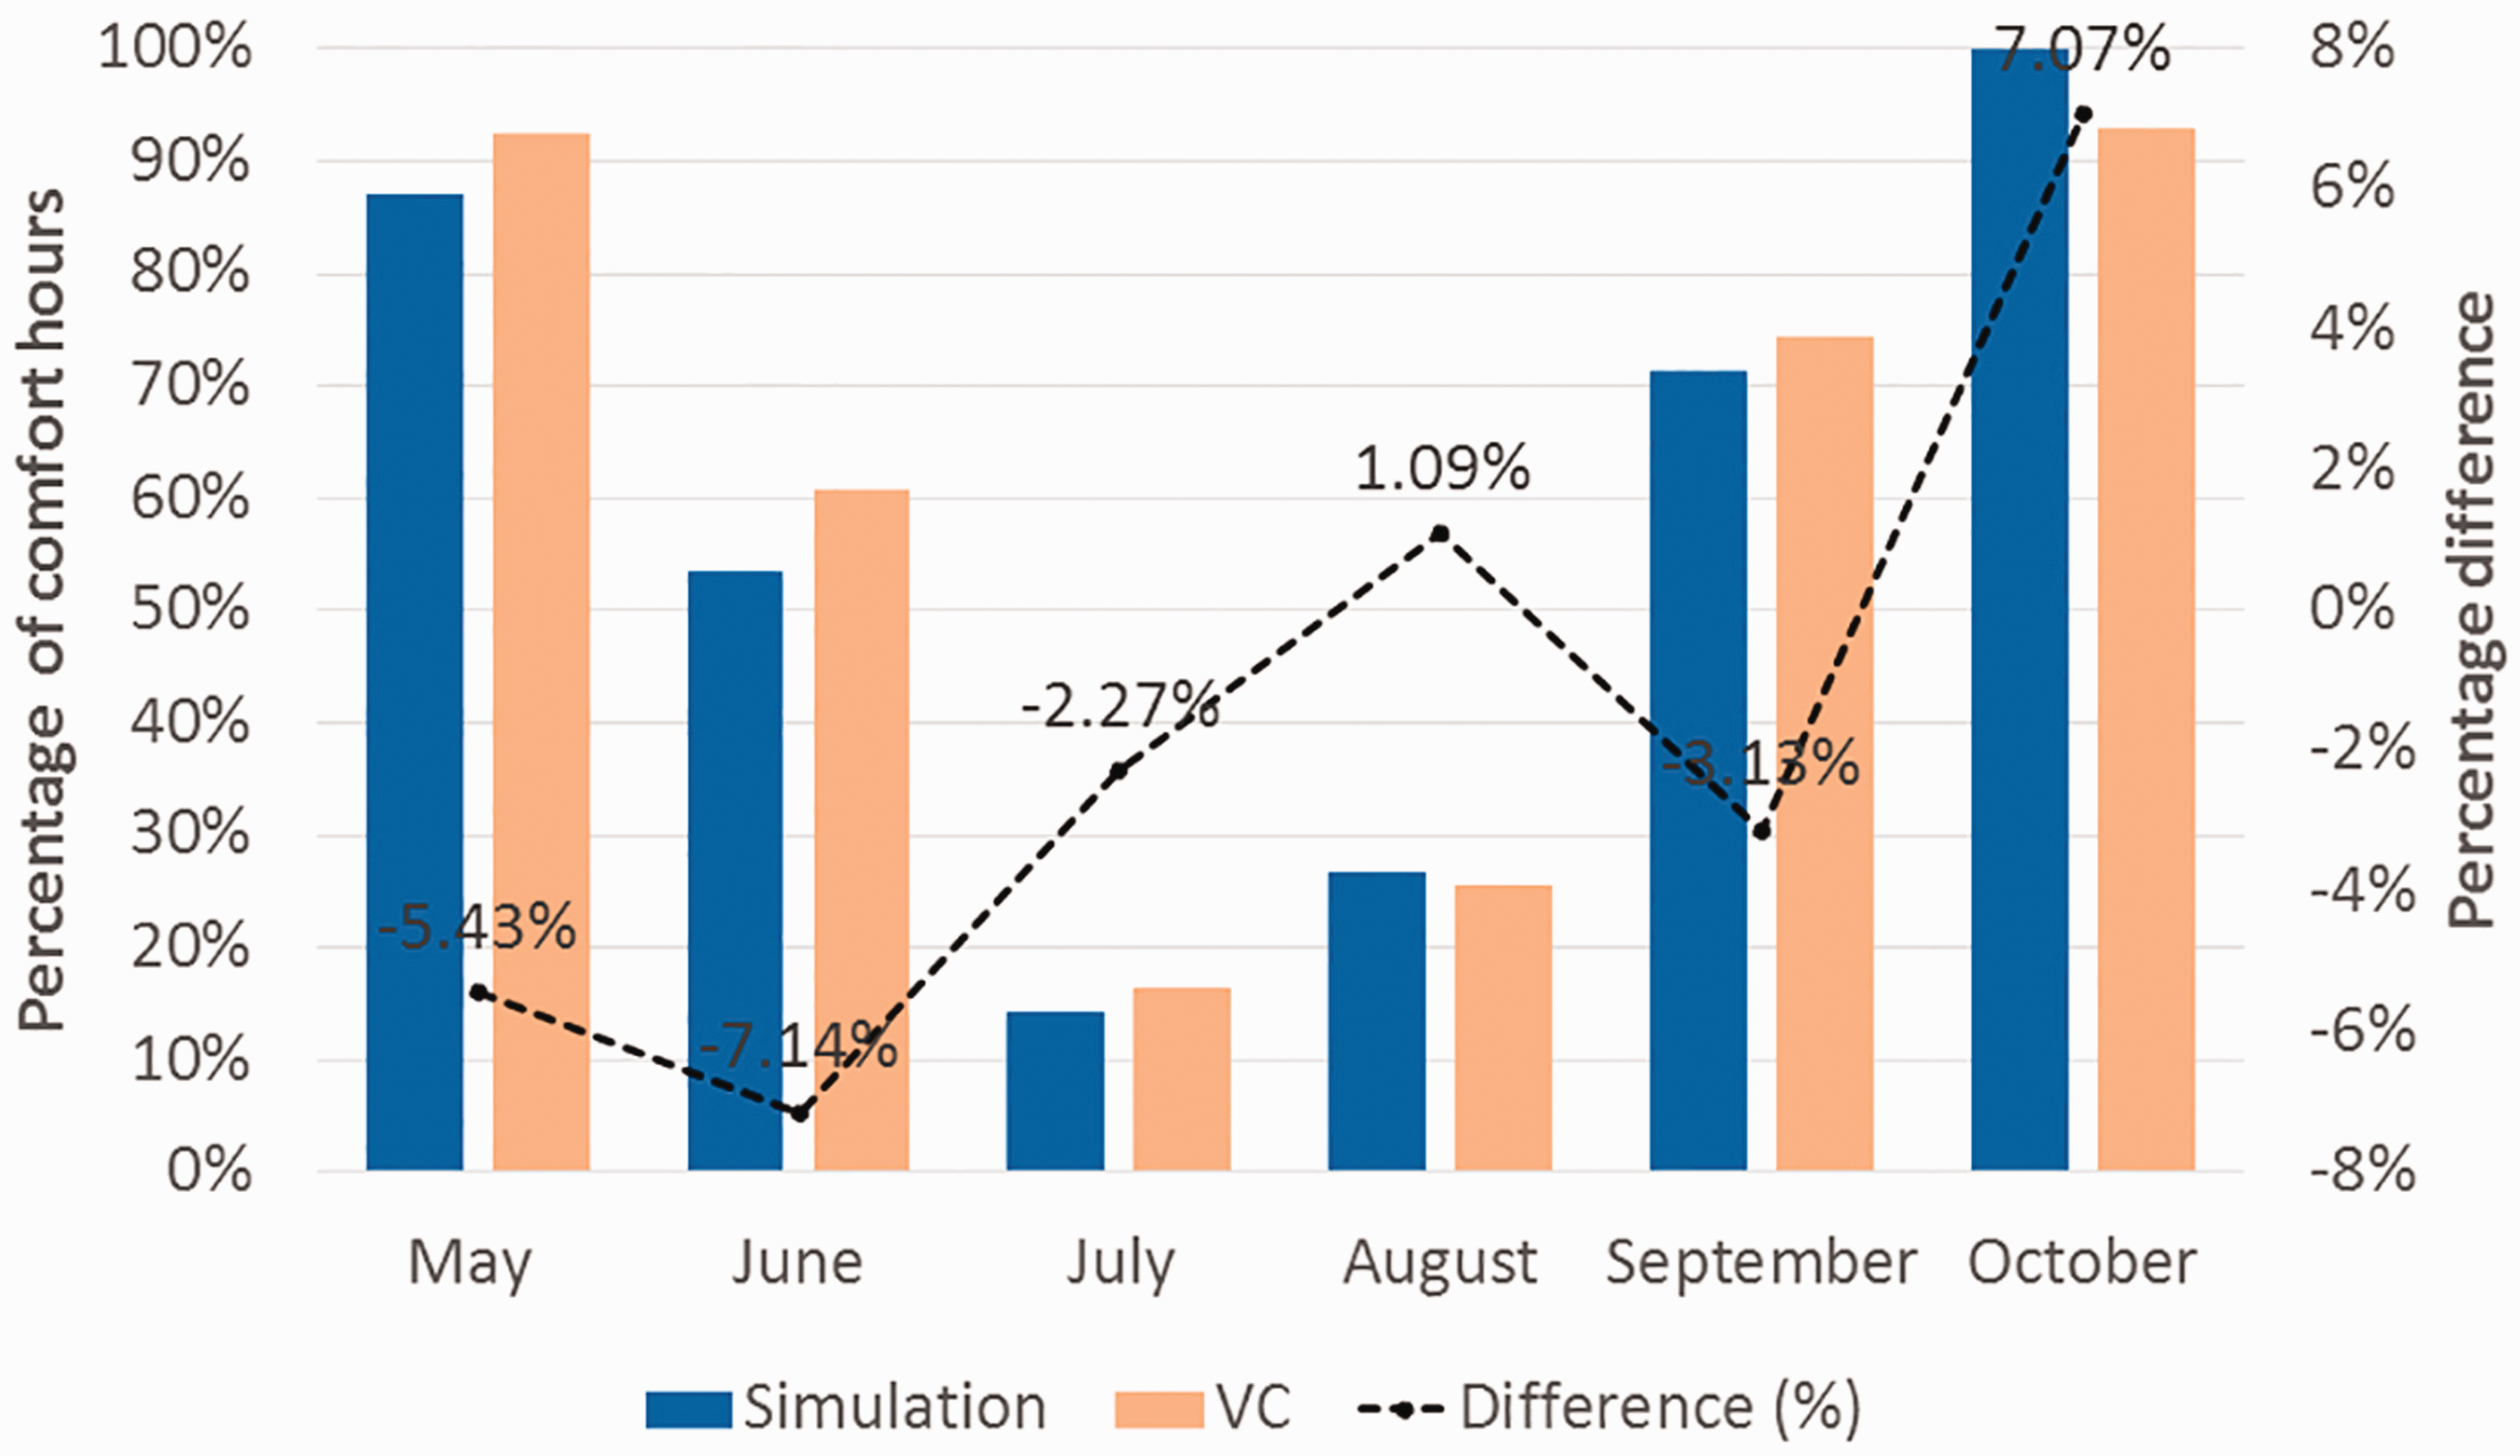
Predicted percentages of comfort hours and differences between dynamic simulation and the ventilative cooling method.
Conclusion
The sociological and psychological consequences of open-plan offices have been studied more frequently than their environmental aspects. A few field measurements addressed MM buildings relative to occupants’ perceptions of TC and energy-efficiency potentials. It has been observed that users of MM buildings accept wider temperature ranges predicted by the adaptive TC model. Sustainable development goals necessitate consideration of such potentials in the early design stage. This study presented a model to naturally ventilated open-plan office design with supplementary heating and cooling in a Mediterranean climate. Different open-plan office design parameters and levels can be evaluated using the Taguchi orthogonal arrays and ANOVA analysis. The investigations included the study of open-plan office sizes (i.e. small, medium and large), layout aspect ratios (i.e. 1:1, 1:1.5 and 1:2), window orientations for cross-ventilation (i.e. N/S, E/W and NE/SW) and fracture of window openings (i.e. 25%, 50% and 100%) in terms of NV potential to achieve acceptable indoor air and TC with minimal AC loads within an MM strategy. An hourly dynamic simulations method was involved for measurement criteria of airflow rate, CO2 levels of concentration, adaptive TC and heating/cooling loads, engaging the number of hours during which a particular criterion is met, as the calculated indicator.
The results of ANOVA analysis for the Taguchi DOEs showed that the window-opening ratio had a greater effect on the VRs, carbon-dioxide levels and AC loads followed by office size. However, window orientation was found to be the most critical parameter to adaptive TC performance, as window orientation has a strong relationship with wind direction and sun position, defining the amount of airflow delivered to space and solar radiation gains. Layout aspect ratio had a minimum effect on performance criteria compared to other design variables.
The near-optimal level combinations can be successfully determined by the S/N ratio approach, which is used as a reference point for further optimisation and study. The results indicated that large open-plan offices are more effective to achieve all the studied performance criteria. A 1:1.5 aspect ratio presented better results than square and longer plans. When the windows were placed at the north and south orientations, a significant improvement was observed in relation to the indoor air and thermal performance, namely the amount of airflow rates for cooling, CO2 contaminant levels and TC, consequently lowering AC loads. An interpretation of this scenario might be the influence of solar radiation on internal heat gains, particularly in the absence of shading devices. Larger window openings can increase the potential of NV for each of the measured criteria in the case of a 20% WFR divided into a pair of windows in opposite walls to conceive cross-ventilation.
The results of the O-1 optimal case showed that the VR satisfies the minimum of VR ≥ 2.1 dm3/s.m2 for about 71% of the annual occupancy hours. The concentration of CO2 was below the 1000-ppm threshold approximately 83% of the time. Indoor operative temperature appeared inside the temperature ranges of category II of the adaptive comfort model for about half of the occupancy time, representing the free-running period, while AC needs to be in operation for the rest of time to maintain indoor TC conditions. May and October represent free-running months considering the number of comfort hours defined by the adaptive model of the EN 15251 standard. Although the supplementary heating/cooling loads of the MM system suggest that April, May, October and November are free-running months, such results might not correspond to a system where the AC operation is controlled by the adaptive model indoor temperature ranges. This issue can be considered as one limitation of current dynamic simulation engines. Nonetheless, the MM system offered a 78.34% reduction in heating/cooling loads compared to a fully AC scenario, taking into account the conditions of this study. An approximately similar reduction amount in AC loads is also reported in the results of a field study. The validation test of dynamic simulation results using the VC method revealed a relatively similar prediction of comfort hours.
Overall, this performance-based office design model encourages architects to make informed decisions in the early design stage. In addition, a larger number of design variables and their levels can be investigated using this model. Further field and subjective studies can describe the thermal perception of occupants during the free-running and AC period to validate the MM system ranges of VC and AC operation.
Footnotes
Authors' contribution
HKA and HZA designed the concept of the study; HKA performed numerical simulations and wrote the manuscript; HZA supervised, provided resources, suggestions and revisions for the article. Both the authors have read and agreed to the submitted version of the manuscript.
Declaration of conflicting interests
The author(s) declared no potential conflicts of interest with respect to the research, authorship, and/or publication of this article.
Funding
The author(s) received no financial support for the research, authorship, and/or publication of this article.