
Abstract
Aims:
The aim of this study was to assess how early-life and adult lifestyle factors influence the education gradient in health, measured by health-related quality of life, and to estimate their relative contributions to the social gradient in health.
Methods:
In this cohort study, we used data on an adult sample (N=8903, aged ⩾32 years at baseline) who participated in two waves of the Tromsø Study (2007/08 and 2015/16). Educational attainment was measured along four levels of completed education. Early-life factors included childhood financial circumstances, height, parental somatic and mental health, and parental substance abuse. Lifestyle factors were measured by smoking, physical activity and body mass index in the two waves. We used two measures of health-related quality of life: EQ-5D-5L and EQ VAS. Ordinary least squares regression analyses were used to estimate the education–health gradient. Shapley–Owen value decomposition estimated the relative contribution of education, early-life factors and lifestyle factors.
Results:
The education–health gradient remained nearly unaffected by the inclusion of early-life factors. However, the inclusion of longitudinal data on lifestyle factors substantially attenuated the education–health gradient. Lifestyle factors accounted for 45% and 57% of the share of explained variation in EQ-5D-5L and EQ VAS, respectively, whereas early-life factors explained 43% and 19%, respectively.
Conclusions:
Keywords
Introduction
A social gradient in health is consistently documented across various contexts and health outcomes, regardless of the socioeconomic indicator used [1]. Understanding the mechanism behind this systematic positive association between socioeconomic position and health is crucial for developing effective policies. Among the socioeconomic indicators used to study the health gradient, education is widely applied due to its simplicity, stability over the life course, and well-documented robustness in numerous studies on health inequalities [2,3]. However, its significance has shifted dramatically in recent decades due to changes in the educational composition of the population [4]. Additionally, education does not account for socioeconomic fluctuations in adulthood, and may be subject to confounding and reverse causality, particularly in observational, cross-sectional studies [5].
To provide new insights into the social gradient in health, we investigated two sets of variables beyond educational attainment: early-life factors and lifestyle factors.
Early-life factors, shaped by the social and biological lotteries at birth, include factors such as family background and childhood circumstances. Parental health is also considered an early-life factor because parental health status is correlated with descendants’ health through the intergenerational transmission of health [6,7]. These factors – which can be summarised as ‘parents’ wealth and health’ – play a significant role in influencing socioeconomic conditions and health outcomes in adulthood [8,9]. Inequalities arising from such early-life circumstances that are beyond the control of the individual are considered unfair and are commonly referred to as inequalities of opportunity [10].
In contrast, lifestyle factors, such as physical activity and smoking, are shaped by individual choices. However, these choices are socioeconomically patterned [11], suggesting that lifestyle factors are partly constrained by socioeconomic circumstances. The estimated contribution of lifestyle factors to the social gradient in health varies widely across studies [11].
Early-life factors, such as favourable childhood circumstances, are positively associated with educational achievement [8]. Similarly, education is a strong predictor of lifestyle factors, with higher educational attainment linked to healthier lifestyles [12].
Consequently, these two sets of determinants likely influence the education–health association. However, while education is a key socioeconomic indicator, it remains unclear how its relationship with health changes in combination with these determinants. Therefore, analysing how educational inequalities in health relate to early-life factors and adult lifestyle factors can enhance our understanding of the education–health gradient.
Other socioeconomic factors in adulthood, such as employment, occupation and income, also influence inequalities in lifestyle and health [1]. Generally, more prestigious occupations and higher income are associated with healthier lifestyles and better health outcomes [1,13]. Such factors should be investigated when exploring the potential for social mobility in adulthood and its relationship to early-life circumstances, as they likely play a role. However, this study focused on two conceptually distinct sets of predictors: early-life factors that lie outside individuals’ control, and adult lifestyle factors, which are considered to be more within own control.
The aim of this study was to examine how early-life factors and adult lifestyle factors associate with the education gradient in health, measured by health-related quality of life, and to estimate their relative contributions to the explained variations in health. First, we investigated the education gradient in health, given its status as the most widely applied measure of socioeconomic position in this field. Second, we assessed the additional contribution of early-life factors to health and how their inclusion changes the education gradient. Third, we evaluated how adult lifestyle factors are associated with health, and their relationship with the education–health gradient. Fourth, we examined the relative contributions of education, early-life factors and lifestyle factors to the explained variation in health.
This study was set in Norway, a country characterised by its generous welfare state, providing free access to higher education, universal tax-funded healthcare and relatively low income inequality. However, several studies have revealed that health inequalities remain considerable [14,15]. Moreover, while smoking rates have plummeted [16] and physical activity levels have increased [17], the prevalence of overweight and obesity have continued to rise [18].
This paper makes several contributions. First, using unique data from two waves of a Norwegian population cohort study, we exploited a set of early-life variables, such as childhood financial circumstances, parental somatic and mental health, and a set of adult lifestyle variables to explain variations in two measures of health-related quality of life. Second, we included data on longitudinal lifestyle factors, capturing lifestyle change between the two time points. Third, this study contributes to the literature by providing insights into the relative contribution of education, early-life and adult lifestyle factors in explaining health.
Materials and methods
Data: The Tromsø Study
The paper used data from the Tromsø Study, a prospective cohort study of a general adult population in the municipality of Tromsø. Tromsø is the largest city in Northern Norway with approximately 80,000 inhabitants. We applied data from the sixth and seventh wave of the survey (referred to as Tromsø6 and Tromsø7), conducted in 2007/08 and 2015/16. In Tromsø6, N=12,984 individuals participated (65.7% of the 19,762 invited) and Tromsø7 included N=21,083 participants (65.0% of the 32,591 invited). We included only respondents who participated in both waves: N=8903. A detailed description of the survey design is available elsewhere [19,20]. All participants provided written informed consent. This study is a part of a research project approved by the Regional Committee for Medical and Health Research Ethics Northern Norway (ID: 2019/607).
Health outcomes
Health was measured using health-related quality of life measures. We applied the EuroQoL generic instrument evaluating quality of life across five health-related dimensions: mobility, self-care, usual activities, pain/discomfort, and anxiety/depression (EQ-5D) [21]. We applied the 5-level (5L) version recorded in Tromsø7. We applied the ‘Western Preference Pattern’ (MN-WePP) value set, an amalgam estimate of value sets derived from 10 western countries (Canada, Denmark, England, France, Germany, Republic of Ireland, The Netherlands, Portugal, Spain, US) [22]. As a supplemental measure, we included the EQ VAS. This is a visual analogue scale in which participants rate their overall health-related quality of life from 0 (worst imaginable health) to 100 (best imaginable health). For consistency, the EQ VAS score was rescaled to a 0–1 range.
Predictor variables
Educational attainment was measured as the highest of four levels of completed education (primary education <10 years; upper secondary; tertiary low <4 years; and tertiary high ⩾4 years). Early-life factor variables included childhood financial circumstances, height (lowest 20% and tallest 80%), and parental health. These were included because childhood circumstances have been documented to influence socioeconomic factors and health in later life [8,23]. Height was included as a proxy for birth weight and early life nutrition [8,24,25]. Parental health variables were measured both for the respondent’s mother and father: somatic health (based on number of a series of conditions), mental health and substance abuse problems (previous or current psychological or substance abuse problems). Somatic health was categorised based on the presence of two or more diagnoses/conditions, a commonly used definition of multimorbidity [26].
Lifestyle factors were proxied by smoking status, physical activity (combination of frequency and duration) and body mass index (BMI). For each of these factors, we calculated an index of change between Tromsø6 and Tromsø7. Smoking categories included never smoker, past smoker and current/persistent smoker. Physical activity was categorised as active, moderate, newly inactive and persistently inactive. BMI change categories included normal, overweight, newly obese and persistently obese. BMI was included as a lifestyle factor, serving as a proxy for maintaining an optimal weight [27], a key public health recommendation [28]. This aligns with literature that considers BMI as a modifiable lifestyle factor in healthy lifestyle indices [29]. However, we recognised that BMI is an imperfect lifestyle variable due to its considerable genetic component and is more accurately considered a metabolic measure influenced by other lifestyle factors. A detailed variable description is provided in Table I.
Overview and description of included variables.
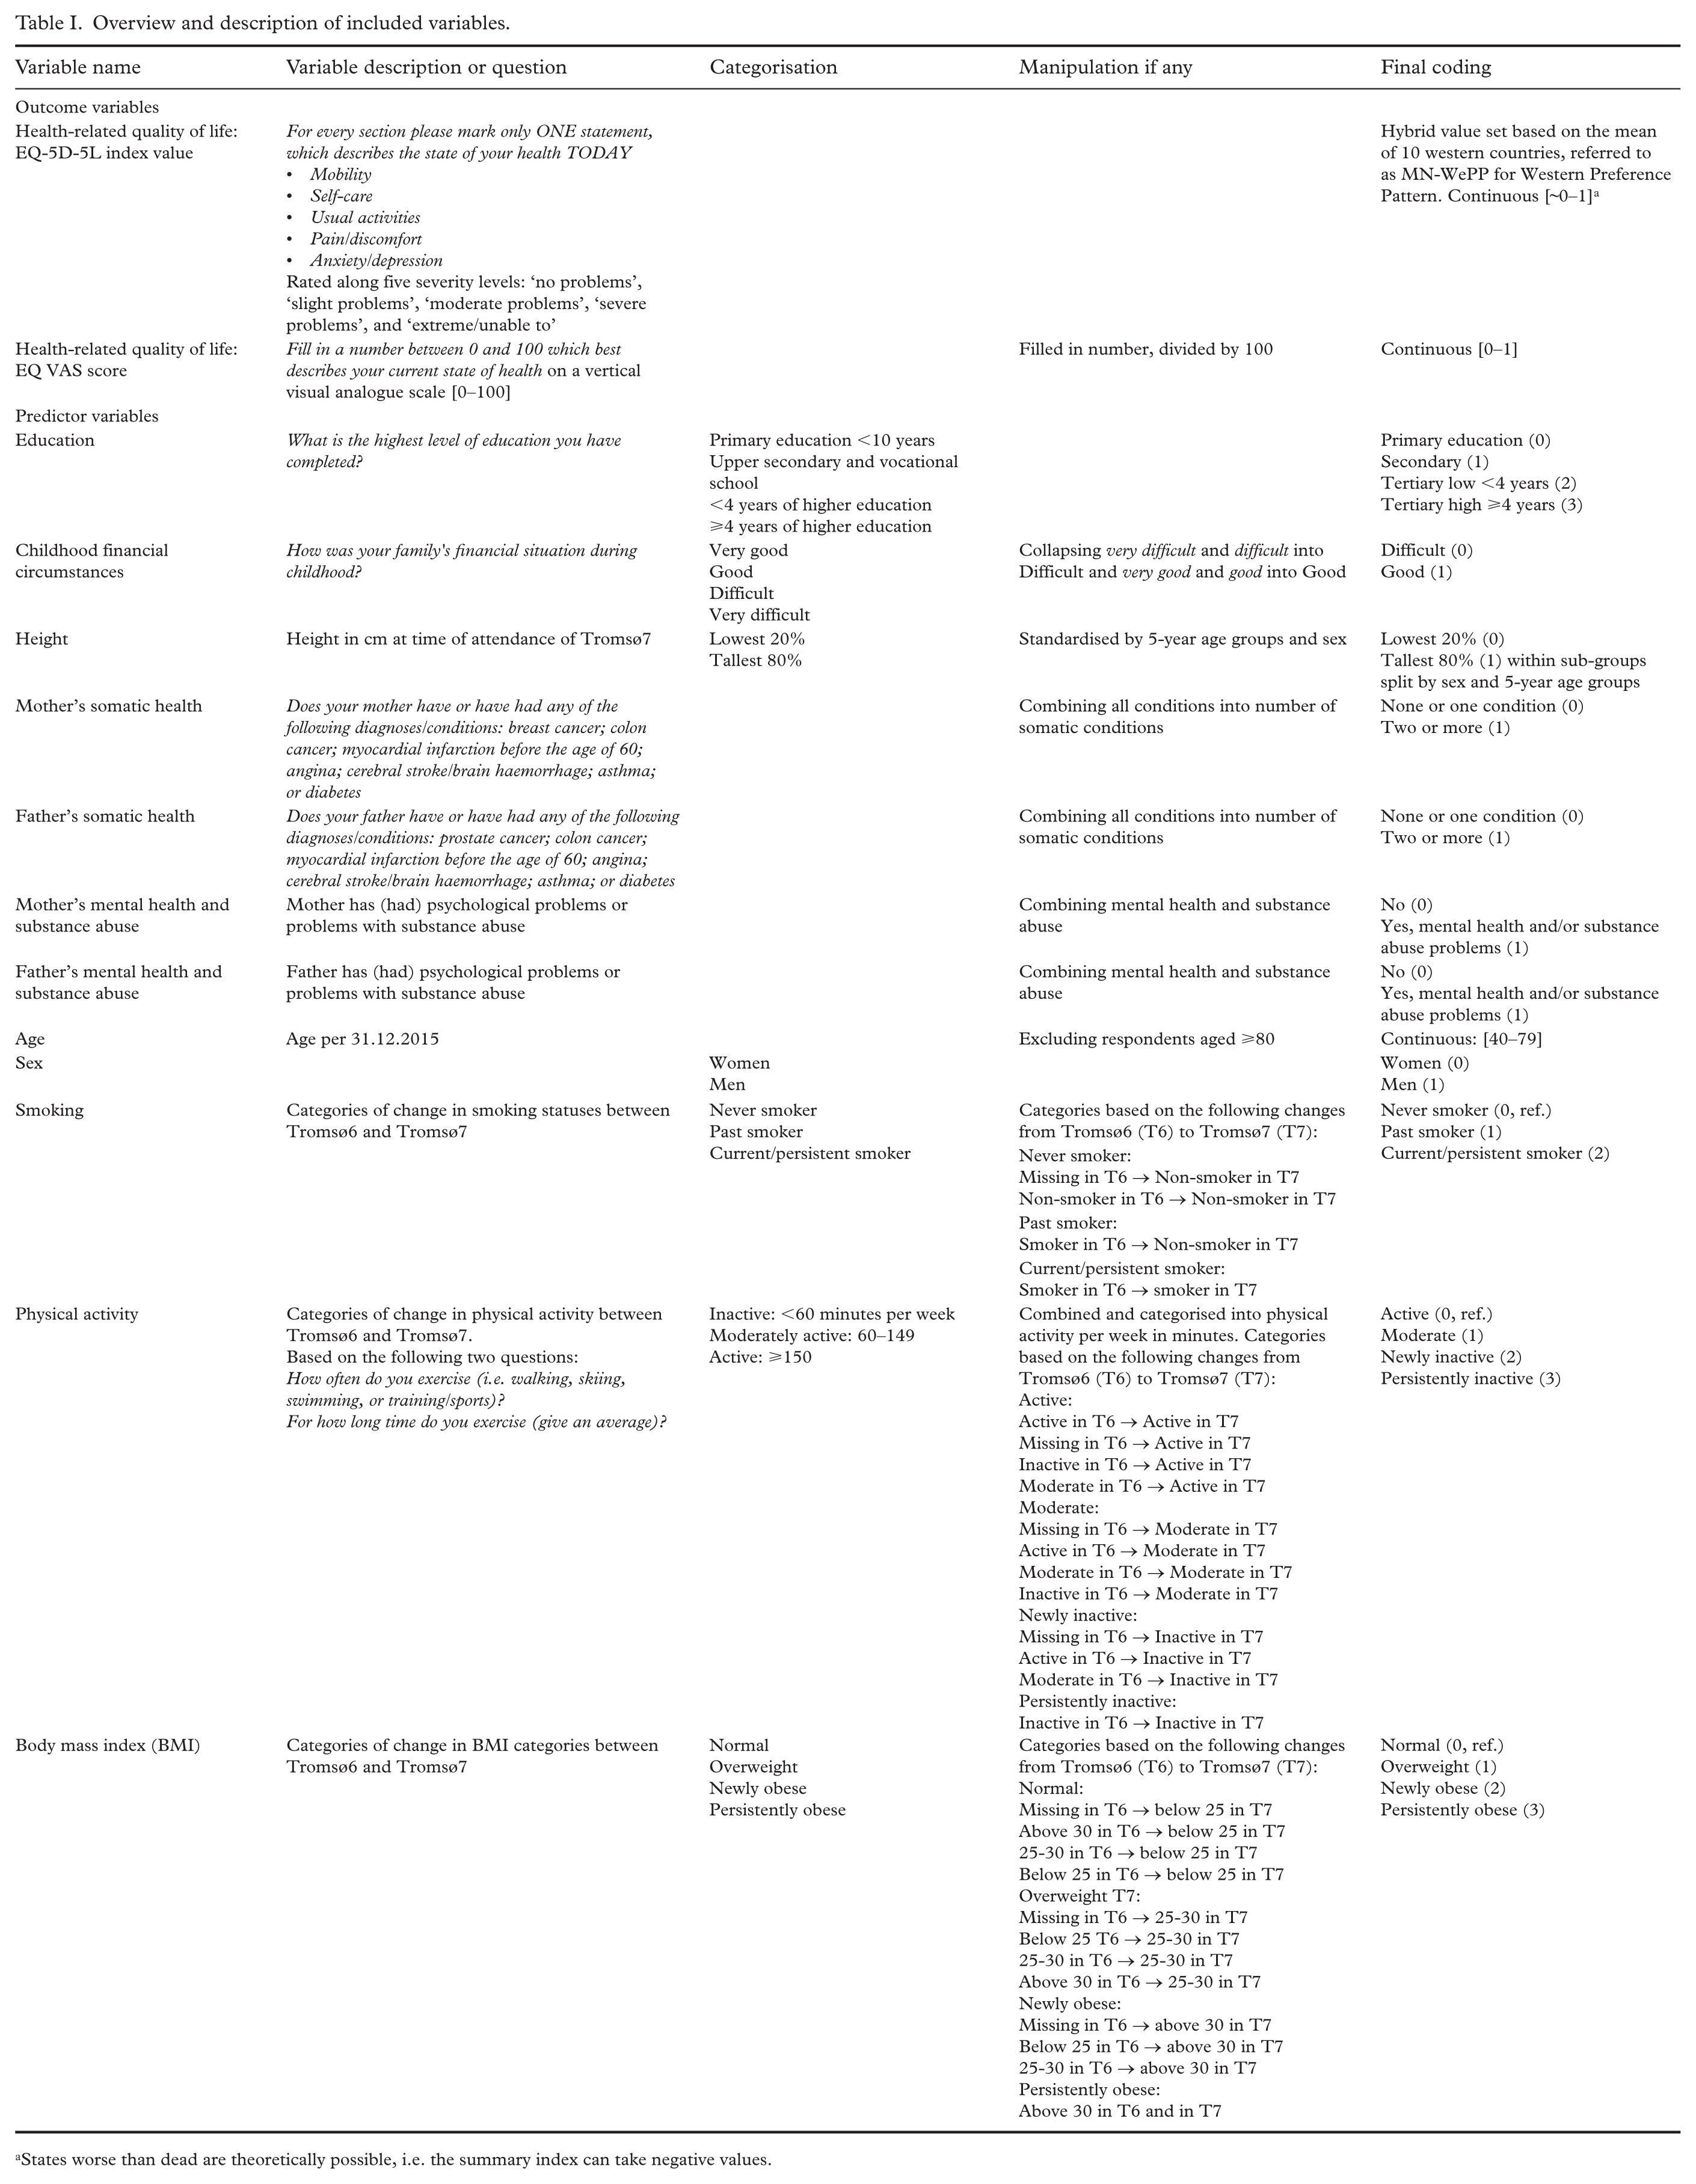
States worse than dead are theoretically possible, i.e. the summary index can take negative values.
Statistical analyses
Means, proportions, and standard deviations (SDs) of the included variables were reported. Respondents above the age of 80 years (N=696) were excluded due to a disproportionately low response rate and to minimise cohort effects on the education variable. The sample was further restricted to include only respondents with non-missing values in the two outcome variables, resulting in a final sample size of N=7840. A sample size flow chart is provided in Supplemental Figure 1. All statistical analyses were conducted using Stata version 18.0 (Stata Corporation, College Station, Texas, USA).
The first part of the analyses aimed to describe the magnitude of the education gradient in health-related quality of life and to assess how the inclusion of additional sets of predictors attenuated the education–health gradient, with education as the primary exposure of interest. Employing ordinary least squares regression, we analysed these associations in a stepwise approach. First, we estimated separate models for each set of predictors to report their direct associations with health: education (model A), early-life factors (model B) and adult lifestyle factors (model C). Next, we examined various combinations of these predictor sets to assess how the education gradient changed by the inclusion of early-life and lifestyle factors, before estimating a full model with all predictors (model A+B+C). Changes in the education coefficients across model specifications were interpreted to indicate how observed differences in early-life and lifestyle factors were statistically associated with the education–health gradient, and not as evidence of causal mediation. All analyses were adjusted for sex and age. Due to missing data in the predictor variables, we evaluated whether results differed when all model specifications were applied to the same sample used in the full model. Additionally, sex-stratified analyses were conducted to investigate potential sex differences. The reference for categorical variables was the least favourable/lowest category. Estimates were considered statistically significant for P values less than 0.05.
Thereafter, to estimate the relative contribution of the three sets of predictors to the goodness of fit of the full A+B+C model (R2), we applied Shapley–Owen value decomposition. This technique quantifies a predictor’s contribution to the model’s explained variance by evaluating its impact when added to the model, weighted by the number of permutations represented by sub-models that exclude this predictor [30]. Note that the resulting shares of explained variance are purely descriptive measures of relative explanatory importance within the specified model. Shapley–Owen value decomposition was estimated by the user-written Stata command shapley2 [31].
Results
Table II presents the descriptive statistics of the sample, including mean values of EQ-5D-5L and EQ VAS in total and across categories of the predictor variables. Descriptive statistics stratified by sex are reported in Supplemental Table I. Overall, the respondents reported high health-related quality of life, with a mean EQ-5D value of 0.88, and a mean EQ VAS score of 0.77. The share of respondents reporting attainment of tertiary education was 43%. Nearly 80% were never smokers, 40% reported being physically active, and 31% maintained a normal weight.
Summary statistics and mean value of EQ-5D and EQ VAS score for categorical predictors.
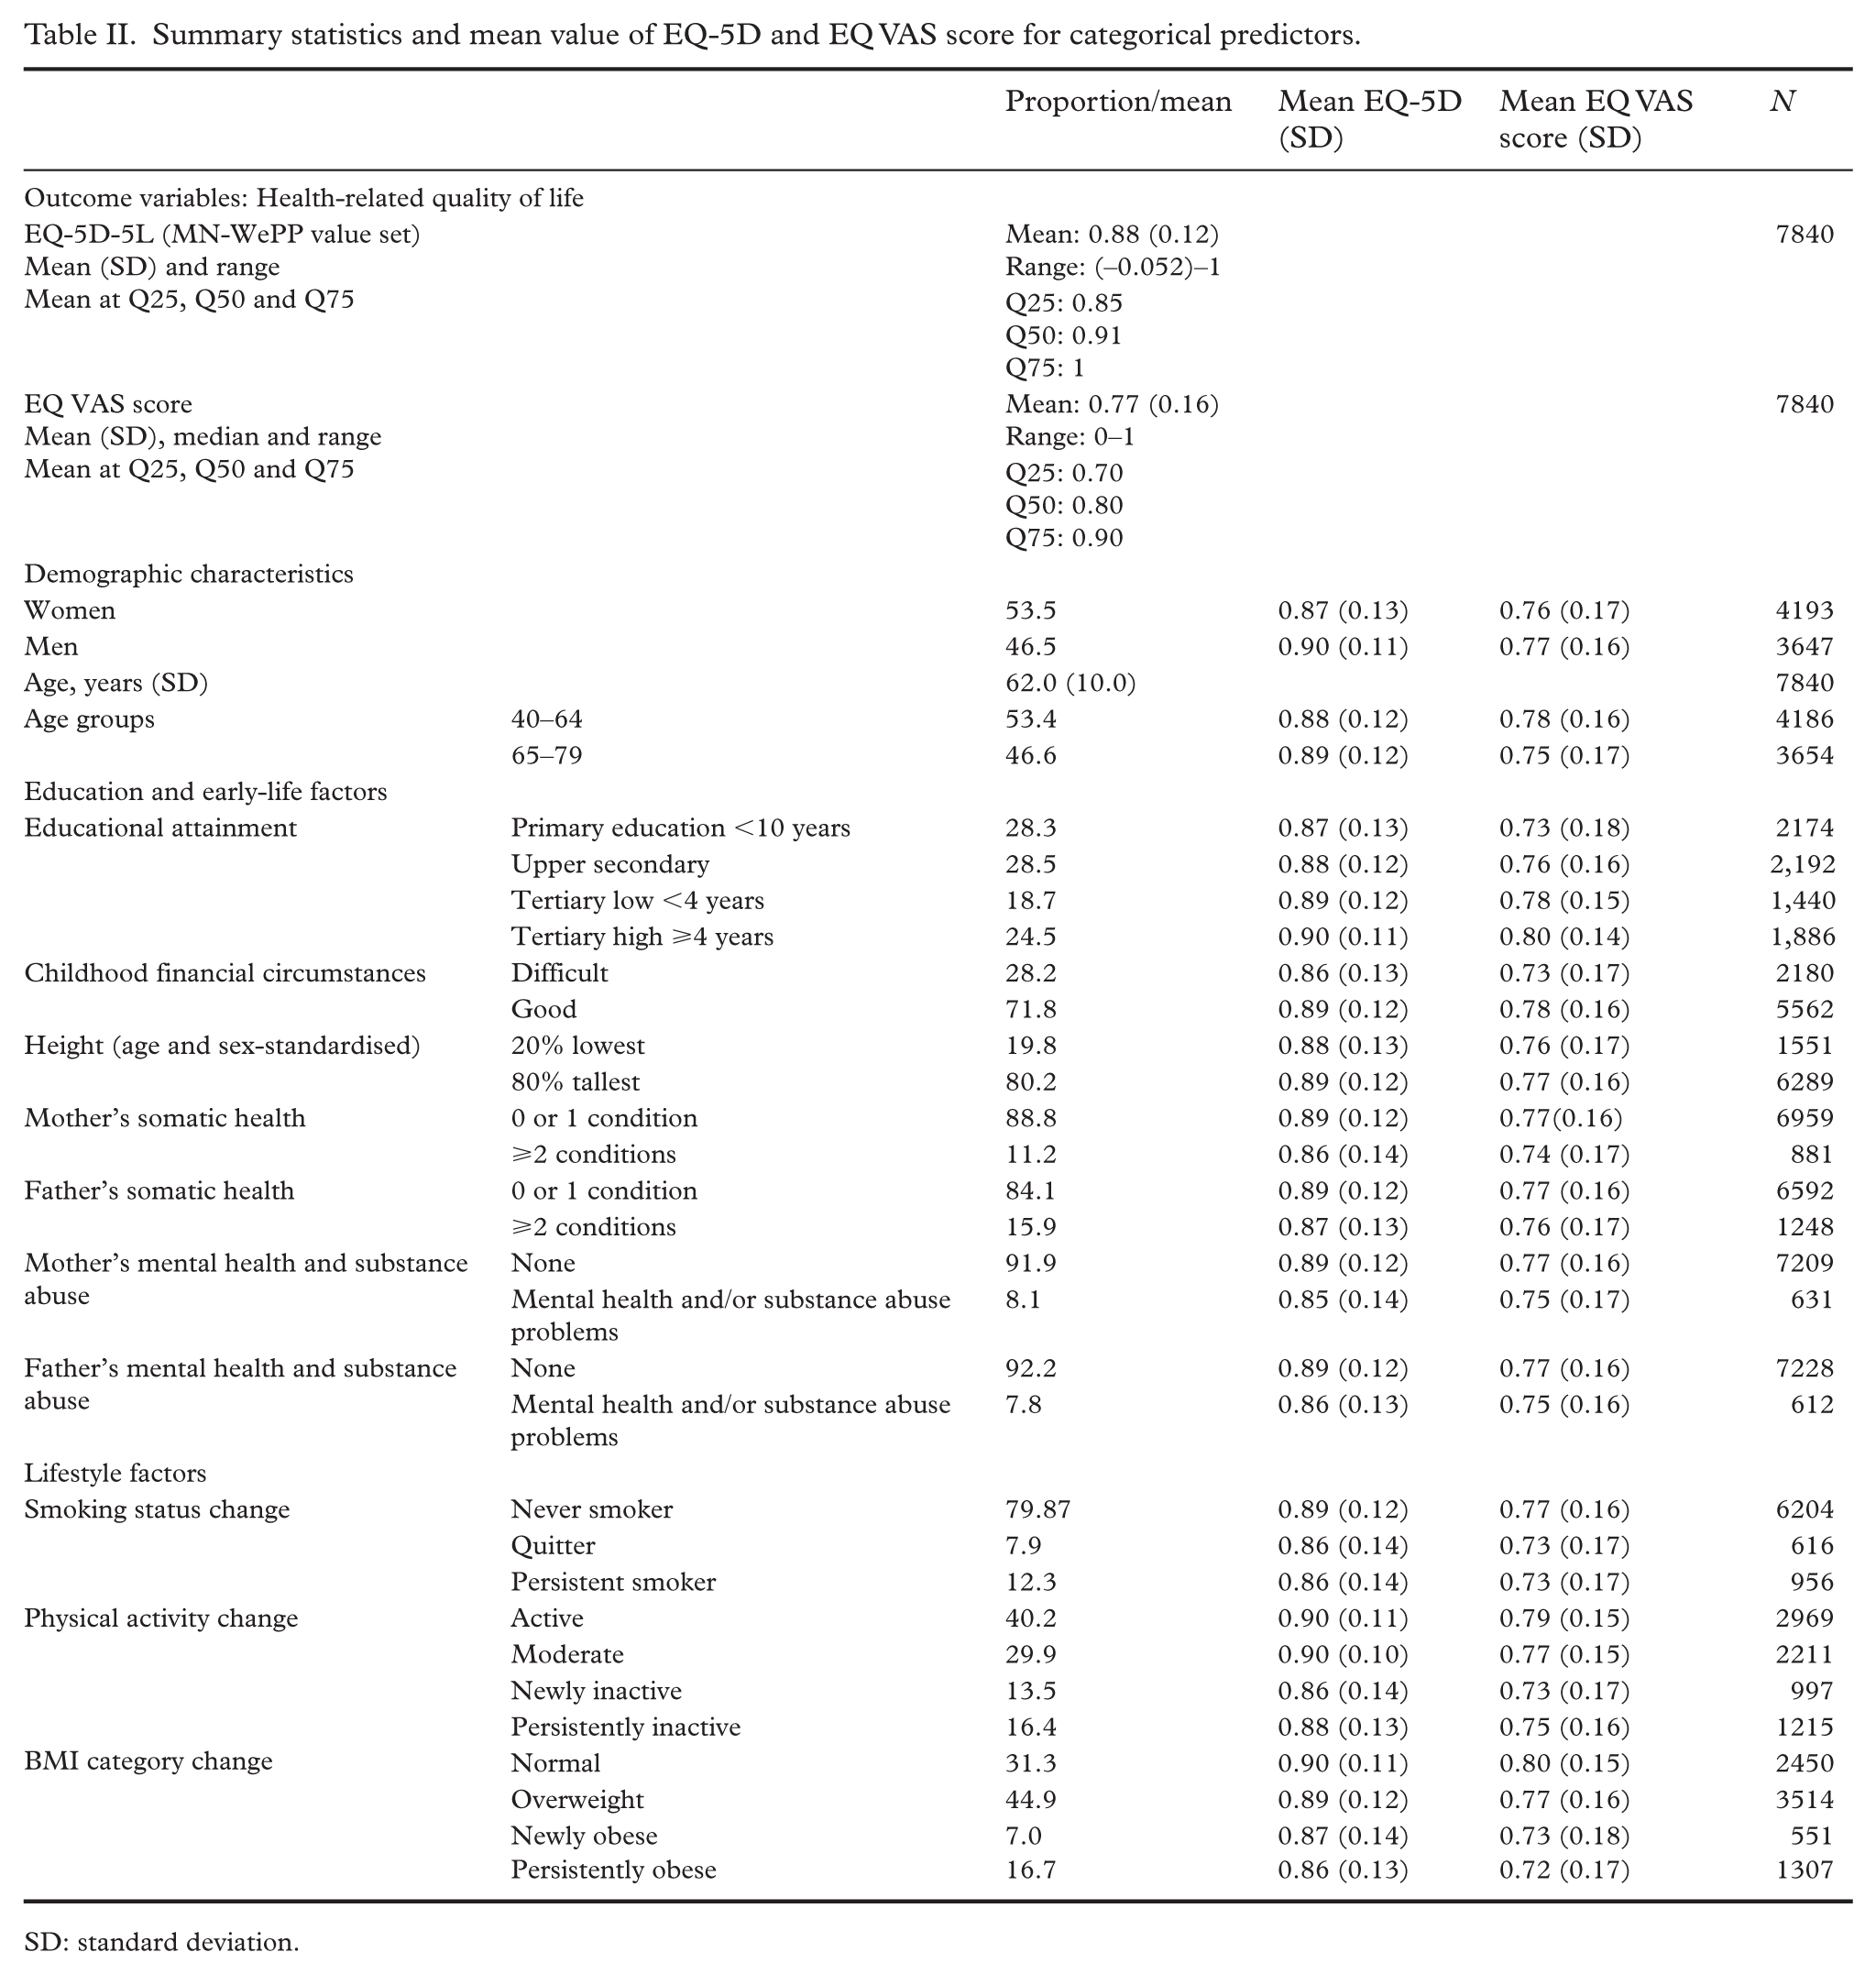
SD: standard deviation.
The associations between the sets of predictors and health-related quality of life were analysed using six model specifications for both EQ-5D and EQ VAS. For EQ-5D, as shown in Table III, the models estimated separately for education (model A), early-life factors (model B) and adult lifestyle factors (model C) were all significantly associated with health-related quality of life. When education was combined with early-life factors (model A+B), the coefficients for both sets of predictors remained largely unchanged compared with their respective separate models (A and B). When education was combined with lifestyle factors (model A+C), the education gradient was substantially attenuated compared with model A. In the full model (model A+B+C), the education coefficients were of similar magnitude as in model A+C. The coefficients for early-life factors and lifestyle factors remained consistent with those in models A+B and A+C, respectively. In sum, the largest attenuation in the education–health association occurred when lifestyle factors were included.
Ordinary least squares regression analysis coefficients (robust standard errors) of health-related quality of life (EQ-5D (MN-WePP)) by education (model A), early-life factors (model B), lifestyle factors (model C) and combinations of models A–C.
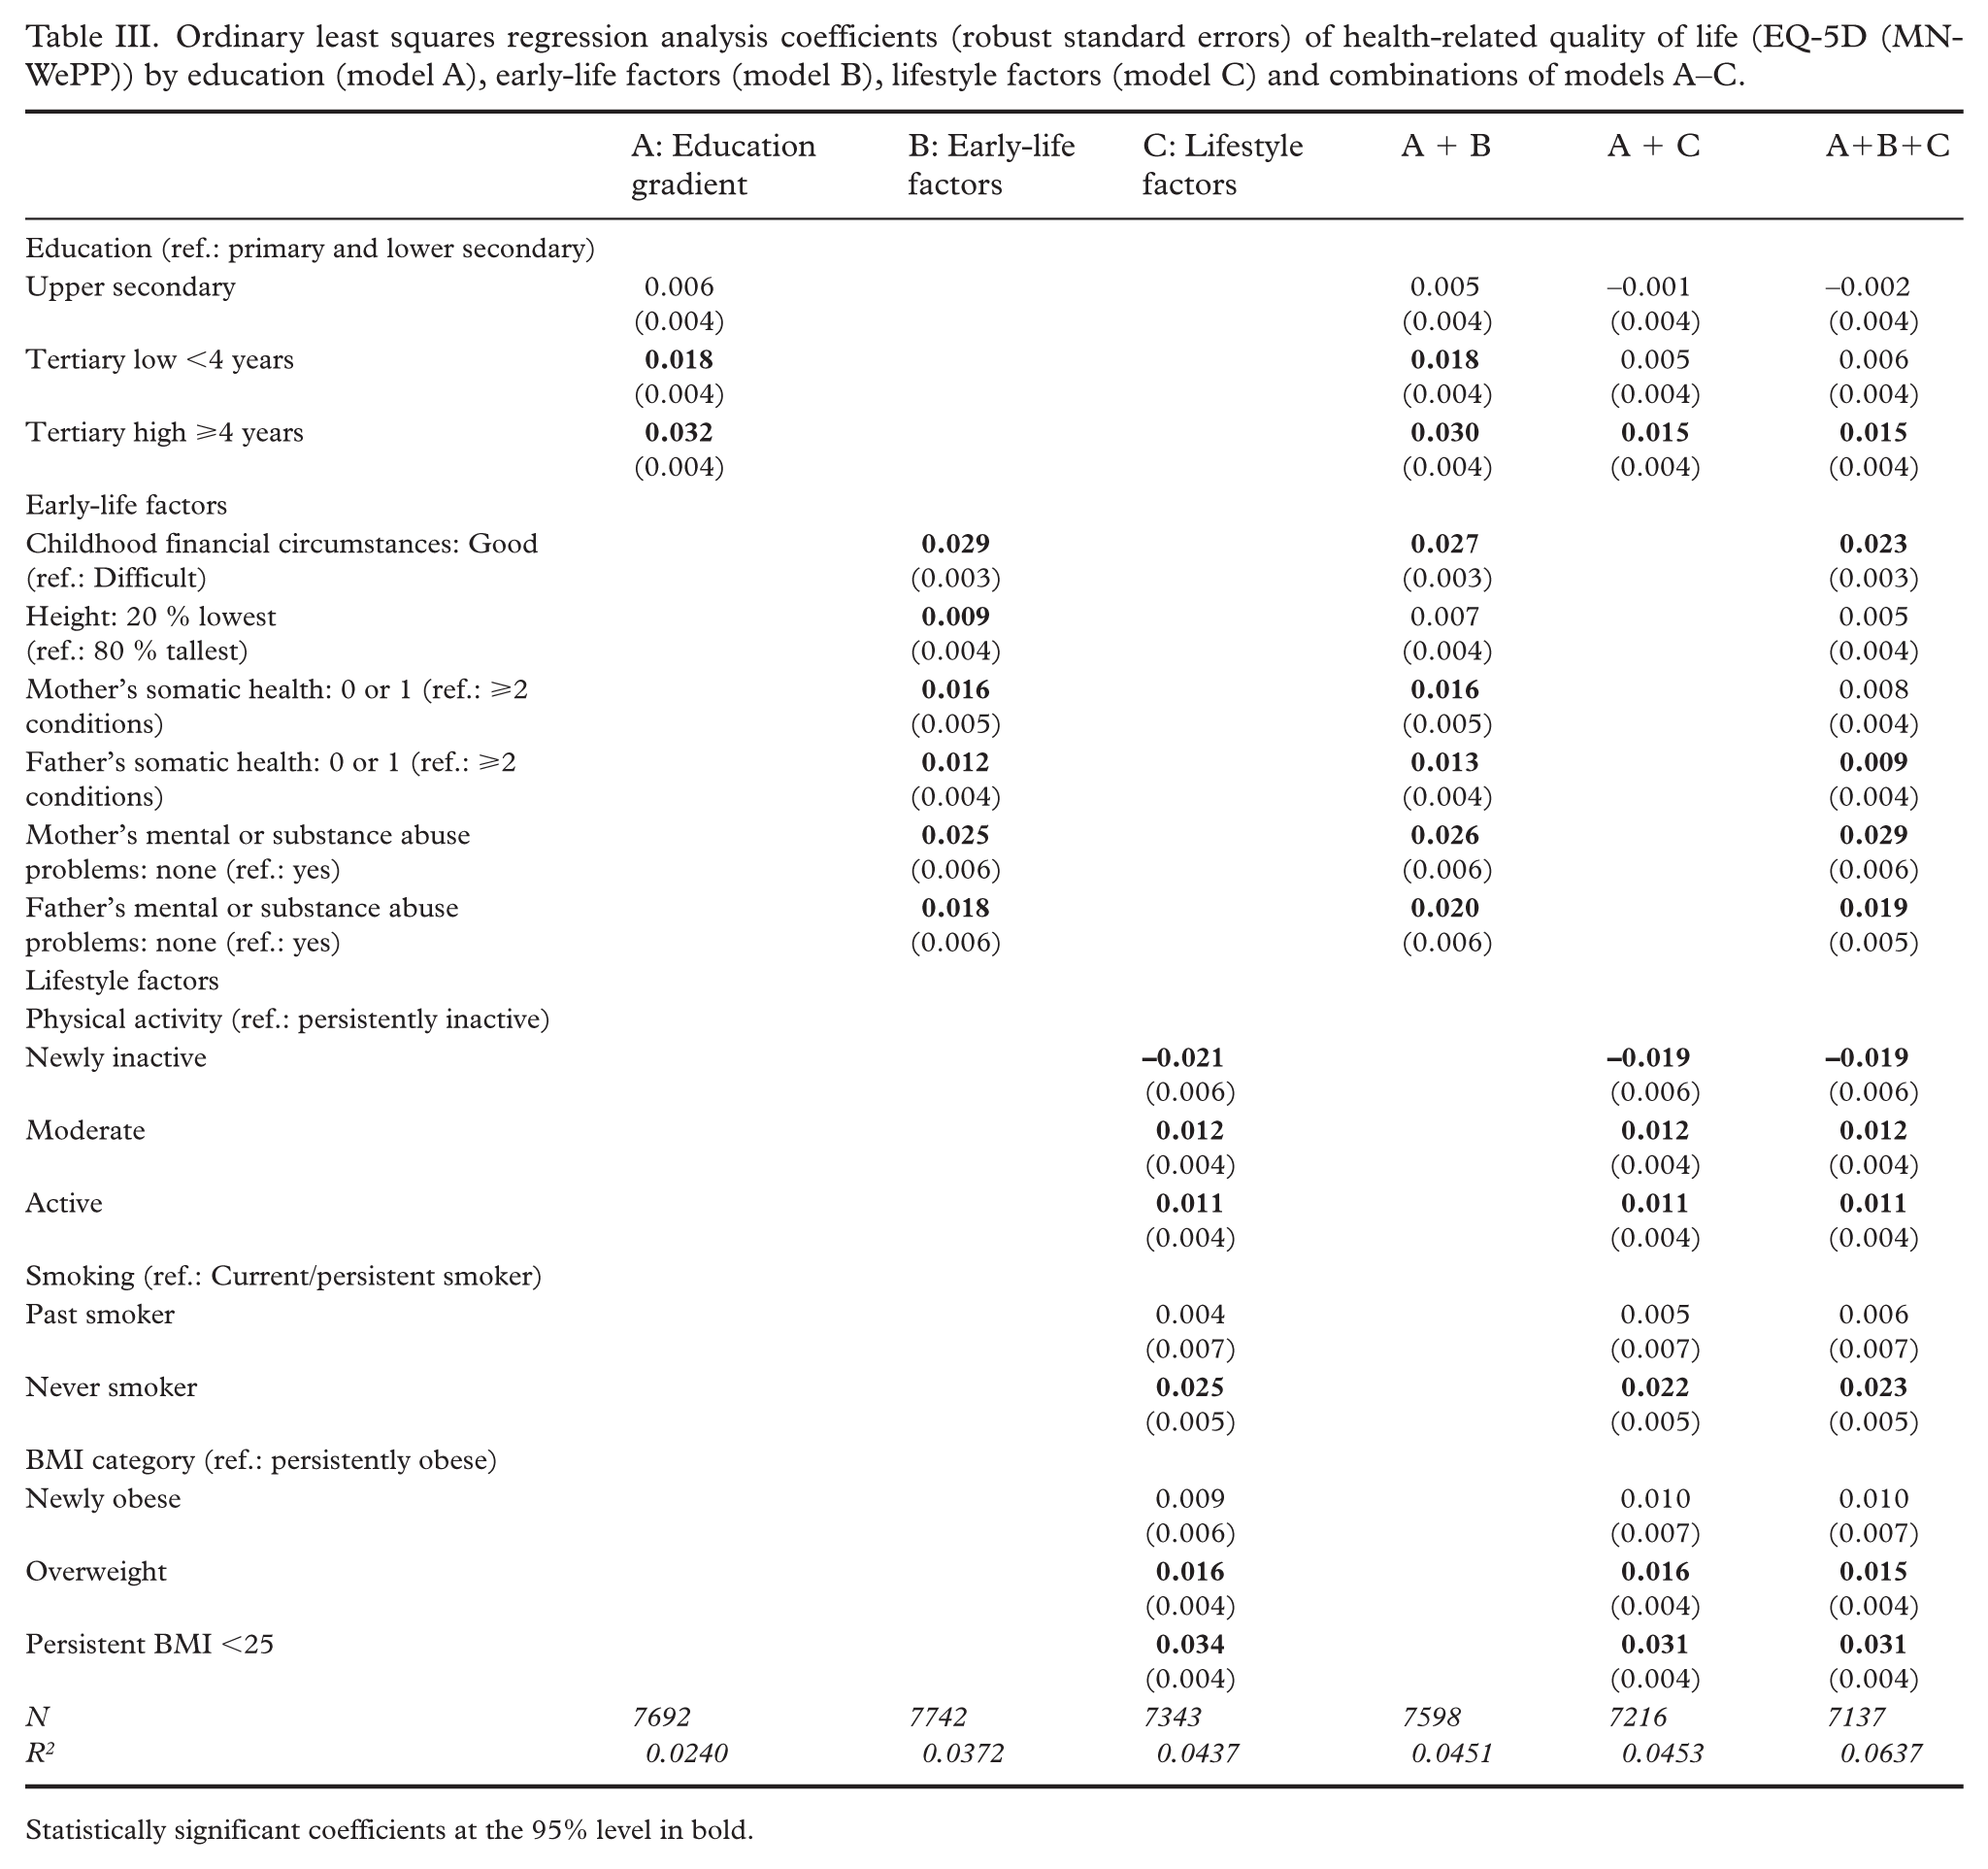
Statistically significant coefficients at the 95% level in bold.
The Shapley–Owen value decomposition of the full EQ-5D model (model A+B+C), adjusted for age and sex, revealed that education accounted for 12% of the total explained variance, while early-life factors and lifestyle factors explained 43% and 45%, respectively (Figure 1).
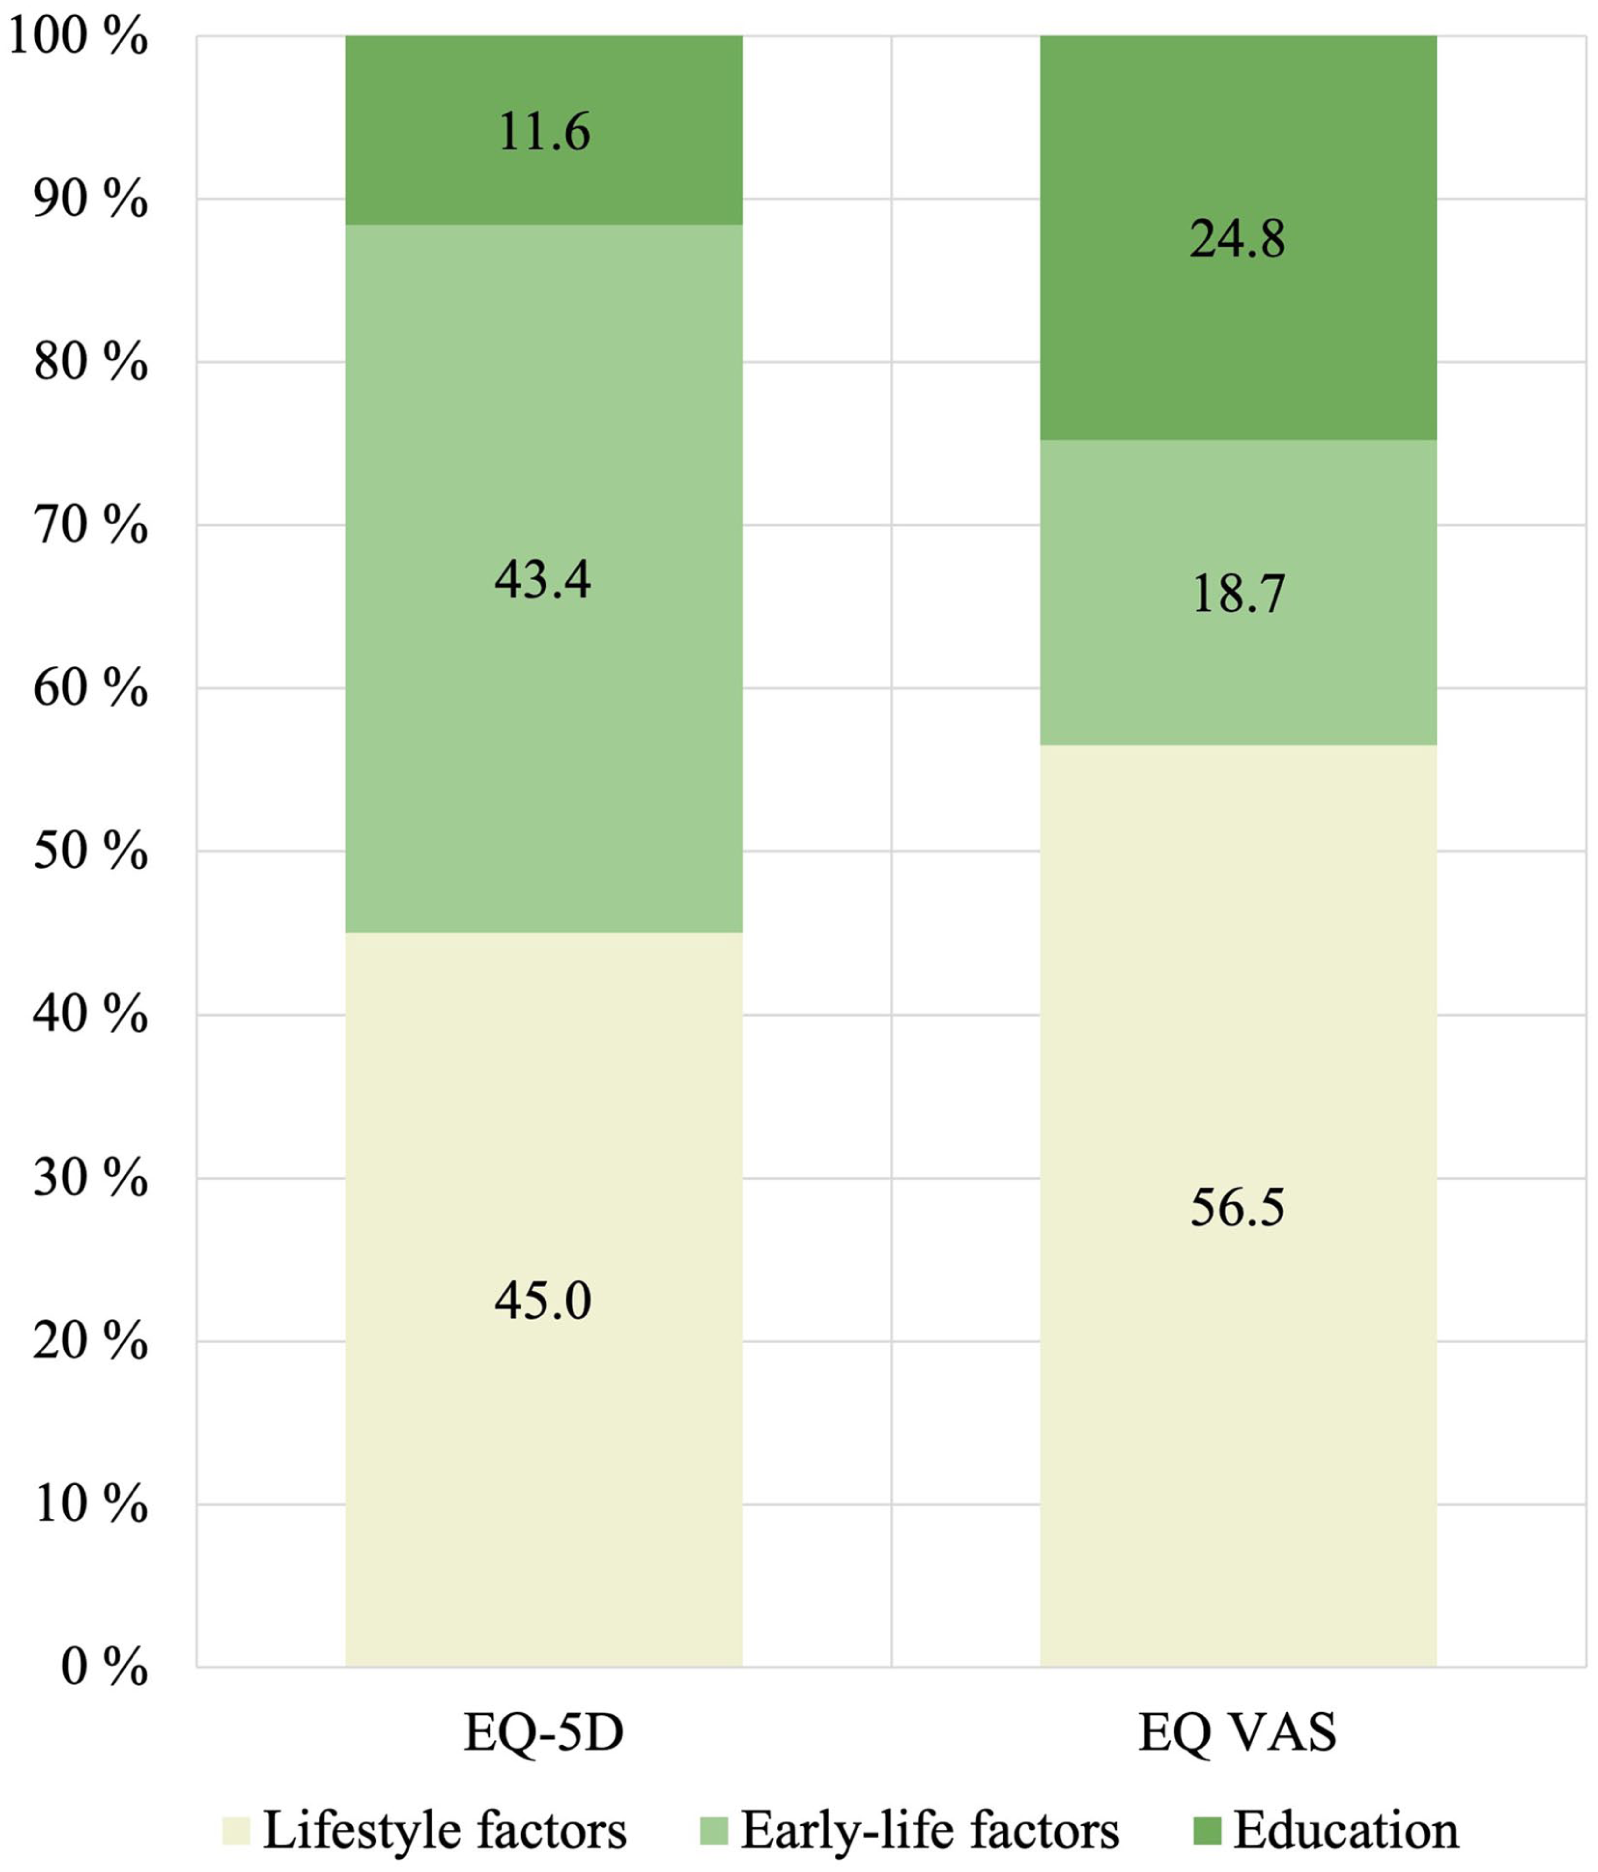
Shapley–Owen value decomposition of education, early-life factors, and lifestyle factors, adjusted for age and sex.
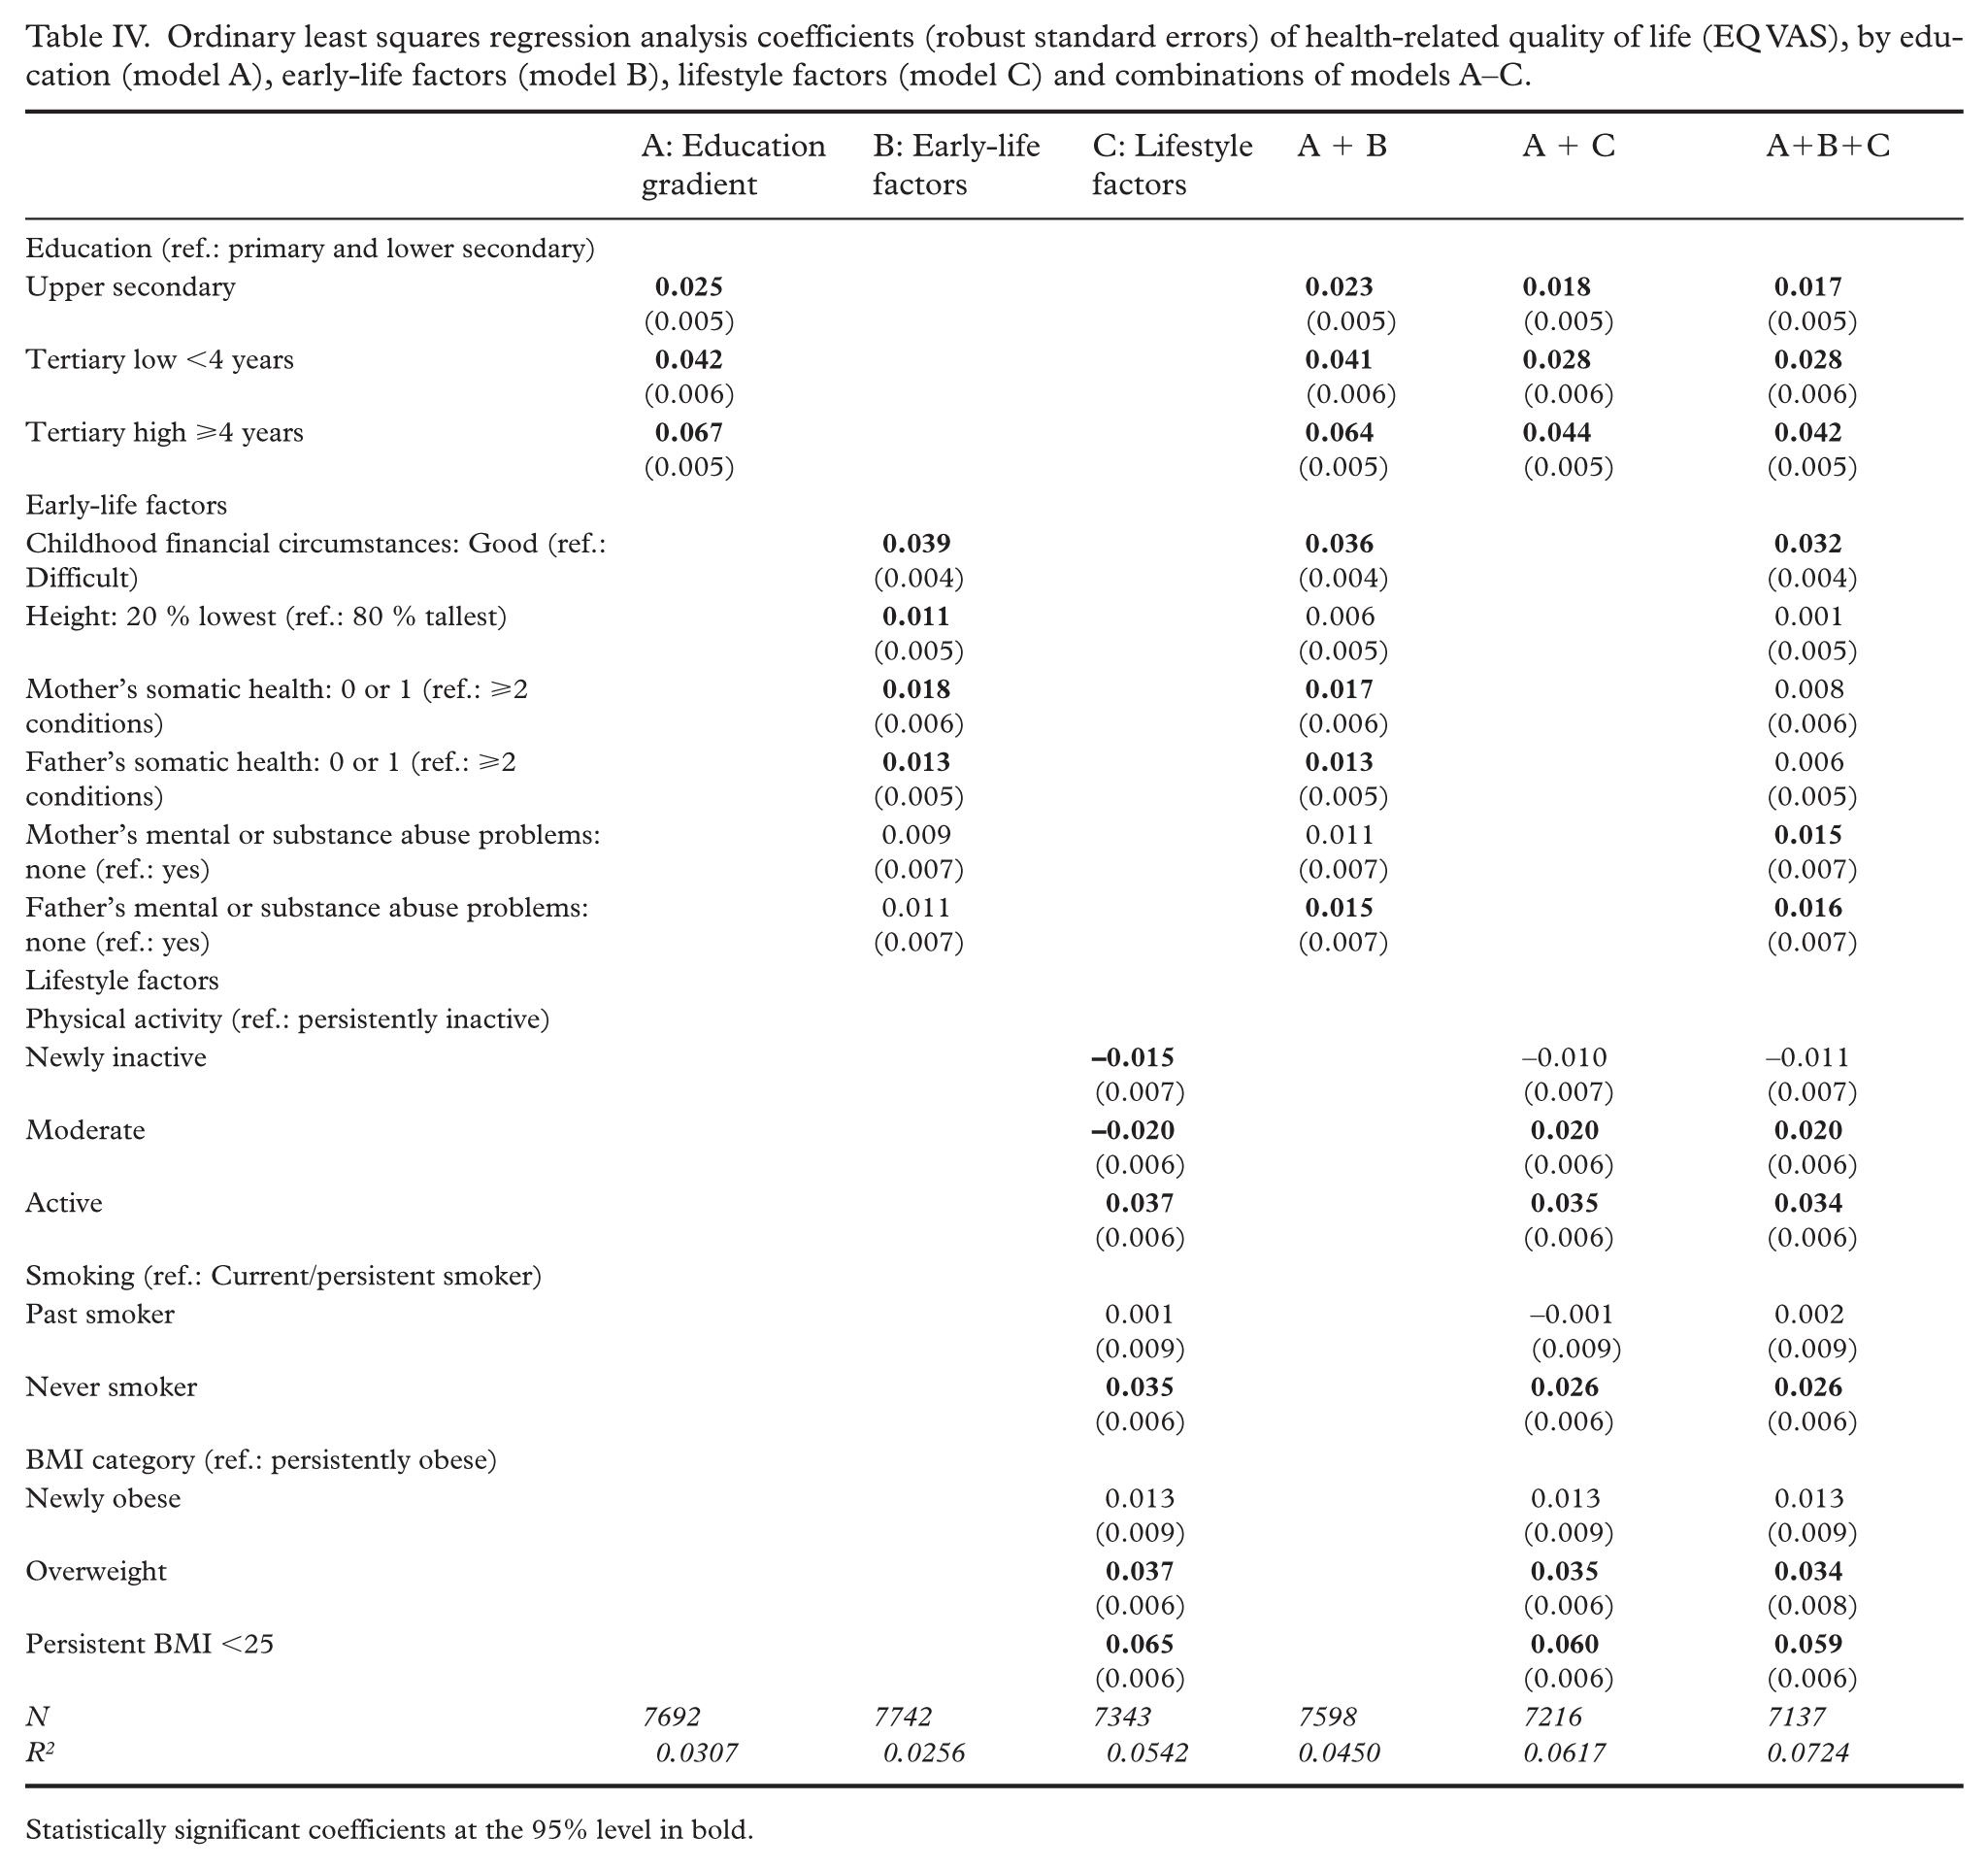
For EQ VAS, as shown in Table IV, the model specifications suggested a similar pattern. The education gradient remained largely unchanged when early-life factors were added (model A+B), but including lifestyle factors considerably attenuated the education coefficients (model A+C; model A+B+C). Nevertheless, unlike the EQ-5D model, the education gradient coefficients for EQ VAS remained statistically significant.
Ordinary least squares regression analysis coefficients (robust standard errors) of health-related quality of life (EQ VAS), by education (model A), early-life factors (model B), lifestyle factors (model C) and combinations of models A–C.
Statistically significant coefficients at the 95% level in bold.
The relative importance resulting from the Shapley–Owen decomposition of the sets of predictors in the full EQ VAS model also differed from those in the full EQ-5D model: education accounted for 25% of the explained variance, early-life factors for 19%, and lifestyle factors for nearly 57% (Figure 1).
Of note was a consistently positive association between good childhood financial circumstances and both outcome measures. For example, for EQ-5D, individuals reporting good childhood financial circumstances had scores that were 0.03 higher in model B and 0.02 higher in model A+B+C, compared with those reporting difficult circumstances. For EQ VAS, the corresponding figure ranged from 0.04 to 0.03, depending on the model specification.
The results from models estimated on the sample used in the fully adjusted model – with a consistent number of respondents across all specifications – did not differ substantially from the main findings (Supplemental Tables II and III).
Sex-stratified analyses (model A+B+C) for the EQ-5D revealed certain apparent differences: the education gradient was insignificant for women, and the association of being or becoming overweight and obese was stronger for women. For EQ VAS, the education gradient was relatively similar between sexes. The BMI coefficients were larger for women than for men (Supplemental Table IV).
Discussion
The aim of this study was to investigate how early-life and adult lifestyle factors associated with the education gradient in health, and to estimate the relative contribution of these three sets of predictors in explaining inequalities in health. Our findings aligned with existing literature on the social gradient in health, showing that higher levels of education, favourable early-life factors and healthy lifestyles were all significantly associated with better health-related quality of life [32 –34]. The results indicated that education and early-life factors were complementary in their associations with health inequalities (stepwise models, Tables III and IV). In other words, parents’ wealth and health were independently associated with health-related quality of life. This underscores potential patterns of intergenerational transmission of socioeconomic conditions and health [6,7]. In contrast, the inclusion of lifestyle factors substantially attenuated the education gradient.
The separate contribution from early-life factors reaffirmed their significant association with health [8]. According to the Shapley–Owen value decomposition, early-life factors explained substantially more in the full EQ-5D model compared with the full EQ VAS model (43% vs. 19%, respectively). It is commonly found that such factors are strong determinants of educational achievements [35]. While we did not specifically examine the pathways between early-life factors and education in the current study, the findings suggested that early-life factors’ influence on health did not flow through education. The joint associations of education and early-life factors on health appeared to operate through distinct pathways. This suggests that certain aspects of early-life factors were not fully captured within the education–health gradient. While our study design cannot establish which early-life factors drive the observed inequality in health-related quality of life, we speculate that the direct association between early-life factors and health reflects material aspects of the overall health gradient. Shapley–Owen decomposition of each of the early-life factors’ separate contributions to the total model fit revealed that childhood financial circumstances explained the largest share of the model fit (output reported in Supplemental Figure 2), supporting this interpretation. Thus, early-life factors may primarily reflect material influences, whereas the education–health gradient may capture other aspects, such as cognitive ability [12].
The attenuation of the education–health association with the inclusion of lifestyle factors suggests that lifestyle factors may mediate the association between education and health. This is consistent with existing literature indicating that higher educational attainment is associated with healthier lifestyles, which in turn, are linked to better health outcomes [11]. Thus, given that education is a well-established determinant of lifestyle behaviours, it was unsurprising that lifestyle factors appeared to ‘consume’ the education gradient in our data. This aligns with prior research showing that health behaviours proxying lifestyle factors explained the majority of education-related health inequalities [36].
Moreover, according to the Shapley–Owen value decomposition estimating the predictor sets’ relative contribution, lifestyle factors emerged as the strongest contributors to the explained variance in health. This was particularly evident in the full EQ VAS model, in which lifestyle factors explained more than 50% of the variance. As such, EQ VAS appeared to be more sensitive to lifestyle factors than the EQ-5D. It is important to emphasise that education overlaps both conceptually and empirically with early-life and lifestyle factors, indicating that its contribution to total explained variance is partly shared with the other predictor sets. Therefore, the relatively low share of variance explained by education in the Shapley–Owen results should not be interpreted as an indication of a weaker role of education as a determinant of health. Instead, it likely reflects the interconnectedness between education and other factors.
When examining the associations between specific lifestyle factors and health outcomes, the patterns were relatively consistent across the two measures. For physical activity, higher levels of activity were positively associated with health, relative to those who were persistently inactive. The negative association observed for newly inactive individuals in the EQ-5D model may reflect that these individuals became inactive due to a health condition [37]. Regarding smoking, only being a non-smoker was positively associated with health, while past smokers did not report significantly better health compared with current/persistent smokers. For BMI, the results indicated being overweight or persistently maintaining a BMI less than 25 was positively associated with health, compared with those with obesity in both surveys (persistently obese).
Nonetheless, it must be emphasised that the sample was generally healthy, given that this was a community sample. The mean and median EQ-5D values were 0.88 and 0.91, respectively, indicating that a large proportion of the sample reported no or few problems across the EQ-5D dimensions. The mean and median EQ VAS scores were 0.77 and 0.80, respectively, suggesting a similarly high reporting of EQ VAS.
The observed differences in the education–health gradient and the relative contribution of the predictor sets between the two health-related quality of life outcomes may reflect the distinct nature of the EQ-5D and the EQ VAS. First, their response alternatives differ substantially. The EQ-5D-5L requires respondents to describe their health on five dimensions along five levels, which are combined into a summary index for analysis. For the EQ VAS, the respondents select a number on a 0–100 scale, resulting in a much wider dispersion of responses. This likely explains the larger coefficient magnitudes observed in the EQ VAS compared with the EQ-5D model. Second, the EQ-5D is a domain-specific descriptive system, whereas the EQ VAS is a general measure that captures individuals’ subjective evaluations of their overall health. Therefore, the EQ VAS may be more sensitive to factors beyond the five domains of the EQ-5D. The persistence of the education–health gradient in the EQ VAS model may reflect that respondents think more broadly about what constitutes health when they assign their score on the VAS, such as social relationships, health literacy and wellbeing [38].
Contributions and limitations
This paper contributes with new insights into the education–health gradient and the associations of early-life factors and lifestyle factors with health outcomes within a high-income, egalitarian setting. Using a rich set of determinants of health, including unique variables on parental health and lifestyle factors, we shed light on the education gradient, highlighting the need to motivate carefully the choice of socioeconomic position measure. The physical activity, smoking and BMI variables were consistently measured between the two waves. Calculated as change between Tromsø6 and Tromsø7, this provided a more nuanced picture than purely cross-sectional estimates, capturing both stability and change over time. Finally, our findings indicate that the distinct associations between early-life factors and health inequalities underscore the potential value of universal public health measures that improve childhood circumstances, such as increasing child benefits and facilitating access to nursery enrolment. This aligns with previous research showing that approaches focused solely on individual behavioural change are overly simplistic [39], and highlights the need to address the structural and social determinants shaping both the education–health gradient and inequalities in lifestyle-related factors.
This study has some limitations. First, given that the predictors refer to different points in time, alternative methods, such as mediation models, could have been employed to capture potential causal pathways. However, this was beyond the scope of the current paper. Second, the study’s observational design does not allow for causal interpretation of the observed associations. Educational attainment is likely influenced by unobserved characteristics, such as cognitive ability, personality traits and childhood health, which may have biased our estimates. Moreover, any changes to respondents’ health between Tromsø6 and Tromsø7 may have influenced the reporting of lifestyle factors. Therefore, our results should be interpreted as descriptive, rather than as estimates of causal effects. Third, the study relied on self-reported data, which carries the risk of misreporting and recall bias, exemplified by the retrospective measurement of early-life factor variables. Fourth, other lifestyle factor variables could have been considered – for example, diet and alcohol consumption. However, the measurement of diet differs substantially across studies, and it was inconsistently measured in Tromsø6 and Tromsø7. Alcohol consumption was excluded due to very few reporting a heavy alcohol consumption and given the ambiguous interpretation of teetotallers. Finally, the sample was restricted to respondents who participated in both Tromsø6 and Tromsø7, which may have limited the generalisability of the findings for the overall population of Tromsø. For instance, the distribution of educational levels in our sample differed from the 2015 educational distribution reported by Statistics Norway [40].
Conclusions
This study shows that early-life factors complemented education in their associations with health-related quality of life, while adult lifestyle factors could be mediating the relationship between education and health. Among the three sets of predictors, lifestyle factors appeared to have the strongest associations, particularly for EQ VAS. The finding that early-life factors were independently associated with health inequality emphasises the relevance of considering these factors when addressing the social gradient in health. This also underscores that the choice of socioeconomic position indicator is not trivial [36]. Future research should further explore these relationships, particularly using longitudinal methods, to better inform public health policies aimed at reducing inequalities in health.
Supplemental Material
sj-docx-1-sjp-10.1177_14034948261437479 – Supplemental material for Beyond the education-health gradient: the importance of early-life and lifestyle factors for health-related quality of life: A Norwegian cohort study
Supplemental material, sj-docx-1-sjp-10.1177_14034948261437479 for Beyond the education-health gradient: the importance of early-life and lifestyle factors for health-related quality of life: A Norwegian cohort study by Marie Hella Lindberg, Birgit Abelsen, John Wildman and Jan Abel Olsen in Scandinavian Journal of Public Health
Footnotes
Acknowledgements
The authors thank all the participants in the Tromsø Study. They are thankful to colleagues and conference/seminar participants for helpful comments to previous versions. They would also like to thank two anonymous reviewers for their thorough and constructive feedback and suggestions. During the preparation of this work the authors used the generative AI tool Chat UiT to improve language flow and readability. After using this tool, the authors reviewed and edited the content as needed and take full responsibility for the content of the publication.
Declaration of conflicting interests
The authors declared no potential conflicts of interest with respect to the research, authorship, and/or publication of this article.
Funding
The authors received no financial support for the research, authorship, and/or publication of this article.
Supplemental material
Supplemental material for this article is available online.