
Abstract
Aims:
This study examined the prevalence of outdoor and in-store food and health-related advertisements, and whether their distribution differed by neighbourhood socioeconomic status (SES) in Stockholm, Sweden.
Methods:
A cross-sectional observational design was employed using EPOCH—an adapted tool with pre-defined categories to collect data on outdoor and in-store advertising in 10 lower-SES and 12 middle-SES neighbourhoods in Stockholm. Outdoor advertisement distributions were compared between SES categories using the Mann–Whitney U test, while in-store advertisement counts were analysed using regression models tailored to outcome distributions.
Results:
Most advertisements featured energy-dense, nutrient-poor (EDNP) foods and sugar-sweetened beverages (SSBs)—59 percent of outdoor advertisements and 65 percent of in-store advertisements. Although differences in the prevalence of outdoor and in-store advertisements were noted between low- and middle-SES neighbourhoods, these associations were not statistically significant following correction for multiple testing.
Conclusion:
Across all neighbourhoods, advertisements were dominated by unhealthy products, particularly EDNP foods and SSBs. Similar levels of exposure in low- and middle-SES neighbourhoods suggest that neighbourhood SES is not a key predictor of advertising patterns in Stockholm. These findings highlight a widespread exposure to unhealthy food advertising, underscoring the need for public health strategies to address environmental drivers of diet-related outcomes.
Keywords
Introduction
The rates of overweight, obesity, and diet-related non-communicable diseases (NCDs) continue to rise globally [1]. In 2022, the prevalence of overweight and obesity among adults aged 25–84 years in Sweden was 55 percent, following a social gradient, where 65 percent with pre-secondary education were overweight or had obesity, compared with 59 percent and 47 percent among those with upper-secondary and post-secondary education, respectively [2]. Diet, particularly energy-dense, nutrient-poor (EDNP) foods and sugar-sweetened beverages (SSBs), has a vital role to play in obesity and other NCDs [3 –5]. Furthermore, the marketing of these foods in food environments influences attitudes, preferences and consumption—a link that has been established among children [6]. Research on outdoor food advertising has shown it to be ubiquitous, with foods categorised as unhealthy, including EDNP foods such as fast food and SSBs, being some of the most commonly advertised product types [7]. In addition, neighbourhoods of low socioeconomic status (SES) have been found to have higher exposure to outdoor (food) advertising compared with neighbourhoods of higher SES [8]. In-store marketing, also known as ‘point of purchase’ or ‘point of sale’ marketing, includes messaging inside the store environment to directly influence purchase decisions, where the majority of in-store purchases are made impulsively [9]. A combination of internal factors, such as impulsivity traits, sensation-seeking and norms, combined with external marketing stimuli, including store atmospherics, merchandise, communications and price discounts, contributes to the likelihood of carrying out impulse buys [10]. There is limited research on this aspect of consumer food environments from a public health perspective. However, in-store advertising in grocery stores has also been found to promote EDNP foods [11].
There is limited research on food advertising in Sweden, particularly regarding outdoor and in-store food environments. This study aimed to describe the presence of outdoor and in-store food and health-related advertisements and determine whether this differs by neighbourhood SES.
Methods
Study design
A cross-sectional observational study was conducted using a checklist to identify outdoor and in-store advertising in selected neighbourhoods of Stockholm, Sweden [12]. Low- and middle-SES neighbourhoods were chosen to focus on socioeconomically disadvantaged populations due to their higher prevalence of NCDs [13]. This study was part of the implementation trial ‘Self-Management and Reciprocal learning for the prevention and management of Type 2 Diabetes’ (SMART2D) [14].
Sample
The study was set in the central municipality of Stockholm, Sweden. In 2017 (the start of data collection), this municipality comprised 130 smaller units known as ‘stadsdelar’, which we refer to in this paper as neighbourhoods. To select the sample, the 130 neighbourhoods were ranked into deciles based on two separate SES variables: income and unemployment [15]. The resulting study sample consisted of 10 out of 13 neighbourhoods from the lowest decile (decile 1), and 12 out of 26 neighbourhoods from the ‘middle’ deciles (deciles 5–6) for both SES indicators. Only neighbourhoods with food retail outlets were included, and the total number of neighbourhoods included was determined by the study’s planned scope, while still covering most low-SES neighbourhoods.
Data collection tool
The ‘Environmental Profile of a Community’s Health’ (EPOCH) tool was developed in the PURE study [12], in which direct community observation demonstrated high inter-observer reliability. This tool was modified by authors and others in the SMART2D implementation trial [14]. The EPOCH tool gathered information on aspects of the food environment—food availability, labels, prices and advertising. Regarding the section on advertising, the tool was modified only for in-store advertisements: it was changed from noting categories of 0, 1–2 or 3+ to the actual count. This change was made after data collection was complete for the first study neighbourhood, because the categories did not reflect the observed range of advertisements. A tablet or paper version was used to collect study data, supplemented with photos and data were managed by REDCap electronic data capture tools hosted at the Karolinska Institutet [16]. Three data collectors were trained on the content and standard operating procedures and partnered with a data collector with more experience with the tool for their first neighbourhood.
Data collection
Data were collected between the autumn of 2017 and the autumn of 2019, with the majority collected between the end of 2018 and 2019 (pre-COVID). Advertisements were observed through ground-truthing during the ‘community observation walk’ section, a pre-planned, approximately 1-km stretch of the central area that covered most food outlets in each neighbourhood. In-store advertisements were observed through a ‘food retail outlet assessment’. For a more detailed description of the ‘community observation walk’ and ‘food retail outlet assessment’ procedures, see the methods in the previous study based on the EPOCH tool in Sweden [14]. Each of the 22 neighbourhoods had one ‘community observation walk’ and one count per category of food advertisements. For ‘unhealthy advertisements’, the following categories were added together: EDNP foods, SSBs, tobacco products and alcohol. Similarly, ‘health promoting advertisements’ included: food or diet-related (healthy), physical activity, tobacco (no smoking signs, smoking cessation) and alcohol (cessation). The ‘unhealthy food advertisements’ as well as ‘diet-related health promoting advertisements’ consisted of the above; however, excluding those relating to physical activity, tobacco or alcohol. All advertisements and images along the planned route were recorded in accordance with the EPOCH protocol [12]. This included all advertisements on billboards, pasted on walls, bus stops and on buses or cars that passed by during the time of data collection (Supplemental information). The tool did not specifically record the time of year, season or religious and cultural celebrations.
Along the ‘community observation walk’ described above, stores categorised as supermarkets, independent grocers, convenience stores and informal vendors (as defined in the EPOCH tool) were included for observing in-store advertisements. Where available, the first two stores of each type along the route were visited for a ‘food retail outlet assessment’. In a few cases, in accordance with standard operating procedures and to enable observation of two of each outlet type where possible, food outlets outside the geographical boundary adjacent to the borders were included. Inside stores, advertisements, images, displays and signs that showed or related to EDNP food, SSBs, tobacco products and alcohol were noted under the category ‘unhealthy advertisements’, and fruits and vegetables represented ‘health-promoting advertisements’.
Data analysis
To examine whether patterns of outdoor advertising varied by neighbourhood SES, we applied the non-parametric Mann-Whitney U test to compare low- and middle-SES neighbourhoods. To ensure the findings were not skewed by population density, we conducted a sensitivity analysis using per capita advertisement counts. This adjustment did not yield meaningful changes in the results, thereby affirming the robustness of our comparisons.
For in-store advertising, data from one low-SES neighbourhood could not be included in the complete analysis, resulting in analyses based on nine neighbourhoods and the exclusion of nine stores (two supermarkets, two independent grocers, three convenience stores and two informal vendors). However, for alcohol advertisements, data from seven of these stores were retained because no alcohol advertisements were present. Analyses of in-store advertising involving alcohol, unhealthy advertisements and total advertisements were therefore based on 90 stores, while all other variables were based on 83 stores. In the in-store advertising analysis, we employed negative binomial regression models to examine the association between neighbourhood SES and the count of various advertisement types. To provide a clearer picture of exposure and minimize statistical complications such as multicollinearity, we created composite indicators. These represented clustered advertisement categories: one focussed on unhealthy food and beverage advertisements (EDNP foods and SSBs), another capturing all unhealthy advertisements (including tobacco and alcohol) and a third encompassing all advertisements. This allowed us to present both total exposure and category-specific insights.
Due to a substantial number of zero observations in the fruit and vegetable advertisement category, a zero-inflated negative binomial (ZINB) regression model was fitted using the zeroinfl() function from the pscl package in R. SES was included as a predictor in both the count and zero-inflation components, with middle SES specified as the reference group. Alcohol advertisement counts, which exhibited overdispersion and potential heteroscedasticity, were analysed in SPSS using negative binomial regression with robust standard errors through the Generalised Estimating Equations framework.
Across all models, SES was included as a key predictor. To control for multiple comparisons, we applied the Benjamini–Hochberg procedure, maintaining the false discovery rate at five percent and Wald-based confidence intervals to ensure statistical validity [17]. Results are reported using adjusted q values, and analyses were conducted using IBM SPSS Statistics (version 26.0) and R.
Ethical considerations
This study on advertising in food environments was observational, and no human subjects were included. This study was nested in the SMART2D project, which received overall approval for observational data from the Regional Ethics Review Board in Stockholm (2015/712-31/1 and 2016/2521-31/1). For smaller stores, we sought verbal consent to collect data from a store manager and distributed information, including contact details. The neighbourhoods and stores are left unnamed to preserve their anonymity.
Results
Observations of outdoor advertising in 22 neighbourhoods and in-store advertising in 83 of 196 existing food retail outlets within 21 neighbourhoods (Table I) revealed a large proportion of advertisements for EDNP foods and SSBs. There were minor, non-significant differences in outdoor and in-store advertising across neighbourhood SES levels.
Store types and frequency of in-store advertisements by SES category.
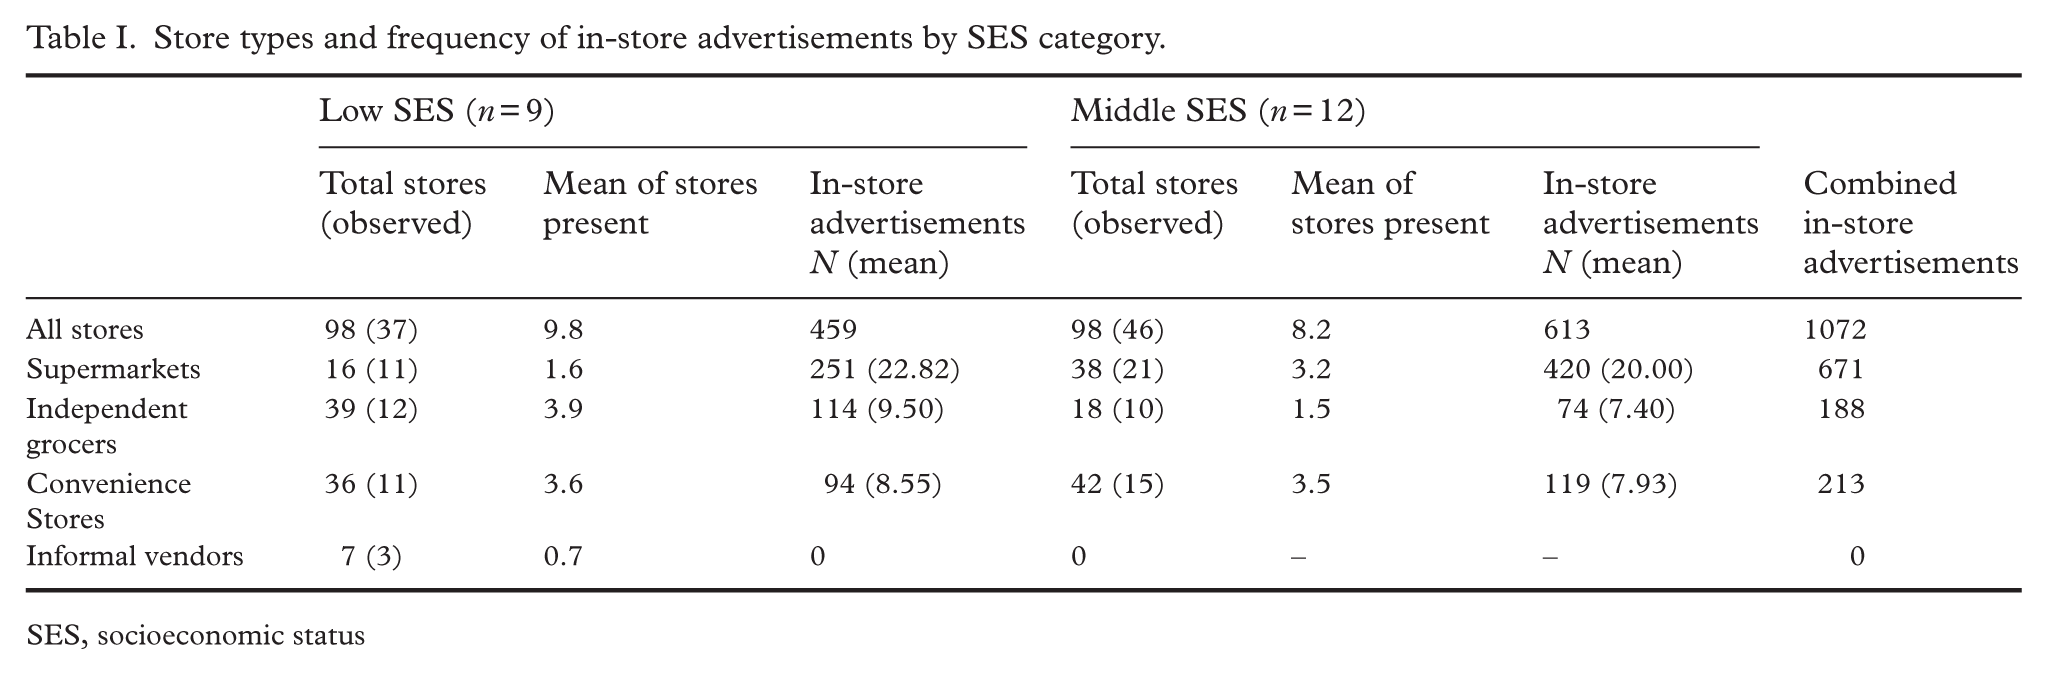
SES, socioeconomic status
Outdoor advertising
Unhealthy advertisements dominated outdoor spaces, accounting for 69 percent of total advertisements (median = 24.5), compared with 31 percent health-promoting advertisements (median = 6) (Table II and Figure 1). Among food-related advertisements, EDNP foods and SSBs made up the majority (median = 19; 59%), while advertisements promoting healthier diets (e.g., fruits and vegetables) were fewer (median = 4; 21%). EDNP foods alone represented nearly half of all outdoor advertisements (median = 13) and SSBs about 10 percent (median = 4). Tobacco and alcohol advertising were limited (4% and 7%, respectively). Most health-promoting food advertisements featured produce imagery on storefronts, with no advertisements discouraging alcohol consumption.
Outdoor advertisement patterns across SES groups: counts, proportions, and statistical significance.
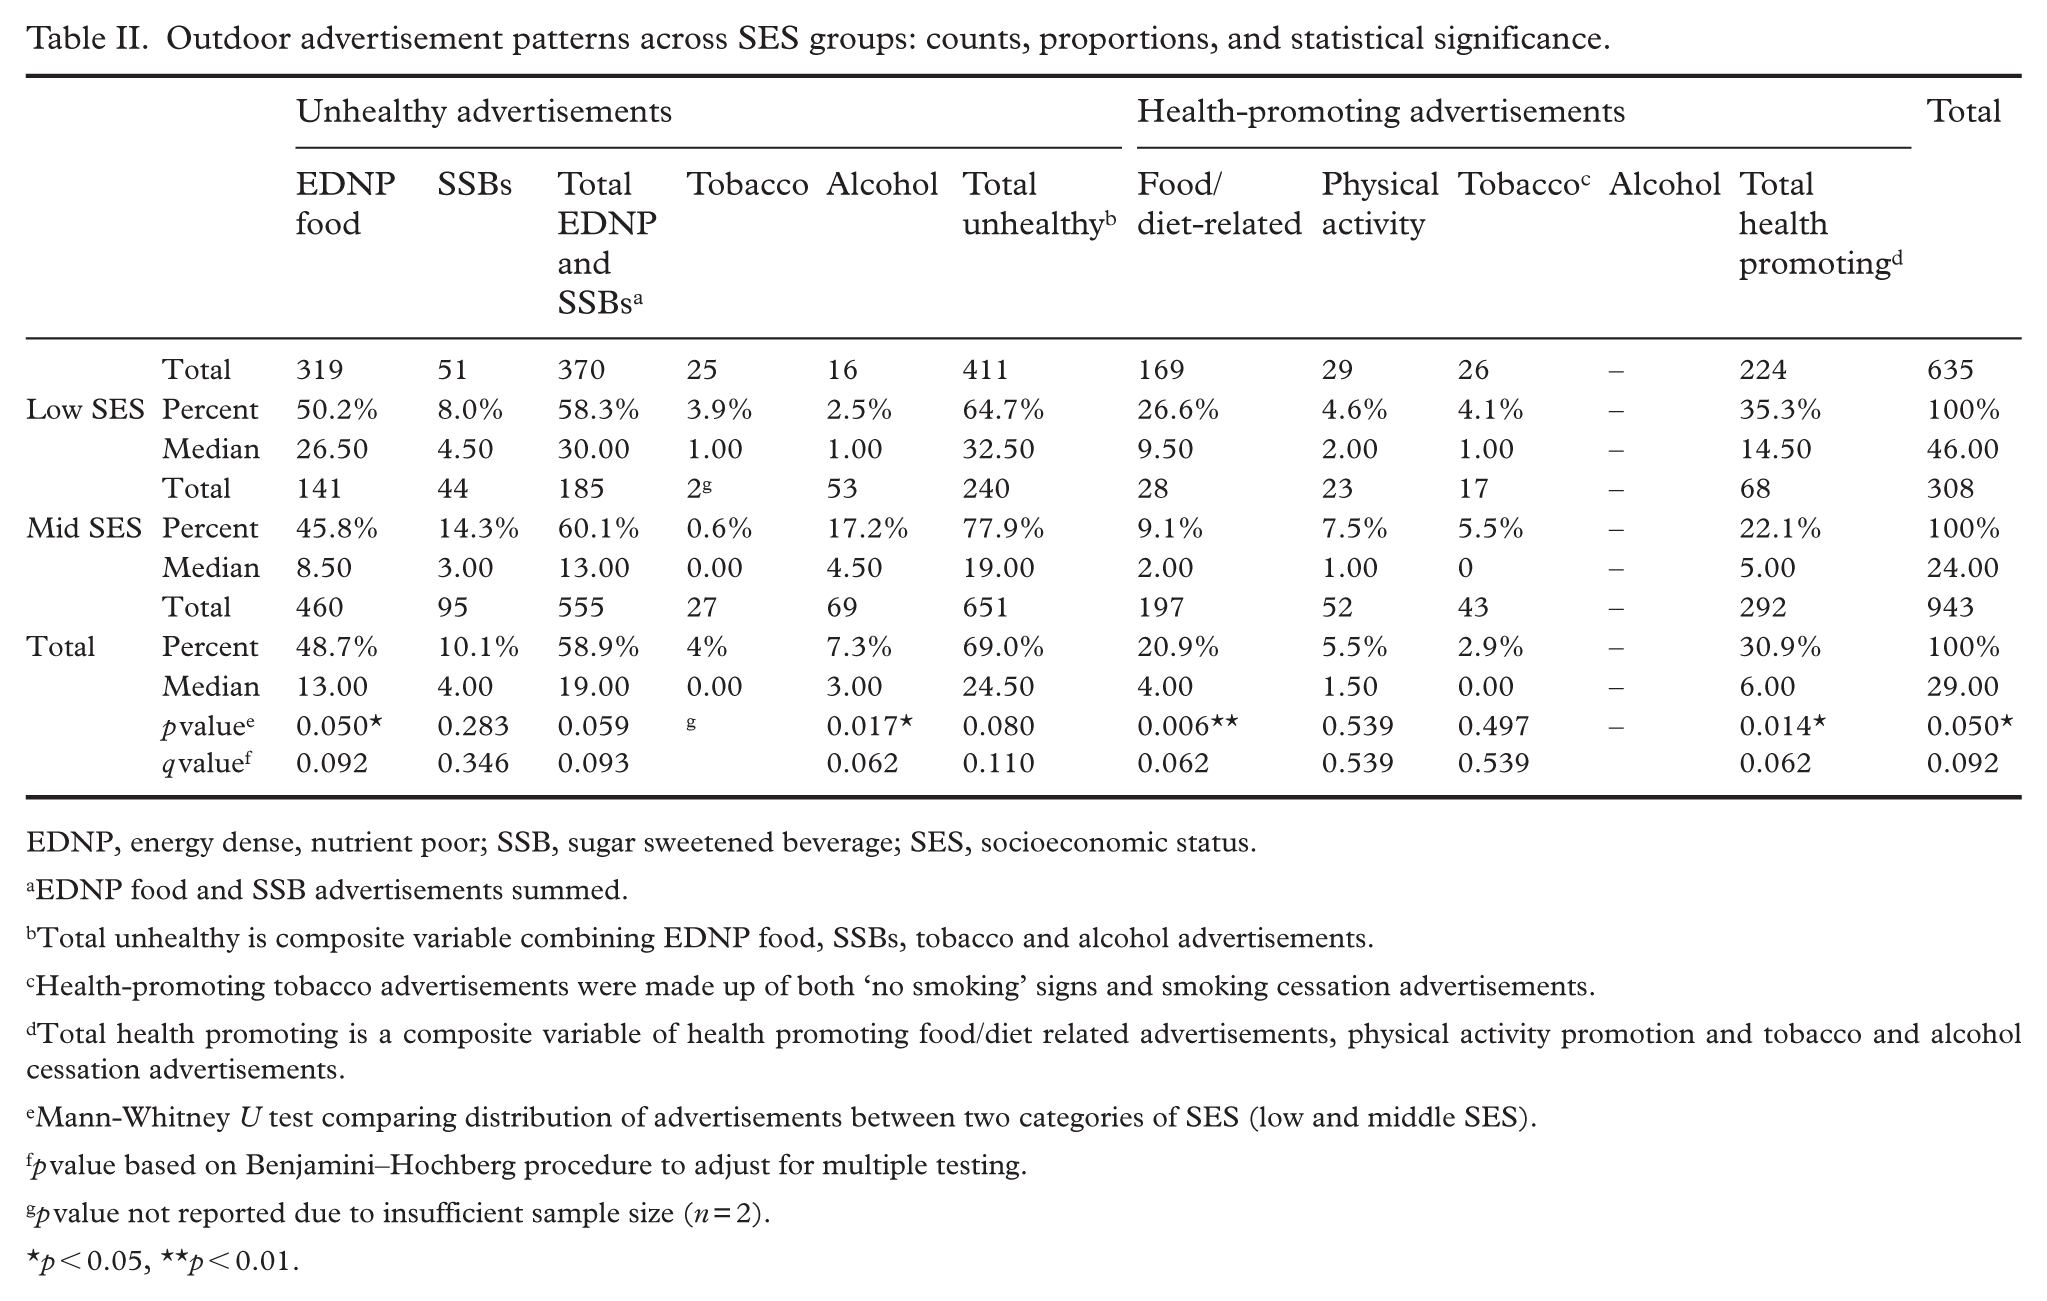
EDNP, energy dense, nutrient poor; SSB, sugar sweetened beverage; SES, socioeconomic status.
EDNP food and SSB advertisements summed.
Total unhealthy is composite variable combining EDNP food, SSBs, tobacco and alcohol advertisements.
Health-promoting tobacco advertisements were made up of both ‘no smoking’ signs and smoking cessation advertisements.
Total health promoting is a composite variable of health promoting food/diet related advertisements, physical activity promotion and tobacco and alcohol cessation advertisements.
Mann-Whitney U test comparing distribution of advertisements between two categories of SES (low and middle SES).
p value based on Benjamini–Hochberg procedure to adjust for multiple testing.
p value not reported due to insufficient sample size (n = 2).
p < 0.05, **p < 0.01.
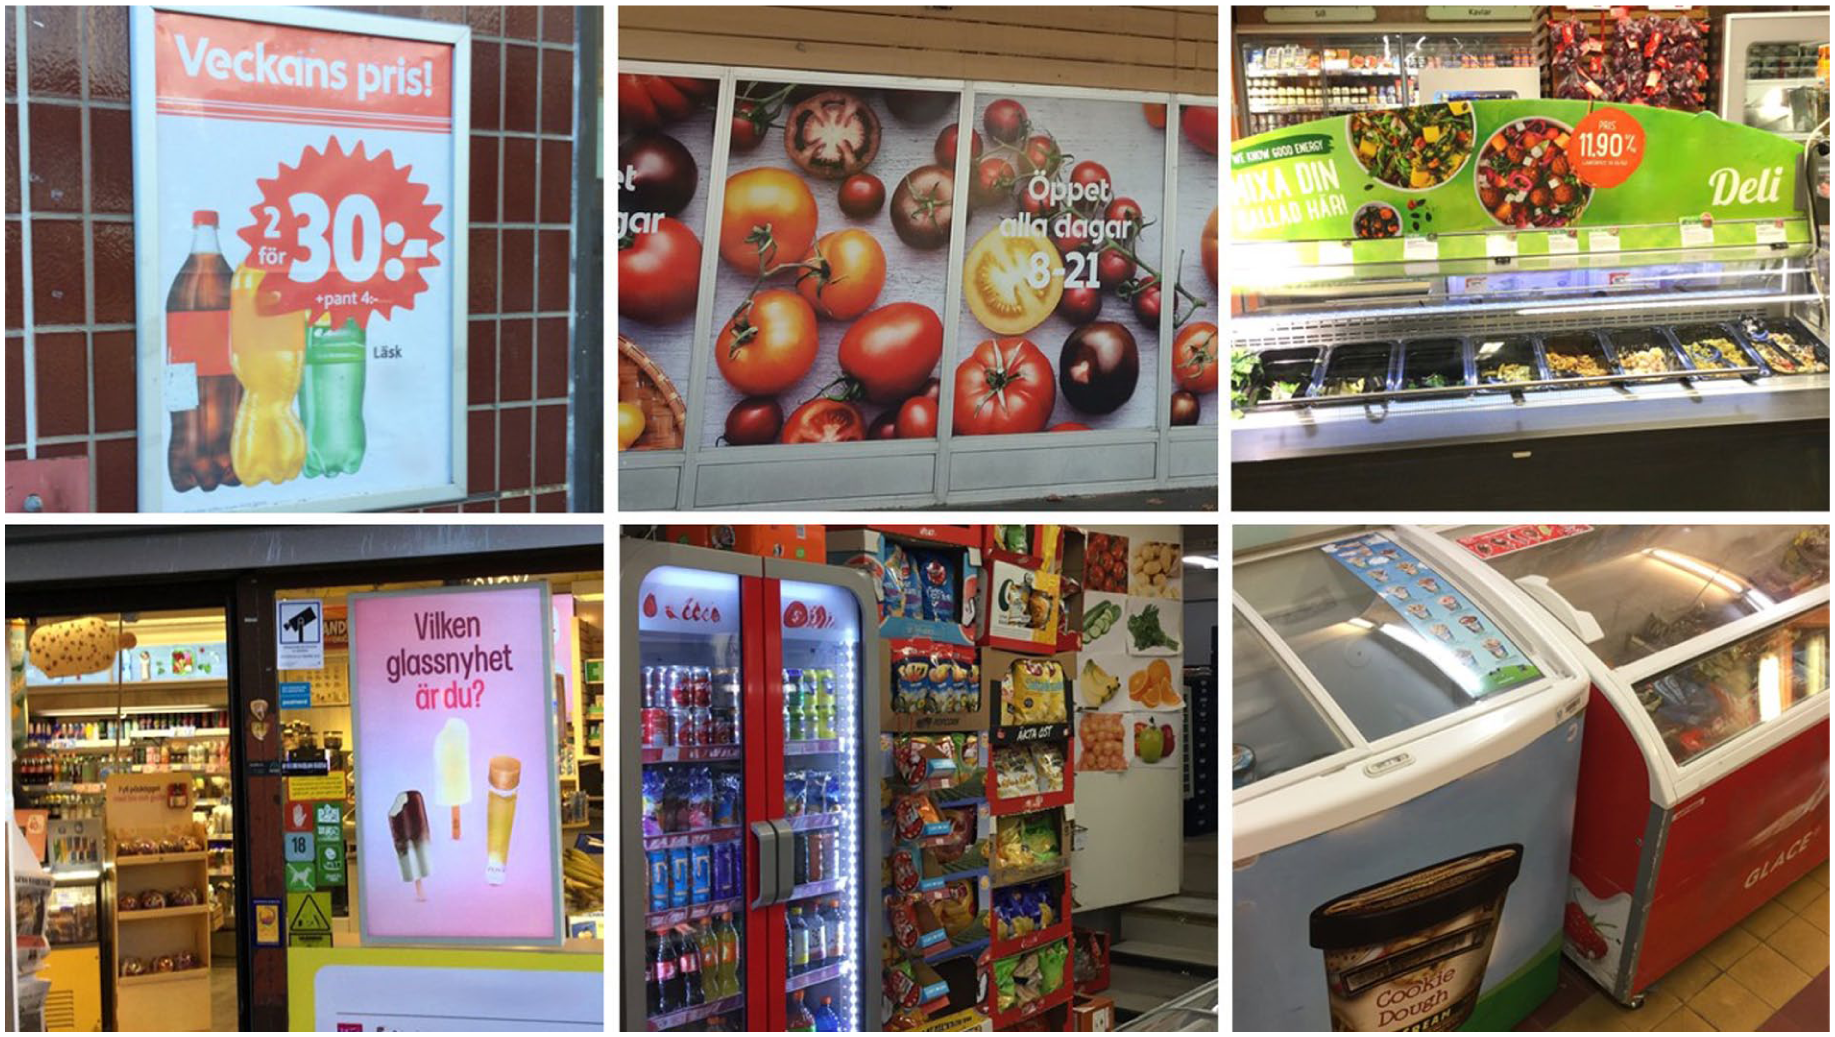
Images of outdoor and indoor advertisements.
Neighbourhood SES and outdoor advertisements
Low-SES neighbourhoods showed higher overall outdoor advertisement counts (median = 46) than middle-SES areas (median = 24), although this difference was not statistically significant after adjusting for multiple testing (p = 0.05, q = 0.092). In both SES categories, EDNP food and SSB advertisements constituted the majority (low SES: 58%; middle SES: 60%). While there were more EDNP food advertisements (p = 0.05, q = 0.092) in low-SES neighbourhoods than middle-SES neighbourhoods, these differences did not remain statistically significant after adjusting for multiple comparisons. Similarly, there were no significant differences between neighbourhoods for tobacco and alcohol after adjusting.
Health-promoting advertisements were more common in low-SES neighbourhoods (median = 14.5) than in middle-SES areas (median = 5), especially for food-related content (median = 9.5 versus 2). However, these patterns also failed to reach significance after adjusting for multiple testing.
In-store advertising
Among the in-store advertisements observed, unhealthy advertisements were prevalent across all neighbourhoods, accounting for approximately 88 percent of all advertisements. EDNP foods with SSBs was the most commonly advertised category, together accounting for more than 65 percent of total advertising exposure (Table III and Figure 1).
Summary of regression results across in-store advertisement types: negative binomial and variants.
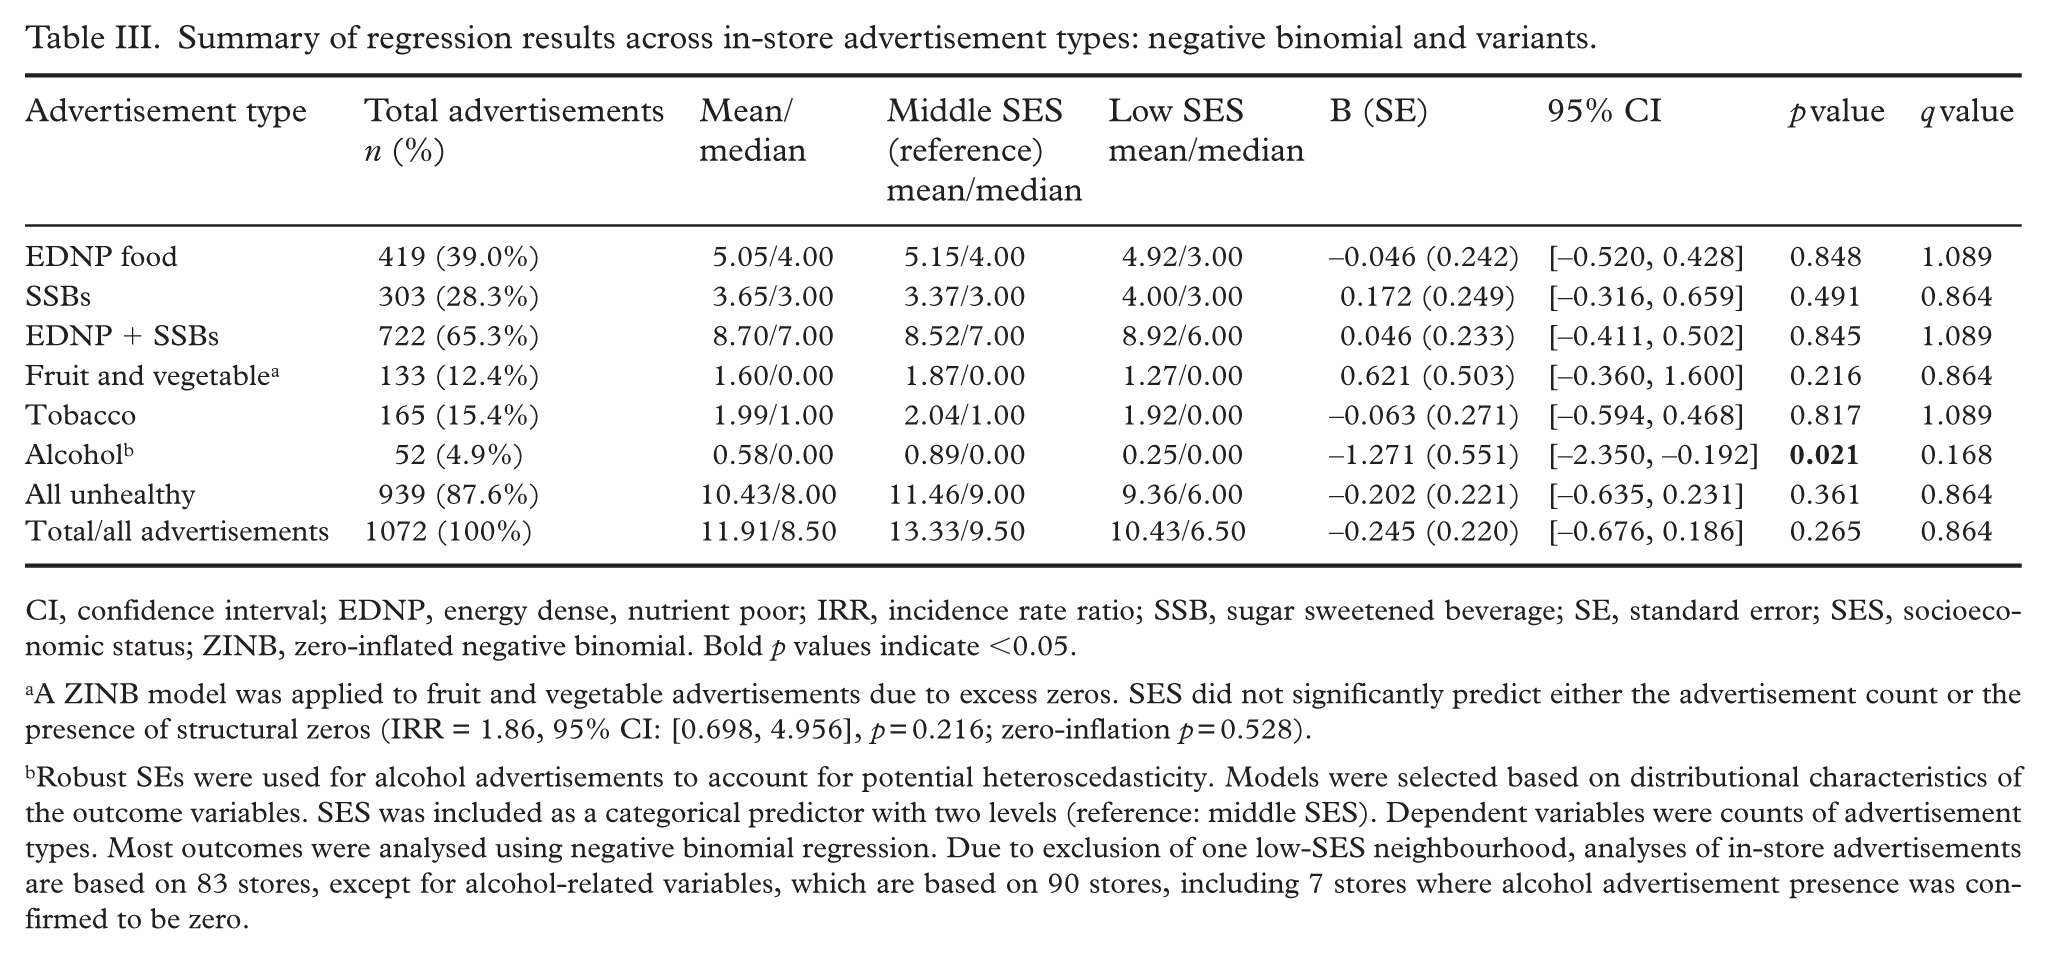
CI, confidence interval; EDNP, energy dense, nutrient poor; IRR, incidence rate ratio; SSB, sugar sweetened beverage; SE, standard error; SES, socioeconomic status; ZINB, zero-inflated negative binomial. Bold p values indicate <0.05.
aA ZINB model was applied to fruit and vegetable advertisements due to excess zeros. SES did not significantly predict either the advertisement count or the presence of structural zeros (IRR = 1.86, 95% CI: [0.698, 4.956], p = 0.216; zero-inflation p = 0.528).
Robust SEs were used for alcohol advertisements to account for potential heteroscedasticity. Models were selected based on distributional characteristics of the outcome variables. SES was included as a categorical predictor with two levels (reference: middle SES). Dependent variables were counts of advertisement types. Most outcomes were analysed using negative binomial regression. Due to exclusion of one low-SES neighbourhood, analyses of in-store advertisements are based on 83 stores, except for alcohol-related variables, which are based on 90 stores, including 7 stores where alcohol advertisement presence was confirmed to be zero.
Neighbourhood SES and in-store advertisements
When comparing the prevalence of in-store advertisements between middle- and low-SES neighbourhoods, most differences were minor and not statistically significant. The only category to show a statistically significant difference before correction was alcohol. Stores in low SES neighbourhoods featured significantly fewer alcohol advertisements [incidence rate ratio (IRR) = 0.28, 95% confidence interval (CI): [0.095, 0.826], p = 0.021], although this association did not hold after adjusting for multiple testing (q = 0.168). Despite a statistically significant reduction in alcohol advertisements in low-SES neighbourhoods, the absolute prevalence of alcohol advertisements was low (median count = 0), suggesting limited practical significance.
For all other categories, including EDNP foods (IRR = 0.96, 95% CI: [0.594, 1.534], p = 0.848), SSBs (IRR = 1.19, 95% CI: [0.729, 1.933], p = 0.491), tobacco (IRR = 0.94, 95% CI: [0.552, 1.597], p = 0.817), fruit and vegetables (IRR = 1.86, 95% CI: [0.698, 4.956], p = 0.216), the combined EDNP and SSB category (IRR = 1.05, 95% CI: [0.663, 1.652], p = 0.845), total unhealthy advertisements (IRR = 0.82, 95% CI: [0.530, 1.260], p = 0.361), and total advertisements overall (IRR = 0.78, 95% CI: [0.509, 1.204], p = 0.265), no statistically significant differences were detected between SES groups. Taken together, the results suggest that neighbourhood SES is neither a strong nor a consistent predictor of in-store advertising exposure, with similar levels observed across low- and middle-SES neighbourhoods.
Discussion
Overall, both outdoor and in-store food environments were found to comprise primarily unhealthy advertisements, mostly for EDNP food and SSBs. There were minor non-significant differences in outdoor advertisements by neighbourhood SES, indicating similar exposure to both outdoor and in-store advertising across the low- and middle-SES neighbourhoods.
Overall, we observed a higher prevalence of unhealthy outdoor advertisements than health-promoting ones. In particular, EDNP foods and SSBs were featured prominently (60%)—a pattern observed in studies from the United States, Australia, New Zealand, the United Kingdom and countries in Africa, Asia and Central America [7]. This is also in line with another study from Stockholm that categorised all observed advertisements in one high-SES and one low-SES area, which found that, in total, 65 percent of all the food advertisements in both areas promoted EDNP foods such as sugary drinks, fast food, candy and ice cream [18]. The promotion of unhealthy foods can exacerbate an already unhealthy diet and negative health outcomes. A cross-sectional study from the United States found that living in areas where 30 percent of advertisements were for food was associated with a 2.6 percent higher probability of obesity compared with areas without food advertising [19].
We found some differences in outdoor advertising between low- and middle-SES neighbourhoods, though there were no significant differences after controlling for multiple testing. The above-mentioned study from Stockholm found that the lower-SES area had a significantly higher proportion of advertisements for EDNP foods, as compared with the high-SES area [18]. Studies from the United States, the United Kingdom, Canada, Australia and New Zealand also showed socioeconomic differences in unhealthy food advertising in outdoor areas, with unhealthy food marketing more prevalent in areas of lower SES. However, two studies in a review found no differences [20 –22]. This study did not find differences in outdoor advertising by neighbourhood SES, although larger-sample studies would be required to investigate this further. The slightly higher level of outdoor advertising in low-SES neighbourhoods (excluding alcohol) may be related to a greater number of independent grocers in these neighbourhoods, who post more notices outside their stores to promote both healthier and less healthy options. Additionally, there may be less rigorous follow-up on small advertisements and notices posted compared with those in middle-SES neighbourhoods. Health-related initiatives that display notices and advertisements to address health and social challenges may help explain the slightly higher prevalence of health-promoting outdoor advertisements in low-SES neighbourhoods compared with those in middle-SES areas.
The results for in-store advertising in this study showed similar levels across low- and middle-SES neighbourhoods. However, middle-SES neighbourhoods had a slightly higher overall level than low-SES neighbourhoods. This could be explained partly by the fact that middle-SES neighbourhoods in our study had more supermarkets than low-SES neighbourhoods. This study and a previous study by the authors found that supermarkets had the most in-store advertisements for most product categories, compared with other store types [14]. Chain supermarkets present in both types of neighbourhoods would likely share advertising strategies, which could help explain the lack of observed differences between low- and middle-SES neighbourhoods. Through in-store advertising in food retail outlets, the population, including children, will be exposed regularly to unhealthy food advertisements while purchasing food, thereby encouraging less healthy choices.
Outdoor and in-store advertising exposes and familiarises adults and children alike to these unhealthy foods. Such influences on children’s food choices, in particular, can have a negative impact on diet as well as longer-term health [23]. So far, few settings globally have implemented restrictions on outdoor or in-store food advertising [24]. In Sweden, there are general restrictions on advertising as stated in the Marketing Act, particularly regarding the targeting of children, as well as the way in which products or services can be promoted [25]. These restrictions do not apply to the nutritional content, thereby allowing for promotion of EDNP food products [25]. Tobacco and alcohol are examples where regulations in advertising have been put in place, as indicated by the limited advertisements for these. Despite evidence linking specific foods to negative health outcomes, limited action has taken place to prevent the promotion of these, due partly to powerful actors influencing the regulatory and policy process to enable their own interests [26,27].
Strengths and limitations
Outdoor advertisements are changed frequently, and because this study was cross-sectional and spread unevenly across two years, it was not possible to capture variations in the numbers and types of advertisements over time or across different seasons or cultural celebrations. In addition, this data was collected pre-COVID-19; during the pandemic, marketing through online platforms grew in importance [28], as marketing budgets decreased [29].
We captured a snapshot of outdoor advertising limited to the central parts of the study neighbourhoods; however, this may not have substantially affected the results, as other parts of the neighbourhoods were primarily residential, with few or no advertisements. The inclusion criteria of food outlets in neighbourhoods could be a weakness of the study. Those neighbourhoods without food retail outlets would be primarily suburban villa areas in Stockholm, which are not low-SES. Additionally, observing all food retail outlets within neighbourhoods would yield more representative data, as differences in the number and types of outlets would have a greater influence on the results, although it would require more resources. A pre-categorized checklist for noting advertisements, as in the EPOCH tool, is an effective way to capture information; however, it does not reflect the true proportion of advertisements. The strengths of this study include the use of ground-truthing in both outdoor and in-store environments and the capture of a wide array of advertisement types, resulting in a more accurate representation of the food-related advertising environment.
Conclusion
This study mapped food and health-related advertising in low- and middle-SES neighbourhoods across Stockholm, revealing that EDNP foods and SSBs dominate both outdoor and in-store promotional spaces. While minor differences were observed across neighbourhoods, they were not statistically significant, suggesting a consistent level of exposure regardless of SES. These findings underscore the pressing need for policy interventions to curb the pervasive marketing of unhealthy food options. Strengthening regulatory frameworks could meaningfully improve public health.
Supplemental Material
sj-docx-1-sjp-10.1177_14034948261432741 – Supplemental material for Outdoor and in-store food advertising: food and health-related advertisements in neighbourhoods of low- and middle-socioeconomic status in Stockholm, Sweden
Supplemental material, sj-docx-1-sjp-10.1177_14034948261432741 for Outdoor and in-store food advertising: food and health-related advertisements in neighbourhoods of low- and middle-socioeconomic status in Stockholm, Sweden by Aravinda Berggreen-Clausen, Helle Mölsted Alvesson, JhonÁlvarez Ahlgren, Mark Spires and Meena Daivadanam in Scandinavian Journal of Public Health
Footnotes
Acknowledgements
We are grateful to Shwan Ghaderi for helping to complete the data collection, and send our thanks to all the stores and managers who enabled this study.
Declaration of conflicting interests
The authors declared no potential conflicts of interest with respect to the research, authorship, and/or publication of this article.
Funding
The authors disclosed receipt of the following financial support for the research, authorship, and/ or publication of this article: This study is part of the SMART2D project funded by the European Commission’s Horizon 2020 Health Coordination Activities [Grant Agreement No 643692] under call “HCO-05-2014: Global Alliance for Chronic Diseases: Prevention and treatment of type 2 diabetes” as well as through Crown Princess Margareta’s Memorial Fund (A.B.-C.).
Supplemental material
Supplemental material for this article is available online.