
Abstract
Aims:
Until the late 19th century, Plasmodium vivax malaria was endemic in most of Europe including in the Nordic countries. In Denmark, Finland, and Sweden, the fluctuations in malaria cases and malaria-attributed deaths are known to have been associated with weather conditions, in particular with mean summer temperature variations. However, to what extent other environmental factors could have increased or decreased the risk of malaria has not previously been evaluated using historical records.
Methods:
In this study, we illustrate the non-linear association between different environmental variables (temperature, precipitation, and sea-level variations) and symptom-based malaria (case and death) data, using the quasi-Poisson distributed lag non-linear model. The robustness of the model results was examined through sensitivity analysis.
Results:
The modeling results showed that the risk associated with temperature increased by ∼25% in Denmark and by ∼67% in Sweden and Finland, with a mean summer temperature increase from 16°C to 18°C, was highest at 1–2 lagged years. Furthermore, average precipitation could have a noticeable effect on the malaria risk in Sweden and Finland, but this effect was not observed in Denmark. Environmental perturbations associated with extreme sea levels (>99.7th percentile or <0.1th percentile), including subsequent saltwater intrusion, could lead to increasing malaria risk in low-lying coastal areas.
Conclusions:
Keywords
Background
Malaria is one of the diseases in world history that has claimed the most human lives. Plasmodium vivax (P. vivax) malaria is the most widespread malaria species, and it was endemic in most parts of Europe at least since the early part of the Common Era [1]. Although the last malaria reservoirs were eliminated in Europe in the 1970s, imported and sporadic indigenous transmitted cases have been reported. According to the European Centre for Disease Prevention and Control, the number of reported travel-associated malaria cases in the EU/European Economic Area was slightly above 5000 annually during the 2018–2022 period.
The historical prevalence of malaria in much of the Nordic countries, until the late 19th century, might seem surprising to some considering the cold winter periods in this region, as low temperatures largely restrict malaria transmission. However, despite the comparatively high latitude, large parts of the Nordic countries enjoy relatively long and warm summers—adequate to enable malaria transmission. Comprehensive analyses of the association between weather factors (in particular temperature) and historical malaria cases and deaths, have demonstrated the influence of warm summers in the year prior to malaria outbreaks in Denmark, Finland, and Sweden [2 –4]. Precipitation is also an important factor known to be related to malaria transmission. Changes in hydrological conditions, for example rainfall, floods, droughts, and sea-level variations, directly alter the aquatic habitats for malaria vectors, but their impacts on malaria transmission appear rather inconsistent [5]. This could be due to a delayed effect between these short-term rainfall-driven events and the peak of a malaria epidemic, and a difference in the local settings where such vector breeding and transmission occurred.
The importance of assessing the increased risk of vector-borne diseases attributed to changing rainfall patterns or rapid environmental changes, with future climate change under greenhouse gas emission scenarios such as Representative Concentration Pathway (RCP) 4.5 and RCP8.5, has been highlighted in several studies [6]. In particular, accelerated, global sea-level rise and the increasing risk of coastal flooding are of great concern for most of Europe’s coasts [7] as well as worldwide [8]. As in the past, malaria in large parts of Europe has frequently been associated with environmental changes in coastal wetlands [9]. Rising sea levels and coastal flooding can result in an increase in saline water bodies in low-lying coastal zones, which can have an influence on local malaria vectors, for example, via the creation of new breeding sites. At present, most studies are restricted to the available malaria surveillance data, covering only a few years up to a few decades. As a result, few studies have been conducted to identify the long-term malaria risk associated with climatic/environmental changes, such as temperature, precipitation, and sea-level rise, due to the constraints in data availability. Using a model framework based on historical malaria and climate data, our aim here was to investigate how key environmental factors have influenced past malaria outbreaks in Denmark, Finland, and Sweden and to gain a better understanding of the role that future rapid environmental changes might play in the transmission risk of climate-sensitive, vector-borne diseases.
The Nordic malaria parasite and vectors
The now-extinct human malaria parasite, the Scandinavian P. vivax strain, had a long incubation time of 8–10 months according to the World Health Organization. Unlike the predominant species in the tropics, Plasmodium falciparum, which requires at least 18°C for its development in the vector, the P. vivax parasite has a broader temperature tolerance, meaning development could activate at an ambient temperature of 16
Methods
Malaria cases from historical times
Symptom-based malaria cases and deaths based on symptoms were extracted from parish census records in Sweden, Finland, and Denmark. In this study, two Swedish datasets were used. One was derived from the vital statistics compiled by the predecessor of Statistics Sweden, Tabellverket, covering the period 1749–1859 and obtained from the Demographic Data Base at the Centre for Demographic and Ageing Research (CEDAR) at Umeå University; however, the data after 1831 were incomplete [4] and there were also some gaps for malaria-attributed deaths previous to that [17]. The other dataset contains malaria cases for the entirety of Sweden for the later period 1861–1909, compiled by Dr Carl Flensburg [18] and published in 1911. Data from Denmark and Finland were compiled from previous works [2, 3]. For Finland and Sweden, malaria mortality data (1749–1859 for Sweden, 1750–1850 for Finland) were only available at an annual resolution during the 18th and 19th centuries, while Denmark had monthly incidence data for the period 1862–1880. To model the malaria risk associated with environmental factors in Denmark, we considered their monthly malaria incidence data, while for Finland and Sweden, we used the annual (January–December) malaria deaths reported from the common Swedish–Finnish period (1750–1850). Note that Finland was part of Sweden until 1809 when it became the Grand Duchy of Finland of the Russian Empire. The descriptions of the malaria data included are summarized in Table I.
Description of malaria case and death data.

Tabellverket: the predecessor of Statistics Sweden.
Prevalence, incidence, and mortality rates of malaria in Nordic countries
Figure 1 shows the malaria mortality and incidence rate (per 1000 population) in the three Nordic countries (Sweden, Finland, and Denmark). From 1750 to 1850, the average mortality rate of Sweden (Tabellverket database, yellow line) was estimated to be 0.34 per 1000 population per year, and 1.56 during the 4 years with an especially large number of malaria-associated deaths (i.e., 1758, 1777, 1812, and 1829). The mortality rate in Finland (orange line) was 0.12, which was lower than Sweden but with comparable annual fluctuations in the number of malaria deaths. The higher mortality rate in Sweden was probably due to an overestimation of malaria-attributed deaths, which included other diseases presenting with the symptom of a fever (see Methods section in ref. [4]); in contrast, the data used in the model of Finland only included records reported by local priests. For the later period from the early 1860s onward, a significant drop (from 23 to an average of 1.48 per 1000 population) in malaria incidence rate in Denmark was observed (green line) around 1863–1864, as well as in Sweden (Flensburg dataset, gray line) with a low incidence rate of 0.97.
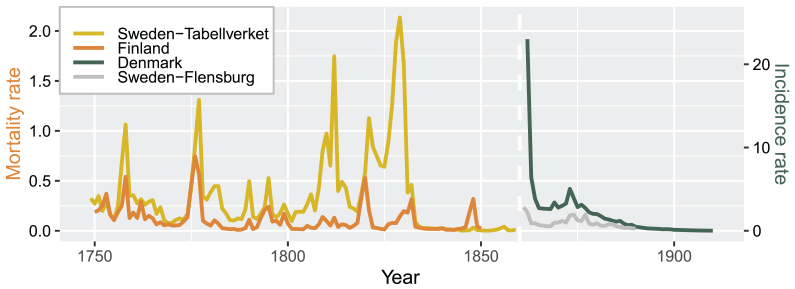
Malaria mortality and incidence rate in Denmark, Finland, and Sweden. This figure shows the mortality rate (per 1000 population) for Sweden (Tabellverket database, yellow line) and Finland (orange line), and the incidence rate (per 1000 population) for Denmark (green line) and Sweden (Flensburg dataset, gray line). Note that the mortality and incidence rates use different scales, and the different types of data are indicated by the vertical white dashed line.
Meteorological data
Temperature and precipitation data from the capital cities of the studied countries, Copenhagen, Helsinki, and Stockholm, were used in the present study to represent seasonal conditions (Suppl. Fig. A). Note, however, that the climates of the three cities are far from representative of most of Denmark, Finland, and Sweden, having warmer springs and summers than most regions of these countries. Historical weather observations of mean temperature (homogenized) and precipitation (not homogenized) were obtained from the meteorological station in Stockholm [19]. Mean temperature data for Helsinki were obtained from the Berkeley Earth dataset. Homogenized mean temperatures and precipitation for Copenhagen were obtained from the Danish Meteorological Institute.
Since no Danish sea-level records were available for the period before 1890, the longest daily sea-level dataset in the region, recorded from Ölands Norra Udde in Sweden (available from 1851 onwards, in the national height system 2000, RH 2000), was obtained from the Swedish Meteorological and Hydrological Institute (Suppl. Fig. B). Monthly maximum sea levels were derived from the above daily data, to assess the impacts of sea-level changes on monthly malaria cases in Denmark. Extreme precipitation events and extreme sea levels were defined as those exceeding three standard deviations, corresponding to the 99.7th percentile in the respective dataset, which represents a very low probability of occurrence.
Modeling framework
The distributed lag non-linear model (DLNM) [20] has been widely used to study the association between environmental exposure and health outcomes [21]. We used this method to assess non-linear and delayed effects of the climate–malaria incidence relationship. Risk estimates were made for Sweden–Finland and Denmark. For Sweden and Finland where malaria data are only available at an annual resolution, June–August (JJA) temperature, JJA precipitation, and annual precipitation from the longest observation data from Stockholm are defined as yearly measures. Assume that
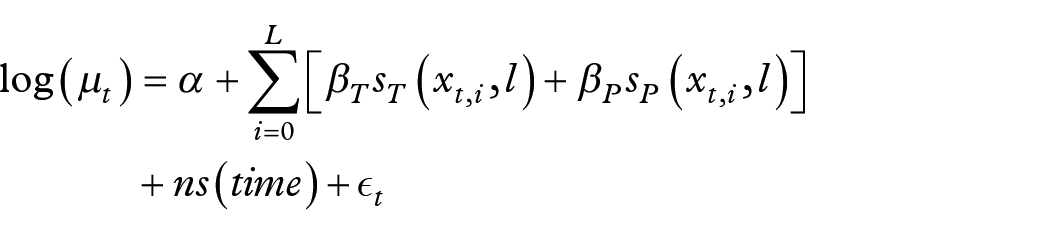
where α is the intercept, and β is the coefficient of covariates. Here,
In the model of Sweden–Finland, the outcome variable,
In the model of Denmark, the outcome variable
The association between malaria data and environmental factors was estimated via Poisson regression as a relative risk (RR), indicating the risk of the outcome at a certain level of exposure compared with that at a reference level. In this study, we set the reference value at the level that represented the minimum estimated risk (RR = 1) of malaria associated with temperature. That is, 13°C for the Sweden–Finland JJA temperature, and 0°C for Denmark’s monthly temperature. We also set the reference value at 0 mm for precipitation, and at the centering level 100 cm for sea level. DLNM analysis was conducted using R version 4.0.4 with the package “dlnm” (version 2.4.6) [20].
Sensitivity analysis
The robustness of the main model was tested with a sensitivity analysis by changing the settings of the model parameters to assess the consistency of the results under different assumptions. In the sensitivity analysis performed in this study, we tested the maximum lag effect in the temperature and precipitation cross-basis functions from 3 to 5 years in the Sweden–Finland model, and from 12 to 24 months in the Denmark model. For the sea-level cross-basis function in the model of Denmark, we tested from 6 to 18 months. In the final model setting, as a result, we employed the maximum lag period of 3 years for Sweden–Finland and 18 months for Denmark for temperature and precipitation, and 12 months for sea level. We also tested the df in the smooth function of time (time) to account for long-term trends. The above tests were applied to evaluate the reliability of the model estimates and to identify the best fit model. The optimal parameters (lags, df of time) for the cross-basis functions were determined by the quasi-Akaike information criterion (QAIC) [22]. For Sweden–Finland, Model #6 with the two cross-basis functions for JJA temperature and precipitation, along with the long-term trends of time taken into account, was selected as the best model with the smallest QAIC. For Denmark, Model #12 with the three cross-basis functions for temperature, precipitation, and sea level, along with the long-term trends of time (year and month) considered, was selected as the best model with the smallest QAIC. The alternative models in the final model selection process can be found in Tables A and B (Supplemental material).
Results
Association of malaria with weather factors
Figure 2 illustrates the association between weather factors and the number of Sweden–Finland malaria deaths under different scenarios of exposure–lag-response relationship, estimated from the DLNM. The RR of malaria deaths associated with temperature presented a close to linear response, with a statistically significant increase with an increasing mean JJA temperature (Figure 2(a)). The highest RR at 18°C (RR = 3.88, 95% CI: 2.31, 6.52) was 1.67 times higher when compared to 16°C, at a reference value of 13°C (the minimum JJA temperature). The RR was highest at approximately 2 lagged years (Figure 2(b)). For the association with JJA mean precipitation, in contrast to the near linear increasing relationship with temperature, the risk increased at drier conditions (i.e., less than the JJA average precipitation amount of 60 mm, corresponding to the 60th percentile of the distribution), but plateaued as precipitation increased (Figure 2(c)). Statistically significant effects were observed at both lower and above-average precipitation amounts. Higher risk was observed at above-average precipitation, although the estimates exhibited greater uncertainty, particularly at higher precipitation amounts. A slightly increased risk was associated with a lag of 1.5 years (Figure 2(d)). Similar estimates associated with temperature from the Denmark malaria model are presented, showing an elevated risk associated with higher temperature. The highest risk was observed at 19°C (RR = 2.32, 95%CI: 1.52, 3.56) at a reference temperature of 0°C (Figure 3(a)). The risk of a delayed effect was most pronounced at around 10 lagged months (Figure 3(b)). For precipitation, only a slightly increased risk was observed at high precipitation levels at 9 lagged months, but the wide confidence intervals overlapping RR = 1 indicated that this effect was not statistically significant (Figure 3(c) and (d)).
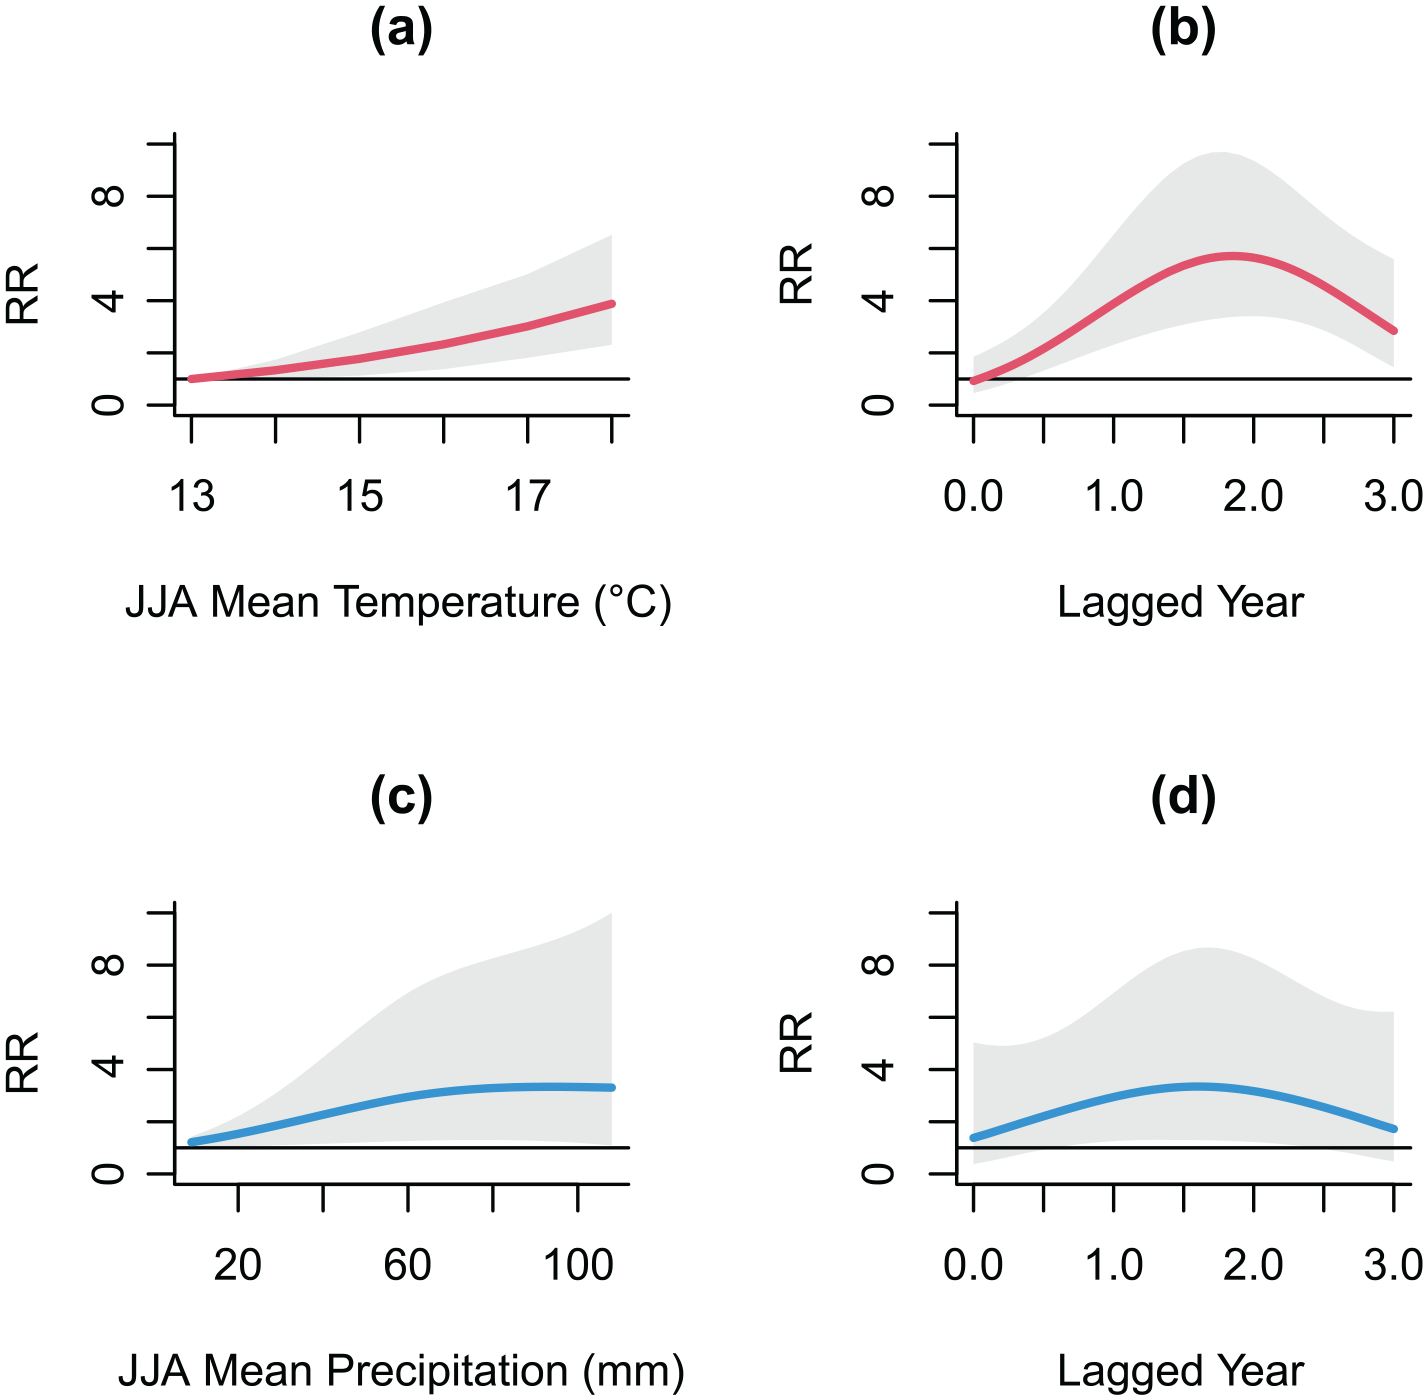
Relative risk (RR) of malaria deaths in Sweden–Finland associated with (a) June–August (JJA) mean temperature at 1 lagged year and (b) its lag-response curve at 18°C; (c) JJA mean precipitation and (d) its lag-response curve at 60 mm. The gray area represents 95% confidence interval. The horizontal line at R = 1 (reference level) indicates that there is no effect of weather exposure on RR.
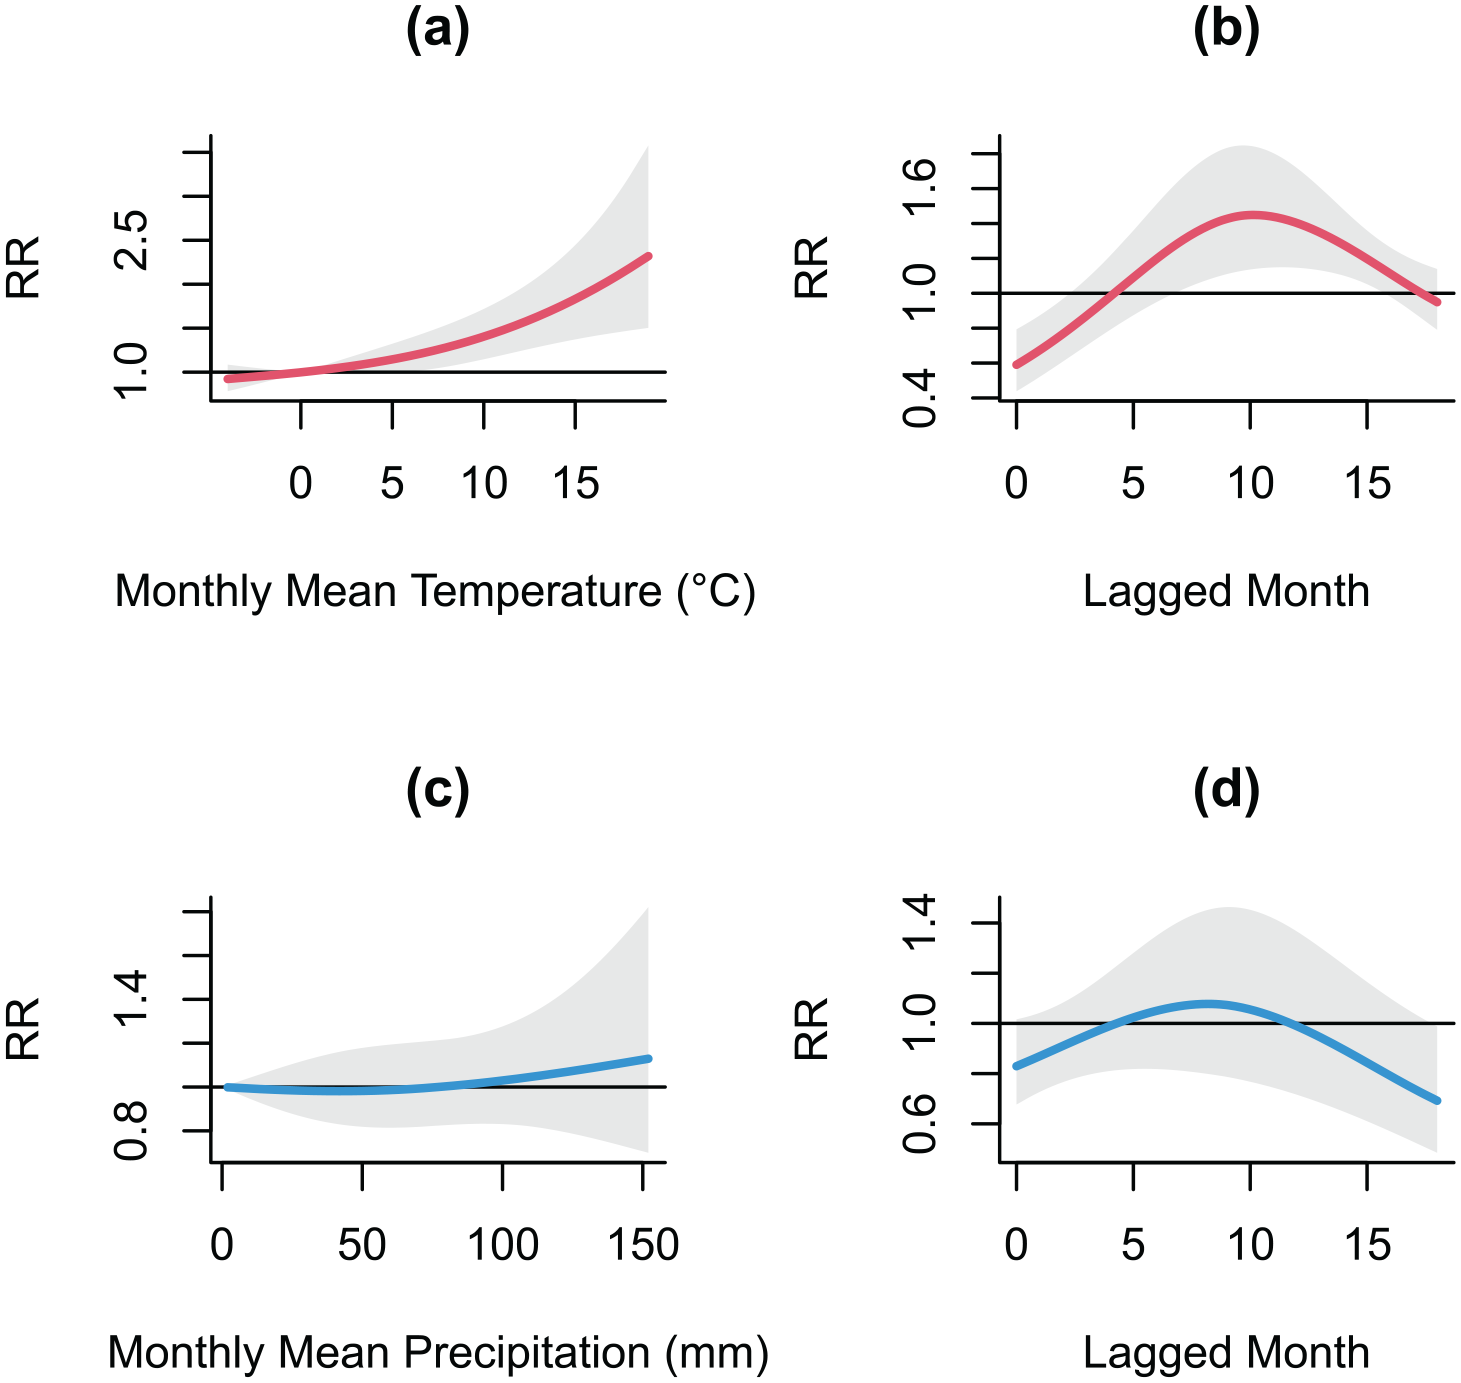
Relative risk (RR) of malaria cases in Denmark. This figure represents (a) temperature–RR association at 12 lagged months and (b) the lag-response curve at 18°C; (c) precipitation–RR association at 9 lagged months and (d) the lag-response curve at the 99.7th percentile (=125 mm). The gray area represents 95% confidence interval. The horizontal line at R = 1 indicates that there is no effect of weather exposure on RR.
Association of malaria risk with sea level
Figure 4 illustrates the risk of malaria cases in Denmark in relation to different sea levels, ranging from the 0.1th percentile (38 cm), 75th percentile (73 cm), 95th percentile (108 cm), to the 99.7th percentile (148 cm). The results showed a statistically significant 1.52 times higher risk of malaria cases associated with sea level at the 99.7th percentile (148 cm) (RR = 1.52, 95% CI: 1.17, 1.98), and a statistically significant 1.23 times higher risk with sea level at 0.1th percentile (38 cm) (RR = 1.23, 95% CI: 1.09, 1.38) compared to a reference level of 100 cm (Figure 4(a)), with the highest risk appearing at 6 lagged months (Figure 4(b)) compared to the risk at the shorter (1 month) or longer (9 month) lag period (Figure 4(c)). The highest risk was observed at the most extreme sea level (148 cm = 99.7th percentile) and lowest sea-level (38 cm = 0.1th percentile) (Figure 4(d)).
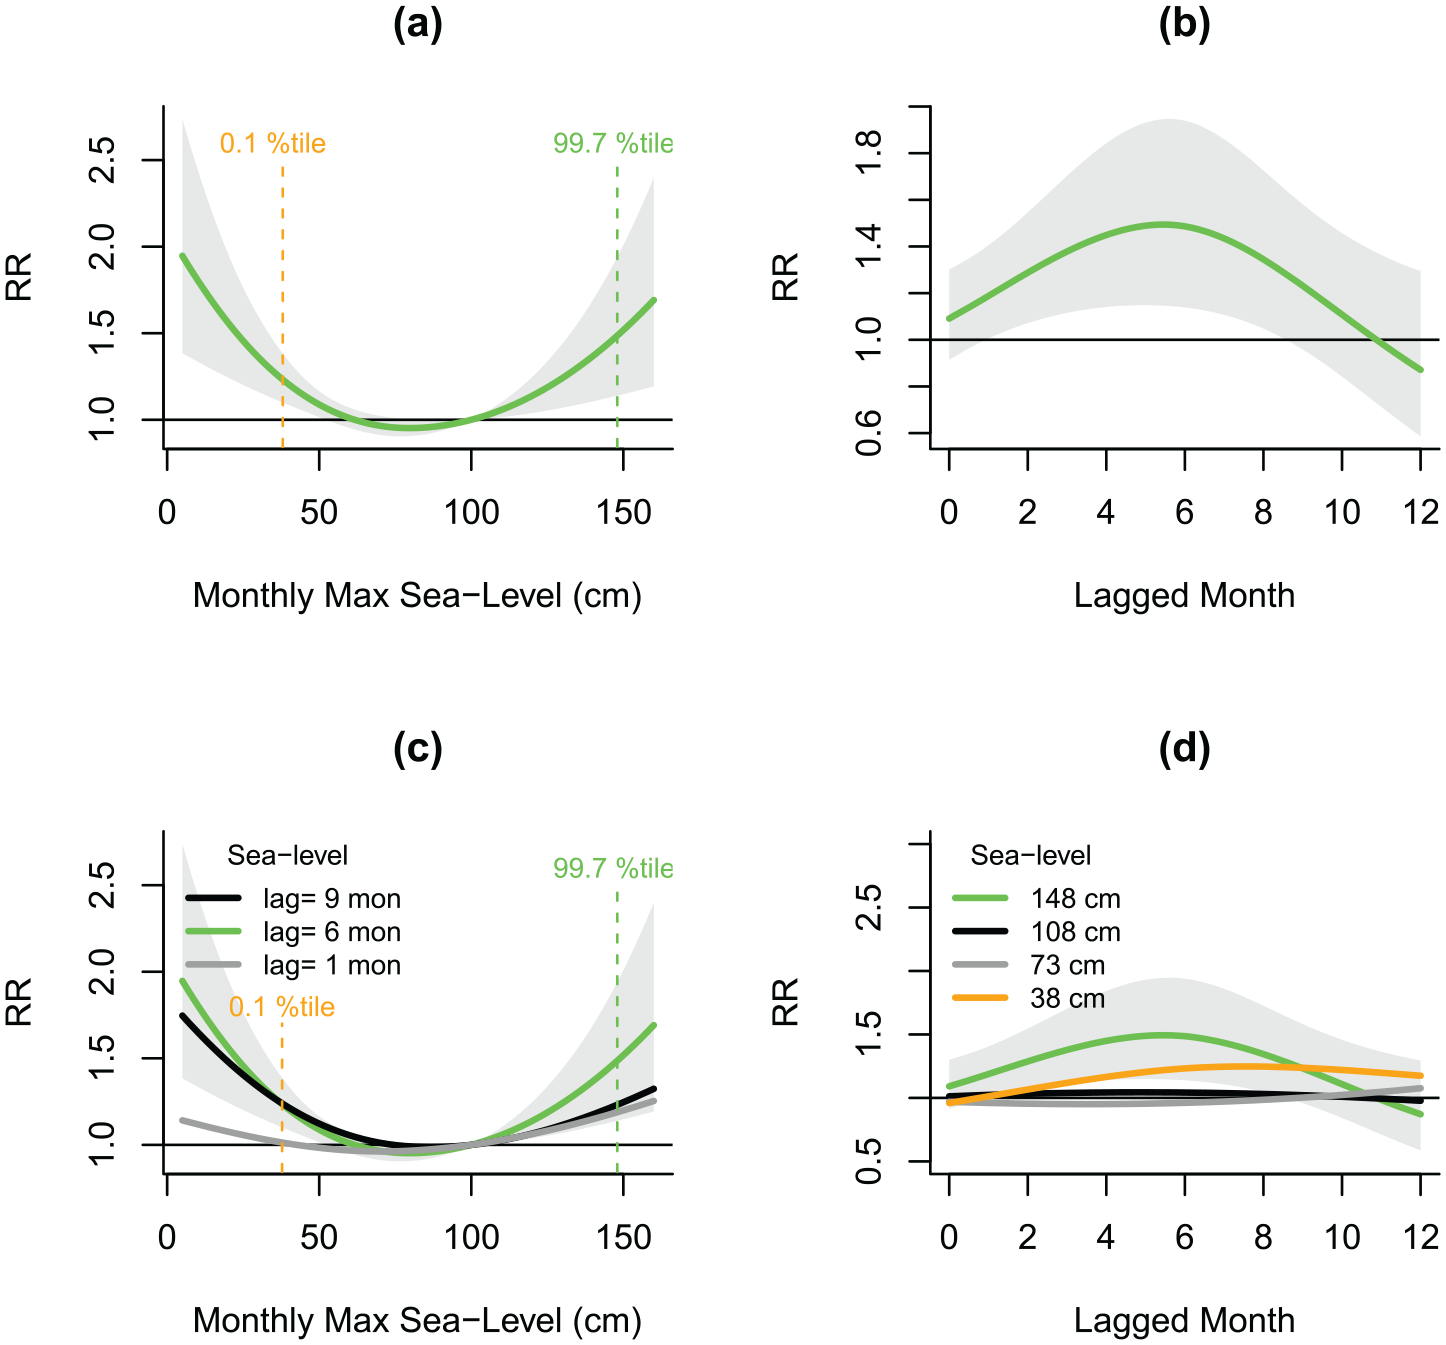
Relative risk (RR) of observing malaria cases in Denmark associated with sea level. This figure represents (a) sea-level–RR association at 6 lagged months and (b) the lag-response curve at the 99.7th percentile of the values for all the monthly maximum sea levels; (c) sea-level–RR association at different lagged months; (d) the lag-response curve at 148 cm (99.7th percentile), 108 cm (95th percentile), 73 cm (75th percentile) and 38 cm (0.1th percentile). The lines represent model estimate and the gray area represents 95% confidence interval. The horizontal line at R = 1 indicates that there is no effect of sea level on RR.
Sensitivity analysis of the results
The results showed that the lagged effect estimates of the selected environmental variables on malaria were robust. The increases in df in the natural spline function for long-term time-varying factors after 5 df per year in the model of Sweden–Finland, and after 7 df per month in the model of Denmark, yielded robust estimates of RR (Suppl. Fig. H). These results derived from sensitivity analysis imply that the DLNMs applied in this study adequately and robustly captured the effects of different environmental factors on malaria risk.
Discussion
Climate in the Nordic countries
Several studies have recognized that an elevated ambient temperature accounts for the accelerating development of malaria vectors and parasites in temperate regions [10]. In particular, evidence of summer temperatures being the main weather factor related to malaria transmission in the Nordic countries has been presented in previous studies [2 –4]. Although these three countries share similar long-term climatic fluctuations (Suppl. Fig. A), the subtle differences in weather conditions could have an influence on seasonal activity patterns for the malaria vectors. Over the common period, the correlation coefficient between Stockholm and Helsinki/Copenhagen and Stockholm/Copenhagen and Helsinki was r = 0.86/0.80/0.72 for summer temperature, and r = 0.91/0.88/0.84 for spring temperature.
The earlier onset of the warm season in Denmark could mean a longer season for the development of the mosquito vector and parasite. In particular, the occurrence of potential malaria vectors in the Nordic countries, An. atroparvus, was found to be significantly affected by the early spring temperature [23]. The higher spring temperatures in Denmark, usually a few degrees Celsius higher than in most of Sweden and all of Finland (Suppl. Fig. A, upper right panel), could indicate an early emergence of the first generation from their hibernation sites, and a shorter larval period. Similarly, the second generation could also emerge early enough, for example at the beginning of July, to be able to transmit by the end of August. In general, this “amplification effect” in a warmer temperate climate could result in larger mosquito population sizes from possibly more than one generation of Anophelines, and a shorter extrinsic incubation period during the summer months. We used the precipitation data from Stockholm to represent precipitation in the Sweden–Finland model for two reasons: first, the observation data period in Stockholm started earlier (1786–) compared to the oldest observation data at the Helsinki Kaisaniemi station; second, the monthly variations between Stockholm and Helsinki (Kaisaniemi station) were comparable, with a correlation coefficient of r = 0.56 for the common period 1844–1892, and should therefore have generated comparatively similar model estimates.
The exact level of mean spring and, in particular, mean summer temperatures remains uncertain, especially prior to the late 19th century, due to changes in the locations of instruments, sunlight exposure of the early thermometers, possible instrumental errors, and especially the homogenization necessary due to the increasing urban heat effect [24]. Note, for example, that according to contemporary climatologically Stockholm has the highest JJA temperature (17.4°C), not Copenhagen (17.1°C), which was the case in the historical instrumental climate data. That the two Nordic capital cities should have changed order over time in relation to experiencing the warmest summers appears highly unlikely from a climatological point of view: homogenization-related issues of the meteorological temperature measurements are more likely to explain this [25]. These uncertainties in the long-term trends and mean temperature levels do not affect the relative amplitude of year-to-year temperature variability or decadal-scale variations, and will not have significant effects on the model estimates of the distributed lag curve, or the RR yielded by DLNM, as RR was calculated according to reference values of the environmental variables (i.e., temperature, precipitation, and sea-level variations).
The effect of weather factors on malaria
The observed tendency of an increased risk of malaria deaths in connection to higher temperatures in this study validated the results from previous studies, where this relationship was found to be linked to the preceding summer temperature [2 –4]. However, our modeling results suggested that the effect of a warm summer temperature on malaria deaths would persist for almost 2 years in Sweden and Finland. As the temperature increased from 16°C to 18°C, the RR increased by ∼67% in Sweden–Finland, and ∼25% in Denmark. For precipitation, normal summer precipitation (between the 25th and 75th percentiles) seemed to benefit malaria transmission compared to very dry conditions (below the 25th percentile) in Sweden–Finland (Figure 2(c)). This could be explained by the rainfall providing more suitable environmental conditions for the vectors. This effect, however, was not evident in Denmark, that generally has a more humid climate than eastern Sweden or Finland. A comparison using merged annual cases in Denmark showed an increase in risk at moderate precipitation and a decline at wetter or drier conditions. However, the wide confidence intervals indicated substantial uncertainty, suggesting that while precipitation probably influences malaria risk, the effect is not statistically significant (Suppl. Fig. I). In general, this study suggested an increased risk of malaria was associated with warming climates at higher latitudes in temperate regions.
One important limitation with this study is that we did not use spatially resolved, gridded climate data to capture the large geographical heterogeneity in temperature and precipitation occurring within Denmark, Finland, and Sweden. This heterogeneity in climate is especially large within the parts of Sweden that most of the malaria-attributed deaths derive from. For example, southern-most Sweden is identical to Denmark (Copenhagen) in climate, while western Sweden is much wetter and also somewhat cooler in summer, and eastern Sweden is dry in spring and early summer with a longer duration of hot periods in the summer. However, the data coverage would be insufficient to reach statistical significance if the analyses were conducted using gridded climate data, considering that the number of malaria-attributed deaths (or cases in Denmark) in most areas was limited during most years. With this limitation in mind, we acknowledge that this study may not capture the finer nuances, or the spatial signatures, of the climate–malaria relationship in Denmark, Finland, or Sweden.
Storm floods and malaria
In the Baltic Sea region, storm flood events are mainly caused by strong winds accompanied by extreme sea-level rises during autumn and winter (Suppl. Fig. B). This kind of extreme event is estimated to pose a significant risk for low-lying coastal areas in the absence of flood protections [26]: All the more so before the coastal wetlands in the Nordic countries were extensively drained during the 19th and 20th centuries [27].
According to historical records, extreme sea levels were observed on several occasions with subsequent malaria outbreaks. In the case of the 1872 storm surge, for instance, the sea-level rise measured 1–3 m around the southern Baltic Sea in Denmark and Sweden [28], and possibly engendered the following spring epidemic with a threefold increase in malaria incidence in the most malarious region of Denmark, compared to that of the prior year [2]. Similarly, an extreme sea-level rise (148 cm) in February 1874 was followed by a malaria outbreak in May.
The association between coastal flooding and malaria can probably be explained by the increased breeding grounds for malaria mosquitoes after storm events. If water bodies such as lakes, wetlands, and ponds were in the vicinity of temporally inundated areas caused by extensive flooding, the saline water could have entered and mixed with or replaced the freshwater. Even though the duration of flooding is usually very short, it could be sufficient for some quantity of salty water to remain in the mixed water bodies for 3–6 months. Assuming that a storm-surge-induced flooding occurred in autumn, this event most likely led to an expansion of saline habitats for brackish malaria vectors (e.g., An. Atroparvus), and resulted in much larger mosquito populations in the following spring–summer. This effect at lags of 4–8 months was supported by our model estimate (Figure 4(b)).
Nevertheless, such increased risk in malaria cases was not limited to storm-induced extreme sea-level rises, but also observed at lower sea levels. It is conceivable that such extreme sea-level oscillations will increase the inflow and circulation of saline seawater in coastal aquifers and freshwater bodies, similar to the documented impact of tidal oscillations [29]. The increased availability of saline/brackish breeding sites arguably provided ideal conditions at the emergence of Anopheles mosquitoes in March–May when the sea levels were low (Suppl. Fig. B), and this appeared to have a larger and more sustained impact on malaria risk (Figure 4(d)). Notably, the higher risk of malaria cases associated with extreme sea-level rises compared to sea-level falls, was possibly related to poor hygiene conditions and population displacement in the aftermath of extensive coastal flooding, which could lead to a wider spread of infectious disease.
Strengths and limitations of this study
This study has assessed malaria risk in relation to environmental variables across three Nordic countries. The use of long-term data and weather variables among regions with similar climates was shown to be useful in analyzing malaria risk associated with extreme environmental events. Specifically, we applied DLNMs to investigate the potential non-linear and delayed effects of environmental factors on malaria risk. This allowed us to identify the complex signals that would be difficult to capture by traditional linear regression model, especially in response to precipitation and sea level. Note, however, the limitation inherent in not using spatially resolved, gridded climate data as discussed above.
Several other limitations should be considered. First, considering that the Danish data do not overlap in time with the Swedish and Finnish data, unmeasured changes in climate and socio-demography, which might have affected predictors (i.e., environmental data and malaria deaths/cases reported), could have introduced uncertainties in the model estimates. Another concern is the choice of model parameters for data with different temporal resolutions. The Danish data have a monthly resolution, while the Swedish and Finnish data are only available at an annual resolution. Although the optimal settings were tested in the sensitivity analysis, inconsistency may exist in the evaluation of the results from different models. Furthermore, other weather parameters that could be associated with malaria risk, such as humidity, minimum temperature, or maximum temperature, were not available back in the time when the historical malaria data used in this study were collated.
Another limitation of this study is the use of Stockholm’s precipitation data for both Stockholm and Helsinki (in the Sweden–Finland model). Although Stockholm’s data provided a longer and more complete dataset, using it for Helsinki may have overlooked potential regional variations. Most importantly, the decline of malaria in the Nordic countries was mainly attributed to social development, such as the improving housing and living standards, especially the reduction in people living in close proximity to livestock, such factors have greatly reduced contact between human and malaria vectors (mosquitoes) [16], and consequently resulted in malaria elimination. Therefore, this change sets limits in the malaria transmission of the past in relation to the present. Finally, Norway has fewer resources in relation to malaria data than Sweden, Finland, and Denmark, thus, it was not included in this study, although some data for Norway’s coastline were reported during the late 19th and early 20th centuries [30]. Access to malaria data from Norway, as well as the Baltic countries, would be a valuable inclusion in future analyses. While sensitivity analyses were conducted to test model robustness, we acknowledge that they may not capture all sources of uncertainty. Future studies should, where possible, incorporate independent dataset validations or explore alternative modeling approaches to further assess and strengthen the reliability of the findings.
Conclusions
This study specifically investigated the non-linear and delayed effects of three environmental factors—temperature, precipitation, and sea level—on malaria incidence risk in Denmark, as well as the malaria mortality risk in Sweden and Finland during the 18th and 19th centuries. Our results suggest that the increased risk of malaria was strongly associated with higher temperatures, particularly in the summer months. In Sweden and Finland, normal to high amounts of precipitation were also associated with an increased risk of malaria. The occurrence of extreme sea-level events (>99.7th percentile = 1.5 m in this study), including coastal flooding, also posed an elevated risk for malaria cases in low-lying coastal areas. These results highlight the potential risk that rapid environmental changes, as evidenced in the past by our data and potentially in the future, can have on the transmission of climate-sensitive, vector-borne disease.
Supplemental Material
sj-pdf-1-sjp-10.1177_14034948251320865 – Supplemental material for Climate and malaria: modeling non-linear dynamics in the Nordic countries during the 18th and 19th centuries
Supplemental material, sj-pdf-1-sjp-10.1177_14034948251320865 for Climate and malaria: modeling non-linear dynamics in the Nordic countries during the 18th and 19th centuries by Tzu Tung Chen, Yoonhee Kim, Fredrik Charpentier Ljungqvist, Jerker Jarsjö, Jenny C. Hesson and Hans W. Linderholm in Scandinavian Journal of Public Health
Footnotes
Acknowledgements
We thank Lena Huldén for providing the Finnish malaria-attributed death data and for her invaluable advice, and Mathias Mølbak Ingholt for providing Danish malaria case data.
Declaration of conflicting interests
The authors declared no potential conflicts of interest with respect to the research, authorship, and/or publication of this article.
Funding
The authors disclosed receipt of the following financial support for the research, authorship, and/or publication of this article: The research was supported by the Swedish Research Council Formas (grant no. 2017-01161). FCL was supported by the Swedish Research Council (Vetenskapsrådet, grant no. 2018-01272) and conducted the work with this article as a Pro Futura Scientia XIII Fellow funded by the Swedish Collegium for Advanced Study through Riksbankens Jubileumsfond.
Supplemental material
Supplemental material for this article is available online.