
Abstract
Aims:
This study aimed to estimate the size of the risk group for severe influenza and to describe the social patterning of the influenza risk group in Norway, defined as everyone ⩾65 years of age and individuals of any age with certain chronic conditions (medical risk group).
Methods:
Study data came from a nationally representative survey among 10,923 individuals aged 16–79 years. The medical risk group was defined as individuals reporting one or more relevant chronic conditions. The associations between educational attainment, employment status, age and risk of belonging to the medical risk group were studied with logistic regression.
Results:
Nearly a fifth (19.0%) of respondents reported at least one chronic condition, while 29.4% belonged to the influenza risk group due to either age or chronic conditions. Being older, having a low educational level (comparing compulsory education to higher education, odds ratio (OR)=1.4, 95% confidence interval (CI) 1.2–1.8 among women, and OR=1.3, 95% CI 1.1–1.7 among men) and a weaker connection to working life (comparing disability pension to working full-time, OR=6.8, 95% CI 5.3–8.7 among women, and OR=6.5, 95% CI 4.9–8.5 among men) was associated with a higher risk of belonging to the medical risk group for severe influenza.
Conclusions:
Keywords
Introduction
The disease burden of seasonal influenza is considerable. In Norway, on average, 1.7% of the population is diagnosed with influenza in primary care each season. The hospitalisation rate is about 48 per 100,000, and excess influenza-related mortality is estimated at more than 900 deaths [1,2]. While anyone can become seriously ill if infected, risk of severe influenza is elevated in certain groups, such as the very young and the very old, as well as individuals with certain chronic medical conditions [1,3,4]. Annual influenza vaccination is the most effective intervention to prevent severe influenza-related disease and mortality. A reliable size estimate of the risk group is therefore needed for preparedness planning (vaccine doses, funding, allocation of health-care resources) and to monitor vaccine uptake. There were to our knowledge no prior national studies on this topic, but earlier European estimates indicated 25% of the population belonged to the influenza risk group [5]. As the vaccine recommendations in Norway and several other countries were expanded after the 2009 influenza pandemic, these estimates might be too conservative today.
Moreover, studies have found that having a lower socio-economic position (SEP) and/or living in a disadvantaged area is associated with some of the chronic conditions related to risk of severe influenza, such as cardiovascular disease [6], chronic obstructive pulmonary disease [7], diabetes type 2 [8] and obesity [9], in Nordic welfare states. We wanted to study whether this pattern applies to the influenza risk group as a whole. If belonging to the influenza risk group is more prevalent among Norwegians of lower SEP, then accordingly vaccine coverage should be higher in groups of lower compared to groups of higher SEP. In addition to the size estimate, knowledge of the sociodemographic patterning of the risk group is therefore needed to know whom to target for vaccination, and to evaluate whether current policy and communication strategies in the Norwegian influenza immunisation programme achieves an equitable vaccine uptake.
Aims
We conducted a series of national population-based surveys from 2014–2015 to 2019–2020 on the prevalence of influenza risk conditions, vaccination uptake and attitudes. The aims of this study were to estimate the size of the medical risk group for influenza in Norway and to study the association between education and employment status and risk of belonging to the medical risk group. These results can inform policies to promote equal access to influenza prevention.
Methods
Data source and study sample
This study is based on survey data from Statistics Norway’s Travel and Vacation survey (T&V-survey), a quarterly survey of repeated cross-sectional design with the objectives of mapping the travel behaviour of the Norwegian population and collecting data for other official statistics [10]. On behalf of the Norwegian Institute of Public Health, questions on influenza risk groups have been included in the survey in the second and third quarter since 2015. We included data from 2015 to 2019 in our analysis.
The T&V-survey is an interviewer-administered computer-assisted telephone interview. The target population is the Norwegian population aged 16–79 years. The sampling frame is the Norwegian National Registry, where every citizen has a unique identifier. Statistics Norway draws a new sample of 2000 people each quarter. They use a stratified random sampling based on place of residence, sex and 10-year age groups to ensure that the age and sex structure of the sample mirrors the distribution in the target population in each county. Detailed information on the survey is sent to everyone in the gross sample by email or post prior to the first contact attempt by phone. Informed consent is obtained at the beginning of the interview. The data set is de-identified by Statistics Norway before it is made available for analysis [10].
Medical risk groups for influenza
The influenza risk groups recommended for the annual influenza vaccine in Norway comprise everyone aged ⩾65 years, residents in long-term health-care institutions and individuals with certain medical conditions (Supplemental Table SI). The medical risk groups are worded as broad disease categories according to the affected organ system, in part to facilitate communication with the public.
Eight medical risk groups are included in the T&V-survey: chronic respiratory or cardiovascular disease, liver or renal failure, chronic neurological disease or injury, diabetes mellitus and severe obesity (Supplemental Table SI). For each, the respondents were asked ‘Do you have [a chronic lung disease]?’. Response alternatives were ‘yes’/‘no’. Refusals were coded as either ‘I do not know’ or ‘I do not want to answer’ (Supplemental Table SIII). Respondents who answered ‘yes’ on at least one question were coded as belonging to the medical risk groups for severe influenza; the rest were coded as not belonging to a medical risk group.
Furthermore, based on Norwegian registry data [4,11,12] in combination with proportions reporting chronic disease by 10-year age groups among individuals aged 18–64 years in the T&V-study, we estimated the size of the risk group by age group in absolute numbers.
Primary explanatory variables: demography, education and employment status
Data on age and sex were obtained from the Norwegian National Registry. Age was categorised in 10-year groups. Information on the highest level of education completed (educational attainment) was obtained from the National Education Database and categorised as compulsory (0–10th class level), intermediate (11th–14th class level), higher education (14th–20th class level+) or unspecified (i.e. educational level not recorded in the register) [13]. We used self-reported information from the survey regarding paid work, weekly working hours, student status, compulsory military service, retirement and disability benefits to define employment status. The participants were categorised as either working full-time (>30 hours/week), working part-time (10–29 hours/week), unemployed (working <10 hours/week), students, retired or as being on disability pension.
Other covariates
Information on marital status was obtained from the Norwegian National Registry and categorised as unmarried, married or formerly married (divorced or widowed). Self-reported population density at place of residence was used as a measure of urbanisation. Categories were sparsely populated (<2000 inhabitants), densely populated (2000–100,000), city (>100,000) or ‘I do not know’.
Statistical analysis
Statistics Norway generates weighting variables that adjust for non-response error by age, sex, county and educational level in the net sample. Such post-survey adjustment gives greater weight to respondents belonging to groups underrepresented in the data set, so that the weighted sample mirrors the distribution in the population. Weighted proportions are representative for the population aged 16–79 years [10]. We calculated weighted proportions for the medical risk groups with 95% confidence intervals (CIs).
Furthermore, logistic regression analyses were performed to obtain odds ratios (ORs) with 95% CIs for the association between demographic and socio-economic variables and the risk of belonging to the medical risk group for influenza. Due to observed age-related differences between the sexes in descriptive analysis and significant interaction between age and sex in analysis on the sample as a whole, the logistic regression analyses were performed separately for men and women.
The multivariable model included the main explanatory variables (age, educational attainment and employment status), marital status and urbanisation. While weights were applied in univariable analyses, we did not apply weights in the multivariable logistic regression analyses, since we adjusted for the weighting variables (age, sex and educational level) in the model. Analyses were performed using IBM SPSS Statistics for Windows v25 (IBM Corp., Armonk, NY).
Results
Of 19,925 eligible individuals, 10,979 responded to the survey. The overall response rate was 55.1% (Supplemental Table SII). After exclusion of those who refused to answer any questions on chronic conditions (n=52) and/or employment status (n=42), the net sample comprised 10,923 respondents. Characteristics of the study participants are presented in Table I.
Characteristics of study participants in the T&V-survey, Q2 and Q3 2015–2019.
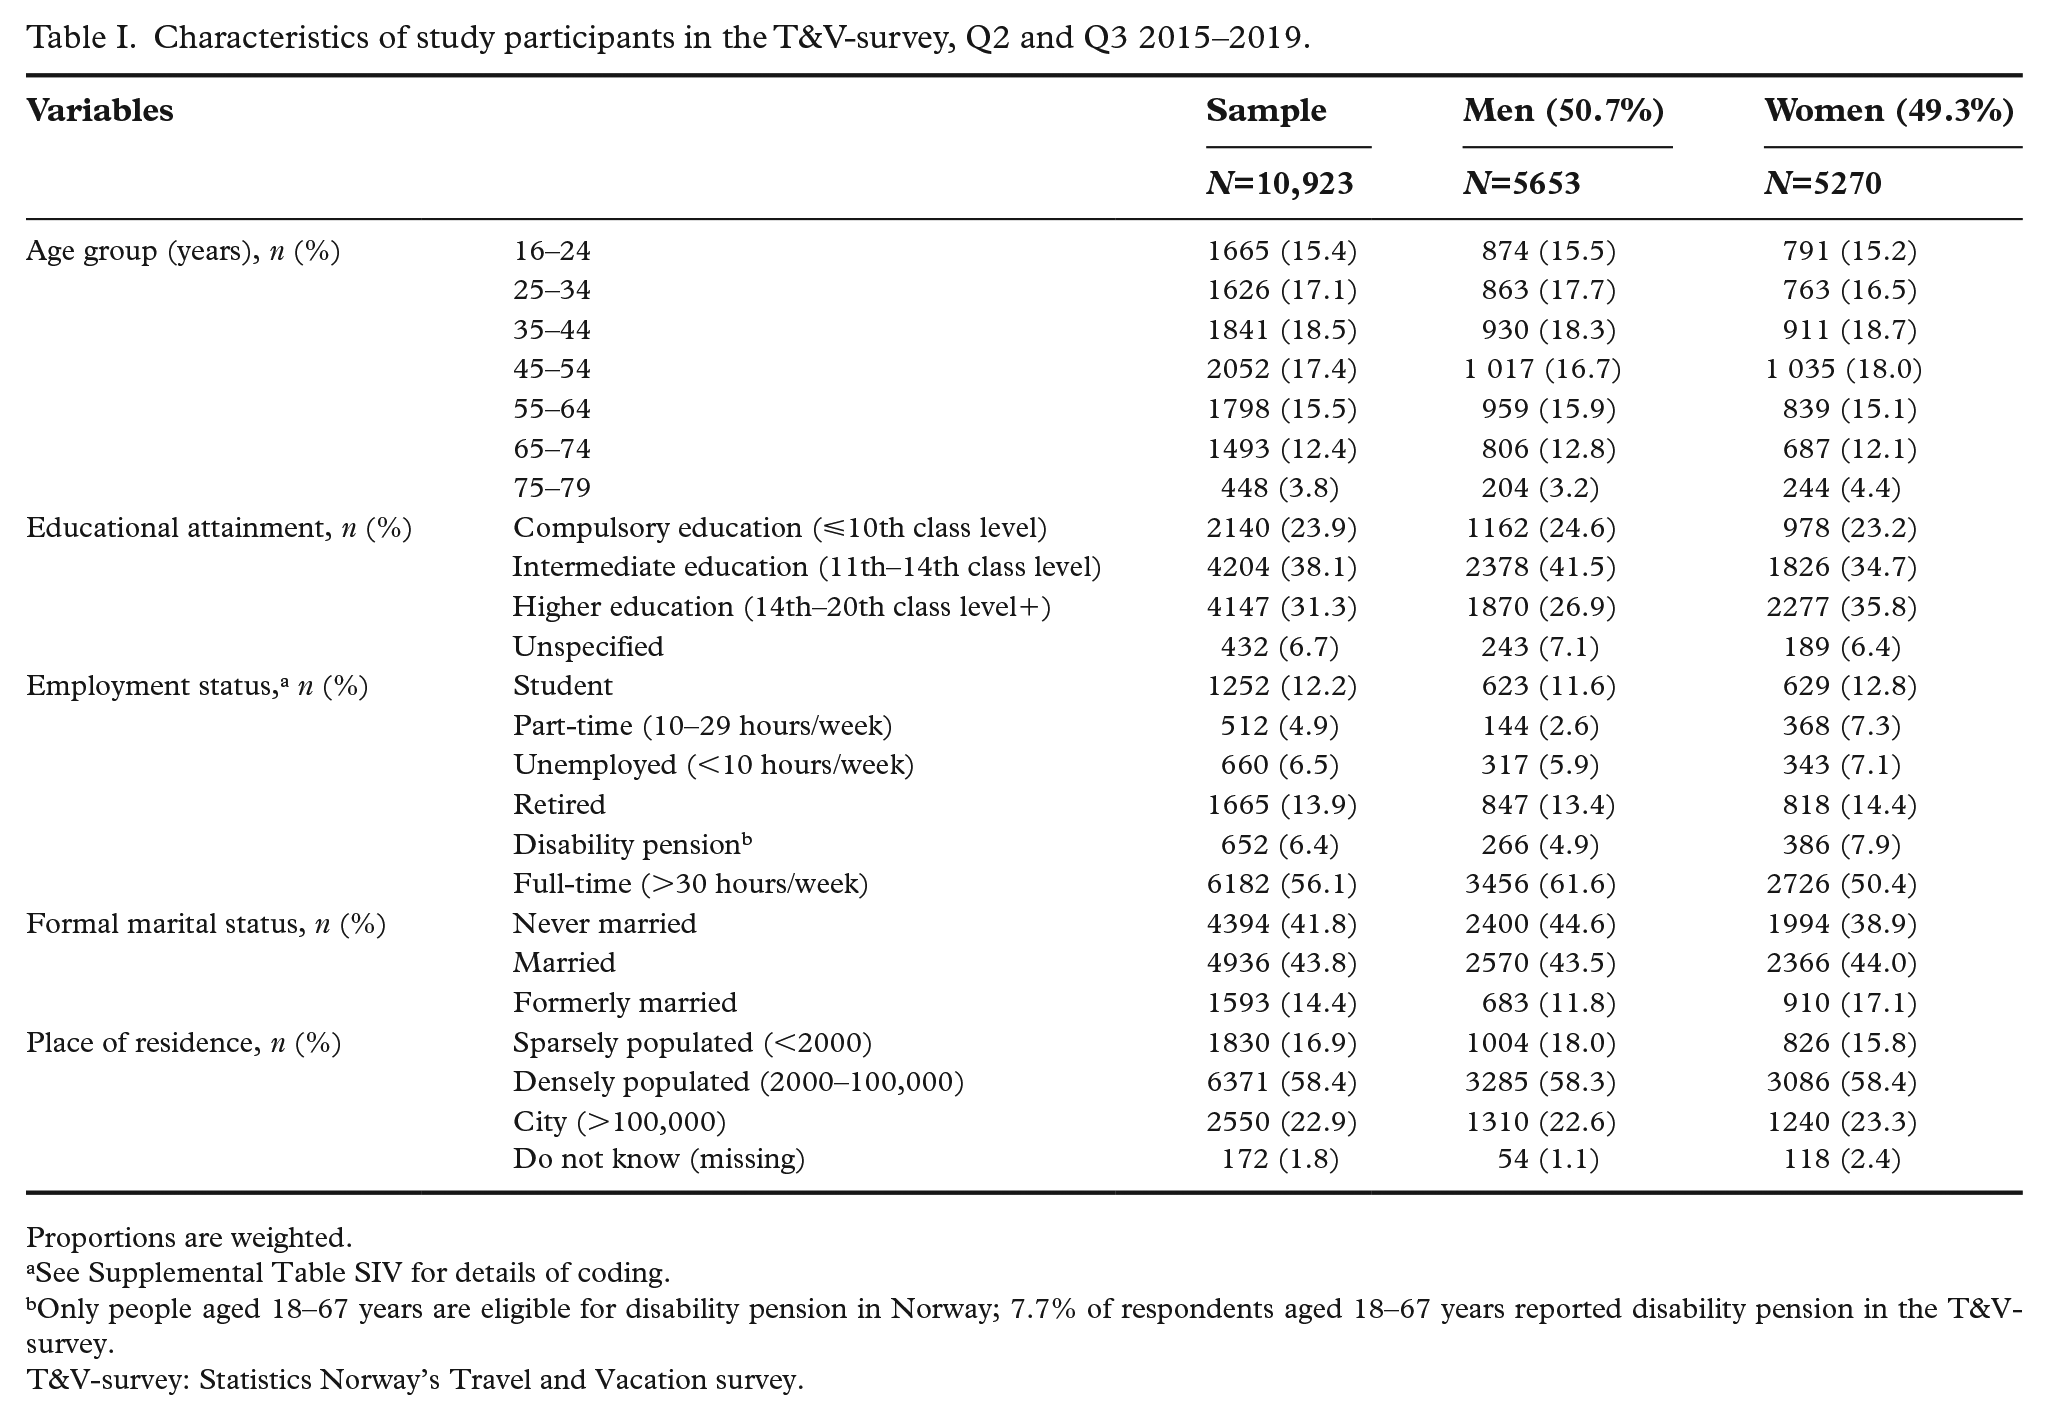
Proportions are weighted.
See Supplemental Table SIV for details of coding.
Only people aged 18–67 years are eligible for disability pension in Norway; 7.7% of respondents aged 18–67 years reported disability pension in the T&V-survey.
T&V-survey: Statistics Norway’s Travel and Vacation survey.
Proportion with indication for seasonal influenza vaccination
Just over 16 percent (16.2%; 95% CI 15.6–16.9) of the sample belonged to the influenza risk group because of being >65 years of age. 19 percent (95% CI 18.2–19.8) reported one or more chronic conditions related to risk of severe influenza (Table II). Overall, 29.4% (95% CI 28.6–30.3) belonged to the influenza risk group due to either age or chronic disease.
Respondents with indication for seasonal influenza vaccination, T&V-survey Q2 and Q3 2015–2019.
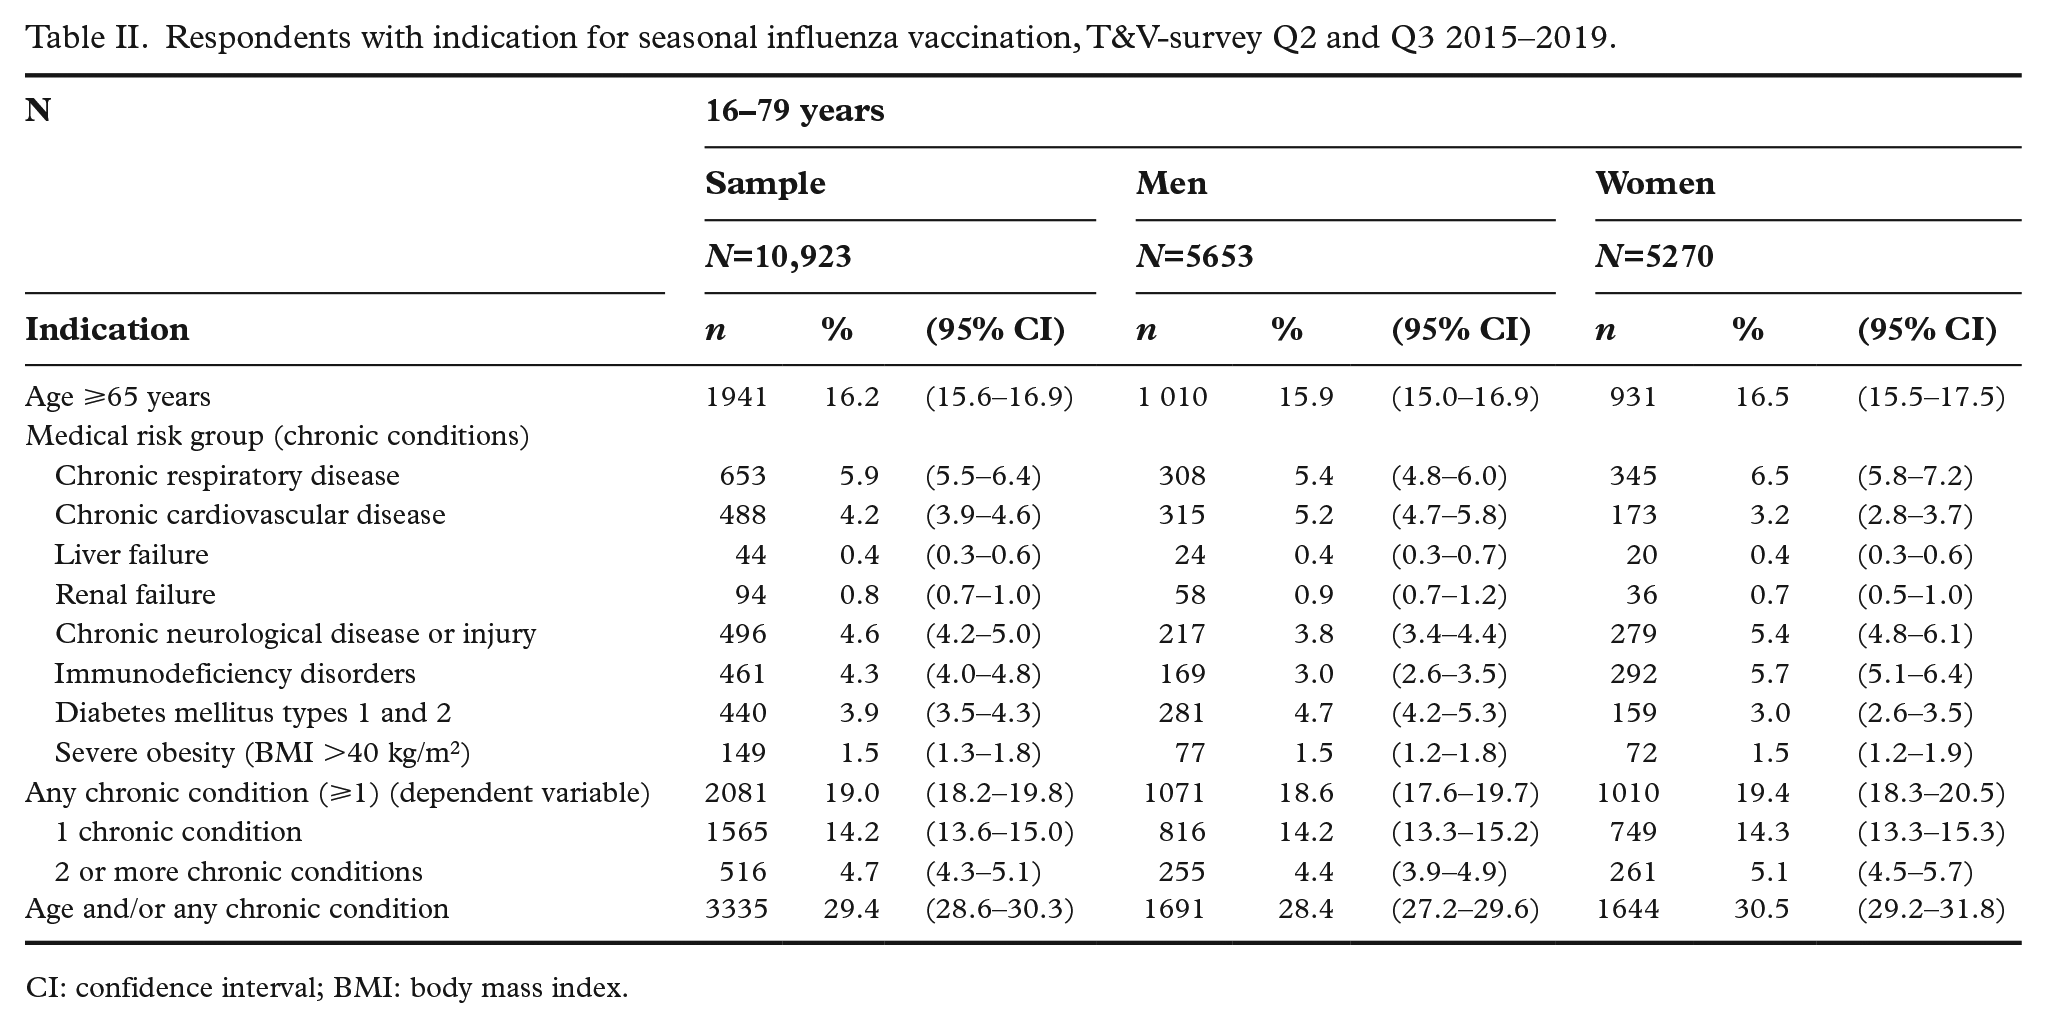
CI: confidence interval; BMI: body mass index.
Based on estimates from the T&V-study in combination with other Norwegian registry data, we estimated that approximately 1.6 million Norwegians belong to the influenza risk group (Supplemental Table SVI).
Age
For the sample as a whole, the proportion reporting any chronic condition increased with age, from 15.8% (95% CI 15.0–16.6) among those aged 16–64 years to 35.6% (95% CI 33.5–37.8) among those >65 years of age (Supplemental Table SV). Among those <18 years of age, 5.5% (n=408; 95% CI 3.7–8.1) reported any chronic condition. In the younger age groups (16–44 years), more women than men reported chronic conditions (Table III). In contrast, the proportion reporting chronic conditions was higher among men in the older age groups (55–79 years). The largest increase in the proportion reporting chronic disease came at the 65-year-old threshold for both sexes.
Respondents reporting any chronic condition and unadjusted/adjusted logistic regressions on the probability of belonging to the medical risk group for influenza, Q2 and Q3, T&V-survey 2015–2019.
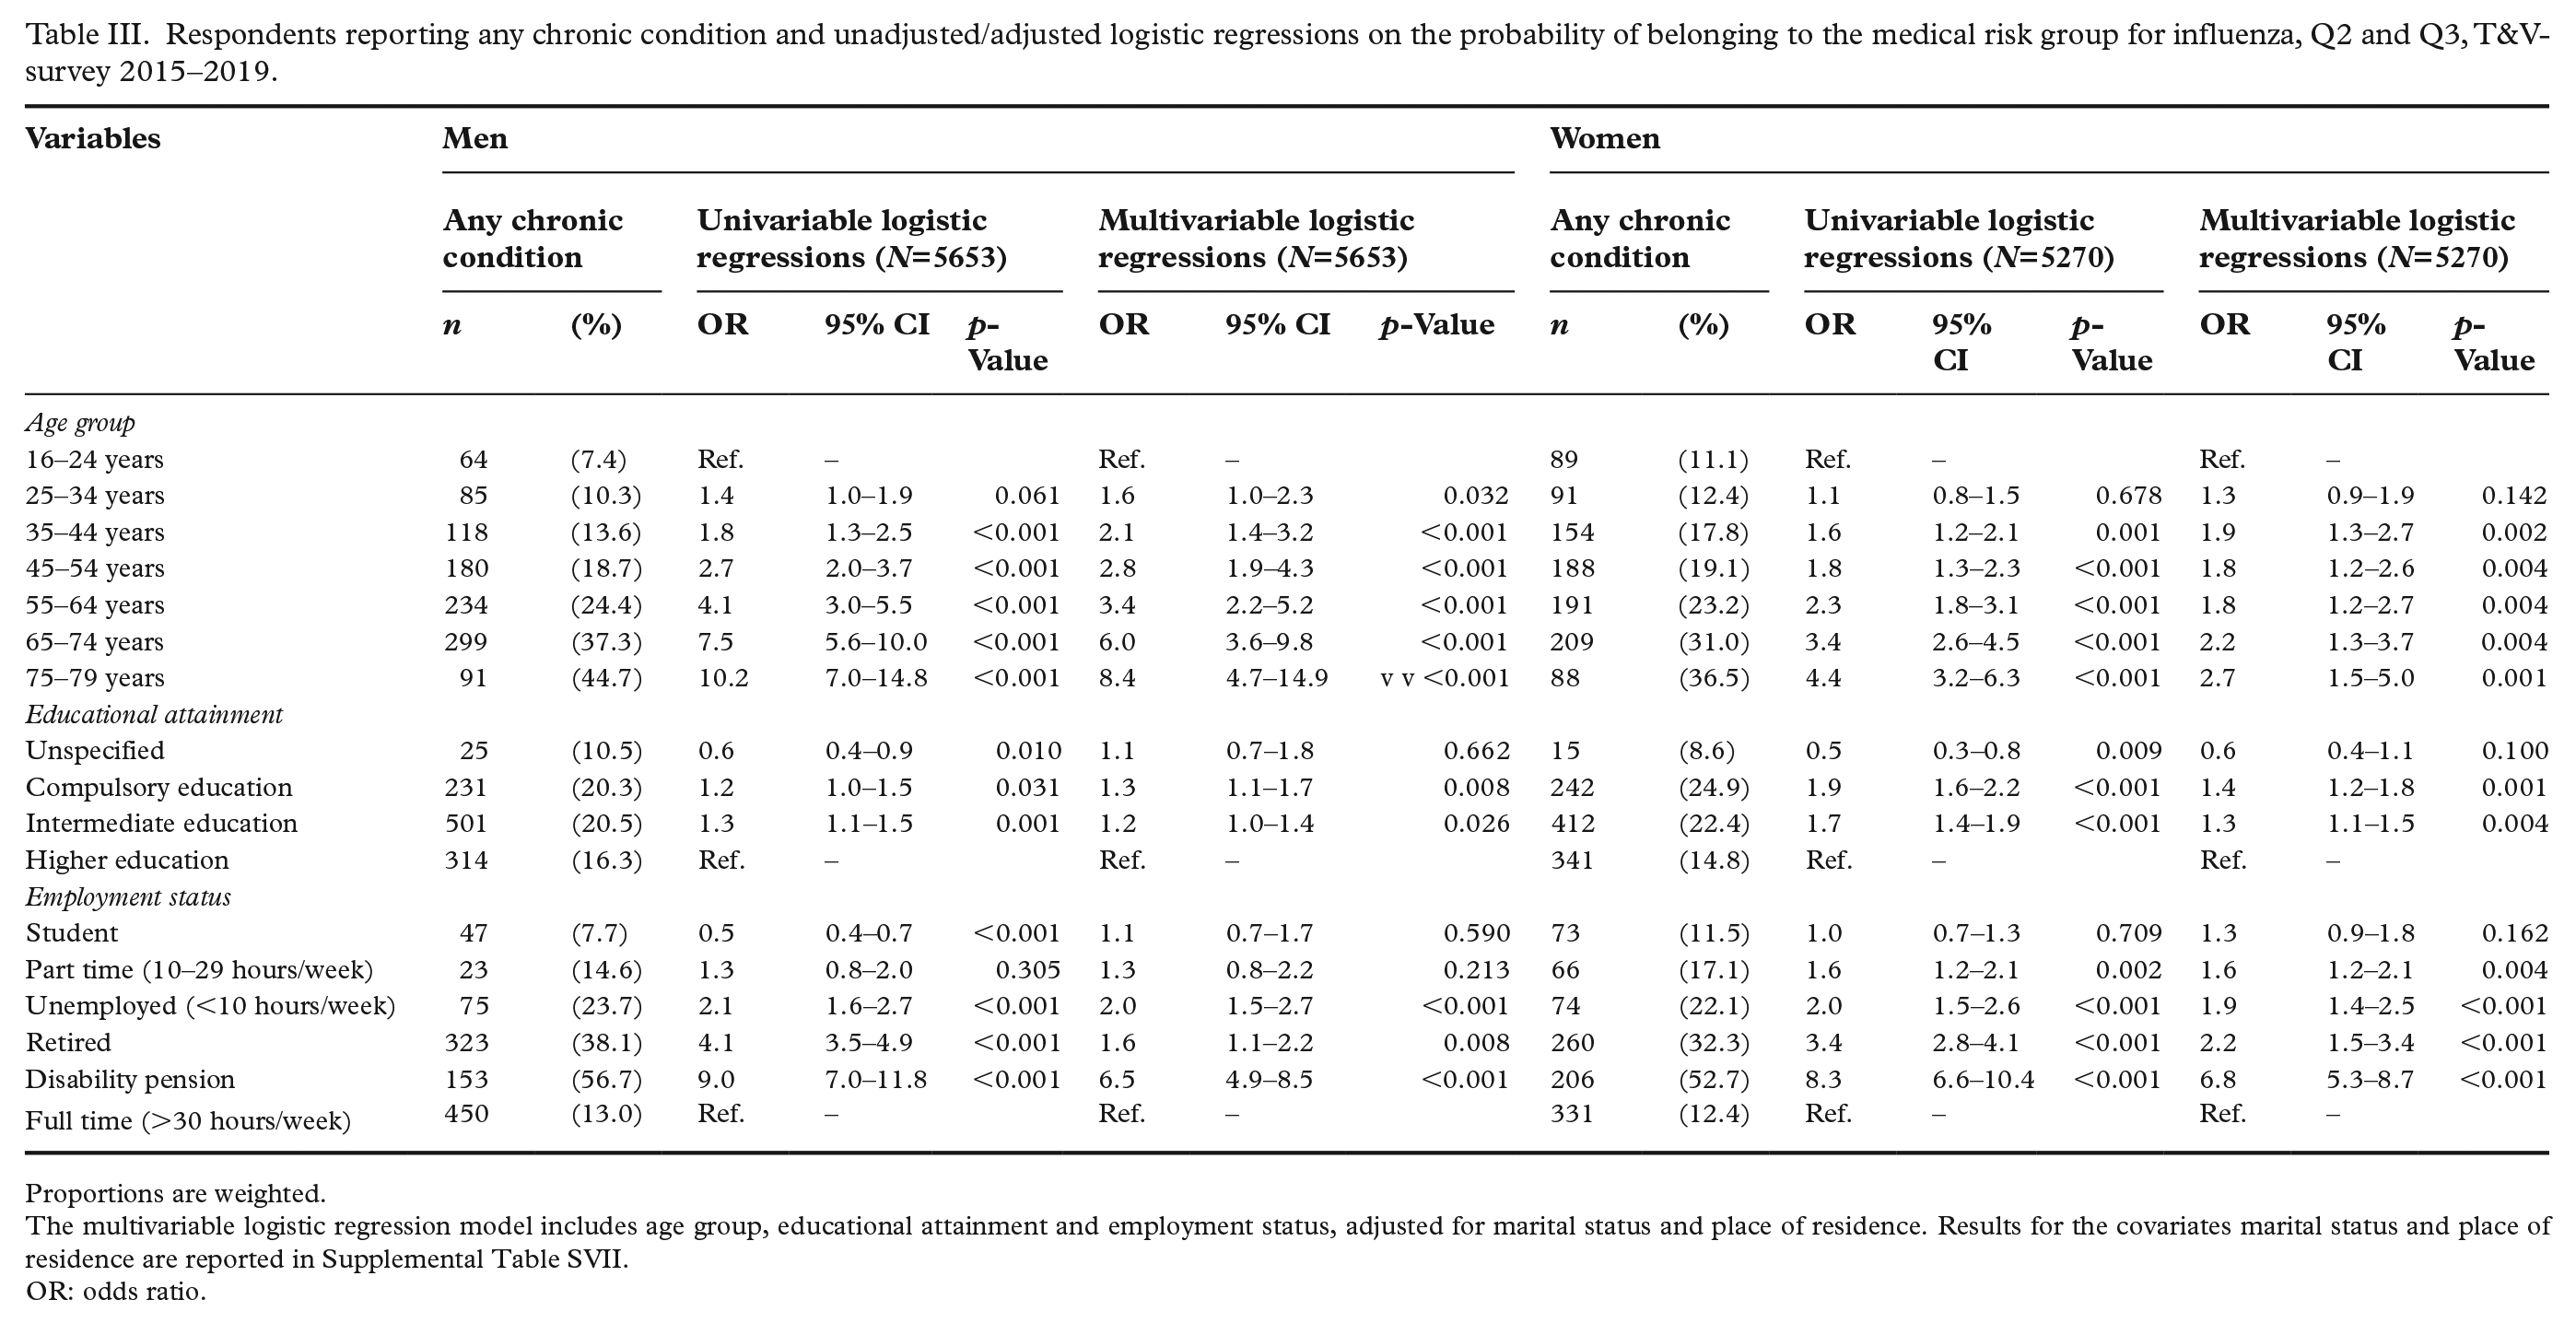
Proportions are weighted.
The multivariable logistic regression model includes age group, educational attainment and employment status, adjusted for marital status and place of residence. Results for the covariates marital status and place of residence are reported in Supplemental Table SVII.
OR: odds ratio.
In multivariable logistic regression analysis, belonging to a higher age group was associated with a significant increase in the risk of any chronic disease for both men and women, but the association was stronger among men. Inclusion of education and employment status attenuated the association between age and the risk of belonging to the medical risk group.
Education and employment status
The proportion reporting any chronic condition was higher for compulsory (men 20.3%; women 24.9%) and intermediate educational levels (men 20.5%; women 22.4%) than for higher education (men 16.3%; women 14.8%), especially among women (Table III). The association between lower educational level and risk of belonging to the medical risk group was also significant in the adjusted model, though slightly stronger for women (OR=1.4, 95% CI 1.2–1.8 for compulsory education; OR=1.3, 95% CI 1.1-1.5 for intermediate education) than for men (OR=1.3, 95% CI 1.1–1.7 for compulsory education; OR=1.2, 95% CI 1.0–1.4 for intermediate education).
We observed substantial variation in the proportion reporting any chronic condition by employment status. Compared to the reference category (full-time work), the risk of belonging to the medical risk group was significantly higher for unemployed (OR=2.1 (95% CI 1.6–2.7) and OR=2.2 (95% CI 1.5–3.4) for men and women, respectively) or retired (OR=1.6 (95% CI 1.1–2.2) and OR=2.2 (95% CI 1.5–3.4) for men and women, respectively) individuals in the adjusted model. Among women but not among men, part-time work was also associated with an increase in the risk of chronic disease (OR=1.6, 95% CI 1.2–2.1). People on disability pension had the markedly highest probability of belonging to a medical risk group for influenza among both men (OR=6.5, 95% CI 4.9-8.5) and women (OR=6.8, 95% CI 5.3–8.7; Table III).
Other covariates
Married and formerly married individuals had a higher risk of belonging to the medical risk group for influenza compared to those who were unmarried in univariable analysis but not in the adjusted model (Supplemental Table SVII). Urbanity was not associated with a risk of belonging to the influenza risk group in the adjusted model, except for men living in sparsely populated areas, who seemed to have a slightly lower risk (Supplemental Table SVII). Study year was not included in the final model, as adjustment for this variable did not affect the coefficients of the other variables.
Discussion
These are the first published estimates of the size and socio-economic distribution of the influenza risk group in Norway. In the age group 16–79 years, 19.0% reported chronic conditions related to increased risk of severe influenza, while 29.4% belonged to the risk group due to either age or medical conditions. Being older, having a low educational level or having a weaker connection to working life was associated with a higher risk of belonging to the medical risk group.
Direct comparison of the risk population between countries is complicated because policies regarding the risk group vary. The age limit of 65 years is a common but chosen cut-off, and across Europe, the wording of national recommendations varies from broad disease categories to specific diagnoses [14]. In 2008, the ECDC published a report suggesting that 25% of the population in the EU belonged to at least one risk group. National estimates ranged from 19% to 28%, depending on the percentage aged ⩾65 years in each country [5]. The percentage of those aged <65 years belonging to the medical risk groups was estimated flat at 8.3% based on primary care data from the UK [15], although data from Belgium and France indicated that this estimate would be too conservative for some countries [5]. However, the risk population was expected to increase over time due to general medical progress allowing people with chronic illness to live longer and an ageing population [5].
The current Norwegian estimates are higher than these previous findings. One reason is that the vaccine recommendations were expanded during the 2009 influenza pandemic when chronic liver failure, chronic neurological disease/injury and severe obesity were included in the list of medical risk groups (Supplemental Table SI). If we exclude these risk conditions from the analysis, the percentage reporting chronic disease is reduced from 19.0% to 15.1%, and the percentage belonging to the risk groups due to age and/or chronic disease falls from 29.4% to 26.2%. Another reason is the ageing of the Norwegian population. The proportion aged >65 years increased from 14.6% in 2008 to 17.2% in 2019, [11] but as our study covers five years, it does not fully account for this age-related increase.
Direct comparisons with national prevalence estimates are limited because the Norwegian risk groups are designed to be inclusive rather than diagnosis specific. However, as mentioned above, the study estimate of the medical risk population among individuals <18 years of age was 5.5%. This is comparable to the results of a recent Norwegian register study which found that 5% of the population <18 years of age had at least one diagnosis related to risk of severe influenza in Norway [4]. Furthermore, for diabetes prevalence, the T&V-survey estimate of 3.9% is lower than the national estimate of 4.7% [16]. This is as expected, since diabetes is increasingly prevalent in older age groups, and the T&V-survey has an upper age limit of 79 years. Although the medical risk group of chronic respiratory disease covers several diagnoses, it is also possible to compare the composite estimate of 5.9% from the T&V-survey with estimates of asthma and chronic obstructive pulmonary disease (COPD). Asthma prevalence among young adults in Norway is estimated at about 5%, while about 6% of adults >40 years of age have COPD [16].
The presence of chronic conditions increases with age, but age is also an important variable in itself with regard to influenza risk. While severe influenza disproportionally hits the very young (<5 years) and the very old (>80 years), the general pattern is that risk of infection is highest in lower age groups and decreases with age, whereas the risk of severe influenza disease is inverted [1]. The age-dependent risk of severe influenza is not fully explained by the increase in co-morbid conditions but is also due to factors such as immunosenescence [17] and the history of previous infections [18]. We observed a strong association between age and the presence of chronic conditions, especially among men. The inclusion of education and employment status did, however, attenuate the association between age and the risk of belonging to a medical risk group for influenza. This finding might indicate that socio-economic differences in the prevalence of chronic conditions are also relevant among the elderly [19].
The relationship between educational level and various measures of health is well documented. Health-related educational differences are generally expressed as a gradient, where higher education is associated with better health outcomes and self-rated health [19]. We found that the proportion reporting any chronic condition related to risk of severe influenza followed the expected pattern; higher education was associated with a lower risk of belonging to the medical risk group. The proportion belonging to the medical risk group for influenza was similarly higher among those with a weaker connection to working life. These results also echo earlier findings, as individuals with a weaker health status in general are less well integrated into Norwegian working life, especially those with low educational attainment [19].
The association between receipt of disability pension and medical risk groups for influenza is especially striking (Table III). Nearly 60% of those on disability pension report chronic conditions related to influenza risk. While many receive disability pension for diagnoses related to influenza risk, such as neurological or circulatory diseases, indication for disability pension covers a wide range of conditions. The most frequent reason for disability pension – mental health problems (36.2% of cases) – is not associated with risk of severe influenza. Many of the diagnoses in the second largest group – musculoskeletal disorders (27.3%) – is not directly related to influenza risk either [20]. These results do, however, indicate that people on disability pension might be an important group to target for influenza vaccination. Individuals receiving disability pension are underrepresented in our data set. While 10.5% of those aged 18–67 years receive disability pension in Norway [20], the corresponding proportion in the T&V-survey is 7.7%. As individuals on disability pension are more likely to belong to the medical risk group for influenza, this might have resulted in an underestimate in the size of the risk group.
In addition to these prevalence patterns of influenza risk, groups with lower SEP may have higher exposure to infectious pathogens via factors such as work environment, public transport and household crowding [21]. Moreover, lower SEP is associated with lower levels of health literacy [22,23], health-promoting behaviour [24] and care seeking, including intention to vaccinate and vaccination uptake [25,26], compared to groups with higher SEP. Factors influencing these patterns include language barriers, workplace flexibility, co-payment levels, trust in doctors/public health and social or cultural views on infectious disease and vaccines [27,28]. Taken together, this calls for targeted information and attitudinal campaigns to lessen the impact of such inequalities in influenza vaccine uptake.
Strengths and limitations
The primary strength of this study is the high-quality survey data from Statistics Norway with a large sample, register variables for age, sex and educational level and a high response rate. Random sampling from national registries stratified according to residence, age and sex, as well as post-survey adjustments by age, sex and educational level, increase national representability of the estimates.
The main limitations are that the sample is restricted to those aged 16–79 years and that data on employment status and chronic disease are self-reported. Statistics Norway checks for selective non-response in the survey by the register variables age, sex, county or educational level. The differences vary by study year and quarter, but people aged 25–44 years and those with unknown or low educational level are often slightly underrepresented. Both age-based and educational non-response is mostly due to non-contact (not able to get in touch with the respondent), and the results are weighted to account for this underrepresentation. Other selective non-response might, however, exist, and as outlined above, we found that people on disability pension were underrepresented in the net sample. Finally, we did not have access to data on income, occupation or housing tenure. However, education is well suited to this study’s purpose of describing the social distribution of risk factors for severe influenza, as it is a stable measure of SEP related to socio-economic background as well as of a person’s ability to make use of health information messages and preventive health services such as vaccination [29,30].
Conclusions
It was already known that some chronic conditions related to risk of severe influenza are more prevalent among people with lower SEP. This study indicates that the pattern applies to the medical risk group for influenza as a whole.
While we are unable to inform the discussion on causality regarding the association between education/employment status and chronic disease based on these data, they illustrate that societal factors are important in influenza risk. The social patterning of the influenza risk group, and in particular the vulnerable position of individuals on disability pension, should impact decisions regarding public funding of influenza vaccination in Norway. This knowledge must also be reflected in communication strategies towards the public and health professionals involved in influenza prevention and control.
Supplemental Material
sj-docx-1-sjp-10.1177_14034948211060635 – Supplemental material for Influenza risk groups in Norway by education and employment status
Supplemental material, sj-docx-1-sjp-10.1177_14034948211060635 for Influenza risk groups in Norway by education and employment status by Birgitte Klüwer, Kjersti Margrethe Rydland, Ida Laake, Megan Todd, Lene Kristine Juvet and Svenn-Erik Mamelund in Scandinavian Journal of Public Health
Footnotes
Declaration of conflicting interests
The authors declared no potential conflicts of interest with respect to the research, authorship and/or publication of this article.
Funding
The authors disclosed receipt of the following financial support for the research, authorship and/or publication of this article: This research is part of the project PANRISK: Socio-economic risk groups, vaccination and pandemic influenza, funded by a research grant from the Research Council of Norway (grant agreement no. 302336).
Supplemental material
Supplemental material for this article is available online.
References
Supplementary Material
Please find the following supplemental material available below.
For Open Access articles published under a Creative Commons License, all supplemental material carries the same license as the article it is associated with.
For non-Open Access articles published, all supplemental material carries a non-exclusive license, and permission requests for re-use of supplemental material or any part of supplemental material shall be sent directly to the copyright owner as specified in the copyright notice associated with the article.