
Abstract
Aims: Obesity and weight change are associated with sickness absence; however, less is known about the diagnoses for sickness absence. We examined the association between stable and changing weight by body mass index groups with sickness absence due to any, musculoskeletal and mental diagnoses among midlife female and male employees. Methods: The Finnish Helsinki Health Study phase 1 survey took place in 2000–2002 (response rate 67%) and phase 2 in 2007 (response rate 83%). Based on self-reported body mass index, we calculated the weight change between phases 1 and 2 (body mass index change ⩾5%). The data were linked with registers of the Social Insurance Institution of Finland, including information on diagnoses (ICD-10) for sickness absence >9 days. We used a negative binom ial model to examine the association with sickness absence among 3140 women and 755 men during the follow-up (2007–2013). Results are presented as rate ratios. Covariates were age, sociodemographic factors, workload, health behaviors and prior sickness absence. Results: Weight-gain (rate ratio range=1.27–2.29), overweight (rate ratio range=1.77–2.02) and obesity (rate ratio range=2.16–2.29) among women were associated with a higher rate of sickness absence due to musculoskeletal diseases, compared to weight-maintaining normal-weight women. Similarly, obesity among men was associated with sickness absence due to musculoskeletal diseases (rate ratio range=1.55–3.45). Obesity among women (rate ratio range=1.54–1.72) and weight gain among overweight men (rate ratio=3.67; confidence interval=1.72–7.87) were associated with sickness absence due to mental disorders.
Background
Despite actions to promote health, a large proportion of adults in Western countries are overweight and one-fifth are obese [1]. Obesity is not only a major risk factor for somatic ill-health [2, 3], including metabolic diseases, musculoskeletal disorders and cancers, but also a risk factor for poor quality of life [4] and work disability [5, 6]. Obesity is associated with both musculoskeletal diseases and mental disorders [7–9], the most common causes of work disability in Finland [10].
In several studies, obesity has been associated with long-term sickness absence (SA) [5, 6]. In some studies, overweight employees have also shown an increased risk for SA. Similarly, weight change has been associated with SA. A British study showed that being or becoming obese was associated with especially long SA spells among men [11]. However, obesity was self-reported retrospectively, the follow-up time varied and the definition of weight change was broad. In 2012 a US study showed an association between weight gain among normal weight and overweight employees and absence from work [12]. SA was self-reported retrospectively and weight change was defined as a minimum change of one kilogram. A study on the present data showed that weight change of >5% increased the risk for SA spells of varying lengths among women [13]. Among men the associations were similar, but statistically underpowered.
The diagnoses behind SA are important to study to increase the understanding of the association between body mass index (BMI), health and work disability. Such understanding of the association might help focus prevention more efficiently. So far, the association between BMI, weight change and medically confirmed diagnoses for SA is poorly understood. One study has examined BMI as a prognostic factor for SA due to respiratory and musculoskeletal complaints. The study found no association, but the data on symptoms were collected subsequently with a questionnaire, and the small-scale study (n=222–251) included only male employees [14, 15]. A Finnish study found that BMI ⩾ 25 kg/m2 was associated with SA due to musculoskeletal pain among 386 female kitchen workers [16].
Therefore, the main aim of this study was to examine the association between weight change among normal weight, overweight and obese Finnish public-sector employees and subsequent SA due to any musculoskeletal and mental diagnoses. In addition, the effect of covariates on the association was examined. The focus was on finding risk groups and showing patterns in the associations between obesity, weight change and SA.
Study population and methods
Data
The Helsinki Health Study (HHS) cohort includes 8960 municipal employees working for the City of Helsinki, the biggest employer in Finland [17]. The baseline mail survey was sent to all employees turning 40, 45, 50, 55 and 60 in 2000–02 (phase 1, response rate 67%). Phase 2 follow-up survey was mailed to all respondents of the phase 1 survey in 2007 (response rate 83%). For those consenting to it (76%, n=5584), the data were linked to registers of the Social Insurance Institution of Finland. Women were in the majority (82%), which reflects the gender distribution in the Finnish municipal sector. Men, younger employees and manual workers were slightly underrepresented, but according to non-response analyses, the data represent the target population satisfactorily [17, 18]. Participants who were pregnant (n=16), underweight at phase 1 (BMI <18.5 kg/m²) (n=45), or retired prior to phase 2 (n=1288) were excluded. The final analyzed data consisted of 3140 women and 755 men after exclusions of responders with missing information on height or weight (n=62), socioeconomic position (n=8), marital status (n=8), physical (n=112) or mental (n=36) workload, problem drinking (n=74), physical activity (n=22) and smoking (n=18).
The ethics committees of the Department of Public Health, University of Helsinki and the health authorities of the City of Helsinki approved the HHS protocol.
Measures
BMI
Self-reported weight (kg) divided by the square of the height (m) defined the BMI (kg/m²), and a BMI change ⩾5% between phase 1 and phase 2 defined the weight change. We used a 5% cut-off, because in previous studies a 5% weight loss was regarded as clinically significant [19]. Based on the weight change and BMI at phase 1, the participants were classified into seven groups: 1) normal-weight weight maintainers (BMI 18.5–24.9 kg/m², weight change <5%), 2) normal-weight weight gainers (BMI 18.5–24.9 kg/m², weight gain ⩾5%), 3) overweight weight maintainers (BMI 25–29.9 kg/m², weight change <5%), 4) overweight weight gainers (BMI 25–29.9 kg/m², weight gain ⩾5%), 5) obese weight-maintainers (BMI ⩾30 kg/m², weight change <5%), 6) obese weight gainers (BMI ⩾30 kg/m², weight gain ⩾5%) and 7) all weight losers (weight loss ⩾5%).
Diagnosis-specific SA
The Finnish national register data on SA benefits include information on the number and length of the SA spells lasting of 10 working days or longer, as well as the medically confirmed diagnosis for each spell. The Social Insurance Institution of Finland pays sickness benefits for these SA spells lasting 10 or more days, whereas the employer is responsible for the first nine days. Therefore, these shorter spells are not included in the register. To receive the benefit, the employees need to show a medical certificate with a ICD-10 diagnosis given by a doctor. We used the ICD codes to separately examine the number of SA spells lasting 10 or more working days due to any, musculoskeletal (M00–M99), mental (F00–F99) and other diagnoses during the follow up between 2007 and 2013. Injuries (S00–S99) were the most common diagnosis group among the other diagnoses. The mean follow-up time was 5.2 years.
Covariates
Based on previous work, age, sociodemographic factors, smoking, alcohol use, physical activity and working conditions are assumed to be associated with BMI and SA [5, 13] and were therefore examined as covariates also in this study. Baseline age included five categories: 40, 45, 50, 55 and 60. Socioeconomic position (SEP) was derived from the employer’s register and comprised of managers and professionals, semi-professionals, routine non-manual employees and manual workers. Marital status included two categories: married or cohabiting versus others. Drinking problems were measured by the CAGE questionnaire [20]. The cut-off scores were two and three points for women and men, respectively [20]. Smoking status included smokers and non-smokers. Physical activity was measured with metabolic equivalent values (MET). The total leisure-time MET hours per week were calculated from self-reported estimates of average weekly hours of leisure-time physical activity per four intensity grades by multiplying the weekly hours by the MET value and adding the four values together. Fewer than 14 MET hours per week was classified as physical inactivity (e.g. 2.5 hours of brisk walking equals 15 MET hours) [21]. Based on self-reports, workload was categorized as physically strenuous or non-strenuous and mentally strenuous or non-strenuous. Information on prior SA was derived from the register data and included any SA spell lasting 10 or more days during the 1-year period prior to phase 2. The other covariates were from phase 2, except for baseline age and socioeconomic position.
Statistical analyses
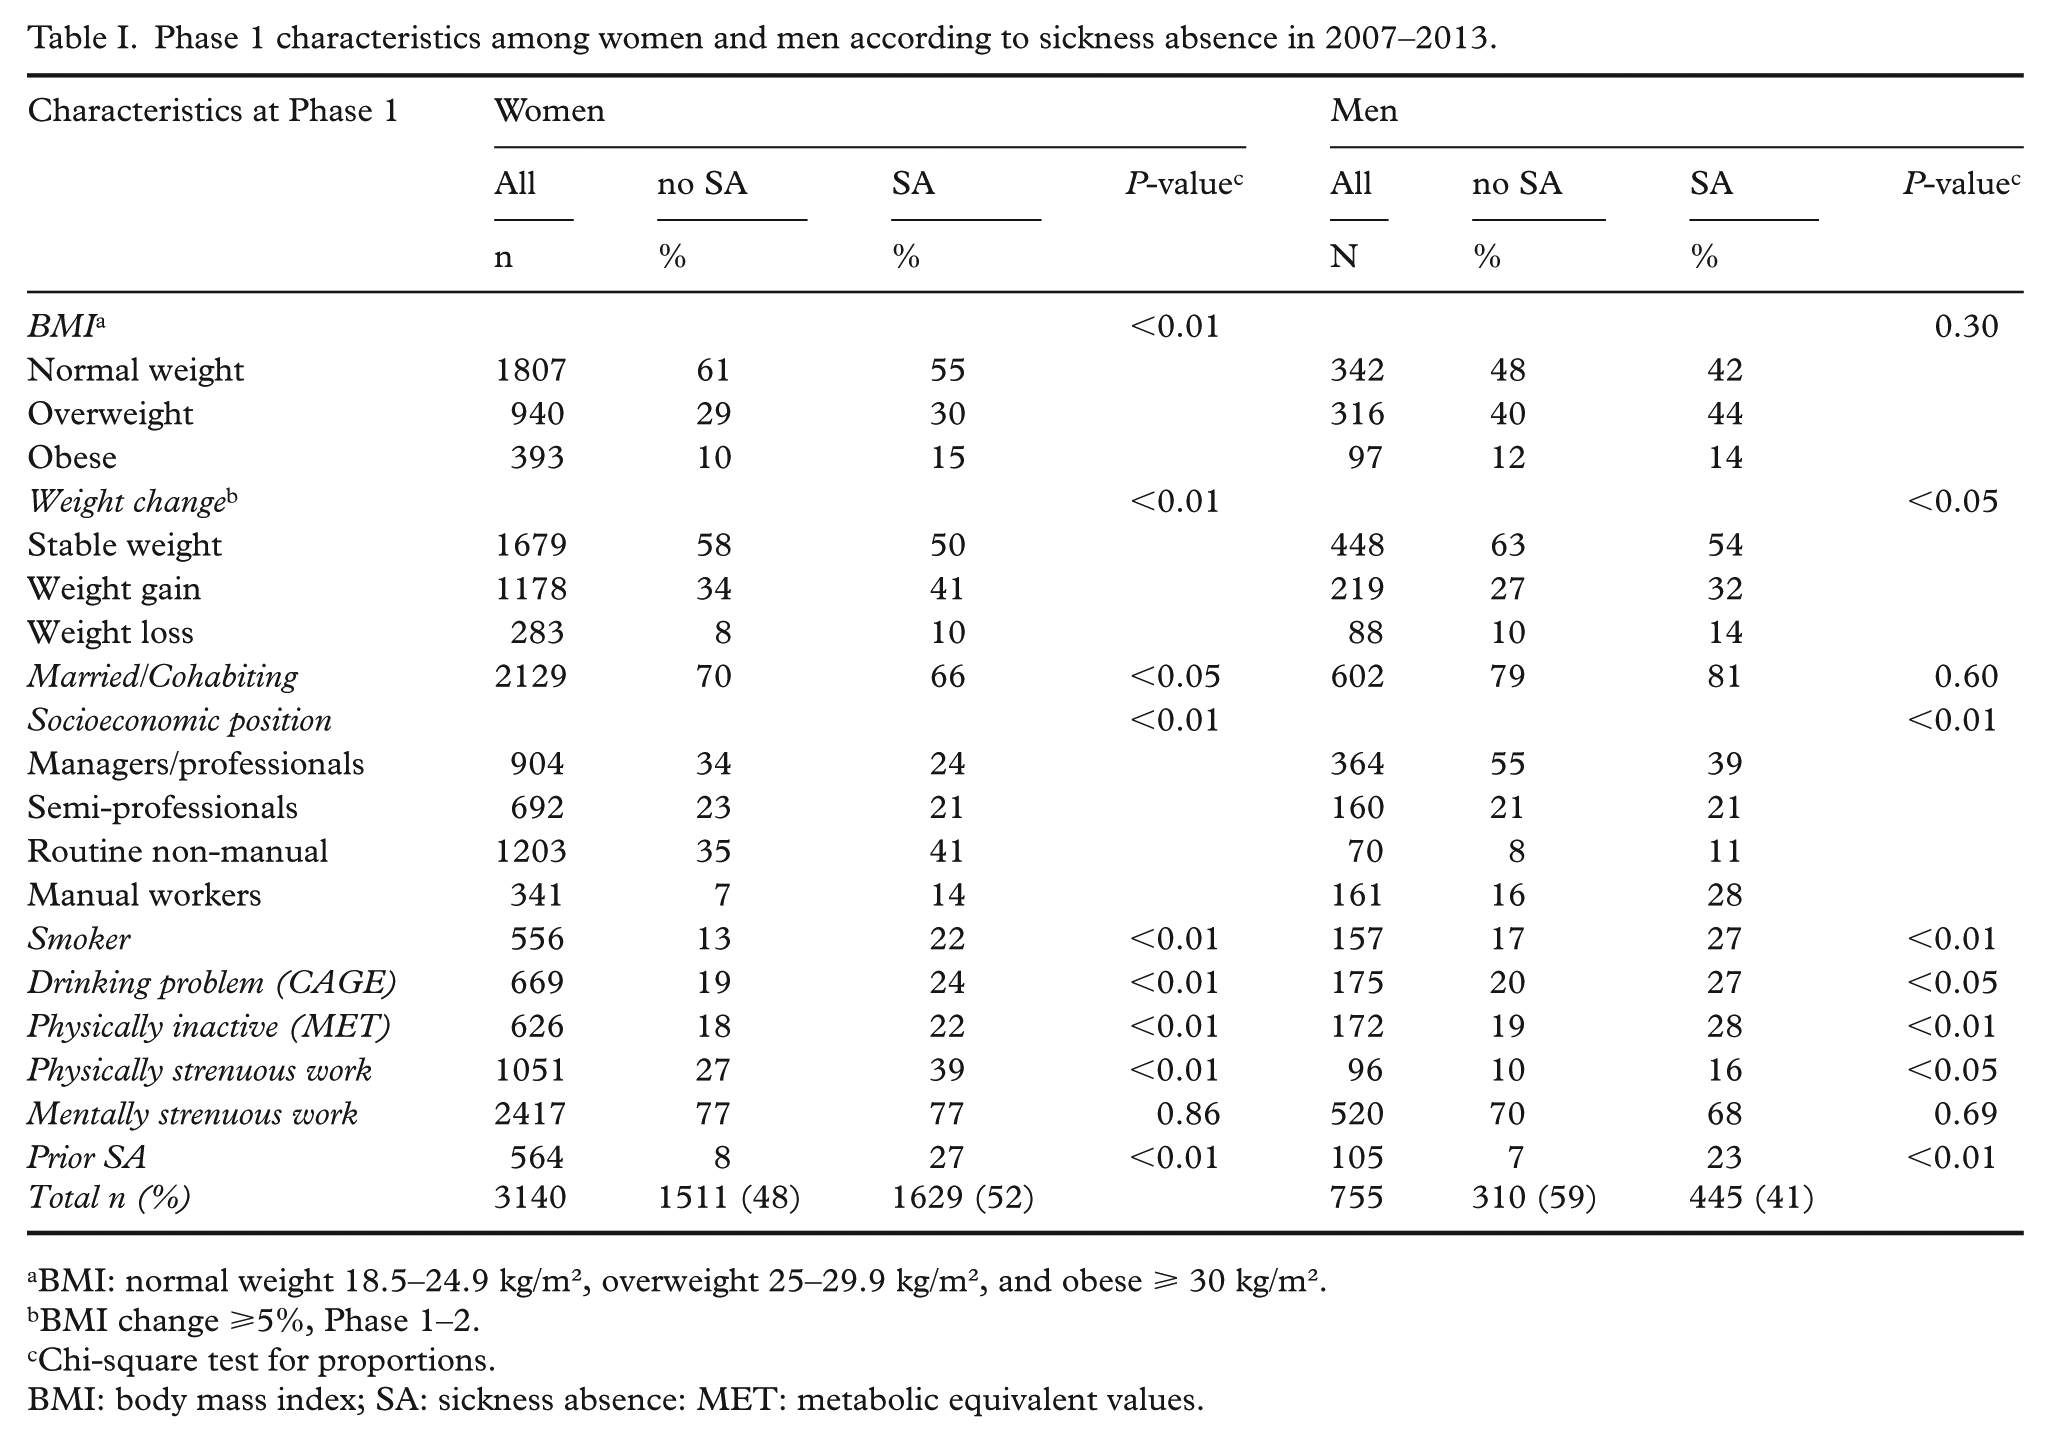
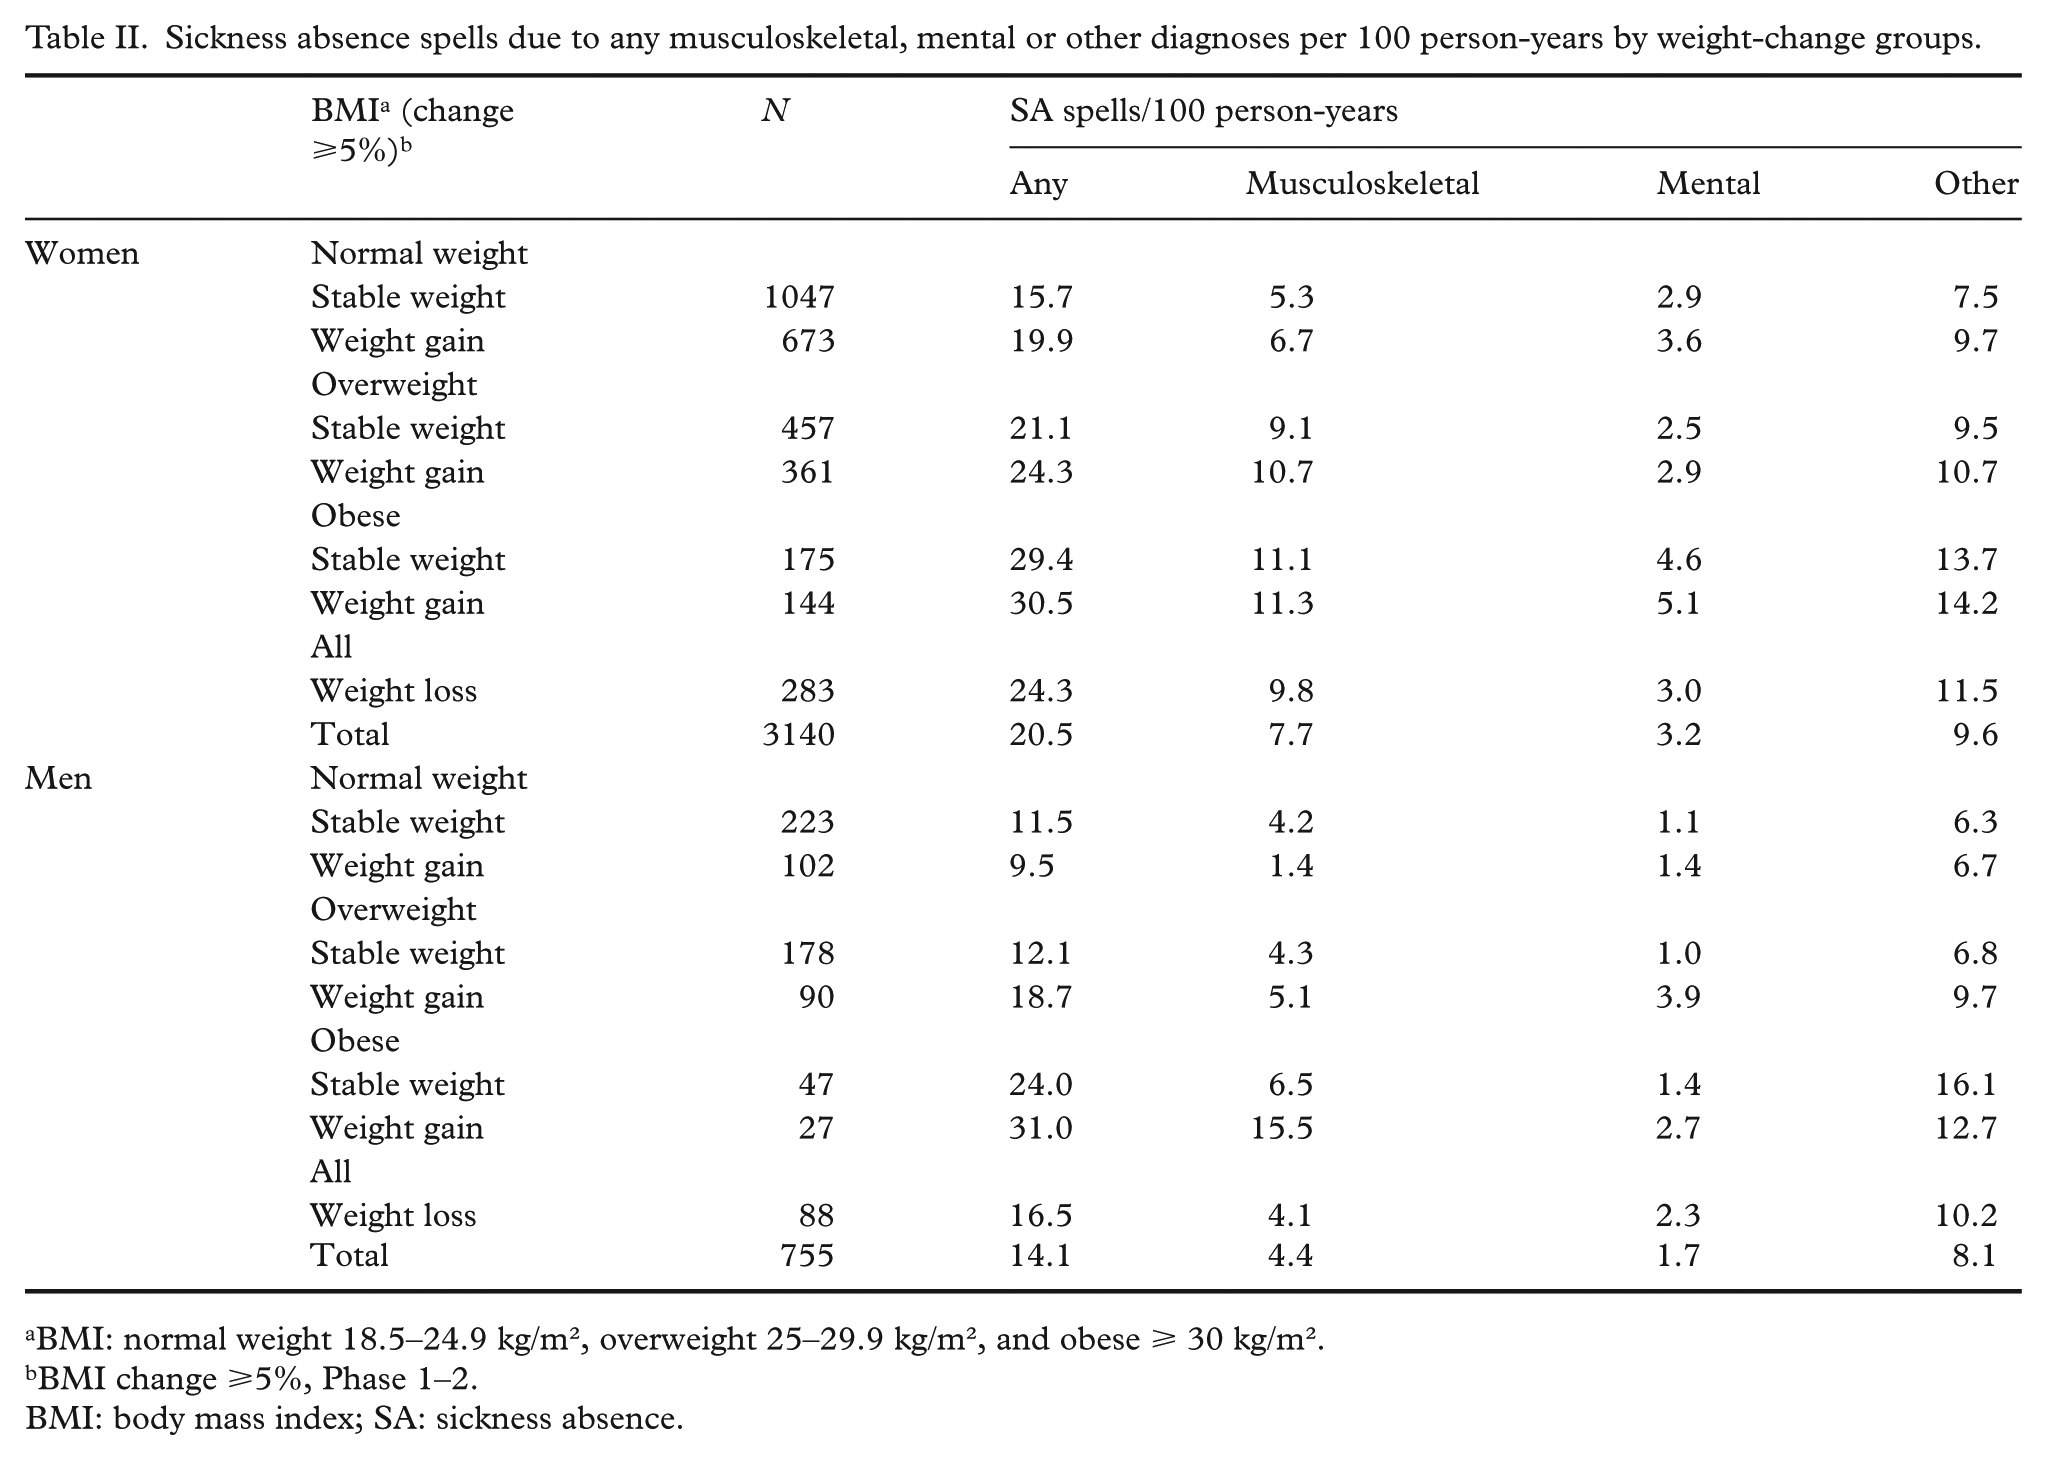
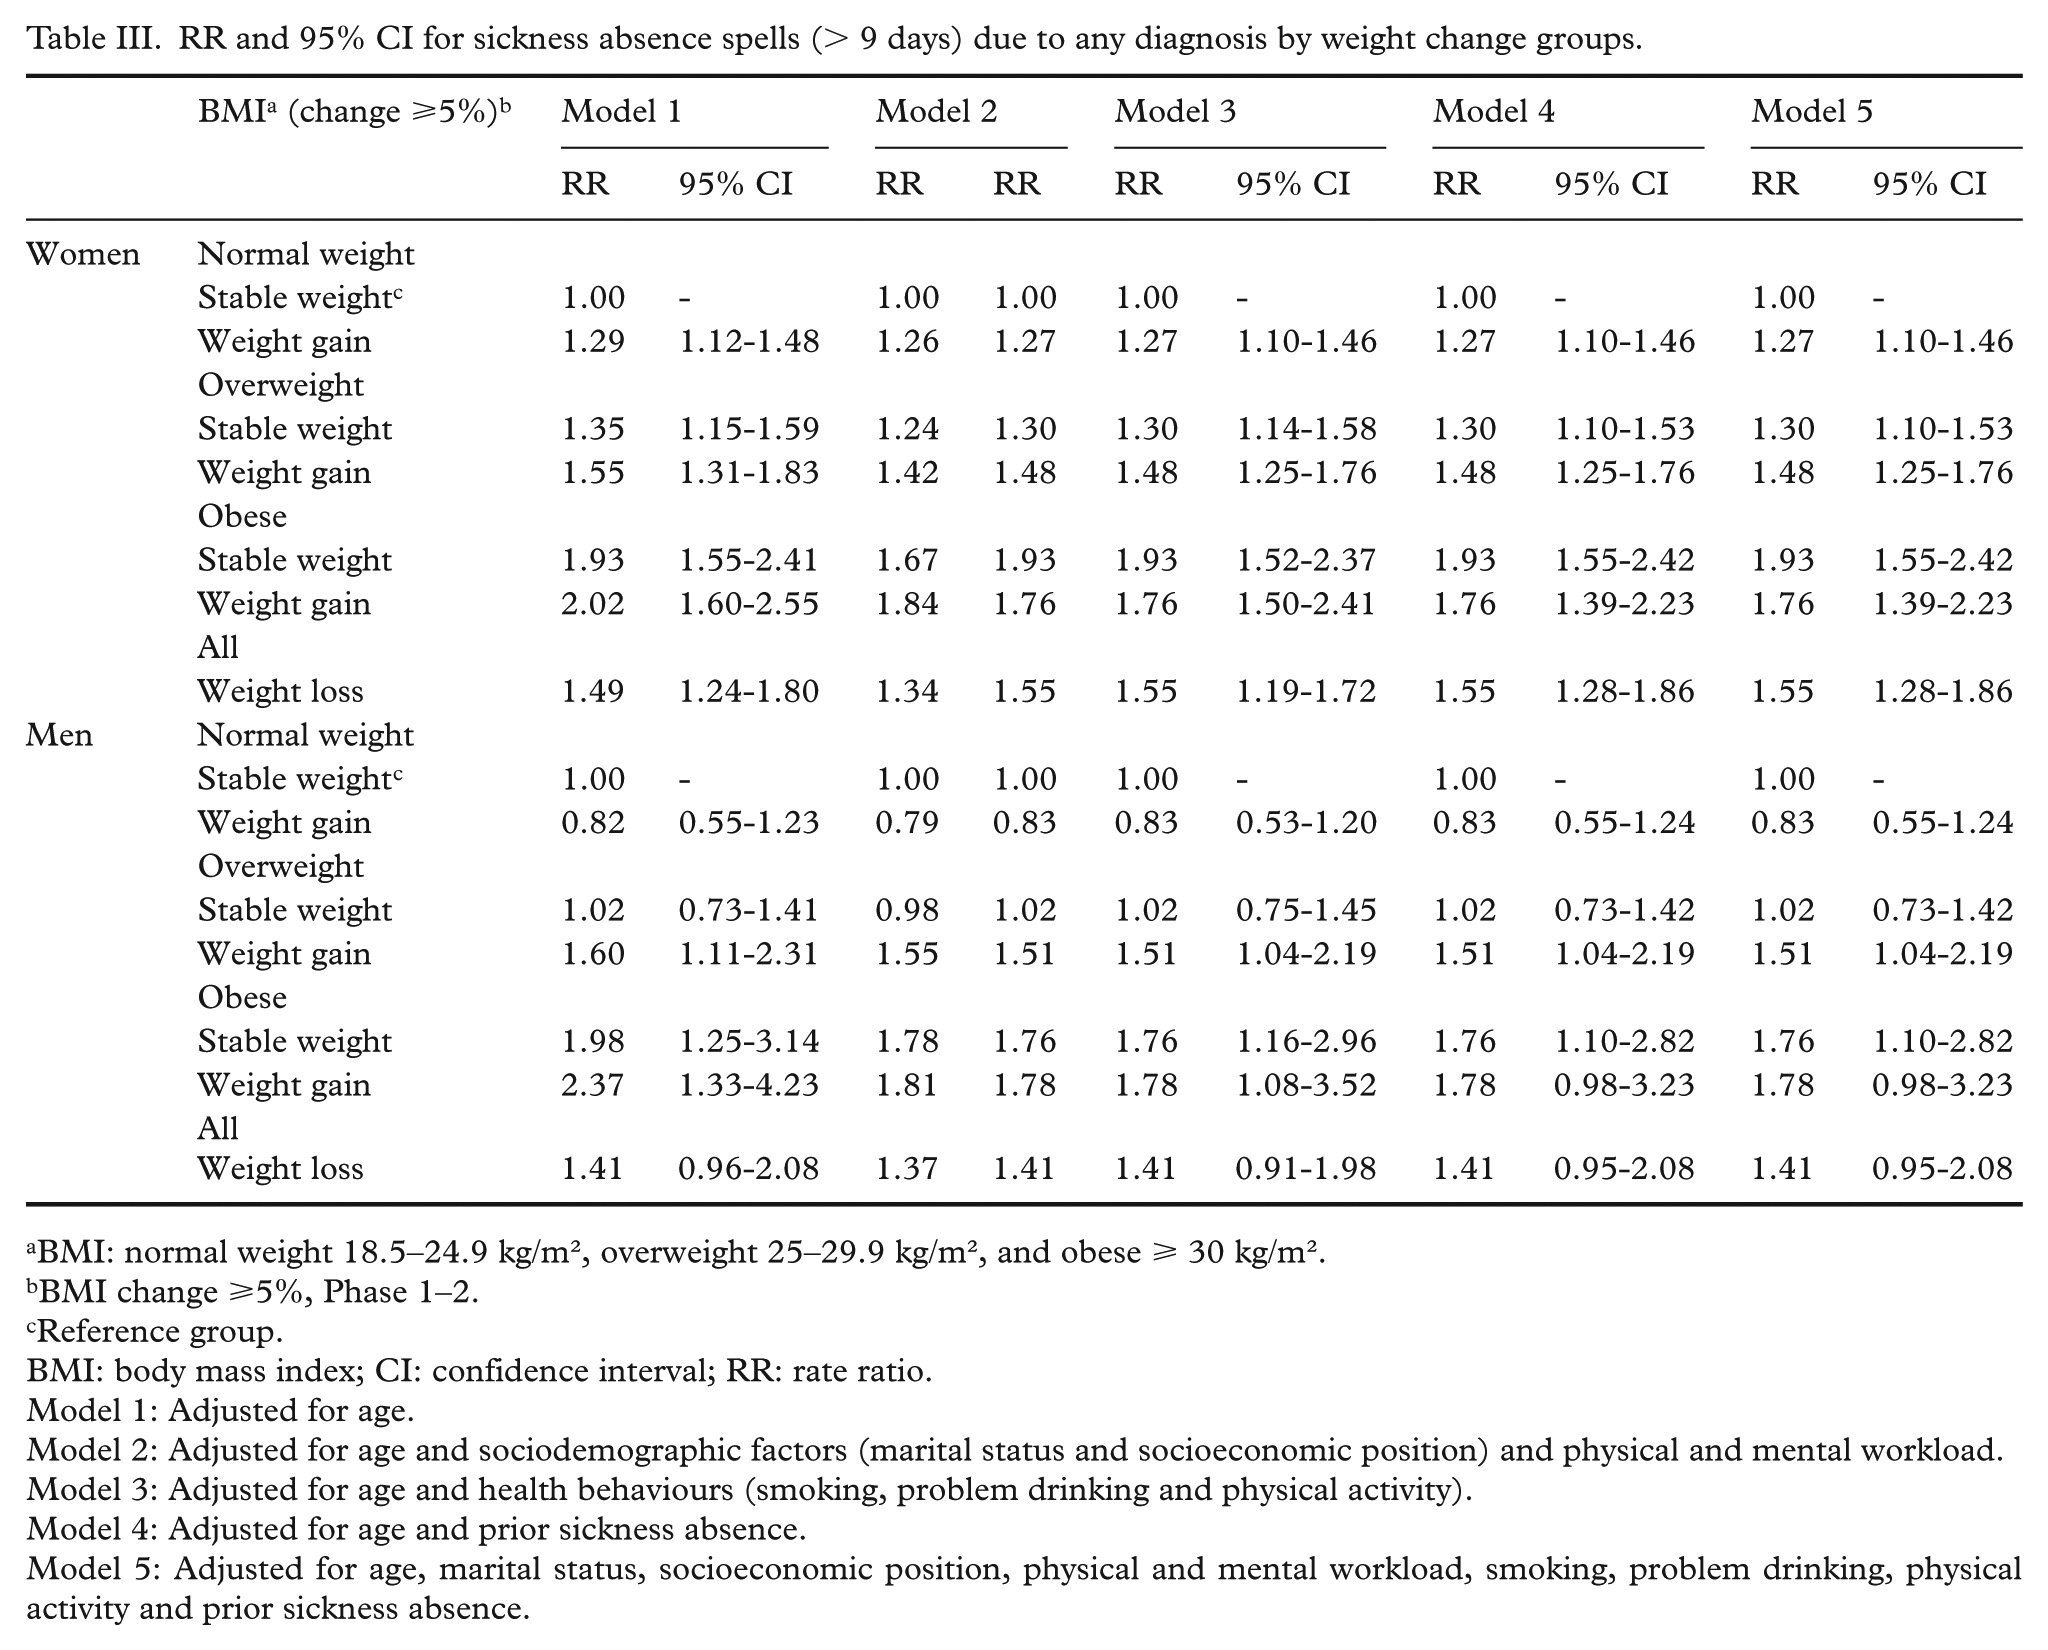
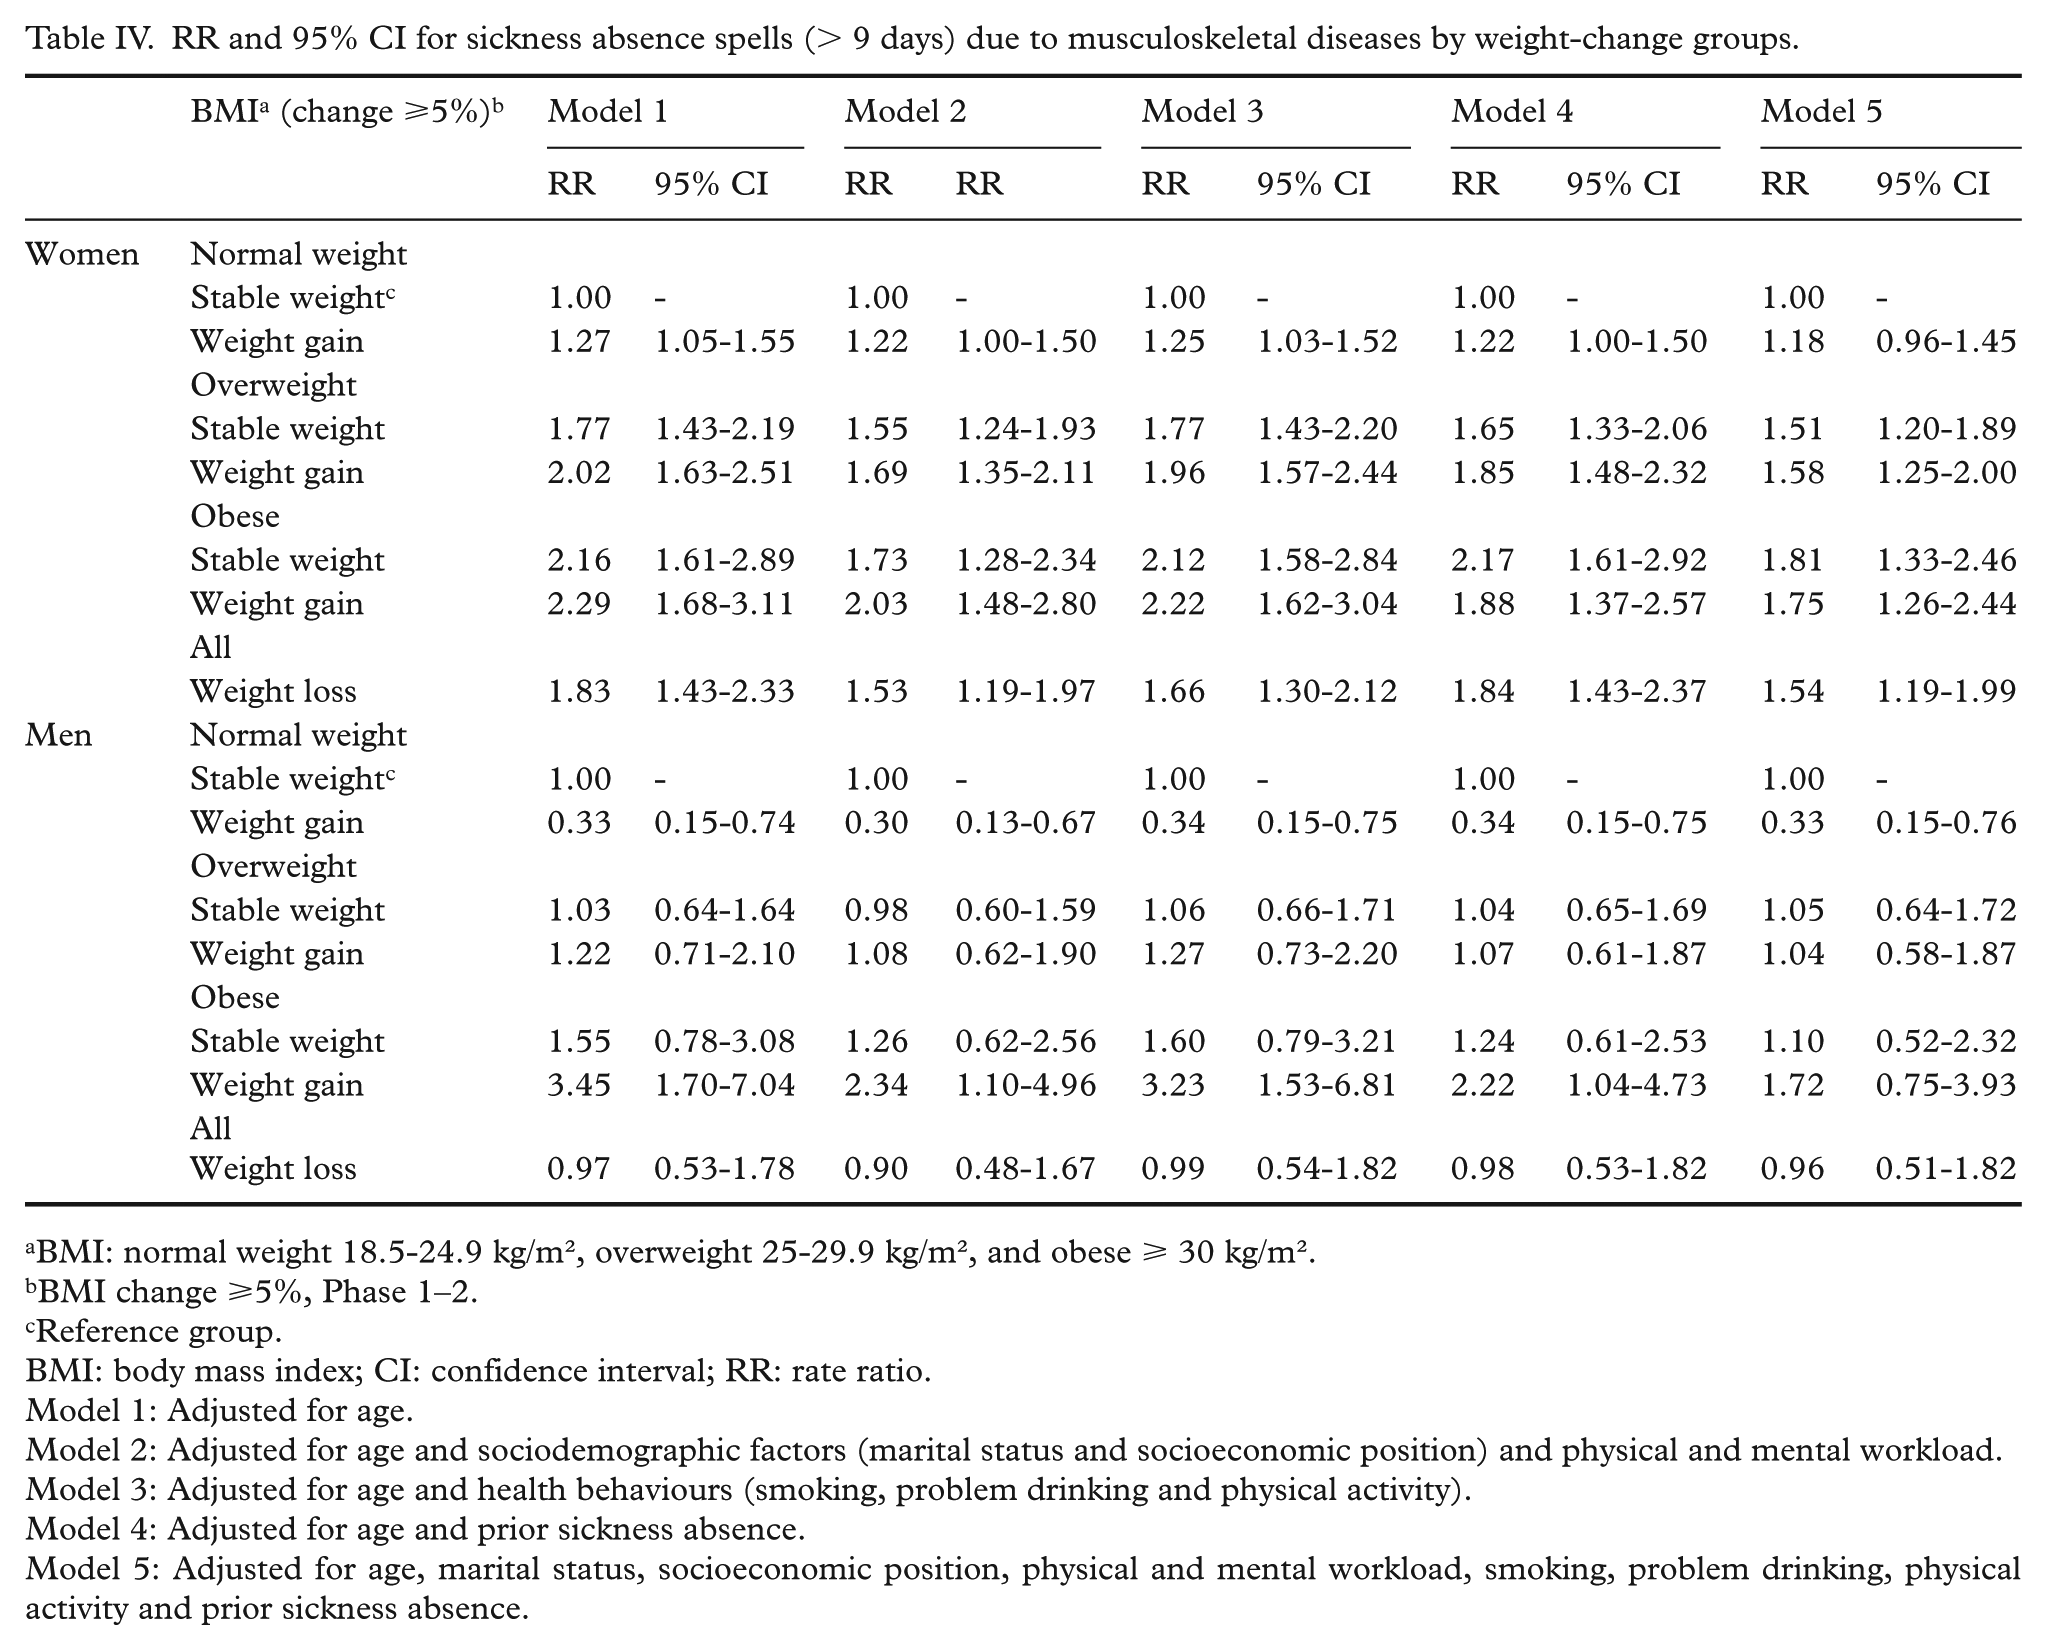
We carried out the analyses in several steps. First, cross-tabulation was used to describe the baseline characteristics among women and men with and without SA (Table I). Second, we calculated the number of SA spells due to any musculoskeletal, mental and other diagnoses per 100 person-years by the weight-change groups (Table II). Third, we used a negative binomial model to calculate rate ratios (RR) and their 95% confidence intervals (CI) to examine the association with SA due to any musculoskeletal and mental diagnoses among the different weight change groups (Tables III–V). The association with SA due to other diagnoses group was also examined, but the results are not shown as the associations were similar to those for any diagnoses. Model 1 was adjusted for age, model 2 additionally for socio-demographic factors and strenuousness of work, model 3 for health behaviours, model 4 for prior sickness-absence and model 5 for all covariates. Normal-weight weight-maintaining participants served as the reference group. Women and men were examined separately in all analyses due to a gender interaction in the diagnosis-specific analysis (musculoskeletal (p=0.007) and mental diagnoses (p=0.018)). The analyses were conducted with IBM SPSS Statistics 24.
Phase 1 characteristics among women and men according to sickness absence in 2007–2013.
BMI: normal weight 18.5–24.9 kg/m², overweight 25–29.9 kg/m², and obese ⩾ 30 kg/m².
BMI change ⩾5%, Phase 1–2.
Chi-square test for proportions.
BMI: body mass index; SA: sickness absence: MET: metabolic equivalent values.
Sickness absence spells due to any musculoskeletal, mental or other diagnoses per 100 person-years by weight-change groups.
BMI: normal weight 18.5–24.9 kg/m², overweight 25–29.9 kg/m², and obese ⩾ 30 kg/m².
BMI change ⩾5%, Phase 1–2.
BMI: body mass index; SA: sickness absence.
RR and 95% CI for sickness absence spells (> 9 days) due to any diagnosis by weight change groups.
BMI: normal weight 18.5–24.9 kg/m², overweight 25–29.9 kg/m², and obese ⩾ 30 kg/m².
BMI change ⩾5%, Phase 1–2.
Reference group.
BMI: body mass index; CI: confidence interval; RR: rate ratio.
Model 1: Adjusted for age.
Model 2: Adjusted for age and sociodemographic factors (marital status and socioeconomic position) and physical and mental workload.
Model 3: Adjusted for age and health behaviours (smoking, problem drinking and physical activity).
Model 4: Adjusted for age and prior sickness absence.
Model 5: Adjusted for age, marital status, socioeconomic position, physical and mental workload, smoking, problem drinking, physical activity and prior sickness absence.
RR and 95% CI for sickness absence spells (> 9 days) due to musculoskeletal diseases by weight-change groups.
BMI: normal weight 18.5-24.9 kg/m², overweight 25-29.9 kg/m², and obese ⩾ 30 kg/m².
BMI change ⩾5%, Phase 1–2.
Reference group.
BMI: body mass index; CI: confidence interval; RR: rate ratio.
Model 1: Adjusted for age.
Model 2: Adjusted for age and sociodemographic factors (marital status and socioeconomic position) and physical and mental workload.
Model 3: Adjusted for age and health behaviours (smoking, problem drinking and physical activity).
Model 4: Adjusted for age and prior sickness absence.
Model 5: Adjusted for age, marital status, socioeconomic position, physical and mental workload, smoking, problem drinking, physical activity and prior sickness absence.
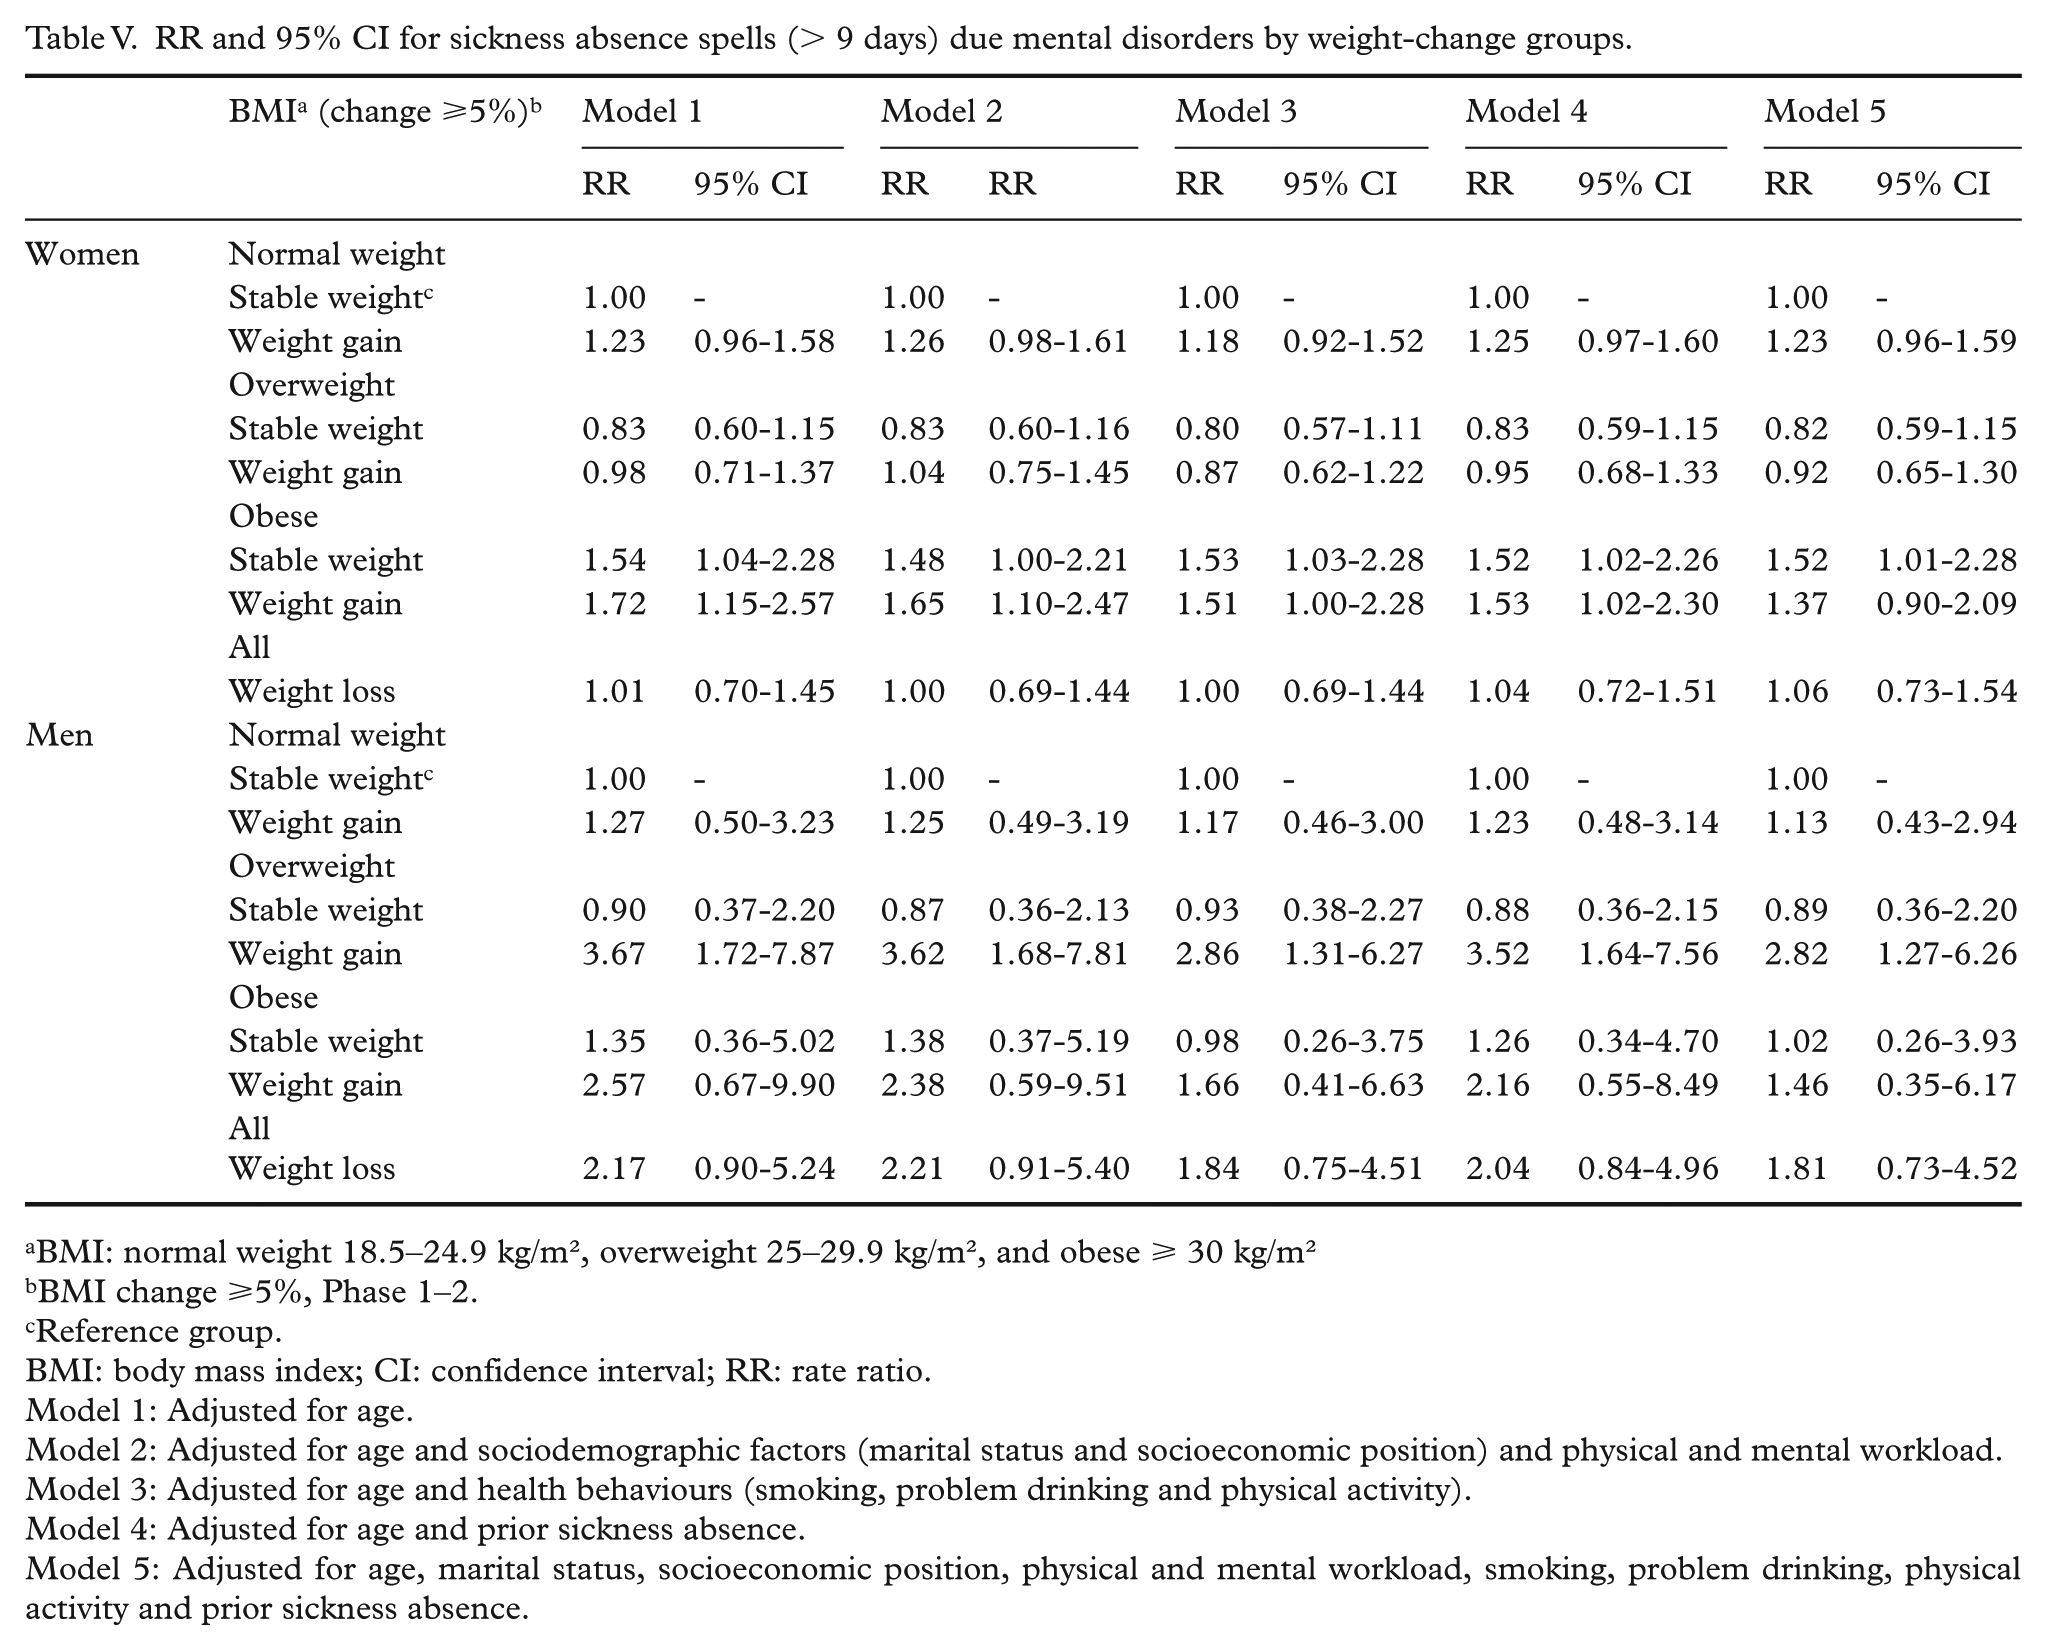
RR and 95% CI for sickness absence spells (> 9 days) due mental disorders by weight-change groups.
BMI: normal weight 18.5–24.9 kg/m², overweight 25–29.9 kg/m², and obese ⩾ 30 kg/m²
BMI change ⩾5%, Phase 1–2.
Reference group.
BMI: body mass index; CI: confidence interval; RR: rate ratio.
Model 1: Adjusted for age.
Model 2: Adjusted for age and sociodemographic factors (marital status and socioeconomic position) and physical and mental workload.
Model 3: Adjusted for age and health behaviours (smoking, problem drinking and physical activity).
Model 4: Adjusted for age and prior sickness absence.
Model 5: Adjusted for age, marital status, socioeconomic position, physical and mental workload, smoking, problem drinking, physical activity and prior sickness absence.
Results
Mean age was 47.3 years among women and 48.0 years among men. Weight gain was common especially among women (41%) and men (32%) with SA, whereas normal weight was less common among women with SA (55%) than women without SA (61%) (Table I). Among men there were no statistically significant differences in phase 1 BMI groups. Low SEP, physical inactivity, smoking, drinking problems and physically strenuous work were associated with SA among women and men.
Overall, women had 20.5 and men 14.1 SA spells per 100 person-years (Table II). Of these, approximately one-third (35%) were due to musculoskeletal diagnoses (M00–M99), half (51%) due to other and 14% due to mental health diagnoses (F00–F99). The most common diagnosis group among the other diagnoses was injuries (S00–S99, 10% of all diagnoses). Among both women and men, SA spells gradually increased with increasing BMI. Also, among the majority of weight-gaining and weight-losing groups SA spells were likely more common than among the weight-maintaining groups.
Weight loss (RR=1.49; CI=1.24-1.80) and weight gain among women were associated with a higher rate of SA spells due to any diagnosis, compared to the reference group of weight-maintaining normal-weight women (Table III). In addition, weight-maintaining overweight (RR=1.55; CI=1.31-1.83) and weight-maintaining obese (RR=2.02; CI=1.60-2.55) women also had a higher rate of SA due to any diagnosis. Among men, weight loss among all men (RR=1.41; CI=0.96–2.08), weight gain among overweight men (RR=1.60; CI=1.11–2.31), and weight gain (RR=2.37; CI=1.33–4.23) and weight maintenance (RR=1.98; CI=1.25–3.14) among obese men was associated with a higher rate of SA spells due to any diagnosis. The associations slightly attenuated but remained in the adjusted models 2–4, although among men the association was only borderline significant after adjustments, especially for socioeconomic position in model 2 and prior SA in model 4. The association with SA due to other diagnoses was similar but lacked statistical power compared to SA due to any diagnosis (results not shown).
Similarly, weight gain, weight loss, overweight and obesity were associated with a higher rate of SA spells due to musculoskeletal diseases among women, compared to weight-maintaining normal-weight women (Table IV). The associations slightly attenuated but remained after adjustments for physical workload and socioeconomic position in model 2. Among men, weight-gaining (RR=3.45; CI=1.70–7.04) obese men had a higher rate of SA spells due to musculoskeletal diseases. However, among weight-gaining normal-weight men there was an inverse association with SA due to musculoskeletal diseases (RR=0.33; CI=0.15–0.74).
Compared to weight-maintaining normal-weight women, weight-gaining (RR=1.72; CI=1.15–2.57) and weight-maintaining (RR=1.54; CI=1.04–2.28) obese women had a higher rate of SA spells due to mental disorders (Table V). Also, weight-gaining overweight (RR=3.67; CI=1.72–7.87) men had a higher rate of SA than the reference group. The association attenuated, but remained, when adjusted for physical activity in model 3. Among weight-gaining obese (RR=2.57; CI=0.67–9.90) and all weight-losing (RR=2.17; CI=0.90–5.24) men, there were statistically non-significant associations, which also weakened after adjustment for physical activity in model 3.
Discussion
Principal findings
We examined the association between BMI, weight change and diagnosis-specific SA among midlife female and male employees. Compared to normal-weight weight-maintaining women, overweight and obese women had a higher rate of SA due to musculoskeletal diseases. Also, weight gain and weight loss among women were associated with a higher rate. The associations were weaker among men and for musculoskeletal diseases only found among weight-gaining obese men. For SA due to mental disorders, there was an association among obese women and among weight-gaining overweight men.
Comparison to previous studies
Our study supports the findings from previous studies showing that obese employees are at an increased risk for SA [5, 6]. In previous studies the association among overweight employees has been inconsistent [5, 6]. In our study we found an association among overweight women, but only among the weight-gaining overweight men. It could be that some muscular men are falsely categorized as overweight, as BMI cannot distinguish between different types of tissues, even though the measure correlates with body fat.
As in previous studies, weight gain, especially among the women in our study, was also associated with SA [11–13]. In the additional sensitivity analysis, in which we examined weight change as a continuous variable stratified by BMI at phase 1, female weight gainers had a higher rate of SA due to any diagnosis among all BMI groups compared to weight maintainers. Among men, a higher rate of SA due to any diagnosis was found among weight-gaining overweight but not among normal-weight and obese weight-gaining participants. Weight loss was associated with increased SA, especially due to musculoskeletal diseases among women and mental disorders among men. This is different from a US study that found weight loss to be beneficial for absenteeism among obese employees [12], but is in line with previous European studies [11, 13], which have found an association between weight loss and SA.
There are very few studies on the association between BMI and SA due to different diagnoses. A Dutch study that started in 1993–1994 showed no association between BMI and SA due to respiratory and musculoskeletal complaints [14, 15]. However, the study population was small and limited to male welders, metal workers and office clerks from two companies. A Finnish study from 2014 found an association between BMI and SA due to musculoskeletal pain [16]. This study was also small scale (n=386) and included only female kitchen workers. In our study we found that obese women and men and overweight, weight-gaining and weight-losing women had a higher rate of SA spells due to musculoskeletal diseases. This is in line with the fact that obesity causes physical strain on the body and is associated with poor physical functioning [22] and various musculoskeletal diseases [7]. Adjusting for socioeconomic position and physical workload attenuated the associations. In our study both physical strenuousness of work and SA due to musculoskeletal diseases was more common among women than men. To prevent work disability, it could be useful to pay attention especially to overweight and weight-gaining employees within physically strenuous work.
In contrast, weight-gaining normal-weight male employees were less likely to have SA due to musculoskeletal diseases. Physical activity and musculoskeletal fitness [23] can protect from ill health, but the weight-gaining normal-weight men were not physically more or less active than all men. They were, however, younger (mean age 46 years vs all 48 years) and overrepresented especially in the youngest group of 40-year-old employees (34% vs all 22%). Compared to all men, they carried out physically strenuous work less often (9%) and were less often professionals (42%). Being younger and carrying out physically less strenuous work might associate with a lower risk of SA due to musculoskeletal diseases, whereas having a poorer socioeconomic position could associate with avoidance of SA due to economical reasons or fear of losing one’s job. The group of weight-gaining normal-weight men was small (n=102), and it is possible there has been a selection of healthy workers, or a selection of employees with musculoskeletal diseases in the weight-maintaining normal-weight reference group.
The association between BMI and mental health is less understood, even though it is well known that mental disorders are associated with BMI [8, 9]. It is hypothesized that inflammation and dysregulation of the hypothalamic-pituitary-adrenal axis might play a role in the association [24]. The association is complex and many factors, such as health behaviour, eating behaviour, psychological characteristics and stigmatization, relate to both obesity and mental ill health [23, 25, 26]. The association can also be influenced by psychotropic drugs, of which many are associated with weight change [27]. In our study in particular, weight-gaining obese women and men and weight-gaining overweight men showed an association with SA due to mental disorders. Adjusting for physical activity, which is beneficial for both mental health and weight control [23], attenuated the associations among men. Comorbidity is common and it is possible that cultural, age and time-related factors may affect which diagnosis is chosen as the cause of work disability.
Methodological considerations
The strengths of this study include longitudinal data based on a large cohort of both women and men representing hundreds of different occupations. The follow-up data enabled us to analyze both the effect of stable weight and weight change. The national register data on SA benefits provided reliable information on both the length and the number as well as the medically confirmed diagnoses for the SA spells. We also examined the number of SA days, but chose to focus on the number of spells, as long spells might unfavourably dominate in the SA day data. The main results were similar for SA due to musculoskeletal diseases; however, for SA due to mental disorders there were no associations among weight-gaining obese women and men, whereas an association was found among weight-gaining normal-weight women. The data enabled us to study the association from a diagnosis-specific perspective and thus deepen the understanding of the association. Furthermore, we were able to adjust for several sociodemographic, lifestyle and work-related covariates.
The limitations of this study include, first, that the data covered only midlife and ageing municipal Finnish employees. It is especially important to study work ability among ageing employees when aiming at extending work careers; however, the generalization of the results on younger and other populations is limited. Second, even though the survey response rate was acceptable and non-response analysis has shown that those consenting to the register linkage adequately represent the data [17], non-response and selection of healthy workers might be a problem. Third, women were in the majority and the statistical significance was weak for some male groups due to the smaller number of men (n=755). However, the gender distribution in these data is representative of the municipal sector in Finland. Fourth, even though we adjusted for prior SA, it is a problem that we could not distinguish between intended and unintended weight loss and that the weight-losing participants were few (women n=283, men n=88) and thus examined as one group. We did examine them separately according to baseline BMI in sensitivity analysis, and the associations were similar to the associations of all weight-losing participants. No group showed an inverse association with SA. Intended weight loss may reduce some risks, especially of metabolic and cardiovascular diseases [28, 29]; however, diseases such as cancer and depression, which associate with unintended weight loss, might bias the results. Finally, height, weight and covariates were based on self-reports. However, self-reported BMI in this cohort predicted SA as accurately as measured BMI [30].
Conclusions
Obesity was associated with SA due to musculoskeletal diseases among women and men, and with SA due to mental disorders among women. In addition, weight gain among women was associated with SA due to musculoskeletal diseases and among overweight men with SA due to mental disorders. Paying attention to preventing obesity in occupational health likely helps prevent SA in general and SA due to musculoskeletal and mental diagnoses. In addition, early-stage prevention of overweight and weight gain among women likely helps prevent SA due to musculoskeletal diseases.
Footnotes
Acknowledgements
We thank the City of Helsinki and all the participating employees.
Authors’ contributions
AS performed statistical analyses, interpreted the results and drafted the manuscript. All authors contributed to designing the study, critically reviewed the manuscript and approved the final version.
Availability of data and materials
The questionnaire data are available on request. Permission can be requested from HHS and from the register-holding authorities by first contacting data management of the HHS (
Consent to participate
The participants gave written informed consent to participate in the study.
Conflict of interest
The authors declare no conflict of interest.
Ethical approval
The ethics committees of the Department of Public Health, the University of Helsinki and the health authorities of the City of Helsinki approved the HHS protocol. The ethical approval applies to the current study.
Funding
The HHS was funded by the Academy of Finland (grant #1294514), the Ministry of Education and Culture, the Finnish Work Environment Fund (grant #112231), the Juho Vainio Foudation and the University of Helsinki. AS was supported by Finska Läkaresällskapet. JL was supported by the Academy of Finland (Grant #1294566). MM was supported by the Finnish Work Environment Fund (grant #115182) and the Juho Vainio Foundation. EL was supported by the Academy of Finland (grant #1257362). TL was supported by the Academy of Finland (grant #287488 and #294096).