
Abstract
Background
Genetic frontotemporal dementia (FTD) along with Alzheimer's disease (AD), is one of the most prevalent early-onset dementias. The differential diagnosis of FTD from primary psychiatric disorder (PPD) has been challenging due to significant symptom overlap, particular as FTD often presents with prolonged psychiatric prodromes.
Objective
This study aims to evaluate whether blood-based neurofilament light chain (NfL) can differentiate genetic FTD from PPD, and to determine a global clinical cutoff to differentiate genetic FTD carriers from PPD with high specificity and sensitivity.
Methods
Data (ages 40–81) were obtained from FTD mutation carriers (GENFI; n = 474; n = 120 C9orf72, n = 114 GRN, n = 50 MAPT, n = 190 controls), and PPD (Biobanque Signature; n = 848). Blood-based NfL was measured with SIMOA HD-X (BbS) and SIMOA HD-1 (GENFI).
Results
Blood-based NfL was higher in all symptomatic mutations compared to PPD. Mildly symptomatic (0 < FTLD CDR-SOB-NM < 4) C9orf72 and GRN carriers also had higher NfL. ROC curve revealed an optimal blood-based NfL cutoff of 22.1 pg/mL (J = 0.647) to distinguish symptomatic genetic FTD from PPD (78.5% sensitivity, 86.2% specificity, AUC = 0.908). For mildly symptomatic subjects, a cutoff of 16.2 pg/mL (J = 0.601) differentiated groups with 86.7% sensitivity and 73.5% specificity (AUC = 0.870).
Conclusions
NfL holds potential as a blood-based biomarker for symptomatic genetic FTD carriers, with moderate accuracy to distinguish PPD from mild forms including C9orf72.
Introduction
Genetic frontotemporal dementia (FTD) has heterogenous clinical presentations for each of the common causal mutations: repeat expansion in chromosome 9 open reading frame 72 (C9orf72), mutations in progranulin (GRN) and microtubule-associated protein tau (MAPT). 1 The most common presentation is the behavioral variant of FTD (bvFTD) which is challenging to identify clinically in the early stages due to the nature of behavioral symptoms at onset which strongly overlap those of primary psychiatric disorders (PPD). 2 Further, these patients (in particular C9orf72 and GRN carriers) can have protracted psychiatric prodromes before exhibiting more specific FTD features, exacerbating diagnostic confusion.3,4 There is a need for a simple biomarker that could differentiate PPD from early stage FTD in order to direct patients toward relevant genetic testing and appropriate care.
Neurofilament light chain (NfL) is a structural axonal protein that is released from physiologic turnover and neuronal damage.5,6 NfL increases sharply in patients with neurodegenerative diseases. It also increases slowly with age, with a more pronounced increase after the ages of 60–70.6–8 However, unlike bvFTD, PPD is not associated with overt neuronal damage.9–11 Therefore, blood-based (serum and plasma) NfL is emerging as a candidate biomarker to differentiate bvFTD (high levels) from PPD (normal to mildly elevated levels).9,12,13 In the study with the largest sample size so far, we previously reported that PPD can be distinguished from bvFTD (primarily sporadic) with serum NfL cutoffs of 17.0 pg/mL with good accuracy (82.9% sensitivity, 76.1% specificity, AUC = 0.847). 14 However, there is currently a lack of studies investigating the use of blood-based NfL as a biomarker to differentiate various disease stages of genetic FTD from PPD. 15 In particular, it is crucial to determine if blood- NfL can differentiate prodromal forms of FTD due to C9orf72, which often presents with marked psychiatric symptoms, including psychosis. 4
Recent findings have shown that carriers of all three mutation groups have increased blood-based NfL after symptom onset, but with differences in the genotype-based pattern of NfL elevation.16,17 In C9orf72, blood-based NfL levels slowly and steadily rise over noncarrier controls early on, around 30 years before symptom onset, and remained elevated throughout the presymptomatic period. In GRN, blood-based NfL levels start to rise over controls 15 years before symptom onset and continue rising, with fastest elevation during late presymptomatic stages, near symptom onset. In MAPT, however, blood-based NfL levels were not elevated during the presymptomatic stages and only started to rise at symptom onset, remaining significantly increased throughout the symptomatic phase of disease.
The overarching goals of this study are to evaluate blood-based (serum and plasma) NfL as a biomarker to differentiate PPD from symptomatic and prodromal genetic FTD in C9orf72, GRN, and MAPT mutation carrier and to identify the best potential cutoff for this purpose. We hypothesize that 1) in symptomatic FTD genetic mutation carriers, plasma NfL will be higher than serum NfL in PPD; 2a) in comparison to serum NfL levels in PPD, higher plasma NfL levels will be found in late presymptomatic and mildly symptomatic genetic mutation carriers within ten years of estimated onset 2b) that this effect would be strongest in late presymptomatic C9orf72 mutation carriers; 3) in noncarrier controls, plasma NfL will be similar to PPD; 4) global clinical cutoffs will be able to differentiate genetic FTD mutation carriers from PPD with high specificity and sensitivity.
Methods
Participants: Genetic Frontotemporal Initiative (GENFI)
Participant data (n = 1130) was acquired from Genetic Frontotemporal Initiative 1 (GENFI1) and Genetic Frontotemporal Initiative 2 (GENFI2) (combined in data freeze six). The subjects of the study were confirmed symptomatic FTD with a genetic mutation in C9orf72, GRN, or MAPT and their at-risk presymptomatic first-degree relatives. 18 The first-degree relatives were further subdivided into healthy noncarriers (n = 190), serving as controls and late presymptomatic mutation carriers. 18 Participants underwent annual comprehensive assessment including neurological and neuropsychological examinations, blood collection, and brain imaging. 18 Only participants aged 40 or older were included, as this is the typical age of FTD onset and to match the psychiatric cohort. The symptomatic genetic mutation carriers were identified clinically and classified by expert clinicians into their respective diagnoses according to previously established diagnostic criteria for FTD subtypes.18–20 The score used to estimate disease severity in this study was the FTLD-CDR-SOB-NM, which is the Sum of Boxes (SOB) of the FTLD modules plus the algorithm derived neuropsychiatric (N) scores, which uses the same scoring system as the Clinical Dementia Rating scale (CDR), but also factor in visual hallucinations, auditory hallucination, and delusions. 21 It also includes a clinical judgment motor score (M) to capture the full picture of prodromal FTD stages. 22 In our study, the late presymptomatic group comprised patients who were clinically asymptomatic at the time of measurement but were within 10 years or less of their estimated years of onset (EYO). The estimated years of onset for late presymptomatic genetic FTD carriers was based on the mean age of onset of the participant's family. 23 The same classification was used for all mutations. The mildly symptomatic group for our study were the identified symptomatic mutation carriers classified as having a FTLD-CDR-SOB-NM score greater than 0 and less than 4 (approximately equivalent to a global score of 0.5). Only symptomatic, late presymptomatic (EYO ≥ −10), and mildly symptomatic genetic FTD carriers with at least one plasma NfL measurement were included, giving a total of 284 GENFI genetic FTD mutation carriers (120 C9orf72, 114 GRN, and 50 MAPT carriers) and 190 GENFI noncarrier controls. For each participant we used the latest visit at which a plasma NfL measurement was available and coinciding clinical data.
Each research center in the GENFI study received approval from their local ethics committees prior to the start of the review. 18 Moreover, all participants provided written informed consent per the Declaration of Helsinki prior to enrolment in the study. 18 This project was approved by the McGill University Health Center's Research Ethics Board.
Participants: Banque Signature (BbS)
Data from subjects with primary psychiatric disorders (PPD) aged 40–81, were obtained from the Banque Signature (BbS) of the Institut Universitaire en Santé Mentale de Montréal (IUSMM). 24 Subjects from the psychiatric emergency department of the IUSMM had biospecimen samples collected in the morning after an overnight fast by trained research nurses.24,25 Psychiatric disorders were established clinically by treating psychiatrists at longitudinal follow-up based on clinical criteria. 24 The patient diagnoses were coded following the World Health International Classification of Disease (ICD-10). 25 Consistent with the literature, psychiatric disorder comorbidity was common, with some patients receiving up to four different diagnoses. 24 For this study, the patients were categorized based on their primary psychiatric disorder diagnosis, consisting of substance use (n = 61), psychosis (n = 268), mood (n = 285), anxiety (n = 142), personality (n = 78), and other psychiatric disorders (n = 14), which included symptomatic participants who did not fit into the other diagnostic categories. All participants signed an informed consent form and the Banque Signature received approval from the local scientific evaluation and research ethics committees of the Louis-H. Lafontain Hospital (renamed in March 2013 as CER-CEMTL) following the Declaration of Helsinki. 24
The BbS participants who were healthy controls or with no identified psychiatric disorder at follow-up were not included in the analyses (n = 70). Exclusion criteria also included participants that had a neurocognitive disorder or delirium in their primary or secondary diagnosis (n = 10); and participants with advanced kidney disease (a factor known to significantly increase NfL -n = 13). Moreover, PPD patients missing a serum NfL measurement were excluded (n = 2), giving a total of 848 BbS subjects for analyses.
Serum NfL quantification (BbS)
Serum samples from BbS were collected and sent on a refrigerated block (4°C) to the VUMC location of the Neurochemistry Lab at AUMC (Head: Teunissen) for further analysis which occurred within 2 h of reception, with no freeze-thaw cycles required. Established Standard Operating Procedures (SOPs) and Good Clinical Practice (GCP) guidelines were adhered when transporting bio samples. At a single site, serum samples from BbS were measured following the manufacturer's instructions for their levels of NfL using a 4-plex NfL assay with the single molecule array (Simoa) technique and the SIMOA HD-X Analyzer (Quanterix, Billerica, MA, USA). The BbS study period in which the samples were collected ran from December 2012 to March 2020. The consistency between different assays was assessed using three internal quality control samples with concentrations of 111.6, 26.4, and 11.8 pg/mL, in which the values matched those observed in previous AUMC FTD sample analyses. All serum NfL levels were reported as mean ± standard deviation (SD) in pg/mL.
Plasma NfL quantification (GENFI2)
Plasma samples from GENFI were collected, processed, and stored at −80 °C following standard procedures within 24 h of collection. 26 For measurements, the samples were thawed at room temperature for 2 h then centrifuged for 5 min, with no more than one freeze-thaw cycle. The resulting samples were aliquoted into 150 µL, plated into 96-well plates, and frozen at −80°C until analysis. Measurements were done at a single site using the SIMOA HD-1 Analyzer (UCL, London) and a 1-plex NfL assay was conducted. The majority of sNFL data was analyzed in a single batch. However, some additional data was incorporate through two subsequent analyses likely conducted across three timepoints between 2019 and 2022. The total GENFI study period in which data was collected was from 2012 to 2022. Quality control samples showed an intra-assay and inter-assay coefficient of variation with a mean value of 4.3%. All the plasma NfL values were displayed as mean ± standard deviation (SD) in pg/mL
Although plasma NfL values were obtained from GENFI and serum NfL from BbS, previous studies reported the two to be comparable, allowing for their comparison in our analyses.27,28 The 4-plex NfL assay used in BbS and the 1-plex NfL assay used in GENFI have been shown to have strong positive and linear relationships between the two assays (correlation coefficients > 0.95). However, internal data showed 1.1- to 1.4-fold higher NfL concentrations by 4-plex compared with 1-plex. Therefore, a sensitivity analysis factorizing the 1-plex GENFI concentrations with 1.25 (mean between 1.1 and 1.4) was conducted on all main analyses to compare with the results obtained using the uncorrected pooled data.
Statistical analyses
Statistical analyses were done using IBM SPSS Statistics V.29.0.0.0. The significance level was set at an α = 0.05 (2-tailed).
The statistical assumptions were verified prior to running analyses. The distribution of plasma NfL data from GENFI and serum NfL from PPD participants was log-transformed to normalize the data. Assumptions of the homogeneity of variance of all samples were tested using Levene's Test for Equality of Variances. Although Levene's test was violated for homoscedasticity in log blood-based NfL levels between genetic FTD and PPD groups, in accordance with the central limit theorem, the general linear models (GLM) used in this study were robust against these violations due to the large GENFI (n = 269) and PPD (n = 848) sample sizes. 29
Previous studies reported that blood-based NfL levels increase with age.6,30–32 Furthermore, there has been conflicting findings in literature regarding sex differences in blood-based NfL, with some studies finding no distinctions and others reported a difference.33–36 Therefore, to assess the effects of these variables on blood-based NfL, first we conducted a bivariate Pearson's correlation test to determine the association between blood-based NfL level and age of our entire cohort (comprising FTD and PPD participants). Second, we conducted an independent sample t-test between all males and female participants of the study (FTD and PPD combined) to determine potential sex differences in blood-based NfL levels within our cohort.
To investigate whether blood-based log NfL levels differed in symptomatic, late presymptomatic, and the subgroup of mildly symptomatic genetic FTD C9orf72, GRN, and MAPT carriers as well as noncarriers controls, in comparison to individuals with PPD, we conducted general linear models. In these analyses age was included as a covariate as we reported a positive correlation between age and blood-based NfL (r = 0.346, p < 0.001). In addition, although our analyses did not reveal a difference in blood-based NfL levels between males and females, we included sex as a covariate due to mixed results reported in previous studies.33–36 Consequently, in accordance with established guidelines for sex and gender equity in research, the interaction between sex and group was entered in all analyses and are reported in results.
37
We used partial eta squared (
As a follow-up, Receiver Operating Characteristic (ROC) curve analyses were performed using our raw blood-based NfL values to establish the best global blood-based NfL cutoff for distinguishing symptomatic genetic FTD from PPD, late presymptomatic genetic carriers from PPD, mildly symptomatic genetic FTD carriers from PPD, and controls from PPD. The optical cutoff was estimated with the Youden's index (J = sensitivity + specificity −1) when J > 0.5 and with the area under the curve (AUC). We also tested the precision of previously established clinical blood-based NfL cutoff of 17.0 pg/mL for all ages (40+) in differentiating symptomatic FTD from PPD was evaluated based on its accuracy, sensitivity, and specificity. 14 According to the previously established cutoff, raw blood-based NfL values were used to determine the percentage of true positives and false negatives to accurately classify symptomatic FTD versus PPD.
Results
Demographic and clinical characteristics
The demographic and clinical characteristics as well as the blood-based NfL values of the selected participants of the study are seen in Table 1. Unless stated otherwise, we reported results as mean ± standard deviation (SD).
Descriptive statistics of GENFI and BbS cohort.
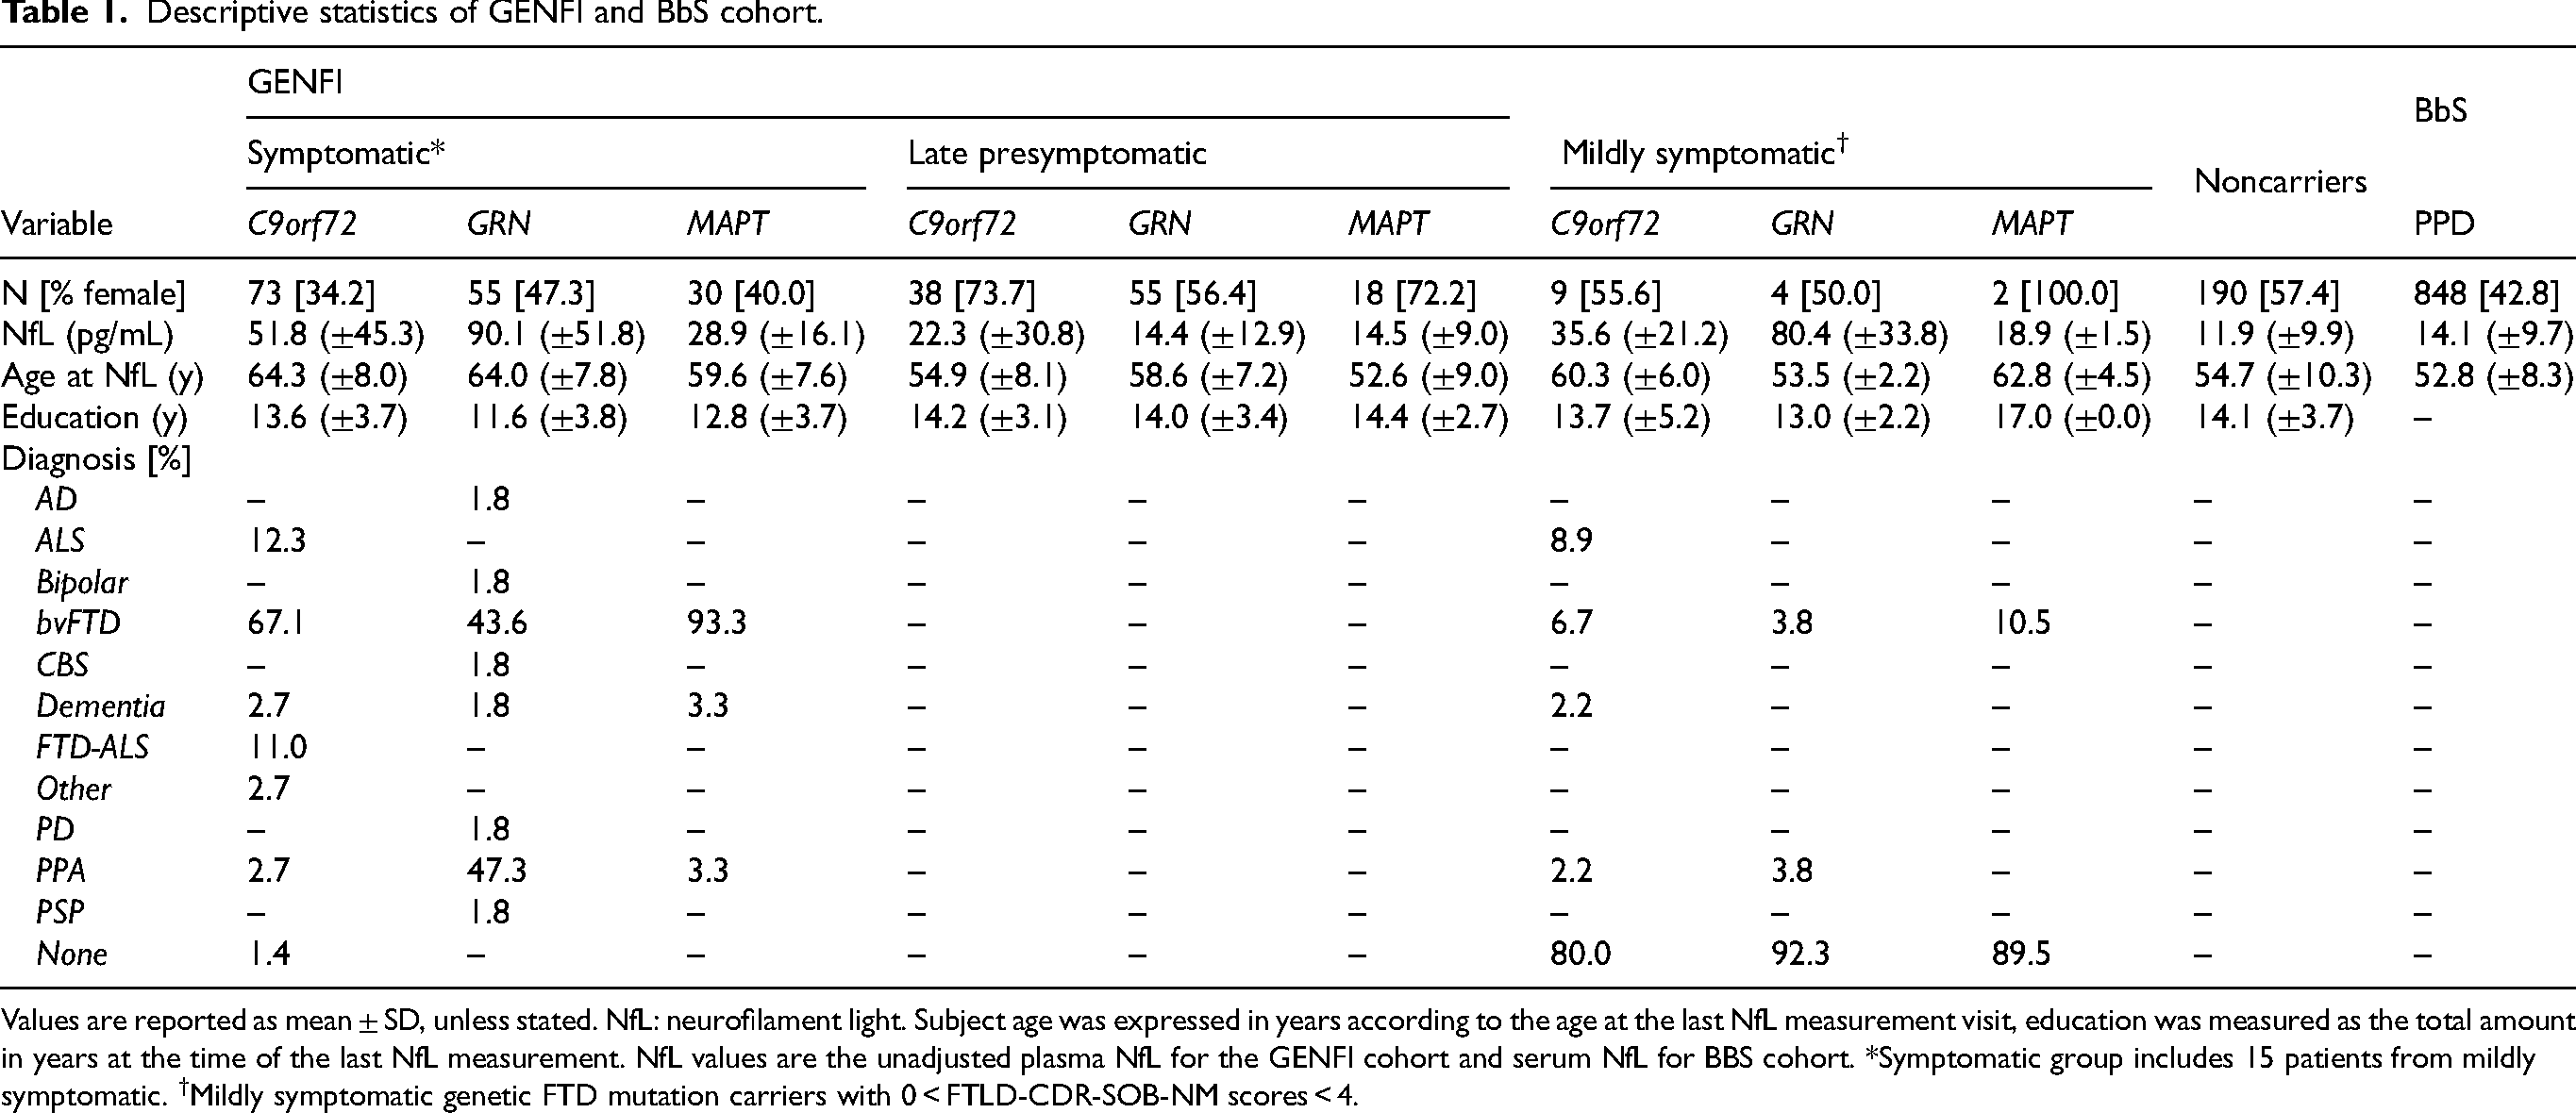
Values are reported as mean ± SD, unless stated. NfL: neurofilament light. Subject age was expressed in years according to the age at the last NfL measurement visit, education was measured as the total amount in years at the time of the last NfL measurement. NfL values are the unadjusted plasma NfL for the GENFI cohort and serum NfL for BBS cohort. *Symptomatic group includes 15 patients from mildly symptomatic. †Mildly symptomatic genetic FTD mutation carriers with 0 < FTLD-CDR-SOB-NM scores < 4.
GLM univariate analyses of variance in NfL levels of symptomatic, late presymptomatic, mildly symptomatic genetic FTD carriers and noncarrier controls compared to PPD.
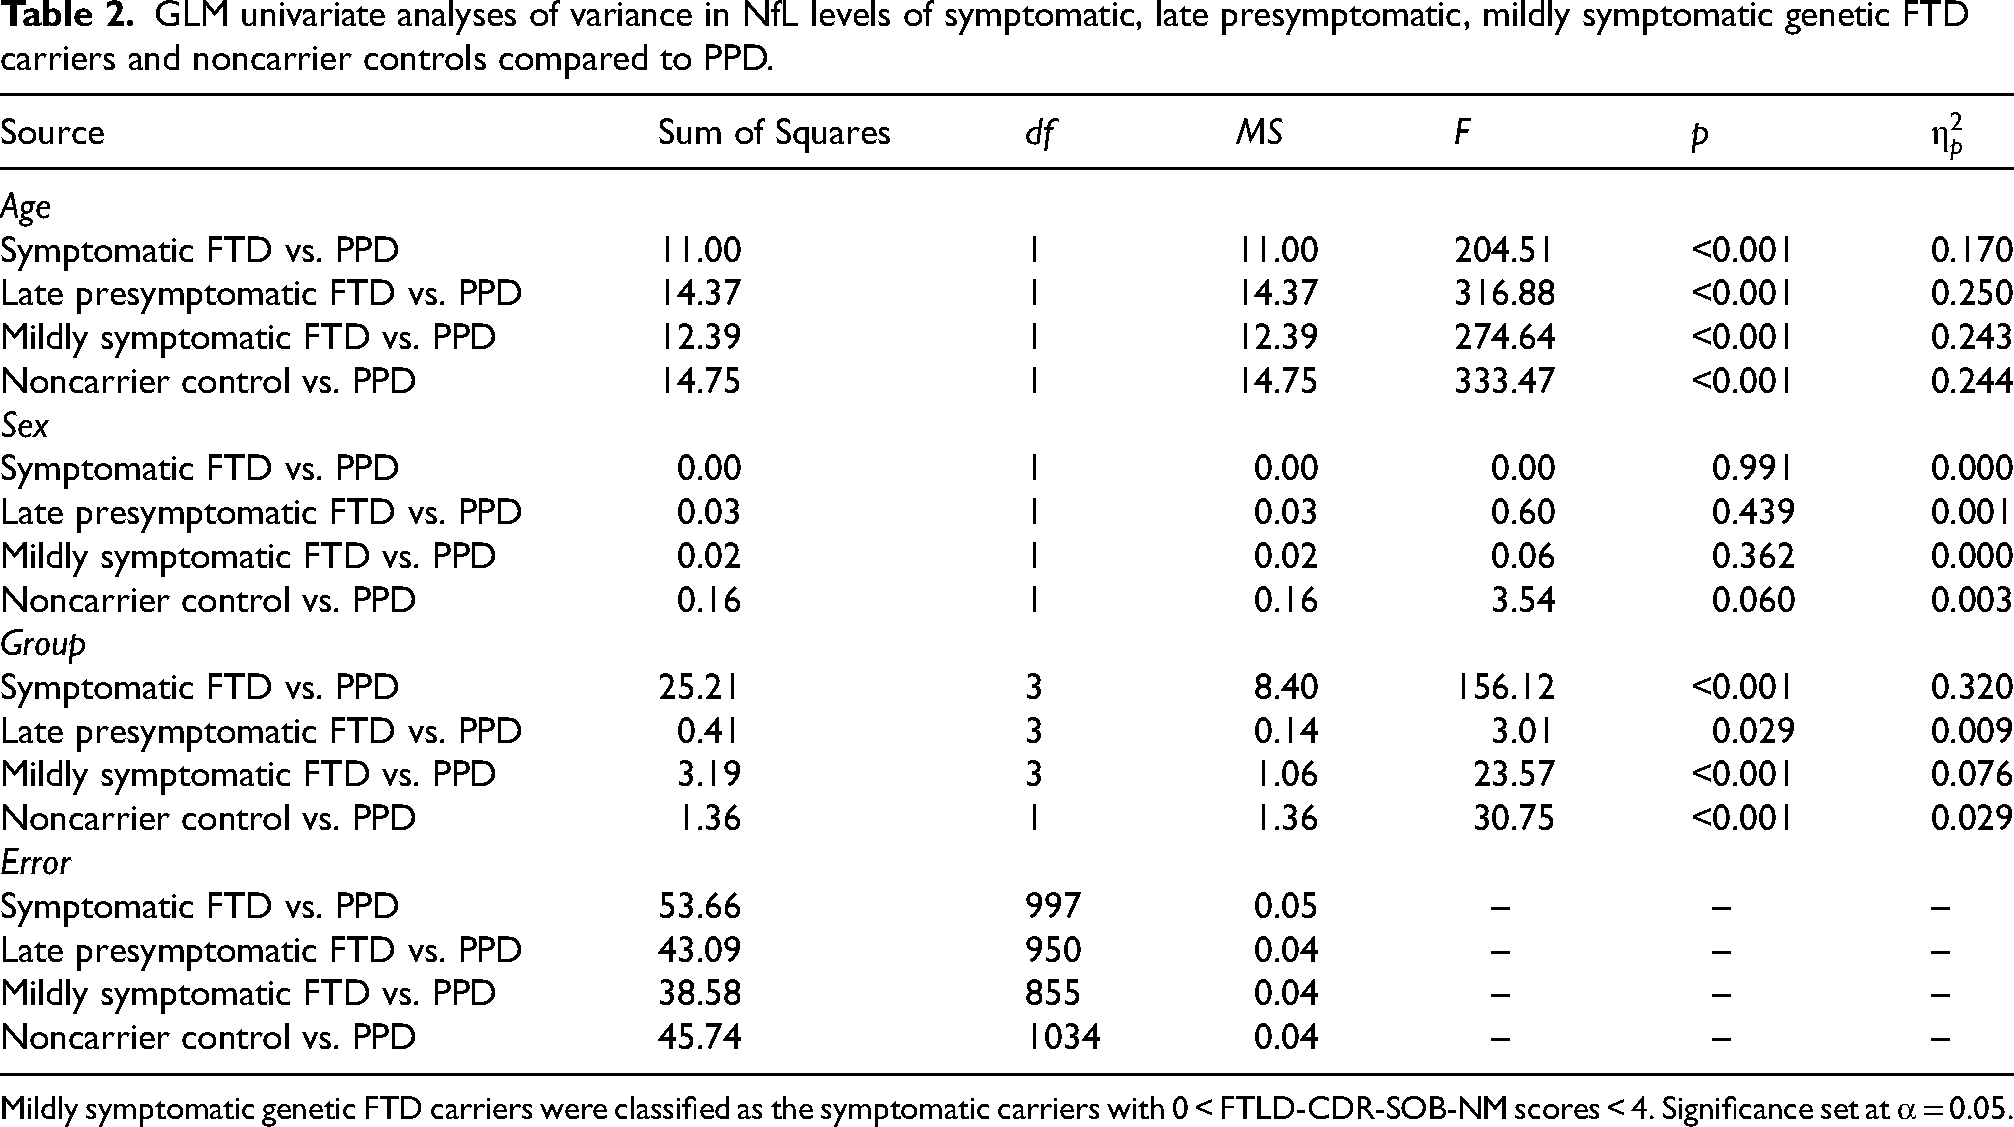
Mildly symptomatic genetic FTD carriers were classified as the symptomatic carriers with 0 < FTLD-CDR-SOB-NM scores < 4. Significance set at α = 0.05.
As shown in Table 2, the blood-based NfL levels of all patients (FTD and PPD combined) showed a positive moderate correlation with age (r = 0.346, p < 0.001). Furthermore, the analysis revealed no differences in NfL levels all male and female participants of this study (FTD and PPD combined), F (1305) = 0.005 (p = 0.946).
Blood-based log NfL in symptomatic genetic FTD carriers compared to PPD
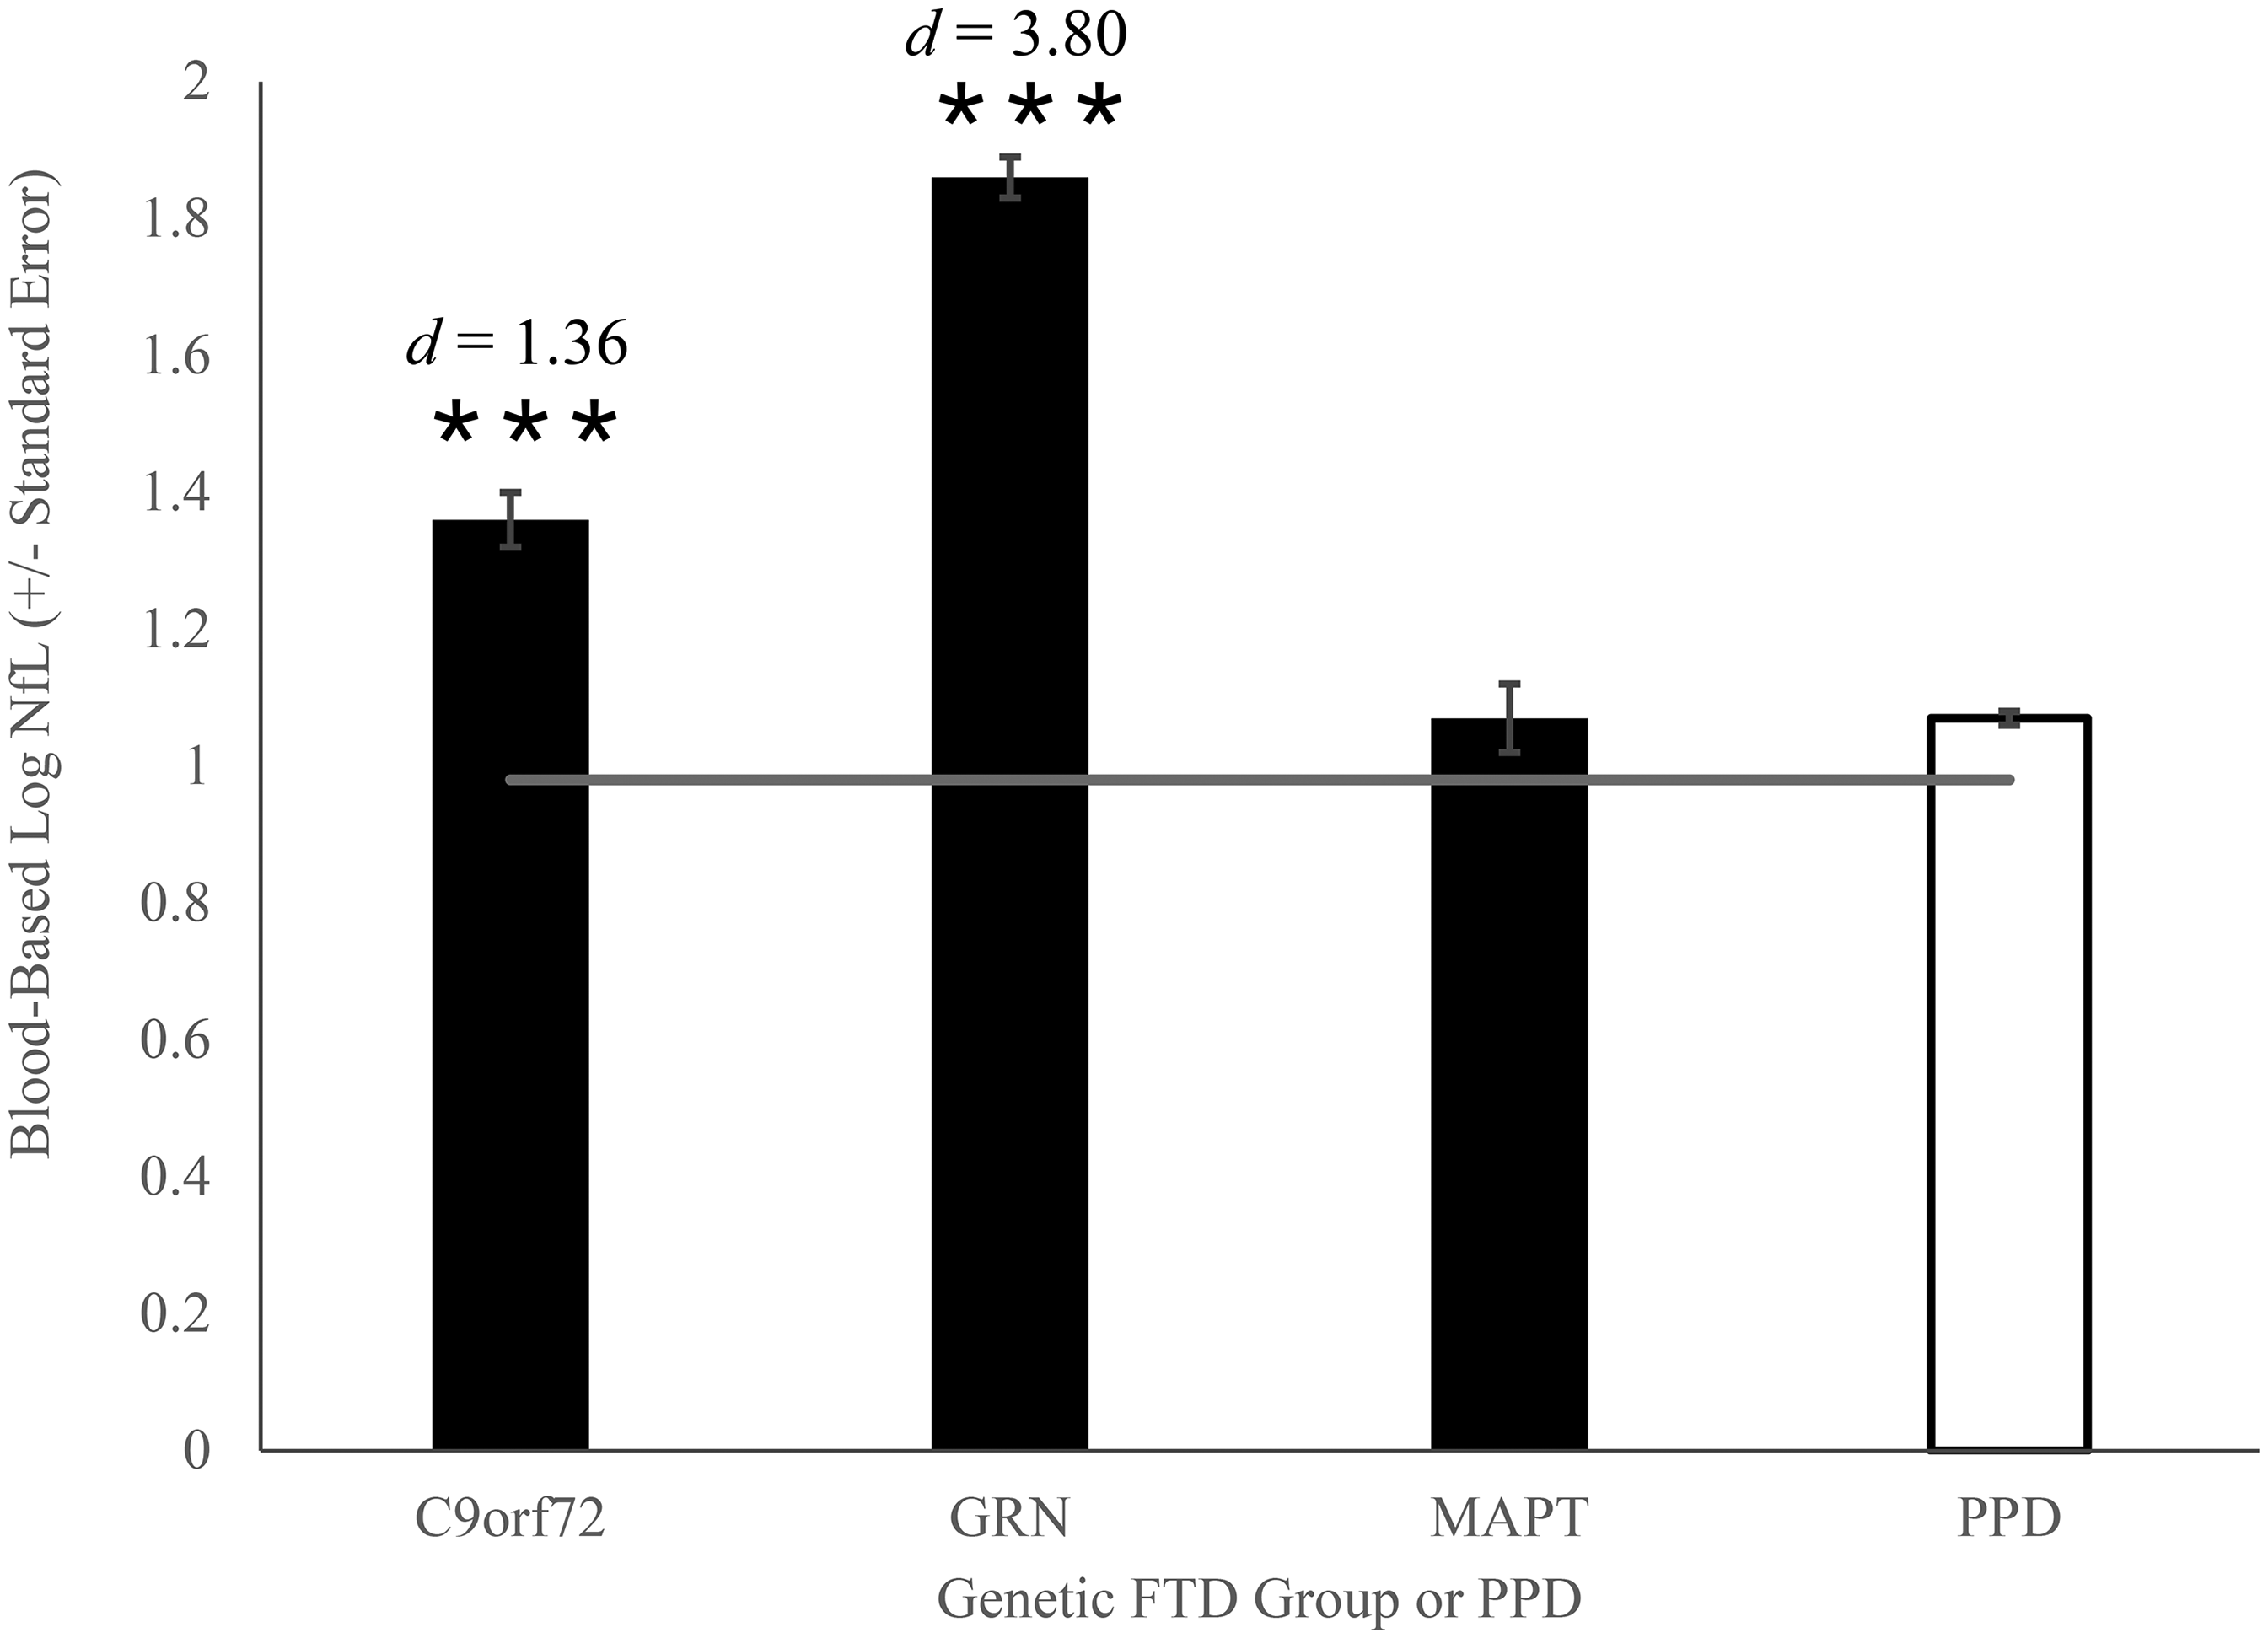
The analysis revealed a significant main effect of the group on blood-based log NfL levels, F (3, 997) = 156.12 (p < 0.001,
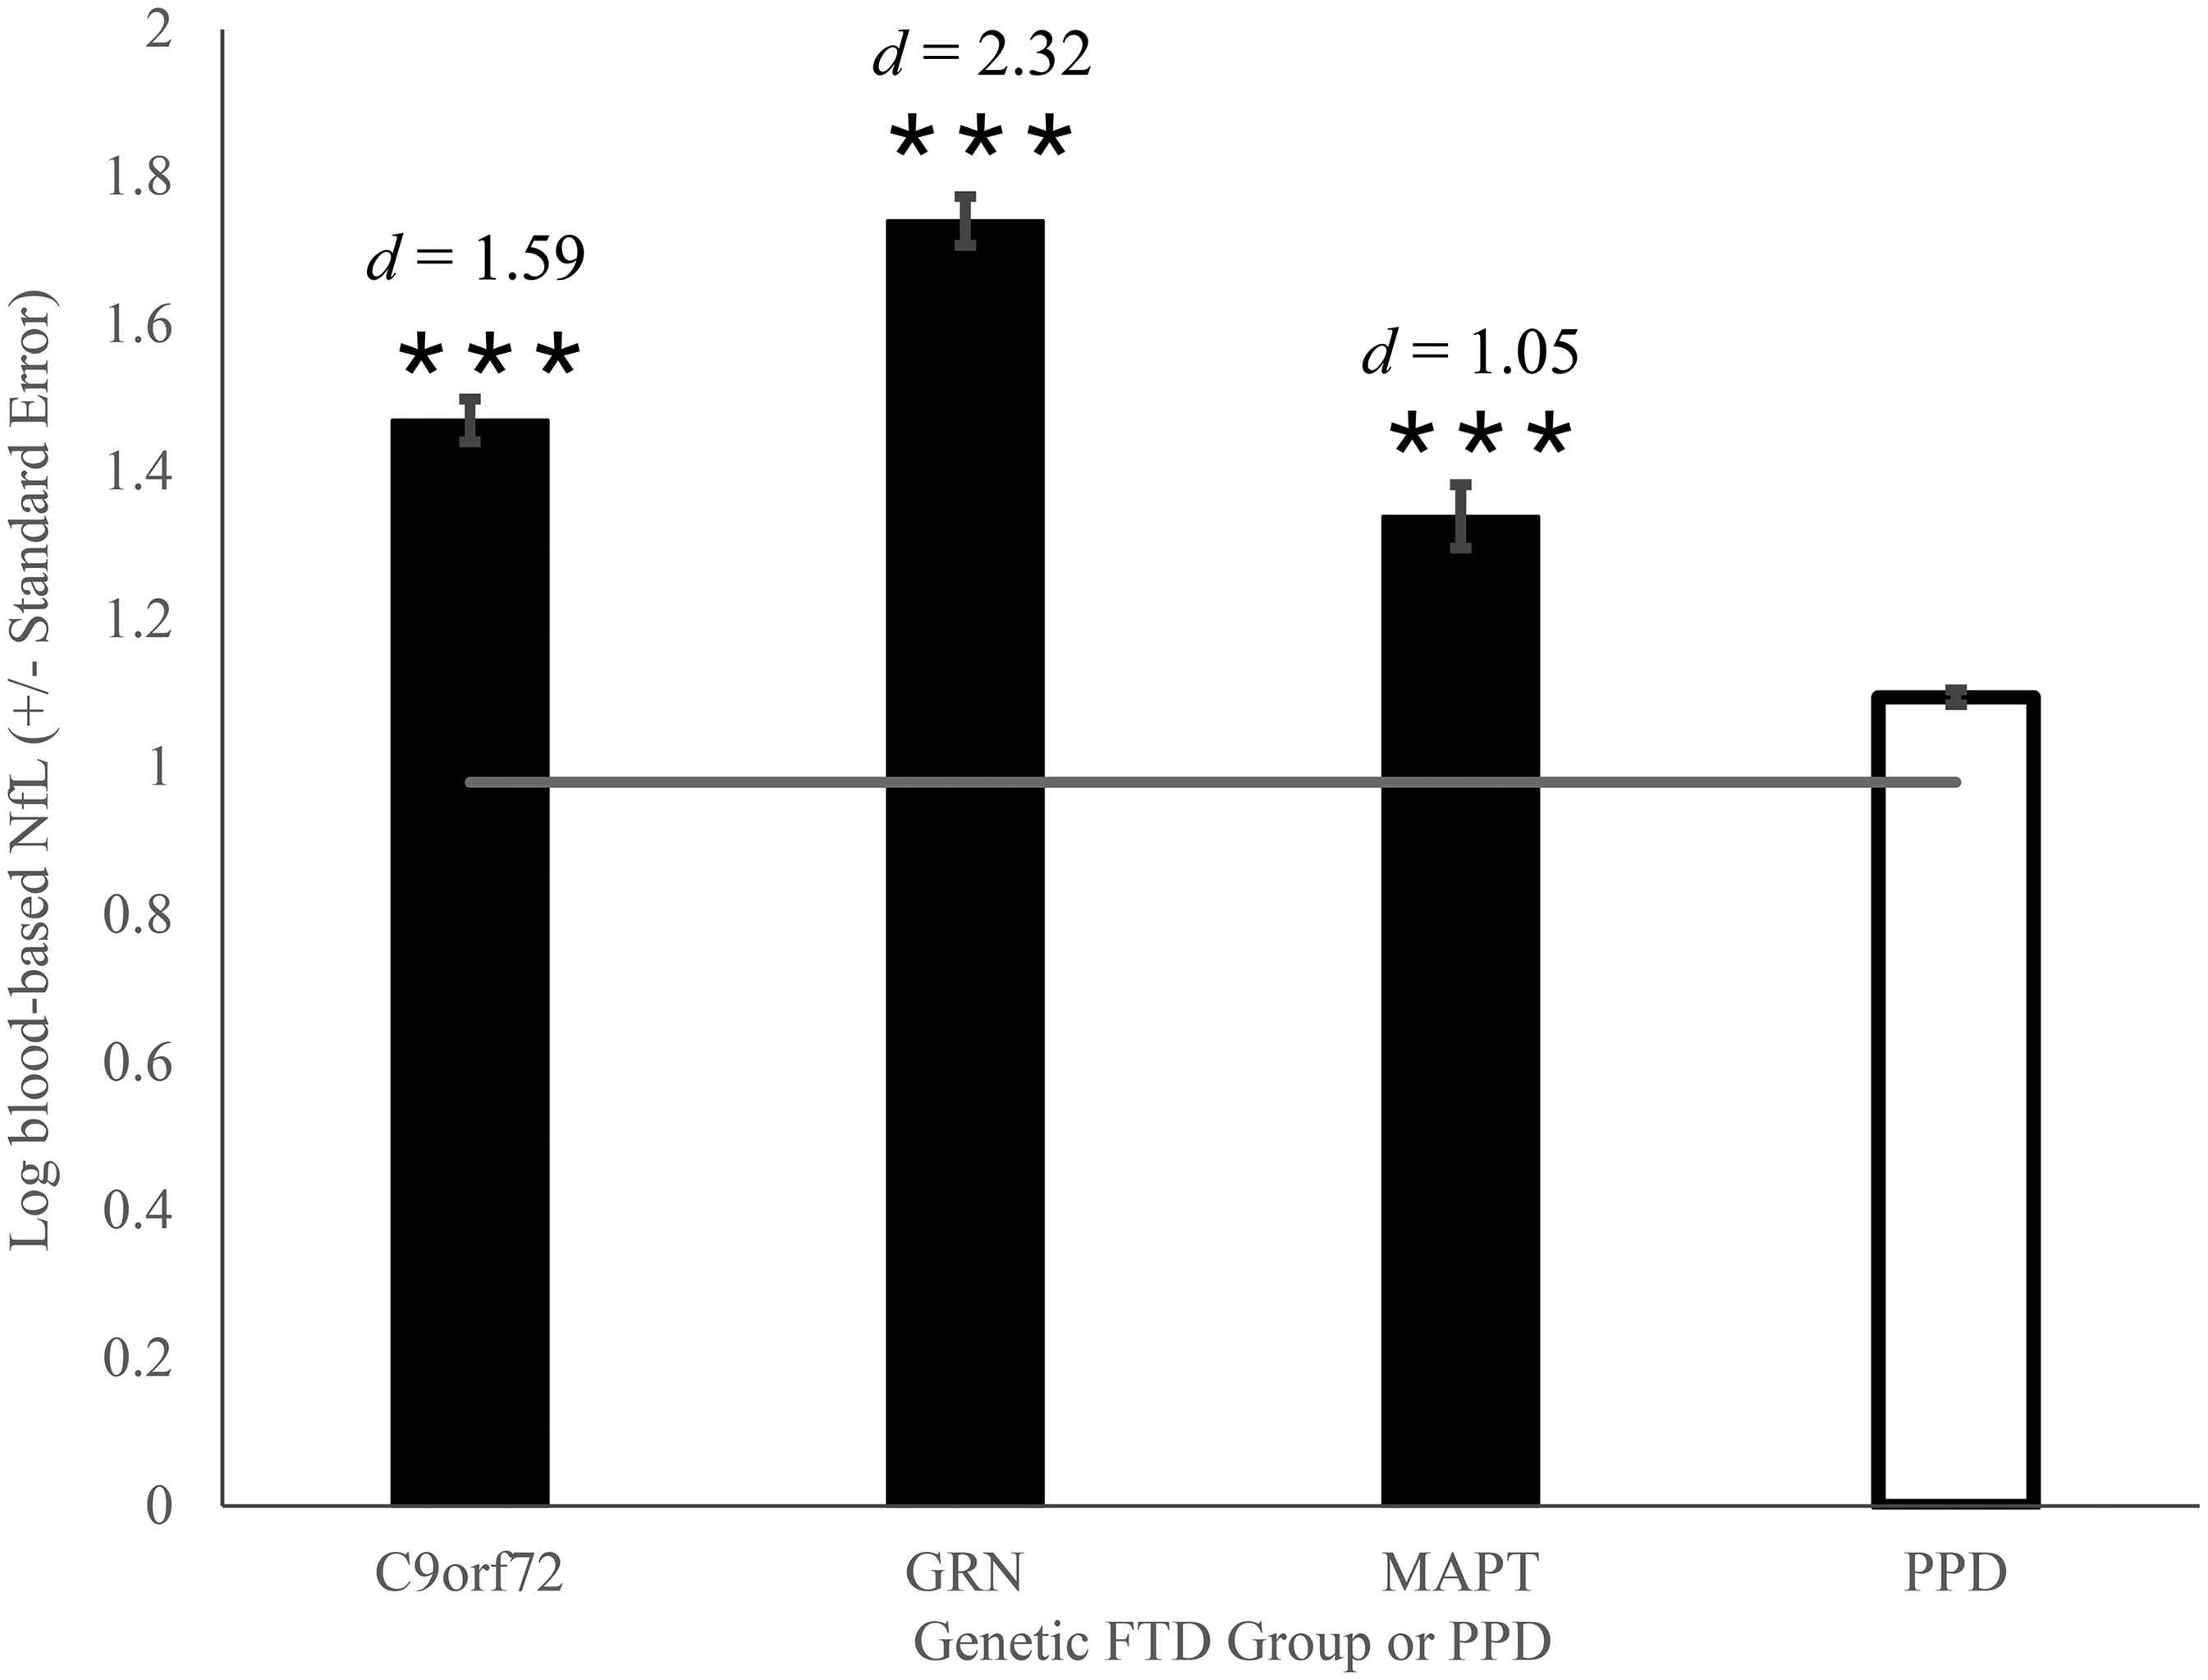
Blood-based Log NfL levels in symptomatic genetic FTD carriers and PPD. Mean plasma log NfL in symptomatic GENFI C9orf72, GRN, and MAPT mutation carriers compared to mean serum log NfL in BbS PPD patients. Horizontal line represents the benchmark mean plasma log NfL in GENFI noncarrier controls. ***p < 0.001 compared to BbS PPD patients.
Blood-based log NfL in late presymptomatic genetic FTD carriers compared to PPD
The analysis found an overall significant main effect of group on adjusted blood-based log NfL means, F (3, 950) = 3.01 (p = 0.029,
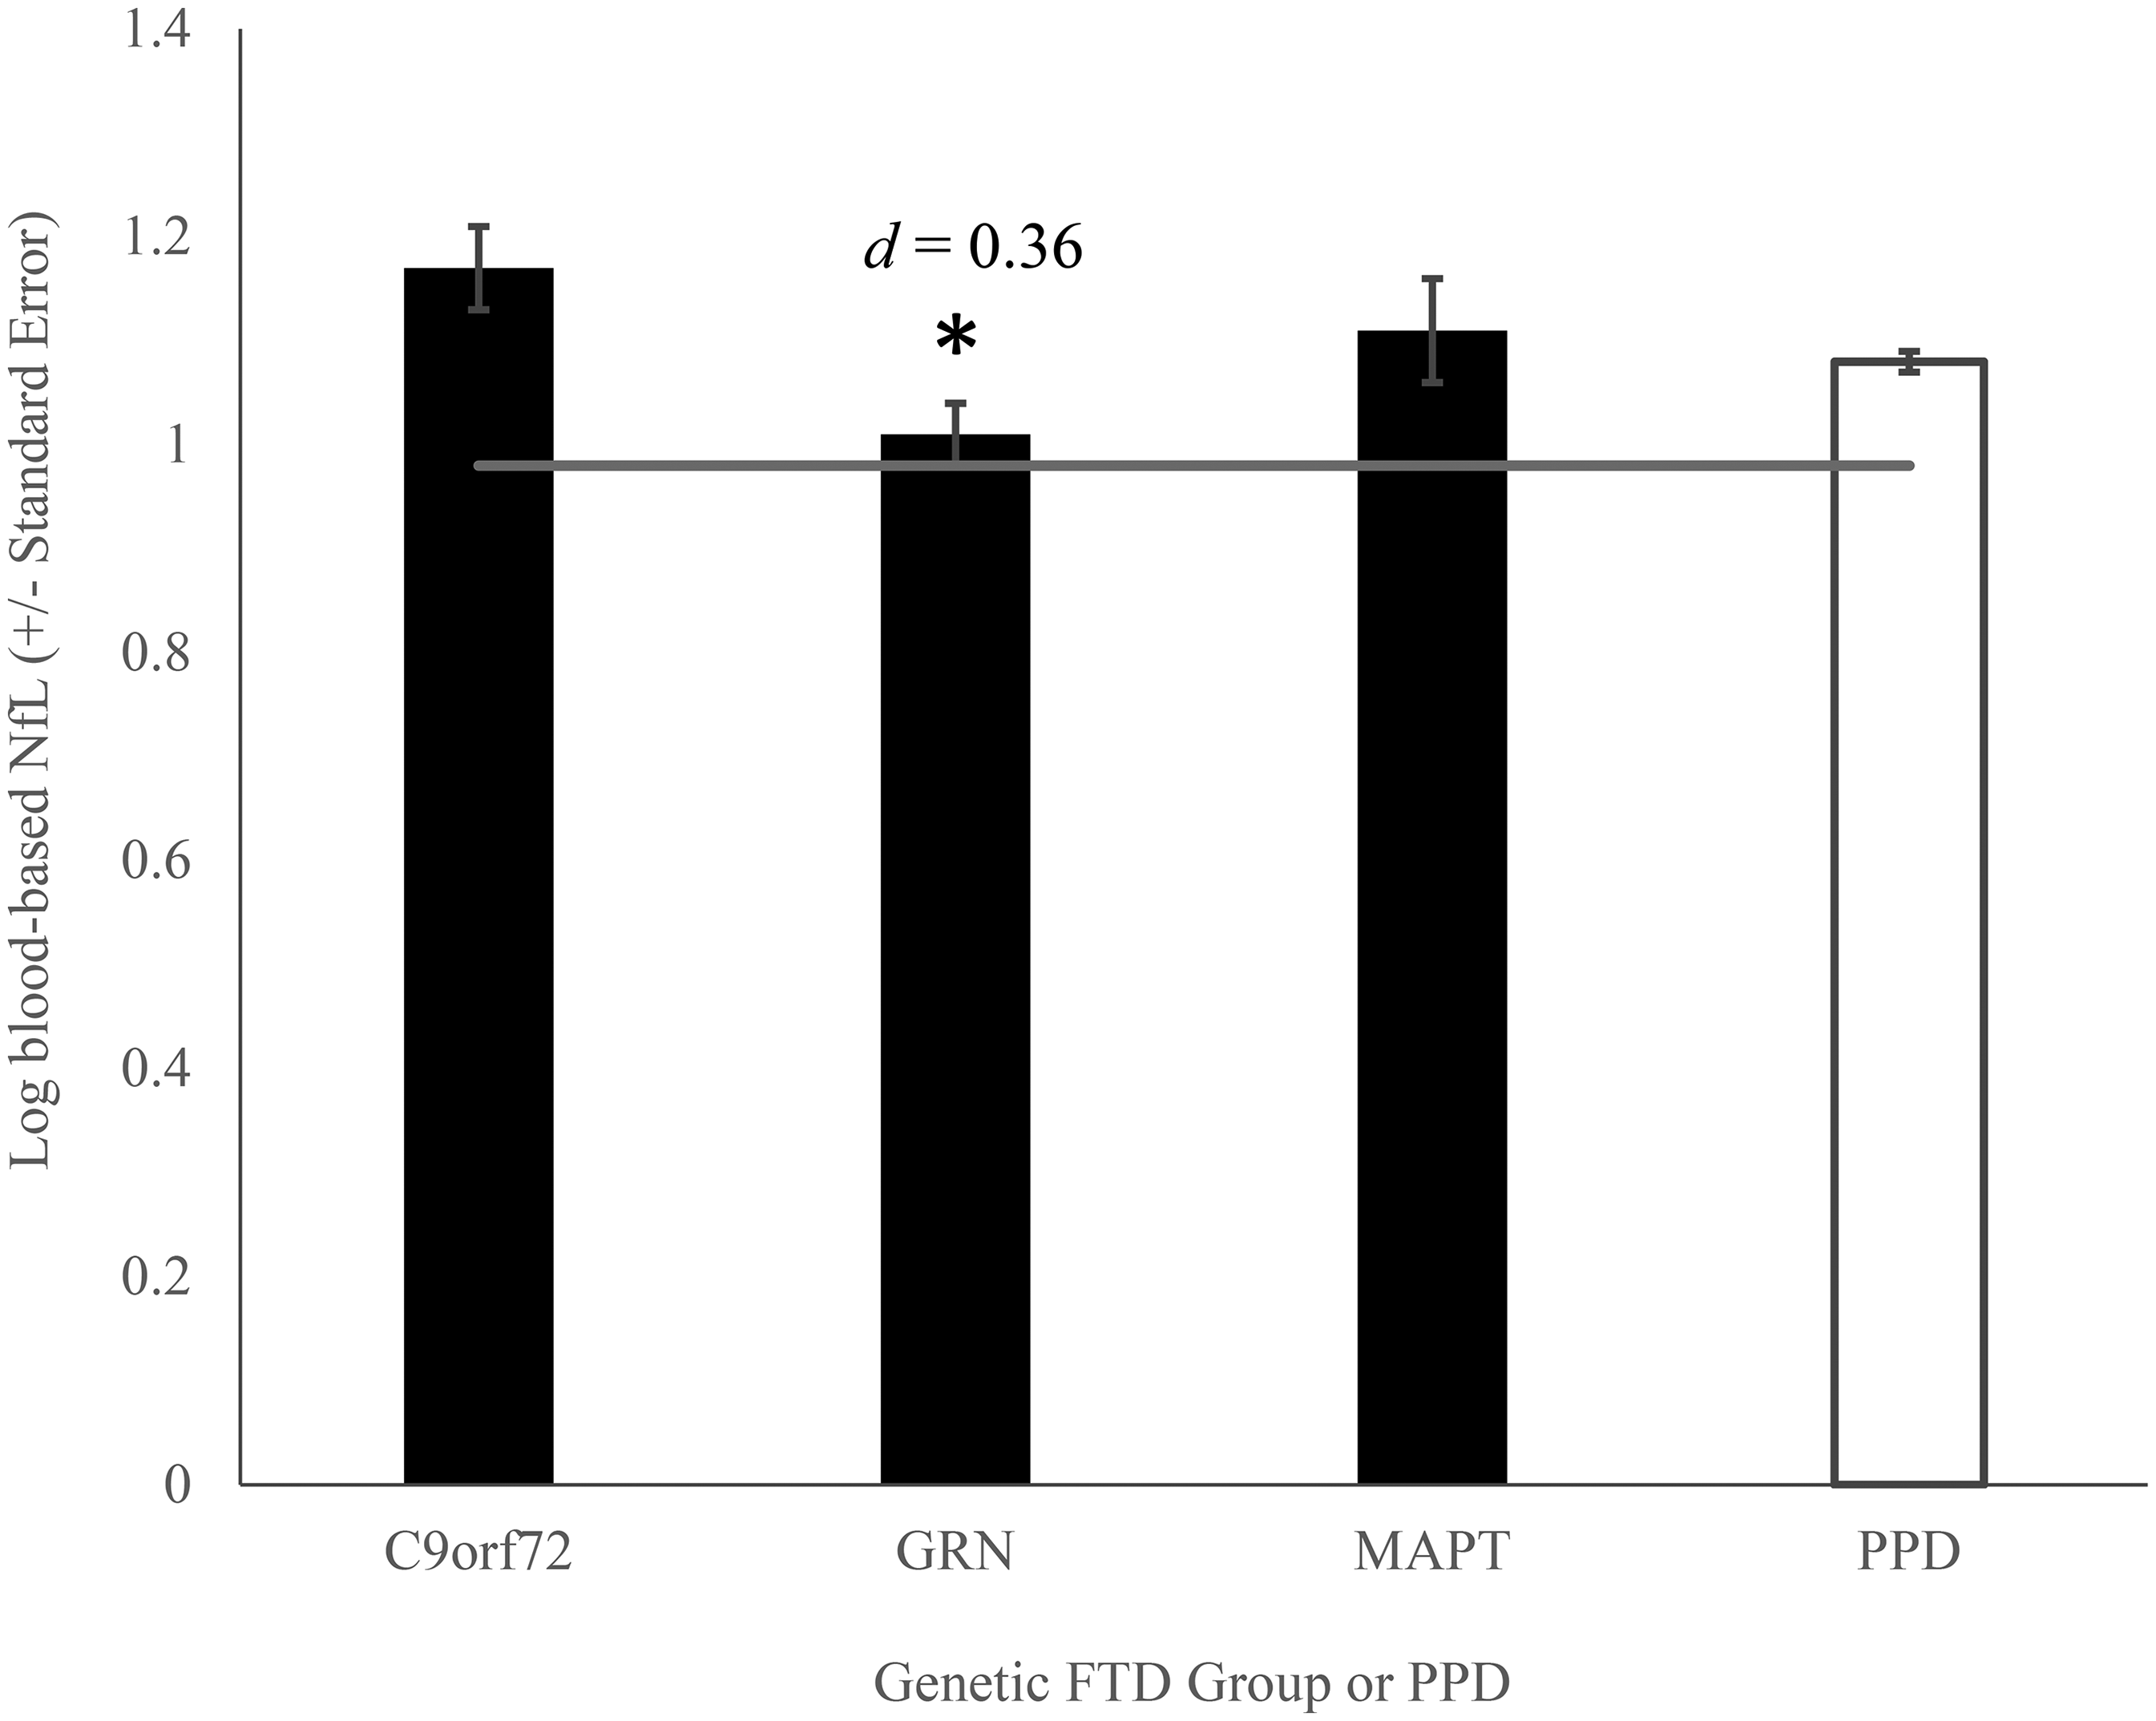
Blood-based Log NfL levels in late presymptomatic genetic FTD carriers and PPD. Mean plasma log NfL in late presymptomatic GENFI C9orf72, GRN, and MAPT mutation carriers compared to mean serum log NfL in BbS PPD patients. Horizontal line represents the benchmark mean plasma log NfL in GENFI noncarrier controls. *p < 0.05 compared to BbS PPD patients.
Blood-based log NfL in mildly symptomatic genetic mutation carriers with 0 < FTLD-CDR-SOB-NM < 4 compared to PPD
In a GLM with age and sex as covariates, we found a significant difference in blood-based log NfL levels between groups, F(3, 855) = 23.57 (p < 0.001,
Blood-based Log NfL levels in mildly symptomatic (0 < FTLD-CDR-SOB-NM < 4) Genetic FTD Carriers and PPD. Mean plasma log NfL in mildly symptomatic GENFI genetic mutation carriers with 0 < FTLD-CDR-SOB-NM < 4 versus mean serum log NfL in BbS PPD patients. Horizontal line represents the benchmark mean plasma log NfL in GENFI noncarrier controls. ***p < 0.001 compared to BbS PPD patients.
Blood-based log NfL in noncarrier controls compared to PPD
As shown in Figure 4, we detected lower blood-based log NfL levels adjusted for covariates in the noncarrier controls (EMM = 0.98, SE = 0.02, d = 0.48, mean NfL = 11.9 pg/mL) compared to patients with PPD (EMM = 1.08, SE = 0.01, mean NfL = 14.1 pg/mL), F (1, 1033) = 33.68 (p < 0.001,
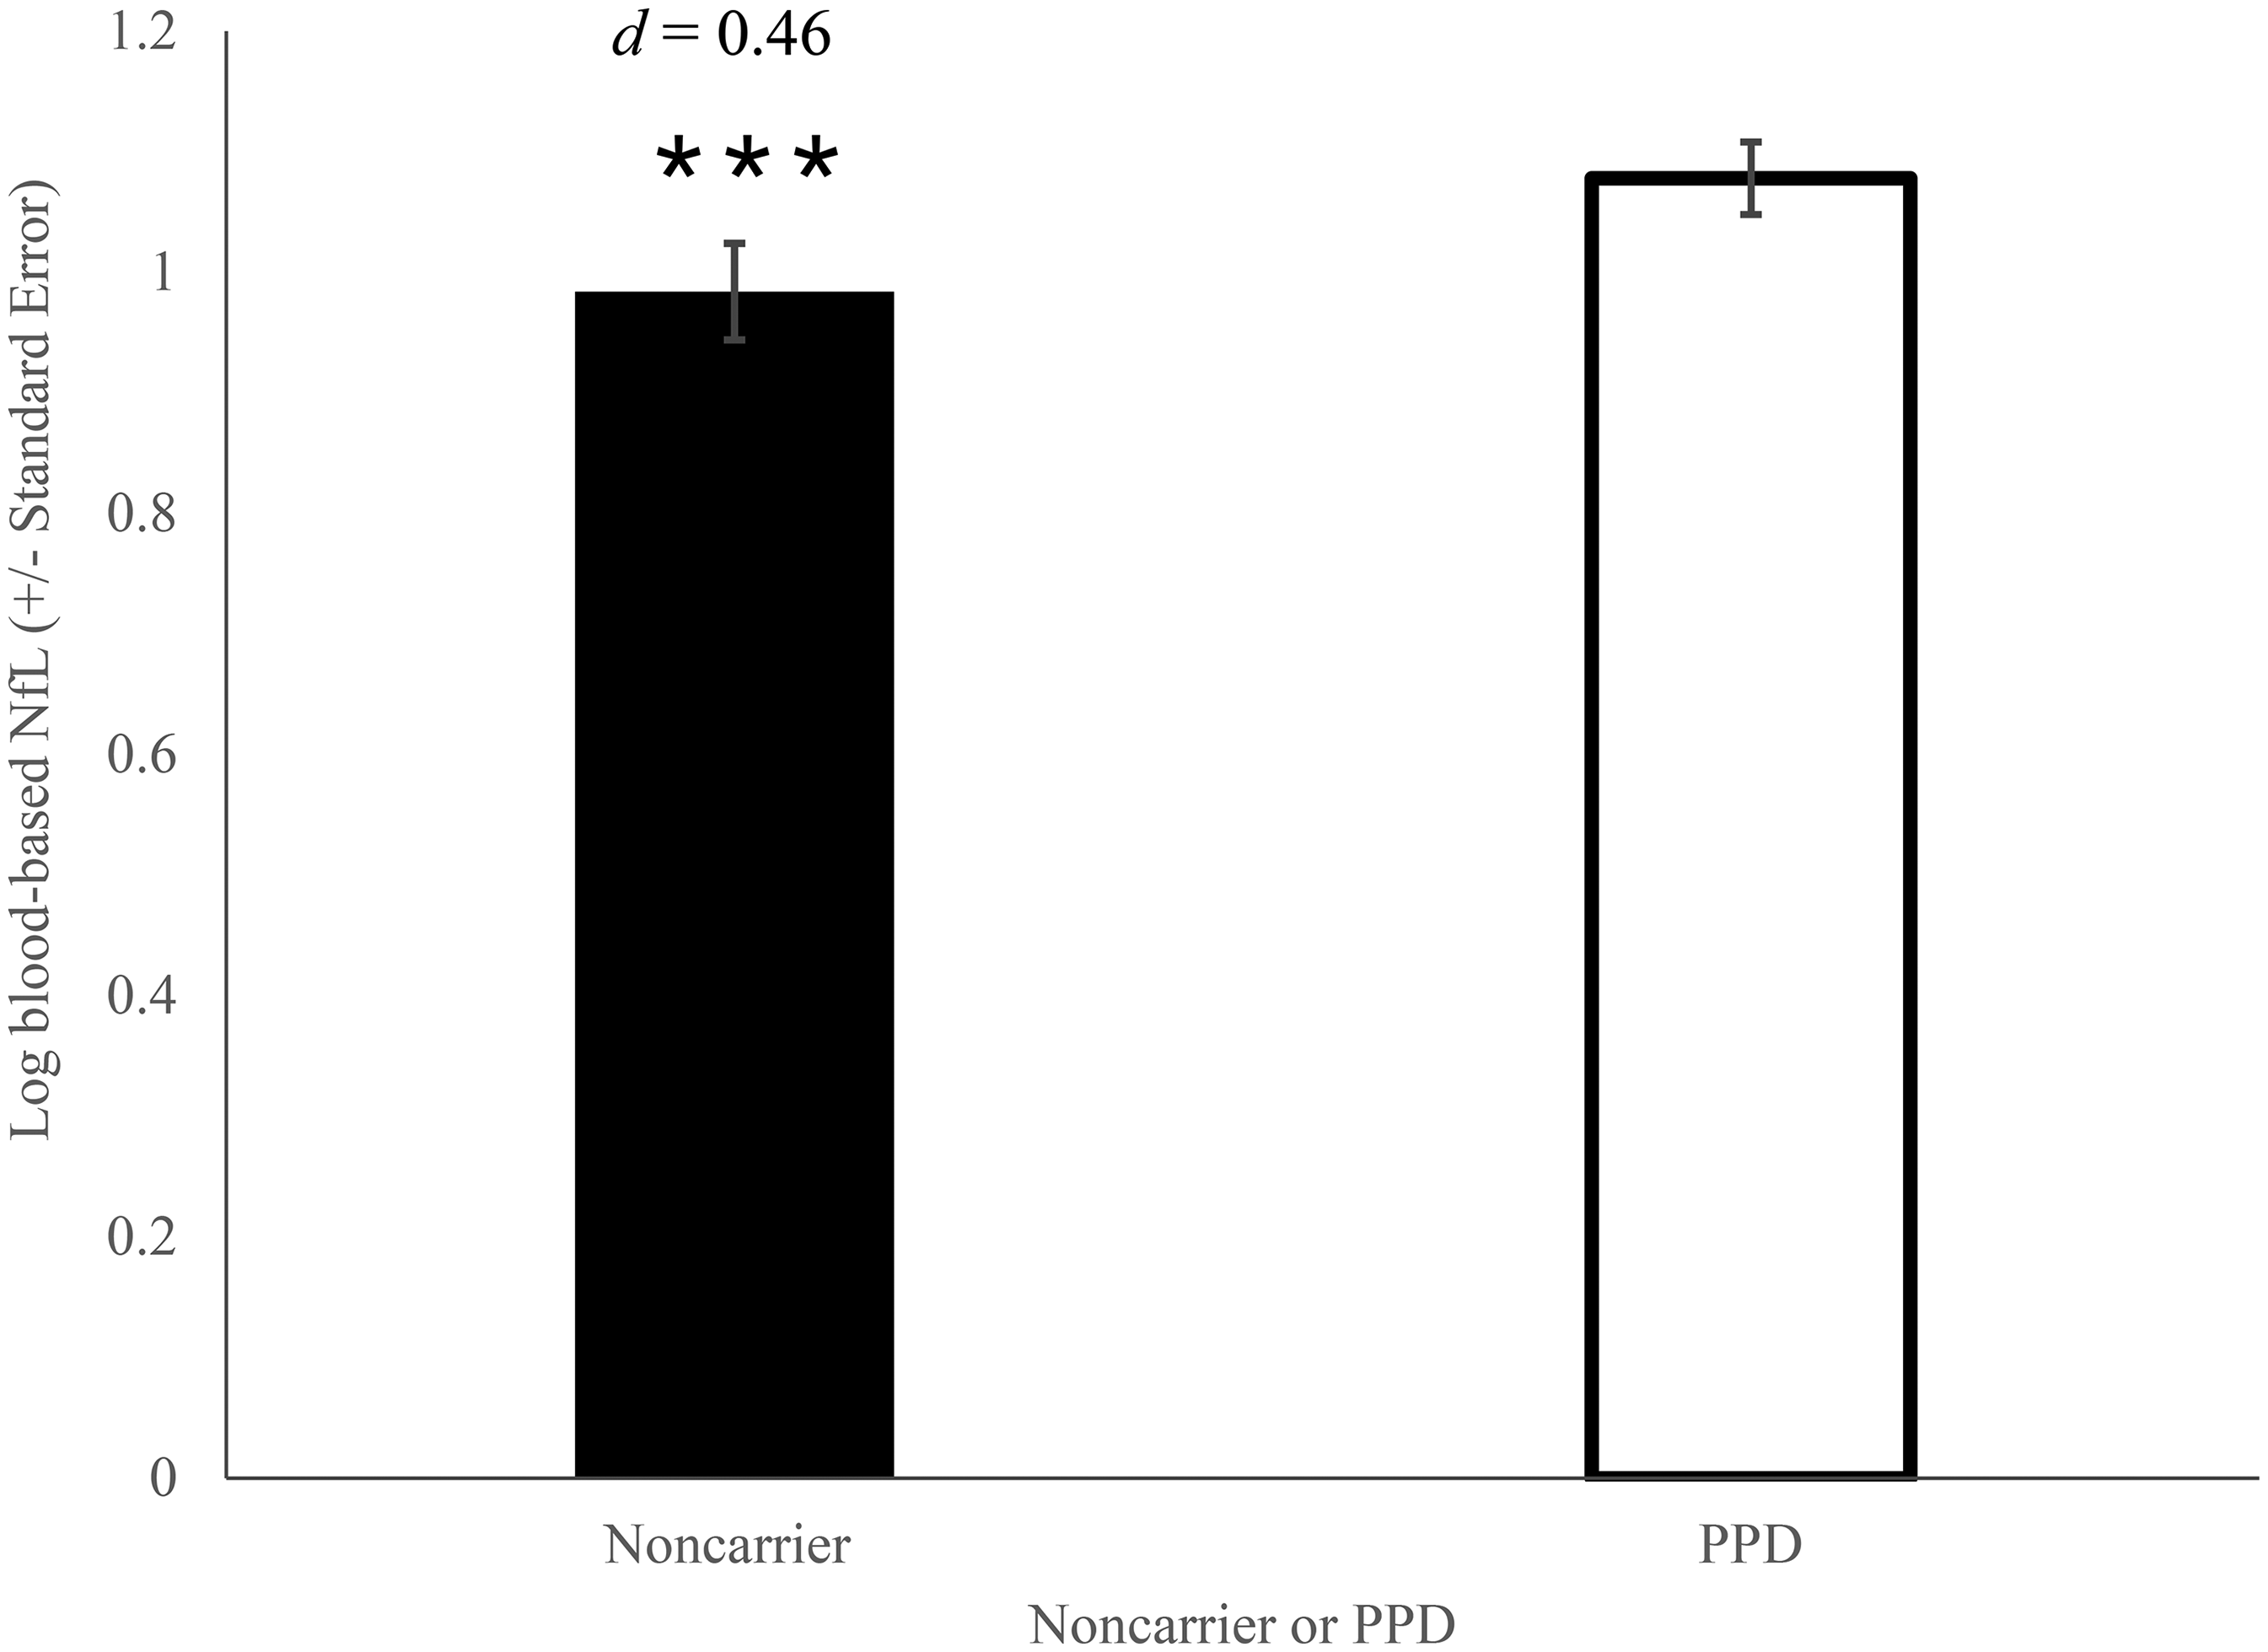
Blood-Based Log NfL levels in noncarrier controls and PPD. Mean plasma log NfL in noncarrier controls versus mean serum log NfL in BbS PPD patients. ***p < 0.001 compared to PPD.
Sensitivity analysis factoring the 1-plex GENFI concentration with 1.25
The main analyses using the corrected GENFI plasma NfL (correcting the values to 1.25 the original) concentrations, and including sex and age as covariates, yielded similar results with those of the uncorrected data. A GLM comparing late presymptomatic GENFI carriers to PPD showed the same overall result as with the uncorrected data with a significant difference in blood-based log NfL between the two groups (Supplemental Table 1). However, when the late presymptomatic carriers were divided by genetic subtype, simple contrasts revealed that the observed difference was due to higher blood-based NfL levels in C9orf72 compared to PPD (Supplemental Table 1). This result differs from the uncorrected analysis, in which the difference was due to lower blood-based log NfL in the GRN carriers compared to PPD. Furthermore, the GLM comparing noncarrrier GENFI controls to PPD showed no significant difference in blood-based log NfL between groups (Supplemental Table 1), which contrasts with the results observed using the uncorrected data.
Accuracy of blood-based NfL cutoffs to distinguish symptomatic, late pre-symptomatic, mildly symptomatic, and non-carriers from PPD
ROC curve analyses with our data revealed that a blood-based NfL cutoff of 22.1 pg/mL, J = 0.647 discriminated symptomatic genetic FTD from PPD with 78.5% sensitivity, 86.2% specificity, and AUC = 0.908. The ROC curve analysis did not find an efficient cutoff to differentiate the late presymptomatic genetic FTD from group from PPD (NfL cutoff of 8.08 pg/mL, J = 0.113, 85.6% sensitivity, 25.7% specificity, and AUC = 0.539).When discriminating mildly symptomatic genetic FTD from PPD, the ROC curve analysis revealed that a blood-based NfL cutoff of 16.2 pg/mL, J = 0.601 could differentiate the groups with 86.7% sensitivity and 73.5% specificity with an AUC of 0.870. As expected, ROC analysis revealed that NfL is not a good test to differentiate non-carrier controls from PPD (at a cutoff of 64.0 pg/mL, J = 0.006, 1.1% sensitivity, and 99.5% specificity with an AUC of 0.410).
ROC curves analyses on serum samples from the PPD cohort previously determined a global blood-based NfL cutoff of 17.0 pg/mL in distinguishing patients with sporadic bvFTD from PPD with 82.9% sensitivity, 76.1% specificity, and AUC = 0.847. 14 Using this cutoff in the current GENFI sample, symptomatic genetic FTD could be discriminated from PPD with 77.8% accuracy, 87.3% sensitivity and 76.1% specificity. It further discriminated mildly symptomatic genetic FTD carriers (0 < FTLD-CDR_SOB-NM < 4) from PPD patients with 76.1% accuracy, 80.0% sensitivity, and 76.1% specificity.
Discussion
This study aimed to test whether blood-based NfL levels differed between genetic frontotemporal dementia mutation carriers (C9orf72, GRN, MAPT) and patients with primary psychiatric disorders, at various disease stages, and to determine the accuracy of blood-based NfL as a biomarker to differentiate genetic FTD from PPD using a previously determined cutoff. 14 First, we confirmed that blood-based NfL levels were significantly elevated in all symptomatic genetic FTD mutation carriers compared to patients with PPD. Second, we found that late presymptomatic GRN mutation carriers had slightly lower blood-based NfL levels compared to PPD (but not compared to controls), whereas no significant differences were found with the C9orf72 and MAPT carriers. In genetic FTD carriers with mild symptoms, as defined by having FTLD-CDR-SOB-NM scores less than 4, the C9orf72 mutation carriers showed mildly elevated blood-based NfL, while GRN mutation carriers showed even greater elevation in blood-based NfL compared to individuals with PPD. Finally, the noncarrier controls had lower blood-based NfL levels compared to those with PPD, consistent with previous results from Light et al. (2024), 14 which reported slightly higher serum NfL levels in PPD compared to the Banque Signature controls. Furthermore, we demonstrate that both ROC curve based cutoffs showed moderately high discriminatory potential in differentiating the symptomatic GENFI carriers from PPD, with only a slight decrease in accuracy to distinguish PPD from mild cases.
The finding of elevated blood-based NfL levels in symptomatic genetic FTD participants compared to patients with PPD aligns with previous findings in the field.38–40 Consistent with other studies, GRN mutation carriers had the highest levels of NfL.26,38,39,41 This elevated blood-based NfL could be explained by the fast rate of brain atrophy found in GRN carriers as found in previous studies, reflecting a possibly faster rate of disease progression.42–44
In the individuals presenting very mild symptoms, blood-based NfL levels were elevated in C9orf72 and GRN mutation carriers with FTLD-CDR-SOB-NM scores < 4 compared to PPD (no difference in MAPT but there were only two cases). The mildly symptomatic GRN had the highest mean blood-based NfL which is expected due to the course of the disease in which blood-based NfL rise sharply near symptom onset.16,17 The more modest elevated mean log blood-based NfL found in these mildly symptomatic C9orf72 carriers could be explained by the course of the disease which involves a long late presymptomatic phase in which blood-based NfL levels slowly rises years before onset.16,17 In the sensitivity analyses, presymptomatic C9orf72 carriers were also shown to possibly have slightly higher values.
Of note, late presymptomatic GRN mutation carriers had significantly lower mean blood-based log-NfL compared to PPD, although the effect was small. This observation is unexpected given that some late presymptomatic rise was previously reported, however this could be due to the rise occurring just prior onset (and therefore not present on average in carriers many over the ten years prior to onset). Alternatively, given that EYO is a modest predictor of actual distance to symptom onset in GRN mutations, it is possible that the slightly lower NfL identified in the late presymptomatic GRN group could have been due to a random sampling effect. However, as seen in the sensitivity analysis, these differences were negligible with the corrected blood-based NfL concentrations. Blood-based NfL values of these late presymptomatic GRN mutation carriers might align more closely to controls than to the mildly elevated values seen in PPD for most of the late presymptomatic disease course.16,17 This pattern is distinct from the course of blood-based NfL in C9orf72, in which NfL levels slowly rise early on, leading to significant signals when pooling subject data from many years before onset. It is unclear in MAPT given the proposed disease progression of MAPT, in which NfL levels only begin to rise after symptom onset, why their late presymptomatic blood-based NfL levels were not lower than PPD (a similar finding to GRN in this context; i.e., mildly lower than PPD like controls), but the sample size is small.16,17
Our established cutoff of 22.1 pg/mL demonstrated discriminative efficacy in distinguishing symptomatic genetic FTD from PPD, with moderate sensitivity and specificity of 78.5% and 86.2%, respectively. The high AUC value of 0.908 further underscores the robust potential of this cutoff as an optimal cutoff compared to those previously established. Similarly, the cutoff of 16.2 pg/mL established for the mildly symptomatic group was promising with 86.7% sensitivity and 73.5% specificity and AUC of 0.870 that is only slightly lower than in the full symptomatic group. The cutoff in the mildly symptomatic group was very close to the previously established cutoff from Light et al. (2024) 14 in sporadic FTD. Globally, our results showed similar diagnostic performance compared to the previous study done by Eratne et al. (2024), who used a blood-based NfL cutoff of 13.3pg/mL in patients aged 43–80 years old (AUC 0.91, 86% sensitivity, 78% specificity).
This study has a few limitations. Although a strength of the study is diversity of sites from a number of different countries, the sites are primarily located in Canada and Europe. Other limitations include the relatively small sample sizes of the genetic FTD mutation groups once broken down per mutation and disease stage, limiting our ability to assess a pure mildly symptomatic group, or to test for meaningful sex differences. A strength however is the relatively large sample size for each sex in PPD and GENFI controls. Light et al. (2024) 14 previously reported higher NfL in PPD males compared to females which was replicated in the current analyses but here we extend those data by showing that both males and females with PPD have higher blood-based NfL than the respective GENFI controls, and importantly, a sex difference was not detected in the GENFI controls. This suggests that a biological mechanism related to PPD may be driving the sex difference in blood-based NfL. Thus, this data may provide a basis for future studies aimed at identifying the factors that lead to inconsistent reports in the literature regarding sex differences in blood-based NfL. Although it is unclear what may be driving the higher blood-based NfL in male patients with PPD, we have recently found higher inflammatory markers within PPD patients with high blood-based NfL (unpublished observations), and there are important sex-differences in inflammation, providing one avenue for future research.45,46 Yet, we cannot entirely rule out the possibility that a small number of the PPD patients could have been at the beginning of a neurodegenerative disease without pathological data. Additionally, we did not have creatinine data in GENFI, but we excluded BBS subjects with clinically significant kidney failure. The diagnoses in the BbS cohort were established clinically using standard psychiatric diagnostic processes. Final psychiatric disorders were observed at discharge, following a period of observation to distinguish transient psychiatric symptoms from more sustained psychiatric disorders. While this approach cannot rule with absolute certainty a psychiatric presentation of an early stage of neurodegenerative disorder, the amount of such cases would be at most marginal. Furthermore, our study involved the use of two different blood sources of NfL. However, previous studies have reported plasma and serum NfL to be comparable and that NfL is a stable measure, being robust across the GENFI cohort. 47 Another limitation is that the blood-based NfL measurements were performed in two different laboratories at different times with different assays. However, it has been found that intra-lab consistency is high. 47 Moreover, it is known that the 4-plex NfL assay (used to analyze the BbS data) generates higher blood-based NfL concentrations than the 1-plex NfL assay (used to analyze the GENFI data). Method comparisons performed in the laboratories that generated the data in the current study have seen strong positive and linear relationships between the two assays (correlations >0.95), but 1.1- to 1.4-fold higher blood-based NfL concentrations by 4-plex compared with the 1-plex (Supplemental Figure 1 from H. Zetterberg). The sensitivity analysis which factored the 1-plex GENFI plasma NfL values by 1.25, showed overall very similar results as with the uncorrected pooled data. We recognize that it would have been ideal to conduct measurements at a single laboratory, with the same assay and from patients in the same location for more accurate results, however due to funding constraints. this was not possible. Further, the heterogeneity of psychiatric disorders in the PPD cohort presents another potential limitation, as previous studies have reported variations in NfL levels across psychiatric conditions. 48 However, a study by Light et al. (2024) 14 which analyzed the same PPD cohort, found no significant differences in NfL levels across psychiatric subgroups. Nonetheless, future studies should continue to explore the sensitivity of NfL for differentiating psychiatric conditions to enhance the biomarker's potential utility. While the study of prodromal/mild genetic FTD provides a window on the use of sNfL in the very early stages, it remains uncertain if findings would generalize to sporadic cases. Prospective studies will be required to determine the value of this biomarker in ambiguous/very early sporadic cases in real-life clinical settings. Further, future analysis comparing the same type of blood-based NfL at a single laboratory with the same assay should be done for more accurate results. Our identified cutoffs however, being very close to the previously published cutoffs reinforce the robustness of the blood-based NfL measurement method.
In conclusion, our study introduces valuable evidence towards the use of blood-based NfL in differentiating patients with symptomatic genetic FTD from a large cohort of PPD patients across various psychiatric disorders, including for patients with very mild FTD symptoms.9,12 Given the slight increase of serum NfL in PPD, the accuracy of NfL to distinguish PPD from pure psychiatric C9orf72 prodromes remains to be established. Future research should further determine if rate of change of blood-based NfL levels overtime is a better diagnostic biomarker than cross-sectional measure for this clinical purpose. In addition, combining blood-based NfL with other peripheral biomarkers of neuronal degeneration could be further investigated.
Supplemental Material
sj-docx-1-alz-10.1177_13872877251352103 - Supplemental material for Accuracy of blood-based neurofilament light to different genetic frontotemporal dementia from primary psychiatric disorders
Supplemental material, sj-docx-1-alz-10.1177_13872877251352103 for Accuracy of blood-based neurofilament light to different genetic frontotemporal dementia from primary psychiatric disorders by Ella Liu, Sherri Lee Jones, Victoria Light, Charlotte Teunissen, Arabella Bouzigues, Lucy L Russell, Phoebe H Foster, Eve Ferry-Bolder, John C van Swieten, Lize C Jiskoot, Harro Seelaar, Raquel Sanchez-Valle, Robert Laforce, Caroline Graff, Daniela Galimberti, Rik Vandenberghe, Alexandre de Mendonça, Pietro Tiraboschi, Isabel Santana, Alexander Gerhard, Johannes Levin, Sandro Sorbi, Markus Otto, Chris R Butler, Isabelle Le Ber, Elizabeth Finger, Maria Carmela Tartaglia, Mario Masellis, James B Rowe, Matthis Synofzik, Fermin Moreno, Barbara Borroni, Henrik Zetterberg, Jonathan D Rohrer, Simon Ducharme and in Journal of Alzheimer's Disease
Footnotes
Acknowledgements
ORCID iDs
Ethical considerations
Each research center in the GENFI study received approval from their local ethics committees prior to the start of the review. 18 This project was approved by the McGill University Health Center's Research Ethics Board.
All participants in the Banque Signature study signed an informed consent form and the study received approval from the local scientific evaluation and research ethics committees of the Louis-H. Lafontain Hospital (renamed in March 2013 as CER-CEMTL) following the Declaration of Helsinki. 24
Consent to participate
All participants of the GENFI and Banque Signature studies provided written informed consent per the Declaration of Helsinki prior to enrolment. 18
Author contributions
Funding
The authors disclosed receipt of the following financial support for the research, authorship, and/or publication of this article: SD receives salary funding from the Fond de recherche du Québec - Santé (FRQS). GENFI2 is funded by the Canadian Institutes for Health Research. The Banque Signature receives funding from the Fondation de l’Institut Universitaire de Santé Mentale de Montréal, Bell pour la cause, and the Réseau québécois sur le suicide, les troubles de l’humeur et les troubles associés. JBR is supported by the Medical Research Council (MC_UU_00030/14; MR/T033371/1) Wellcome Trust (220258) and the National Institute for Health and Care Research Cambridge Biomedical Research Centre (NIHR203312: the views expressed are those of the authors and not necessarily those of the National Institute for Health and Care Research or the Department of Health and Social Care). For the purpose of open access, the authors have applied a CC BY public `copyright licence to any Author Accepted Manuscript version arising from this submission.
Declaration of conflicting interests
The authors declared the following potential conflicts of interest with respect to the research, authorship, and/or publication of this article: SD conducts sponsored clinical trial research (Biogen, NovoNordisk, Innodem Neurosciences, Janssen, Alnylam) and has received advisory/speaker fees (Eisai, QuRALIS, Eli Lilly). JBR provides consultancy unrelated to the current work to Asceneuron, Astronautx, Astex, Curasen, CumulusNeuro, Wave, SVHealth, and has research grants from AZ-Medimmune, Janssen, and Lilly as industry partners in the Dementias Platform UK. The other authors declared no potential conflicts of interest with respect to the research, authorship, and/or publication of this article.
Data availability statement
The data supporting the findings of this study are not publicly available due to privacy or ethical restrictions.
Supplemental material
Supplemental material for this article is available online.
Appendix
References
Supplementary Material
Please find the following supplemental material available below.
For Open Access articles published under a Creative Commons License, all supplemental material carries the same license as the article it is associated with.
For non-Open Access articles published, all supplemental material carries a non-exclusive license, and permission requests for re-use of supplemental material or any part of supplemental material shall be sent directly to the copyright owner as specified in the copyright notice associated with the article.