
Abstract
This paper presents a numerical study on the blast performance of reinforced concrete (RC) fences strengthened with high-strength strain-hardening cementitious composite (HS-SHCC) using finite element (FE) modeling. In the FE model, the MAT_72R3 material model is calibrated and verified against analytical method to accurately simulate the material characteristics of HS-SHCC. A comparative study between RC and HS-SHCC fences subjected to blast loading is conducted to assess the potential of HS-SHCC as a replacement material for protective structures. The results demonstrate that the HS-SHCC fence outperforms the RC fence in terms of smaller maximum and residual deflection, reduced damage, and debris. The study further investigates the strengthening of existing RC fences with layers of HS-SHCC under dynamic and impulsive blast loadings. The response, failure modes, strain distribution, and energy dissipation are compared to identify the most effective strengthening configuration for each blast loading regime. Results show that, for dynamic blast loading, the front strengthened RC fence demonstrates better performance and higher blast resistance due to the high tensile capacity of HS-SHCC, which effectively resists flexural damage. Conversely, the back strengthened RC fence exhibits notable improvement and higher blast resistance under impulsive blast loading as the back HS-SHCC layer protects the RC fence against local punching shear failure.
Keywords
Introduction
Buildings face significant vulnerabilities to blast loads throughout their operational lifespan, encompassing both accidental gas explosions and potential terrorist attacks. A bomb detonation near a structure can inflict extensive damage on both external and internal structural components. The consequences extend beyond structural failure, including direct blast impact, structure collapse, and the risk of debris causing injury or fatalities.
Over the last three decades, increasing concern about intentional and accidental explosions has driven intensive research into blast mitigation strategies, including the development of blast shelters and security barriers (Wu, 2012).
Reinforced concrete (RC) has been widely utilized in various structural applications. However, many existing structures are not designed to withstand extreme blast loads. Understandably, it is not economically feasible to replace these structures. Instead, a suitable alternative lies in implementing appropriate repair and retrofit approaches for blast protection. Various composite and cement-based materials have been studied for retrofitting structures. Researchers have explored strengthening normal reinforced concrete with different composite materials, including external fiber reinforced polymers (FRP) (Buchan and Chen, 2007), aluminium foam (Mahmoud et al., 2015, 2018), glass fiber reinforced polymers (Razaqpur et al., 2007), and strain-hardening cementitious composites (SHCC) (Adhikary et al., 2018).
Among retrofit methods, FRP and UHPC can also be used but have notable limitations. FRP lacks ductility and may suffer from debonding, while UHPC is much less ductile if not brittle in tension and costly. HS-SHCC combines high tensile ductility with compressive strength, offering better crack control and compatibility with concrete substrates. These advantages make it a strong candidate for blast-resistant retrofitting, warranting focused investigation.
SHCC exhibits high tensile strain capacity, ductility, notch insensitivity, and energy absorption, making it a promising material for protective structures against extreme loads. The mixture for SHCC is similar to that used for conventional concrete, with the addition of a relatively small amount of discontinuous fibers, chemical additives, and fine aggregates to ensure its unique ductile properties (Adhikary et al., 2018).
Recent research by Ranade et al. (2013a, 2011) introduced a novel mixture design for high-strength SHCC (HS-SHCC) to achieve a unique combination of high compressive strength similar to ultra-high-performance concrete (UHPC) (≥150 MPa) and ultra-high tensile ductility comparable to SHCC (≥3% under uniaxial tension). The development of HS-SHCC involves modifying the high-strength concrete matrix to synchronize its behavior with the fibers and achieve tensile ductility while preserving high compressive strength. This requires maintaining conditions such as a low water-to-cement ratio, dense particle packing, minimizing flaws in size and number, matrix homogeneity, and a high-quality microstructure (Ranade, 2014).
Previous studies have explored HS-SHCC, particularly in relation to materials used for retrofitting RC structures subjected to impact loadings. While Ranade (2013a) research on HS-SHCC is referenced, it primarily addresses the mechanical properties under static or low dynamic loads, rather than in blast-specific contexts. This study aims to focus on the blast strengthening methodology designed to enhance the blast resistance of reinforced concrete structures.
This research presents a finite element (FE) analysis of RC fences strengthened with HS-SHCC, evaluated under various blast loading conditions. The study develops validated FE models for both conventional RC and HS-SHCC materials. Initially, the response and failure mechanisms of HS-SHCC-strengthened fences are compared to those of unstrengthened RC fences. A further analysis compares different strengthening configurations under both dynamic and impulsive blast scenarios.
Finite element (FE) model overview
Finite element (FE) analysis is crucial in assessing and predicting the response of structures, particularly when subjected to dynamic loads such as blast loading. This study utilizes the LS-DYNA software (Hallquist, 2016), which offers a broad range of material models suitable for concrete-like materials. The section outlines the model setup, material calibration, key assumptions, and validation strategies.
Structural configuration and boundary conditions
The fence model represents a protective structural segment with dimensions of 3000 × 3000 × 100 mm, flanked by two square columns of 250 mm width, as shown in Figure 1. The RC material has a compressive strength of 50 MPa, reinforced with 12 mm diameter steel bars (yield strength 420 MPa) spaced at 200 mm in both directions. Proposed FE model of the fence under air-blast (units in mm).
In the initial phase of the study, the response of unstrengthened RC fences and full HS-SHCC fences is examined and compared under dynamic and impulsive blast loads. The differences between dynamic and impulsive blast loading lie in the time duration, pressure rise rate, and pressure variation. Dynamic blast loads involve longer durations and gradual pressure increases, while impulsive loads apply high intensity forces over shorter periods.
In the second phase, RC fences are retrofitted with HS-SHCC layers of varying thicknesses and configurations. The conventional concrete material model is validated against experimental results from prior studies. Since no full-scale blast tests are available for HS-SHCC, a Single Degree of Freedom (SDOF) approach using TM5-1300 (1990) is employed for validation.
Mesh convergence study for RC panel.
The outer sides and bottom base nodes of the two columns are constrained to simulate the fixed foundation conditions. This assumption simplifies the analysis and reflects a conservative anchorage scenario for the middle panel of the fence. However, it does not realistically represent typical fence installations, where some flexibility and soil-structure interaction are present. As a result, the model may overestimate global stiffness and underestimate deflections. Localized stress concentrations were observed near the restraints, highlighting the impact of boundary conditions. Although this simplification was necessary for the current study, its limitations must be acknowledged, and future studies should incorporate boundary sensitivity analyses to better capture realistic structural behavior.
Steel reinforcement is modeled using truss elements. Hourglass control, as proposed by Flanagan and Belytschko (1981), is implemented to suppress non-physical deformations due to reduced integration.
The TNT charge is placed 1 m above the base of the fence to simulate a vehicular explosive device. Ground-transmitted shock effects are excluded, as these are assumed to have minimal impact relative to direct air blast loading.
Blast loading
Following detonation, a substantial release of energy generates a pressure wave capable of inducing severe damage to nearby structures. The specific failure modes experienced by a target are influenced by factors such as the immediacy, intensity, and characteristics of the blast pressure.
In this study, the pressure-time history is generated by utilizing the Load Blast Enhanced (LBE) function in LS-DYNA. This function enables simulation of air blast loads on structural surfaces and is widely employed in modeling the response of blast walls (Kim et al., 2024; Rebelo and Cismasiu, 2017; Shirbhate and Goel, 2023). The LBE module relies on CONWEP (Hyde and David, 1988), an empirical blast load model that incorporates charts and equations from TM5-855-1 (1986). The implementation uses the “Load Segment Set” keyword to define which surfaces of the structure receive the applied blast load.
The CONWEP model assumes idealized spherical charge effects while neglecting ground reflections. Although the LBE function can account for ground surface reflections. Although LBE can account for ground reflections, they are omitted in this study to maintain a generalized analysis framework. For design applications requiring higher accuracy, factors such as ground reflection, soil energy absorption, and surrounding obstacles should be considered.
The empirical equations derived from spherical air bursts are applicable within the scaled distance range of 0.147 m/kg1/3 < Z < 40 m/kg1/3, where Z is calculated using the formula Z = R/M 1/3 , with R denoting the range, and M representing the TNT equivalent mass of the explosive charge. In all models, the front face elements are consolidated into a single set and subsequently assigned to the aforementioned “Load Segment Set” to accurately apply the blast load to those elements. Additionally, the applied blast load falls within the range of scaled distance from 1 to 2.15 for dynamic blast loads and from 0.16 to 0.29 for impulsive blast loading.
Constitutive models for materials
Selection of material models in LS-DYNA
The LS-DYNA material library provides various material models specifically designed for concrete-like materials (Hallquist, 2016). Comparative studies have been extensively conducted in the past to evaluate and compare different models (Anzanpour et al., 2023; Hallquist, 2016; Malvar et al., 1997; Tiong, 2000; Wu et al., 2012; Yonten et al., 2002). One commonly used model is the Karagozian & Case (K&C) model, known as material type MAT_72R3, which is widely employed for simulating the blast responses of reinforced concrete (RC) structures (Li et al., 2021). This model is equally applicable for High-Strength Strain-Hardening Cementitious Composite (HS-SHCC) due to its ability to represent concrete behaviors such as strain hardening, confinement, shear dilation, and strain rate sensitivity (Wu et al., 2012).
In this study, the MAT_72R3 model is deemed suitable for both concrete and HS-SHCC materials under blast conditions and is thus utilized in the Finite Element (FE) models (Wu et al., 2012). The model, developed by Malvar et al. (1997), is based on a plasticity model specifically tailored for concrete and can be customized to define the unique characteristics of HS-SHCC materials. It incorporates three independent failure surfaces associated with yield, maximum, and residual surfaces, which transfer based on the material’s damage state.
The transition between failure surfaces is governed by the damage parameter (η), which is a function of the accumulative effective plastic strain parameter (λ). The
To obtain the constants for the damage parameter, a single solid element in LS-DYNA is tested under uniaxial compression and tension (Ranade, 2014). The experimental data from these tests are curve-fitted to determine the unconfined uniaxial compression and tension behavior of the material, which allows for obtaining the appropriate damage parameter constants for the model (Malvar et al., 1997; Tu and Lu, 2009).
Calibration of material parameters for concrete
The MAT_72R3 model provides an auto-generation parameters feature that allows for determining conventional concrete parameters. This involves identifying the concrete density, compressive strength, and two conservation parameters to generate the default model parameters (Hallquist, 2016). In this study, concrete with a compressive strength of 50 MPa and a density of 2.26 × 10⁻³ g/mm3 is considered. Further explanation on the auto-generation procedures can be found in reference (Wu et al., 2022).
To calibrate the damage parameters in the model, a simulation is conducted using a single 2 mm element subjected to uniaxial tension and compression loading. This calibration process helps fine-tune the model. In this study, the calibrated values for the damage parameters are as follows: b1 = 1.6, b2 = 0.5, and b3 = 1.15. These values are obtained based on the results of the simulation and are utilized in the model.
Calibration of material parameters for HS-SHCC
The design approach, proposed by Ranade et al. (2013a), combines micromechanics-based principles for HS-SHCC material design (Li et al., 2002; Lin et al., 1999) with a modified matrix of very high-strength concrete (VHSC) (Ranade et al., 2013b). In this study, the HS-SHCC used has an ultimate tensile strength of 14 MPa, an ultimate tensile strain capacity of 3.1%, and an ultimate compressive strength of 160 MPa.
The parameters defining the failure surfaces in the MAT 72R3 model are determined based on experimental data from uniaxial compression and tension tests presented in (Ranade et al., 2013a). The values of the maximum failure surface parameters are evaluated using three applied conditions: 1- At 2- At 3- At
where,
The initial yield failure surface of HS-SHCC is determined by assuming a locus of points at
The The input η-λ curve in MAT_72R3 model for HS-SHCC.
Additional parameters are required to be defined in the MAT_72R3 models. The density is set to 2400 kg/m3, and the Poisson ratio is 0.2. The localization width of the crack, known as LOCWIDTH, is assumed to be equal to the element size, as stated in the study (Ranade and Li, 2014).
Strain rate effects of concrete and HS-SHCC
The dynamic increase factor (DIF) is used to account for strain rate sensitivity in materials under dynamic loading. For HS-SHCC, different DIF models are employed for tension and compression due to its distinct mechanical behavior in each regime. The DIF for compressive strength is based on the CEB-FIP Model Code (1993; Malvar, 1998), traditionally used for conventional concrete. However, because HS-SHCC exhibits significantly enhanced compressive strength compared to normal concrete, a modified version suitable for high-strength concrete is used in this study, as expressed in equation (1) (Hetherington and Smith, 2014; Wang et al., 2011).
In contrast, the tensile strength enhancement under high strain rates is modeled using the DIF proposed by Malvar and Ross (1998), which has been validated for HS-SHCC through experimental studies by Ranade (2014). These findings provide a reliable basis for the tensile DIF formulation used here, shown in equation (2).

In the finite element model, these strain rate effects are implemented using load curves within the MAT_72R3 material model in LS-DYNA. These load curves dynamically scale the material’s tensile and compressive strength values at each time step, depending on the local strain rate experienced by the element. This allows the model to simulate the rate-dependent increase in strength that occurs during high-speed blast loading, improving the accuracy of predicted deflections, damage propagation, and failure timing.
Equation of state (EOS)
The Tabulated Compaction EOS (EOS_8) in LS-DYNA (Hallquist, 2016) defines the material behavior at hydrostatic pressure level following MAT_72R3. EOS_8 represents the pressure by:
Steel reinforcement
The steel reinforcement was modeled using the Plastic-Kinematic material model (i.e., MAT_03). For the strain rate effect of steel reinforcement, the dynamic increase factor proposed by Malvar (1998), as shown in equation (4), is employed (Malvar, 1998; Ngo et al., 2007):
Material model validation
Validation of the concrete material model
A three-dimensional FE model of RC panel with dimensions of 2200 × 1000 mm and a thickness of 100 mm is created and validated against the experimental test results published by Adhikary et al. (2018). The RC panels were tested under the blast of a 5 kg TNT spherical charge at a distance of 1 m. The compressive strength of concrete is 50 MPa, and the yield strength of reinforcement bars is 460 MPa. More details of the specimens can be found in (Adhikary et al., 2018).
The RC panel is modeled using an 8-node hexahedron solid element with one integration point, while the reinforcement bars are modeled using beam elements. The mesh size is chosen as 5 mm after conducting a mesh convergence study. The concrete is represented using the MAT_72 R3 material model, while the reinforcement bars and supports are modelled using the MAT_03 material model.
The steel supports at both ends of the panel are constrained to allow rotation about its longitudinal axis without translation in any direction. The contact between the supports and panel is defined using the algorithm “Contact Automatic Nodes to Surface” in LS-DYNA.
The blast loading is simulated using the Load Blast Enhanced (LBE) function, considering a 5 kg TNT charge with a spherical burst assumption and stand-off distance of 1 m above the panel midspan. A set of elements facing the explosive charge is assigned for the keyword “Blast Segment Set”, where the pressure is applied. The experimental test setup and the FE model of the panel are shown in Figure 3. Experimental set and FE model of the panel. (a) Experimental setup (Adhikary et al., 2018) (b) FE model.
Validation of the HS-SHCC material model
The HS-SHCC material model in LS-DYNA has been validated under impact load by Wu et al. (2022) using an experimental test conducted by Ranade et al. (2017). The calibrated HS-SHCC material model parameters were found to effectively represent the dynamic behavior of HS-SHCC. The detailed description of the material model parameters, including the strength model, EOS, and strain rate effect, is illustrated in (Wu et al., 2022). Due to the absence of published experimental results under blast loadings, the validation will be performed using similar material model parameters as presented by Wu et al. (2022), and the same geometry of the RC panel described earlier, as shown in Figure 3(b). The model will be verified against the results obtained from the equivalent (SDOF) approach based on TM5-1300 (1990).
The FE model of the HS-SHCC panel shares similarities with the RC panel in terms of dimensions, boundary conditions, loading conditions, mesh size, and reinforcement ratio. The differences lie in the material parameters, EOS, and strain rate effect specific to the HS-SHCC material.
Equivalent SDOF method
While FE packages are capable of analyzing complex structures subjected to blast loading, the equivalent single-degree-of-freedom (SDOF) method is often employed for preliminary calculations or as a comparison to FE results when experimental data is lacking (Morison, 2006). Consequently, this method is applied to both the RC and HS-SHCC panels, and the results obtained are compared with those obtained from the FE models.
The SDOF approach simplifies the dynamic response of a distributed structural element—typically the mid-span displacement—into that of an idealized lumped mass-spring system with a single degree of freedom. Various analytical strategies can be used within this framework. One involves solving the equation of motion to obtain the displacement-time history, while another estimates peak response by determining the system’s natural period and referencing empirical design charts such as those in TM5-1300 (1990). A third approach, applicable to impulsive loading scenarios, estimates the maximum displacement by equating internal and external work based on equivalent mass and initial kinetic energy.
The SDOF method exhibits notable limitations, particularly when applied to advanced materials such as HS-SHCC. Most critically, it cannot capture localized damage phenomena, including crack initiation, strain localization, or complex failure modes. Therefore, the SDOF method should be interpreted with caution and ideally supplemented with high-fidelity FE modeling or experimental validation to achieve a comprehensive understanding of structural performance under blast loading.
In this study, where only SDOF-based validation was feasible, the results should be considered preliminary. Further validation using physical testing or advanced numerical methods is recommended to confirm the findings.
Transformation factors
The transformation factors are applied to adjust the mass (
In practice, the load mass factor (
The values of these factors are reported in widely published references (TM5-1300, 1990; Biggs, 1964). According to Morison (2006) and in this study, the
Ultimate resistance and moment capacity
For a two-way supported short-edge panel with an aspect ratio (L/H) equals 2, Morison (2006) provided a simplified formula to compute the ultimate resistance, which is
The unit moment capacity of the structural element, denoted as Stress and strain distribution in reinforced HS-SHCC section.
The unit moment capacity of the panel can be computed as follows:
Where 
Where,
Structural stiffness, the moment of inertia, and natural period
The elastic stiffness of a two-way span structure element is equal to
The average moment of inertia per unit width (


The natural period of vibration of an element is given by
Structure response under different blast schemes
In the structural blast analysis, the focus is often on determining the maximum deflection rather than the entire deflection-time history of the structure (Hetherington and Smith, 2014). The method for calculating the maximum deflection depends on the blast scheme, which considers the ratio of blast duration (
For the dynamic response scheme, the maximum deflection and the time of maximum deflection can be obtained from charts in TM5-1300 (1990). On the other hand, the impulsive response scheme can be analyzed using the impulsive method provided in TM5-1300. In the present study, an impulsive blast loading scenario is considered, using a small 5 kg TNT charge at a close standoff distance of 1 m.
The impulsive method relies on energy equivalence, equating the kinetic energy imparted by the blast impulse (KE) to the strain energy of the structure (SE). The kinetic energy is given by:
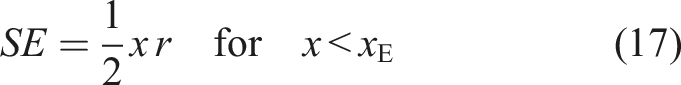
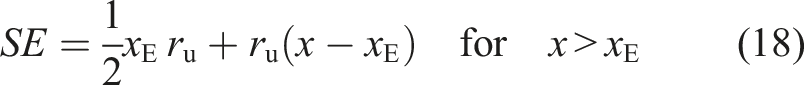
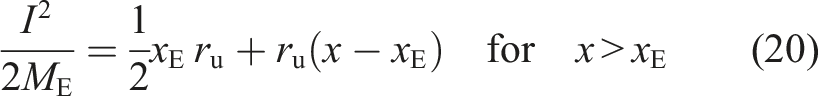
For energy equivalence, then: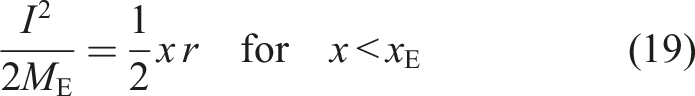
Properties of SDOF for RC and HS-SHCC panels.
Results of validation
The pressure-time history for a 5 kg explosive charge at 1 m stand-off distance is compared with pressure data measured by the sensors in the experimental study. The agreement between the measured and calculated pressure values, arrival time, and load durations is observed and depicted in Figure 5(a). Load-time curves for 5 kg TNT at standoff distance 1 m.
For the SDOF approximate method, the pressure-time history is plotted from CONWEP and simplified to an idealized triangular load, as shown in Figure 5(b). The load duration time is determined as
The maximum mid-span displacement predicted by the FE model for the RC panel is compared with the measured mid-span displacement obtained through laser sensors in the experimental study. The comparison demonstrates good agreement in terms of amplitude and trend between the two curves, as shown in Figure 6(a). The failure mode observed in the FE model aligns well with RC panel tested in the experiment, as shown in Figure 6(b). This agreement further validates the material model used for conventional concrete. Result comparison of RC panel under blast loading. (a) Displacement-time histories (b) Deflection and failure mode (Adhikary et al., 2018).
The idealized pressure-time history shown in Figure 5(b) is utilized in the SDOF analysis of the HS-SHCC panel. The results obtained using this equivalent SDOF approach, as presented in Table 2, are used to calculate the maximum deflection using equation (20). The time of maximum displacement ( Deflection-time histories used for HS-SHCC panel’s FE model and equivalent SDOF system.
Validation results of the RC and HS-SHCC panels.
*Difference percentage between the predicted and measured results.
Blast response of HS-SHCC and RC fences
Response of HS-SHCC and RC fences due to dynamic blast loading
Blast load properties for dynamic loading case.
As an example, Figure 8(a) presents the reflected pressure-time history obtained from FE analysis for 100 kg TNT charge at standoff distance 10 m, considering the arrival time, Peak reflected pressure for the charge cases studied.
The deflection-time histories for both HS-SHCC and RC panels are compared for blast loading scenarios involving 100, 200, and 300 kg TNT charges, as illustrated in Figure 9. Under the 100 kg TNT load, the HS-SHCC panel exhibits slightly lower deflection, attributed to its higher stiffness and shorter natural period. However, the strain-hardening behavior of HS-SHCC is not fully activated under small deformations, resulting in a modest performance difference. Deflection-time histories for HS-SHCC and RC fences under dynamic blast loads.
As the blast load increases, the performance gap becomes more pronounced. At 200 kg TNT, the RC panel exhibits a maximum deflection approximately 3.6 times higher than that of the HS-SHCC panel. For the 300 kg charge, this ratio increases to about 6.1. The results confirm that HS-SHCC has significantly better blast resistance under high-energy events, owing to its higher compressive strength and strain capacity. Furthermore, the RC fence exhibits over-damped vibration, indicating damage, whereas the HS-SHCC fence demonstrates under-damped vibration, implying limited or no damage.
The comparison between the RC and HS-SHCC fences under different blast loading conditions reveals significant differences in their failure patterns and plastic strain contours, as shown in Figure 10. Under a 100 kg TNT charge blast loading, the RC fence exhibits minor longitudinal mid-span cracks and damage in the joints, while no visible damage is observed in the HS-SHCC fence. Increasing the blast loading to 200 kg TNT results in shear cracks near the ground corners and accumulation of damage at the mid-span in the RC fence, while the HS-SHCC fence sustains the load with minimal distortions and minor yield lines at the wall-column joints. Further increasing the blast loading to 300 kg TNT leads to severe damage in the RC fence, including radial cracks and concrete spalling, whereas the HS-SHCC fence shows no visible damage or element distortions except for minor cracks on the front face. This demonstrates that the HS-SHCC fence can withstand higher blast loads with less visible damage than the RC fence. Failure patterns of RC and HS-SHCC fences under 300 kg TNT dynamic blast loading.
Considering the response of the HS-SHCC fence to higher blast loads, it is inferred that the applied blast pressure could be increased beyond 300 kg TNT. The HS-SHCC fence is tested under charge weights ranging from 600 to 1000 kg TNT to observe significant changes.
Figure 11 compares the displacement-time histories of the HS-SHCC fence under 600, 800, and 1000 kg TNT blast loadings with those of the RC fence under 300 kg TNT blast loading. The vibration response of the HS-SHCC fence under 600 kg TNT blast pressure is observed to be under-damped. As the charge weight increases beyond 600 kg TNT, the vibration response becomes damped due to energy dissipation and damage evolution. It is noted that larger failure areas corresponding to higher applied loads result in a smaller number of vibration cycles. However, when subjected to 600 and 200 kg TNT charge blast pressures, the maximum deflection of the HS-SHCC and RC fences, respectively, is comparable. The response of the RC fence is over-damped, indicating a larger area of failed material. Deflection-time histories for RC and HS-SHCC fences for different dynamic blast loadings.
Figure 12 presents the damage pattern and strain distribution for the HS-SHCC fence under 600 and 1000 kg TNT charge blast loadings, respectively. Under 600 kg TNT charge, multiple cracks are observed on the front face of the fence due to high tensile stress. Increasing the blast loading to 800 kg TNT, cracks diminish in the upper half of the fence due to local failure at panel-column joints, and longitudinal collapse occurs in the upper mid-span. With a 1000 kg TNT charge, the upper half of the fence panel is separated till the mid-span, resulting in a transverse crack that splits the panel into two halves. Multiple cracks decrease in the upper half and increase in the lower half. Failure patterns for HS-SHCC fences under 600 and 1000 kg TNT dynamic blast loading.
Comparing the failure patterns of the RC fence under a 300 kg TNT charge (i.e., Figure 10) and the HS-SHCC fence under a 1000 kg TNT charge (i.e., Figure 12), it is evident that both materials fail to resist the corresponding blast pressures. The RC fence accumulates damage in the middle span with radial cracks propagating from the center towards the lower edges and local failure at panel-column joints. The HS-SHCC fence initially experiences damage in the upper conjunction with the end columns, leading to a transverse middle crack that splits the panel into two halves. The HS-SHCC fence demonstrates better resistance to scabbing and spalling than the RC fence due to its strain-hardening characteristics. This finding is crucial for the design of protective structures as reducing debris resulting from damaged structures is essential in minimizing life-threatening risk.
Response of HS-SHCC and RC fences due to impulsive blast loading
The impulsive blast loadings.
Figure 13 compares the FE-predicted deflection-time histories of HS-SHCC and RC fences under impulsive blast loads of 5, 10, and 15 kg TNT. Under a 5 kg load, the RC panel undergoes a maximum deflection approximately 2.2 times greater than the HS-SHCC panel, indicating superior stiffness and resilience of the latter (Figure 13(a)). For the 10 kg charge, the RC fence exhibits an over-damped response with a peak displacement of 145 mm, whereas the HS-SHCC panel displays significantly lower displacement at 33.3 mm (Figure 13(b)). Deflection (Δ) histories for HS-SHCC and RC fences under impulsive blast loads.
With a 15 kg TNT charge, the RC fence fails structurally, reaching a peak displacement of 300 mm. In contrast, the HS-SHCC panel withstands the blast with a maximum deflection of 59.8 mm and retains structural integrity (Figure 13(c)). These observations emphasize the superior performance of HS-SHCC in resisting impulsive loads.
The FE-based failure patterns reveal that the RC fence suffers moderate cracking near the point of detonation under 5 kg TNT. At 15 kg, severe damage is observed, including through-thickness cracks and possible spalling (Figure 14(a)). In contrast, the HS-SHCC fence remains largely intact under all three load levels, showing only minor rear-face cracking under 15 kg TNT (Figure 14(b)). This resistance is attributed to the material’s strain-hardening capacity, which effectively controls crack propagation under sudden loading. Failure pattern for HS-SHCC and RC fences under 15 kg TNT impulsive blast loads.
To evaluate the failure criteria and ultimate impulse load-bearing capacity of HS-SHCC fences, additional simulations were performed at higher blast intensities: 20 kg, 25 kg, and 30 kg TNT. Figure 15 compares the deflection-time history of the HS-SHCC fence under these increased loads with the RC fence response under a 15 kg blast. Deflection (Δ)-time (t) histories for RC and HS-SHCC fences under impulsive loadings.
Under a 20 kg TNT charge, the HS-SHCC fence undergoes plastic deformation and reaches a peak displacement of 129 mm, but retains a predominantly under-damped response. At 25 kg TNT, the deflection increases, and the system transitions to an over-damped response, indicating significant damage. At 30 kg TNT, the HS-SHCC fence exhibits complete over-damping, marking a critical threshold for the material’s blast resistance.
The damage and strain distributions for the HS-SHCC fence due to 20 and 30 kg TNT impulse loading are illustrated in Figure 16. With a 20 kg TNT blast, the fence experiences high tensile strain, leading to multiple cracks in the back face. No element distortion is observed, explaining the underdamped response behavior (see Figure 14). Increasing the load to 30 kg TNT, the HS-SHCC material fails at the center, accumulating damage on the rear face (Figure 16(b)). Failure patterns for HS-SHCC fences under 20 and 30 kg TNT impulsive blast loading.
These results highlight a shift in failure mode from distributed flexural deformation under dynamic loading to a more localized and brittle punching-shear failure under impulsive loads. Under impulsive conditions, tensile strains concentrate on the rear face instead of the front face, as seen under dynamic loading. The impulsive energy leads to excessive deflection over a short duration, promoting punching failure and more severe localized damage.
In summary, the HS-SHCC fence exhibits exceptional performance under impulsive blast loading. It can resist up to a 20 kg TNT charge without visible structural failure, whereas the conventional RC fence fails at only 15 kg. This demonstrates that HS-SHCC offers significantly enhanced blast resistance and damage tolerance under both dynamic and impulsive loading scenarios.
Blast response of HS-SHCC strengthened RC fences
Strengthening configurations of RC fence under blast load.
Dynamic blast response of HS-SHCC strengthened RC fences
Following the results in the previous section, where the standalone HS-SHCC fence withstood dynamic blast loads up to 800 kg of TNT at a 10 m standoff distance, the current study focuses on dynamic loads ranging from 200 to 500 kg of TNT applied to the strengthened RC fences. The corresponding loading parameters are summarized in Table 4.
Figure 17 illustrates the deflection-time histories of the three strengthening configurations subjected to 200, 300, 400, and 500 kg TNT charges. All strengthened configurations show a significant reduction in peak deflection under the 200 kg TNT blast, with reductions ranging from 33% to 42% compared to the unstrengthened RC fence. Notably, the strengthened models are capable of withstanding up to five times the explosive load resisted by the original RC fence, thus demonstrating substantial enhancement in blast resistance. Displacement-time histories of different configurations under dynamic blast loadings.
Among the three configurations, the FRC and FBRC models (both incorporating a front HS-SHCC layer) exhibit superior performance compared to BRC. The improved performance is attributed to the front-facing HS-SHCC layer, which mitigates brittle cracking in the concrete substrate by increasing the structure’s flexural stiffness and delaying the onset of damage, thereby limiting residual deformations.
The failure modes of the three strengthening configurations are compared for the 200, 300, 400, and 500 kg TNT charge blast loading. At 200 kg TNT charge, all three configurations withstand the load, while the unstrengthened RC fence fails. The FRC shows minimal damage on the front face, with minor cracks on the back face due to the brittle behavior of concrete. The BRC experiences flexural failure on the front face and damage near panel-column joints on the back face. The column connection damage is due to the distributed high reaction forces at the joints, which the unstrengthened concrete could not resist. The FBRC exhibits no visible damage on both surfaces, except for minor failure at longitudinal joints.
Increasing the charge to 300 kg, as shown in Figure 18, the FRC suffers more rear surface tensile damage on the rear face, while BRC shows increased flexural damage on the front face and at joints, resulting in significant residual deflection compared to the FRC and FBRC models. Failure pattern of strengthened RC fences under 300 kg TNT dynamic blast loading.
At 400 kg, BRC experiences severe damage as connected columns fail, while FBRC reduces joint failure and maintains similar deflection to FRC. Finally, at 500 kg, all models fail with severe damage on both surfaces, as columns and joints cannot withstand the applied tensile stress from the shock wave.
The above mechanism can be better explained from the energy dissipation perspective. Figure 19 presents the energy profiles of the RC layers, HS-SHCC layer, and the entire strengthened fence, respectively. When the HS-SHCC layer is placed in the front face, the RC layer behind dissipates more energy compared to other configurations, as shown in Figure 19(a). The reason is that the RC material has limited tensile capacity, resulting in significant element distortions on the back surface. Conversely, from Figure 19(b), it can be seen that when the HS-SHCC layer is in the front, it dissipates less energy. This result is due to the high strength of HS-SHCC material, which resists and reflects the shock wave energy. Examining the whole fence, the internal energy of the FRC and FBRC configurations with strengthening layer on the front face is lower than that of the BRC, as shown in Figure 19(c). HS-SHCC layer on the front surface provides stronger support against flexural failure caused by dynamic blast loading. This finding aligns with the deflection-time histories presented in Figure 17(b), where the FRC model exhibits the smallest deflection and highest residual resistance. Comparisons of energy dissipation curves (under 300 kg TNT dynamic blast loading).
Impulsive blast response of HS-SHCC strengthened RC fences
To observe the impulsive response of the strengthened RC fences, small charge weights ranging from 5 to 15 kg TNT are applied at a stand-off distance of 0.5 m. These charge weights are chosen based on the moderate damage observed in the RC fence subjected to a 5 kg TNT blast (refer to Figure 13(a)). The reflected impulses (
The deflection-time histories of the three strengthening configurations are compared in Figure 20. Due to the 5 kg TNT charge, all three strengthening configurations exhibit similar responses and peak deflection values, reducing approximately 45% of the maximum deflection compared to the unstrengthened fence (see Figure 13(a)). Deflection (Δ)- time (t) histories of strengthened RC fences under impulsive blast loading.
When subjected to 10 and 15 kg TNT charges, the FBRC and BRC configurations show reduced residual deflection by 32% and 48%, respectively, compared to the FRC configuration (Figure 20(b) and (c)), indicating that the HS-SHCC layer on the back significantly enhances the fence’s resistance under impulsive blast loading.
These findings can be better analyzed through the failure modes of the three strengthening configurations. Under 5 kg TNT charge, mid-span cracks are observed in the back face of the FRC configuration due to local punching, while no notable fractures appear in the BRC and FBRC configurations, as presented in Figure 21. With a 10 kg TNT charge, the FRC model experiences moderate local punching failure at the detonation point, while the BRC model shows a transverse crack at the mid-span, prevented by the HS-SHCC layer on its backside. The FBRC model displays no damage on both faces. Under a 15 kg TNT charge, severe punching failure and rear face elements erosion occur in the FRC model, while the BRC model exhibits local punching failure on the front face, prevented by the HS-SHCC layer on the backside, as shown in Figure 22. Failure pattern of strengthened RC fence under 5 kg TNT impulsive blast loading. Failure pattern of strengthened RC fence under 15 kg TNT impulsive blast loading.
The FBRC configuration demonstrates the most ideal performance, holding the punching of the RC fence from both sides and exhibiting suitable residual deflection compared to the BRC model, explaining the observed differences in deflection histories in Figure 20(c). Attaching the HS-SHCC layer to the front face of the fence (FRC configuration) results in a distinct failure mode. Despite its high compressive strength, the HS-SHCC layer is unable to withstand the immense energy generated by the impulsive blast, leading to severe local punching in the RC material at the back. Therefore, it is crucial to attach the HS-SHCC layer to the back surface of the fence to prevent punching failure.
Figure 23 presents the energy dissipation curves for the entire HS-SHCC strengthened fences, including energy dissipation of the individual layers of both materials. In the FBRC model, where HS-SHCC layers are attached on both sides, the RC layer exhibits the least energy dissipation due to increased stiffness and reduced damage. Conversely, the FRC model, with significantly higher residual deflection compared to BRC, shows lower energy dissipation. This aligns with the smaller punching failure area observed in FRC compared to BRC. The HS-SHCC layer on the back surface (i.e., BRC) protects the RC layer from severe punching, spreading the damage over a larger area of the front RC face. Comparisons of energy dissipation curves (under 10 kg TNT impulsive blast loading).
From Figure 23(b), it can be seen that the back HS-SHCC layer in the BRC model dissipates more energy due to its high tensile strain capacity, enabling it to absorb more blast energy. Overall energy dissipation of the HS-SHCC strengthened RC fence is shown in Figure 23(c). Consequently, FBRC demonstrates the highest energy dissipation capability, while it exhibits the least energy absorption for both RC and HS-SHCC layers (Figure 23(a) and (b), respectively). This observation confirms FBRC as the optimal strengthening approach for impulsive blast loads, protecting against severe damage, reduced residual deflection, and enhanced energy absorption compared to the other two schemes.
Summary of mechanism of blast resistance in HS-SHCC-strengthened fences
The observed response mechanisms of HS-SHCC-strengthened RC fences under various blast conditions can be summarized as follows: (1) Under dynamic blast pressure, the structural response is governed primarily by global flexural behavior. Reinforcing the RC fence with an HS-SHCC layer on the front face (FRC configuration) enhances its blast resistance by improving flexural stiffness and strength. The high tensile capacity of the HS-SHCC effectively resists the formation of flexural cracks, delays crack propagation, and allows the structure to absorb and dissipate a larger portion of the blast energy. (2) Under impulsive blast loading, the failure mode shifts to local punching and spalling due to the near-field, high-intensity pressure applied over a small area. In this case, placing the HS-SHCC layer on the rear face (BRC configuration) provides superior resistance by intercepting the tensile stress waves reflected from the rear free surface. The HS-SHCC’s high ductility and tensile strain capacity help prevent punching failure and reduce residual deflection. (3) Mechanistic explanation based on stress wave propagation:
Blast loads generate compressive stress waves that travel through the structure and reflect as tensile waves at the rear face. In FRC, the front HS-SHCC layer attenuates and partially reflects the incident wave, reducing damage to the RC core. In BRC, the rear HS-SHCC layer absorbs the reflected tensile wave, preventing punching failure. The FBRC configuration combines both benefits, offering improved resistance to both global flexural deformation and localized damage.
Conclusions
This study introduces a novel application of HS-SHCC for enhancing the blast resistance of RC fences, representing a significant contribution in the field of protective engineering. By employing a comprehensive finite element modeling approach, this research rigorously compares the blast performance of HS-SHCC-reinforced structures against conventional RC under various loading conditions. The findings reveal that HS-SHCC not only improves structural integrity by reducing maximum and residual deflections but also enhances energy dissipation and minimizes damage during blast events. This work provides critical insights into the optimal configurations for retrofitting existing structures and establishes a foundation for the broader application of HS-SHCC in blast-resistant design. Based on the studies presented in the paper, the following conclusions can be made: (1) The calibrated MAT_72R3 material model for HS-SHCC and RC materials accurately predicts the blast pressure, deflection, and time of maximum deflection compared to analytical and experimental results. (2) Comparative analysis of blast resistance reveals that HS-SHCC fences can withstand blasts of up to 800 kg TNT, whereas RC fences are limited to a maximum of 200 kg TNT charge at the same stand-off distance. These findings underscore the potential of HS-SHCC as a robust material for reinforcing protective structures, enhancing their resilience and blast resistance capabilities. (3) This study examined three strengthening configurations concerning their performance under dynamic and impulsive blast loading conditions. Results indicate that the HS-SHCC layer positioned on the front face offers superior resistance during dynamic loading by protecting the underlying RC layer from flexural failure. Conversely, under impulsive loading, the back-face configuration proved more effective, enhancing the energy dissipation capabilities of the RC layer while mitigating local punching failure. (4) Given these findings, it is advisable to employ HS-SHCC strengthening on both sides of the RC structure. This dual-sided approach is anticipated to minimize overall damage and further enhance blast resistance.
While this study primarily focuses on fences, the insights gained may also be applicable to other structural elements, such as walls and slabs, broadening the impact of the findings. However, we acknowledge several limitations of the present study. These include (1) Failure surface parameters and softening curves for HS-SHCC are based on analogous high-strength concretes due to limited multiaxial data, potentially affecting accuracy under extreme confinement. (2) a limited investigation of stress distributions in critical zones, (3) an emphasis on deflection metrics as the primary measure of blast resistance, and (4) limited detailed crack quantification. While these aspects are beyond the specific scope of this study, they are valuable areas for further exploration and warrant independent, detailed investigations.
Future research should include experimental validation of numerical models, scaling and parametric studies to assess the influence of different reinforcement configurations, dimensions, and geometries, as well as comprehensive cost-benefit analyses of HS-SHCC retrofitting strategies. These investigations will contribute to a more holistic understanding of HS-SHCC’s potential in blast-resistant design and facilitate its broader application in infrastructure protection.
Footnotes
Author note
Chao Wu, Reader. Mohamed M. Mahmoud, Assistant Professor. Shang-Jun Chen, Master Student. Ameen Topa, PhD Student. Chuan-Chuan Hou, Associate Professor.
Acknowledgements
The authors would like to acknowledge the financial support received from the National Natural Science Foundation of China (Projects No. 51908017, and 51911530208).
Consent for publication
All authors agree the publication of this manuscript.
Author contributions
Chao Wu: Supervision, Conceptualization, Writing-original draft, Writing- review and editing, Funding acquisition. Mohamed M. Mahmound: Methodology, Numerical modeling, Formal analysis, Writing-original draft, Data curation, Writing- review and editing. Shang-Jun Chen: Formal analysis, Writing-orginal draft. Ameen Topa: Numerical modeling. Chuan-Chuan Hou: Conceptualization, Formal analysis, Writing-original draft, Funding acquisition
Funding
The authors disclosed receipt of the following financial support for the research, authorship, and/or publication of this article: The authors would like to acknowledge the financial support received from the National Natural Science Foundation of China (Projects No. 51908017, and 51911530208).
Declaration of conflicting interests
The authors declared no potential conflicts of interest with respect to the research, authorship, and/or publication of this article.
Data Availability Statement
The datasets used and/or analysed during the current study are available from the corresponding author on reasonable request.