
Abstract
Concrete is a material universally found in critical infrastructure and protective structures where it may be exposed to both impact and blast loading. In this study, the response of concrete slabs subjected to sequential impact and blast loading is investigated experimentally and numerically. First, 50 mm thick slabs from three different types of commercially produced concrete with nominal unconfined compressive strengths of 35, 75, and 110 MPa were cast along with samples for material testing. After curing, ballistic impact tests were carried out using 20 mm diameter, 196 g mass, ogive-nose hard steel projectiles to emulate a projectile or fragment impact. Synchronised high-speed cameras measured the initial and residual velocities of the projectiles. After impact testing, the perforated slabs were exposed to a blast-like pressure load generated by a shock tube facility. Undamaged slabs were also blast tested as a reference. Quasi-static material tests were conducted using digital image correlation synchronised with force measurements. Finite element (FE) models for the combined loads were finally established in LS-DYNA, where the constitutive behaviour of the concretes was simulated by the Karagozian and Case (K&C) model. By comparison with the experimental results, the accuracy of the calibrated K&C model and the validity of the proposed FE models were demonstrated. Moreover, the effects on the structural resistance of two loading scenarios, sequential or simultaneous impact and blast loads, were numerically evaluated. It was found that applying the impact and blast loads sequentially may differ notably from simultaneous application.
Introduction
Concrete is by far the most widely used construction material in the world (Gagg, 2014) and a practical choice for protective structure applications, especially in the absence of weight and space limitations (Corbett et al., 1996). This makes concrete of particular interest to the process and nuclear industry as well as in fortification installations for defence purposes. Due to its widespread use in critical infrastructure, many studies on the behaviour of concrete components exposed to extreme loading such as vehicle collision, ballistic impact, and blast loads can be found in the open literature (Abdel-Kader and Fouda, 2019; Abdelkarim and ElGawady, 2016; Hatfield et al., 2024; Hupfauf and Gebbeken, 2024; Kristoffersen et al., 2018a; Sauer et al., 2023).
A concrete structure may exhibit a variety of dynamic responses and failure behaviours under extreme loading. Understanding the damage mechanisms of concrete structures under extreme loads is thus important in the design of protective structures. Ballistic impact on concrete typically results in local fracture of the structure within the contact zone, failure mechanisms such as penetration and spalling on the entry surface, scabbing on the rear surface, and eventually perforation depending on the projectile velocity, slab thickness, and material strength (Lee et al., 2022). The damage pattern and the failure behaviour of a structure due to a blast load depend on the impulse and blast pressure distribution. When a far-field blast load is considered, the load is transmitted over a long distance and the relatively small pressure induces a global response across the entire structure. Conversely, a structure under a near-field or contact blast load exhibits a localised, high-intensity response in the blast-loaded zone (Anas et al., 2022; Syed et al., 2018). Further, an explosion may accelerate fragments to velocities higher than that of the shock wave, resulting in fragment impact and damage to the structure before the blast load itself arrives (Elveli et al., 2023).
The ballistic impact resistance of a concrete slab is typically evaluated by the ballistic limit curve according to the projectile velocity, the penetration depth, and the size of the damaged area (Jacobsen et al., 2023; Sauer et al., 2023) based on gas gun tests or similar. A blast loaded slab is typically evaluated by the out-of-plane deformation, the damaged area, and by the crater depth in the case of contact charges (Mourão et al., 2021). Tests are normally conducted using experimental facilities such as shock tubes or by detonation of explosives (Foglar et al., 2017; Kristoffersen et al., 2018c). When global bending is present, as is often the case for blast loaded concrete slabs, the tensile strength is important in resisting out-of-plane deformations (Kristoffersen et al., 2018c). Although the majority of previous works focus on the damage assessment of concrete structures under solely impact or blast loading conditions (Kristoffersen et al., 2021a; Li and Wu, 2018; Sielicki et al., 2019; Zhang et al., 2013), studies on the combined effects of impact and blast loading are gaining traction as summarised in a recent review of the topic (Goswami et al., 2022). These studies demonstrated a synergetic effect of fragment impact and blast load, and emphasized the importance of considering the combined loads in protective structure design (Grisaro and Dancygier, 2021; Grisaro et al., 2018, 2019; Shi et al., 2020).
Literature on structures subject to combined blast and impact can be divided into two categories: those that consider the two loading scenarios simultaneously and those that analyse them sequentially. Experimental studies on simultaneous combined loading often consider cased charges (Del Linz et al., 2020; Grisaro, 2021), which is a special case generally resulting in more severe damage to a structure compared to equivalent bare charges. Regarding fragment impact and blast loading, previous work has indicated that it is possible to analyse the two loads separately (Leppänen, 2005), however the midpoint deflection of concrete slabs subjected to simultaneous impact and blast loading may be larger than the sum of the midpoint deflections for the loads separately (Nyström and Gylltoft, 2009). In a sequential fragment impact and blast load scenario, the impact is typically represented by a pre-formed defect or generated by projectile impact (Elveli et al., 2023; Geng et al., 2020; Yang et al., 2023; ) conducted sequential projectile penetration and explosion tests on concrete structures, and the analysis of the blast side damage depth and volume of the concrete target indicated that the prior penetration damage amplified the damage caused by the blast. These studies mainly considered the penetration effect rather than the perforation effect caused by the projectile impact.
Technically, a scenario in which a fragment and blast wave arrive at exactly the same time can only occur once during an event. It is therefore more likely for impact and blast scenarios to happen in sequence rather than simultaneously. The response time of a structure under a blast load is generally much higher than for a local fragment impact, meaning that if the fragment arrives first, analysis of the loads may be approached sequentially. Therefore, in this work, the experimental loading case is limited to scenarios where the fragment arrives before the shock wave. A purely numerical investigation is instead presented for the case of simultaneous impact and blast loading. The fragment shape is also considered to be influential (Singh and Chakraborty, 2023), but is kept constant in the current study.
Numerical studies serve as an effective means of examining the response of concrete structures to extreme loading, especially where large-scale experiments are impractical due to cost, space, and time constraints and safety concerns. The numerical modelling approach largely depends on the loading type. In ballistic impact analyses, a fine mesh discretisation is needed in the impacted area, while blast analyses often use a comparatively coarse mesh discretisation to predict local as well as global responses. Considering this, establishing a numerical model suitable for analysing the combined load effect of both the ballistic impact and blast response is challenging (Elveli et al., 2023). Numerical simulations in the literature are typically carried out using commercial codes such as AUTODYN, LS-DYNA and ABAQUS. (Cheng et al., 2022) experimentally and numerically analysed the combined projectile penetration and explosion tests on normal strength concrete (NSC), ultra-high-performance concrete (UHPC), and armour steel/UHPC composite targets. 2D axisymmetric finite element (FE) models for both projectile impact and charge explosion were established. The 2D FE model was found to provide reasonable accuracy at a low CPU cost, but the capacity for accurate damage predictions remained limited.
Since an impact and blast loaded structure is subjected to multiaxial dynamic loading, an appropriate constitutive model that can predict the ultimate dynamic strength in three-dimensional stress space is important. Many constitutive concrete models, such as the Karagozian and Case (K&C), Holmquist, Johnson and Cook (HJC), Continuous Surface Cap (CSC), and Riedel, Hiermaier and Thoma (RHT) models have been implemented into the standard version of LS-DYNA to reproduce the response of concrete structures subjected to extreme loads. Among the concrete models, the K&C model is frequently used for studies of concrete-based materials subjected to impact loads and even contact explosions (Liu et al., 2022), providing general guidelines on the determination of the input parameters for NSC and UHPC materials. Based on these general guidelines, additional modification of the input parameters can improve the accuracy of the numerical analyses for specific cases.
This study has two main goals. The first is to produce reliable and well-defined experimental data for concrete slabs subjected to perforation by ballistic impact prior to blast loading for three different concrete qualities with nominal unconfined compressive strengths of 35, 75, and 110 MPa. The second goal is to investigate how well finite element simulations can predict the dynamic response of the slabs. The experiments detailed herein consist of a loading scenario in which an ogive-nose projectile was used to impact a 50 mm thick slab before a successive blast-like pressure generated by a shock tube facility was applied to the same slab. Undamaged slabs were subjected to the same blast-like pressure as reference. The K&C concrete model was used to represent the constitutive behaviour of the three concrete types, and model input parameters were determined based on material test data and complemented by data from the literature. Finite element models with the calibrated K&C model were presented to reproduce the experiments. Ballistic impact and blast simulations were performed sequentially using a restart method in LS-DYNA. The effect of boundary conditions and mesh discretisation on the impact and blast simulations was investigated. Moreover, based on the validated numerical model, the structural resistance of the concrete slabs under two loading scenarios, sequential and simultaneous impact and blast loads, was numerically assessed and the influence of the loading scenario on the damage of the concrete is discussed.
Material and component testing
In the following, the material and component tests that form the basis for this study will be presented. It should be noted that the concrete casting, the material tests, and the ballistic impact tests have previously been presented by (Kristoffersen et al., 2021b), therefore only a short summary of these results is provided for completeness. For additional information regarding the specifics of the various setups and results, the reader should consult the work of (Kristoffersen et al., 2021b). The results from the shock tube experiments on the other hand, are novel for this study.
Concrete casting
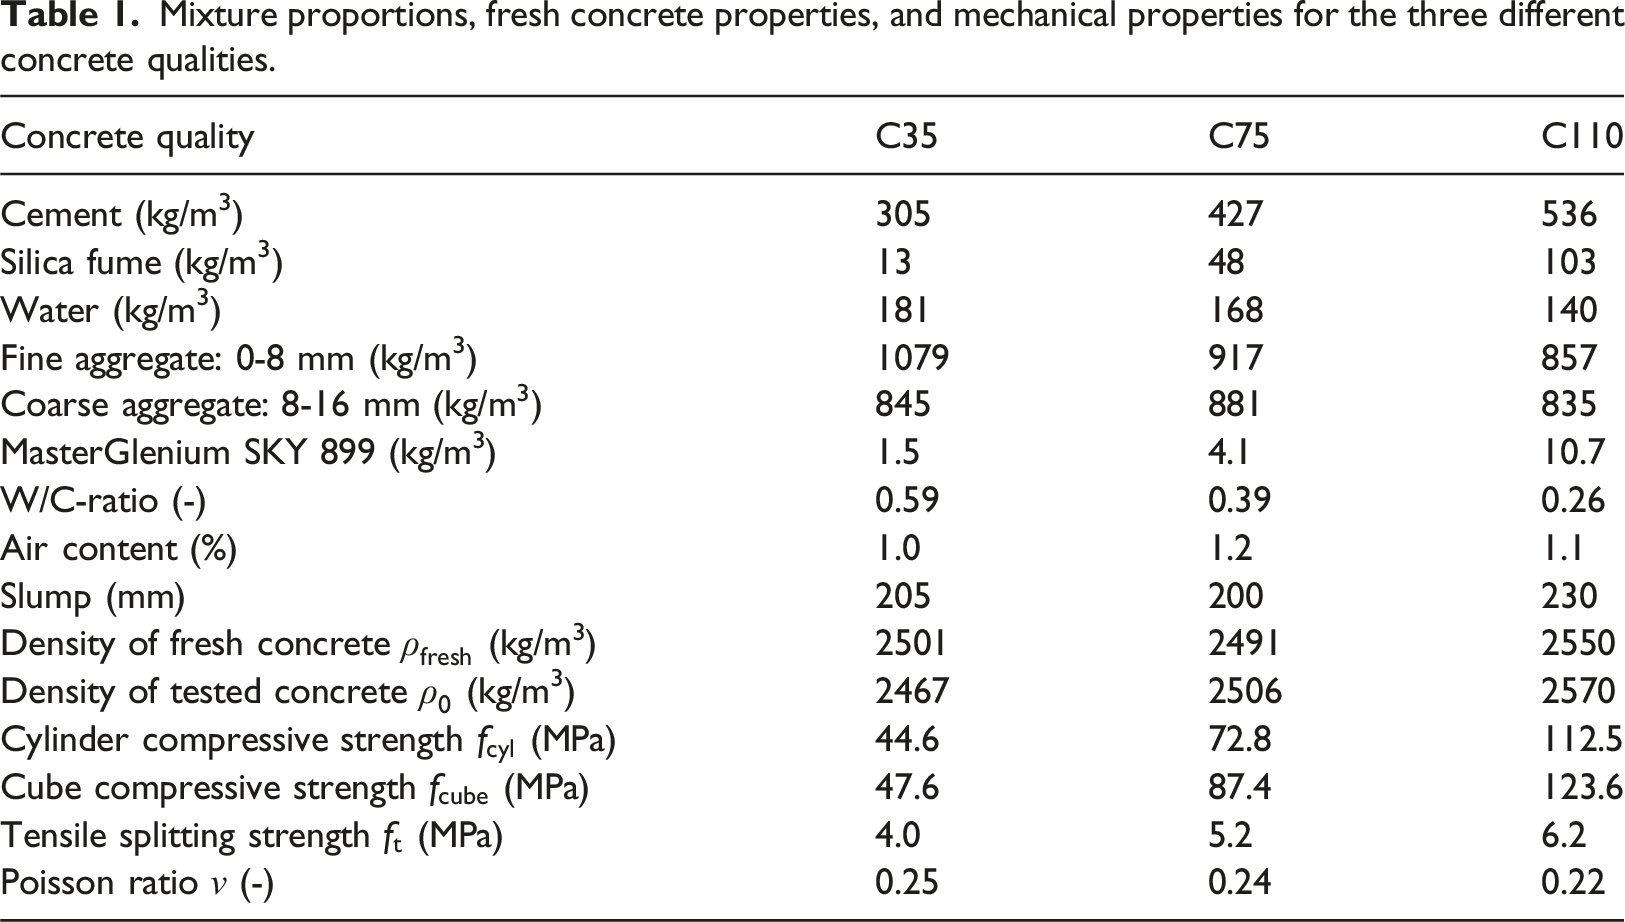
50 mm thick concrete slabs measuring 625 mm × 625 mm were cast in three different concrete qualities with nominal compressive strengths of 35 MPa (C35), 75 MPa (C75), and 110 MPa (C110). The concretes were produced by a commercial supplier and delivered by a mixer truck to the concrete laboratory at NTNU. Custom-made wooden moulds as shown in Figure 1(a) were used to cast the slabs. Smooth lubricated plastic tubes were inserted through the 12 equally spaced cut-outs for bolt holes in the moulds before the concrete was poured. A reinforcement bar with diameter 8 mm looping on the outside of the bolt holes as illustrated in Figure 1(b) was added to prevent the slabs from falling apart after testing. The slabs were demoulded the day after casting, wrapped in wet burlap, covered with plastic sheets, and cured at room temperature to provide good curing conditions until the day of testing. The material test specimens were also demoulded the day after casting but kept submerged in water at room temperature until the day of testing. Mixture proportions, fresh concrete properties, and mechanical properties for the three different concrete qualities are given in Table 1 (Kristoffersen et al., 2021b). (a) Wooden moulds used to cast slabs and (b) concrete slab with dimensions (in mm) (Kristoffersen et al., 2021b). Mixture proportions, fresh concrete properties, and mechanical properties for the three different concrete qualities.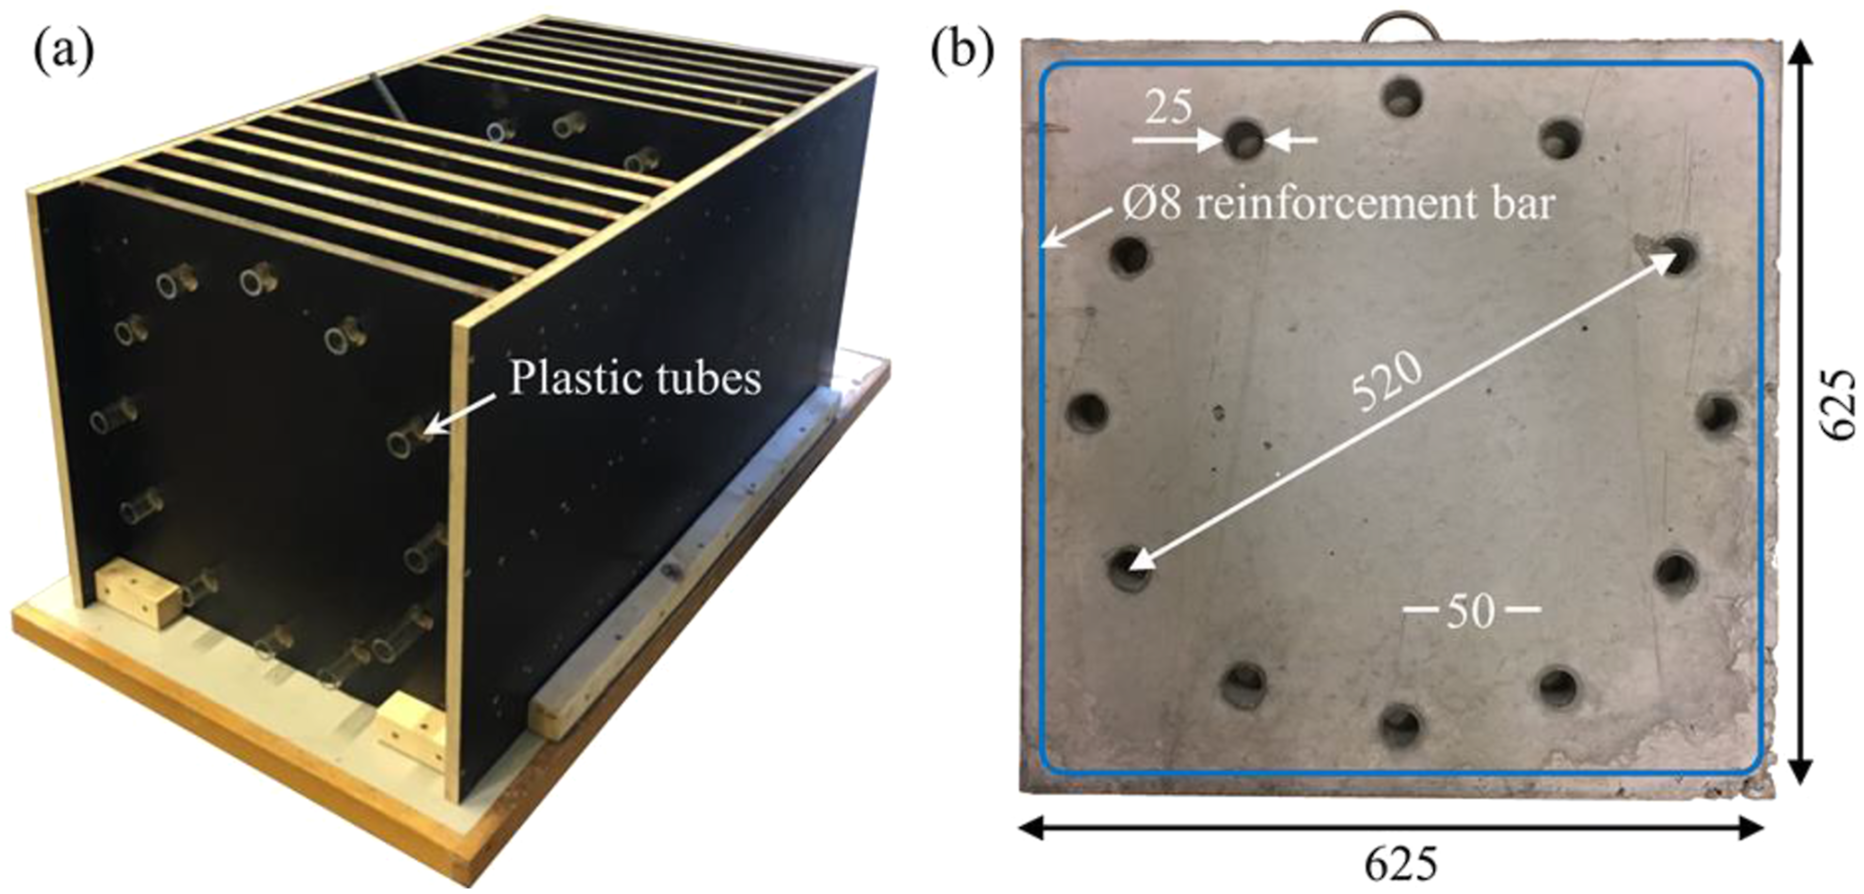
Material tests
Cylinders of diameter 100 mm and height 200 mm were cast along with 100 mm cubes. Cylinder compression, cube compression and tensile splitting (Brazilian) tests were performed on all three concretes. All tests were carried out in a fully automated Toni Tech 3000 kN load controlled rig with load rate 0.8 MPa/s for compression and 0.08 MPa/s for tensile splitting. Three repetitions were carried out for each test. Digital image correlation (DIC) using subset tracking was used to measure the engineering strains as laid out by (Kristoffersen et al., 2021b). The resulting engineering stress-strain curves are plotted in Figure 2 while other test results are given in Table 1. The standard deviations from the material tests were of the order of 1 MPa for all cases. Average engineering stress-strain curves from three repetitions of (a) cylinder compression tests, (b) cube compression tests, and (c) tensile splitting tests of all three concretes (Kristoffersen et al., 2021b).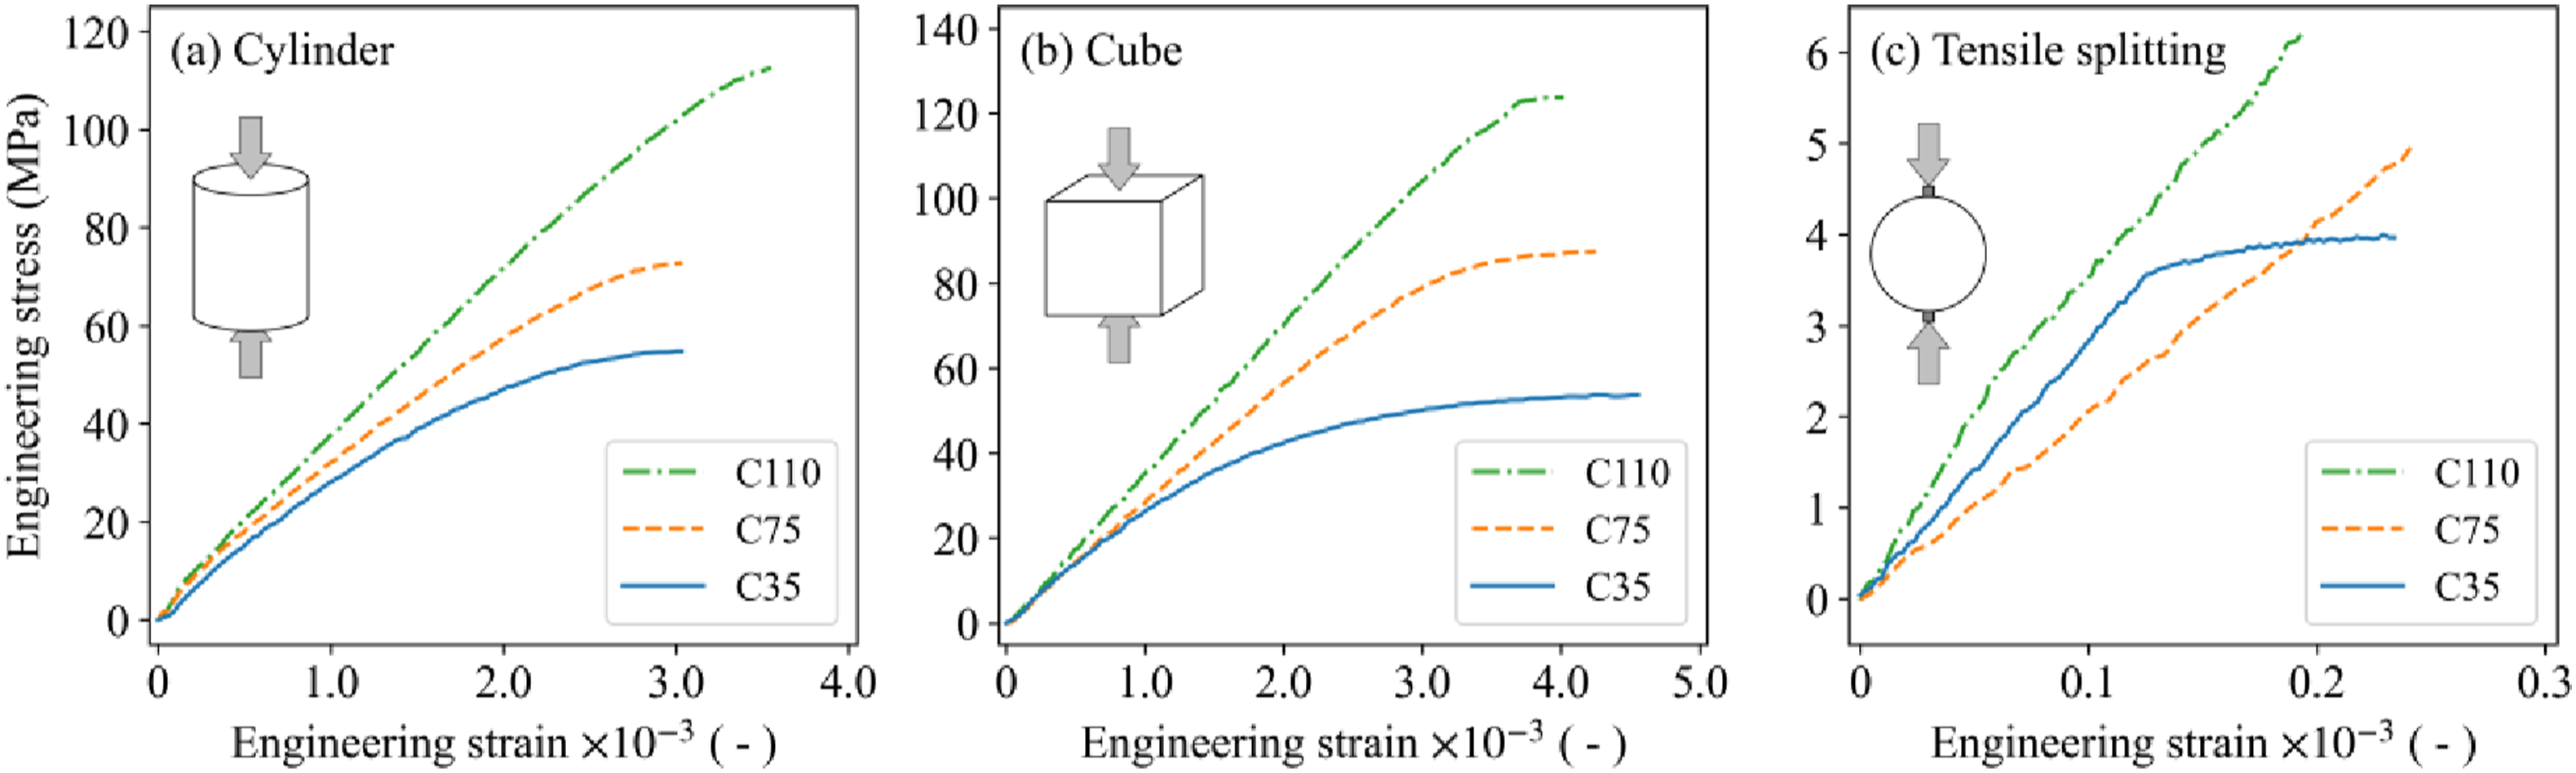
Ballistic impact test setup and results
Ballistic impact tests were carried out on the three concrete qualities in the SIMLab gas gun facility (Børvik et al., 1999). The gas gun facility comprises a 200-bar pressure tank, a purpose-made firing unit for compressed gas, a 10 m long smooth barrel of calibre 50 mm, and a closed 16 m3 impact chamber. Projectiles as shown in Figure 3 were mounted in a sabot and fired at impact velocities just below and well above the ballistic limit velocity of the concrete slabs by using compressed air. The 3D-printed serrated sabot separated immediately after leaving the barrel of the gas gun, and the sabot pieces were stopped in a sabot trap located approximately 1.5 m behind the muzzle. The projectiles were manufactured from Arne tool steel and heat treated to a Rockwell C hardness value of 53 after machining. The projectiles weighed 196 g and had a calibre radius head (CRH) of 3. Geometry of the 196 g ogive-nosed projectiles with CRH of three used for ballistic impact tests (dimensions in mm).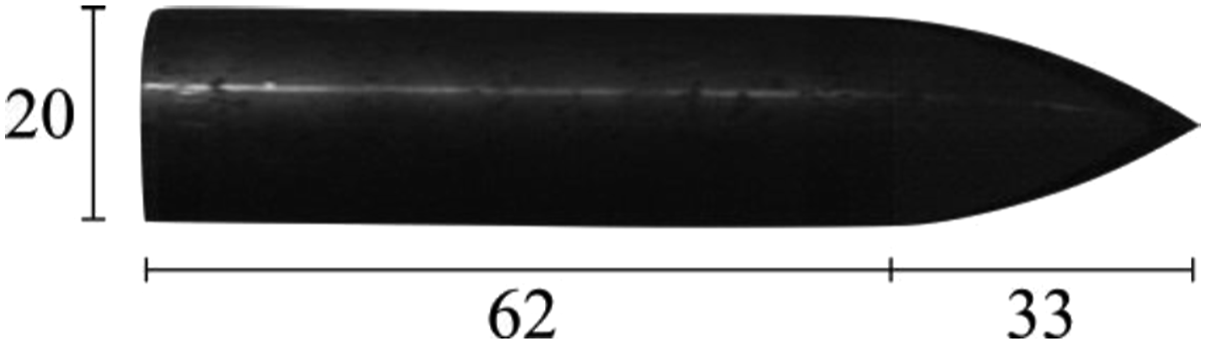
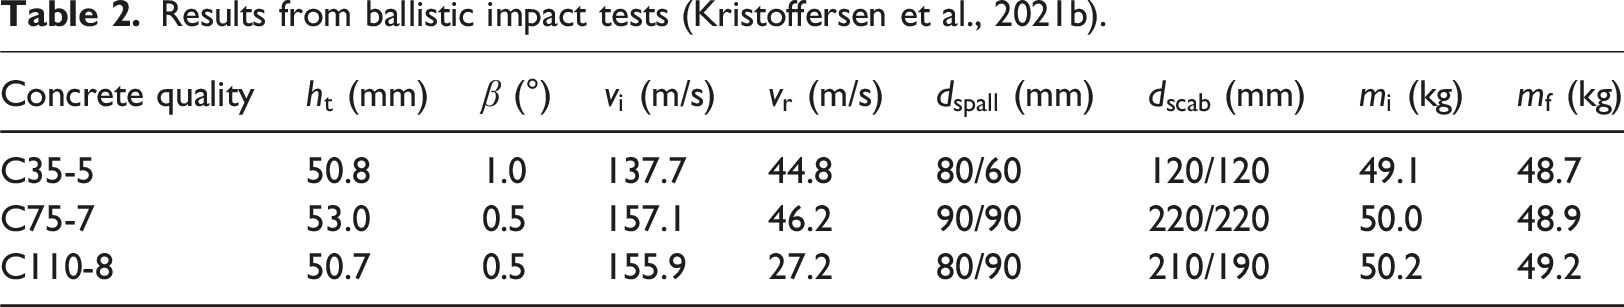
Results from ballistic impact tests (Kristoffersen et al., 2021b).
Setup for shock tube testing of concrete slabs
After the ballistic impact tests, the three slabs from Table 2 were exposed to blast-like pressure loading in the SIMLab shock tube facility (Aune et al., 2016). In addition, three undamaged slabs were exposed to the same blast load for reference. A sketch of the shock tube can be seen in Figure 4, where the driver section is pressurised by compressed air. The firing section punctures the membranes withholding the pressure and a shock wave propagates down the driven section and eventually hits the test specimen. Windows are mounted on both sides of the tank, enabling the two synchronised high-speed cameras to capture the events, filming at 37 000 fps. All specimens were painted with a speckled pattern for use with 3D-DIC, which is explained in more detail in the results section below. Pressure sensors mounted along the driven section kept track of the propagating pressure wave, while the sensors labelled one and two were used to assess the load close to the slab. The firing pressure Schematic view of the shock tube (Aune et al., 2016).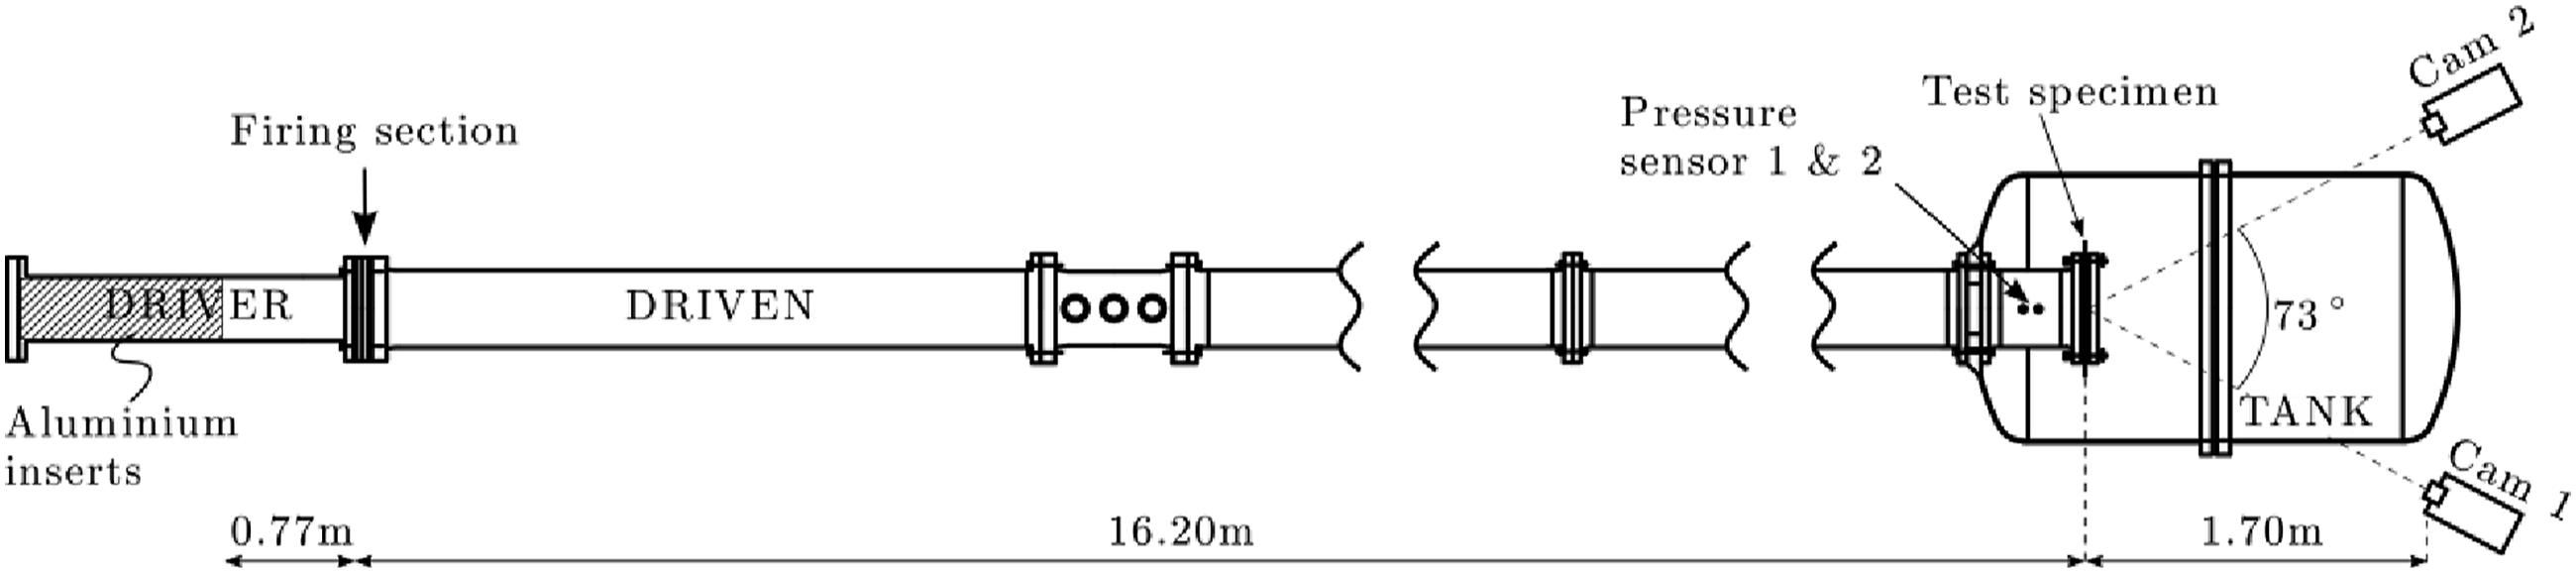
Previous work (Kristoffersen et al., 2018c) has revealed that the clamping boundary conditions of the concrete slabs are important. Thus, the concrete slabs were mounted to the shock tube using 12 bolts tightened by a torque wrench to 120 Nm. The bolts were evenly tightened to avoid skewed loading from the steel clamping frame while mounting the slab. Figure 5 shows a photograph of an undamaged concrete slab mounted to the shock tube end (left) and a rendered view cut of a 3D model of the setup (right). Photograph of a concrete slab mounted to the shock tube end (left) and a 3D rendered view cut of the setup (right). The span width in the shock tube tests was 300 mm by 300 mm.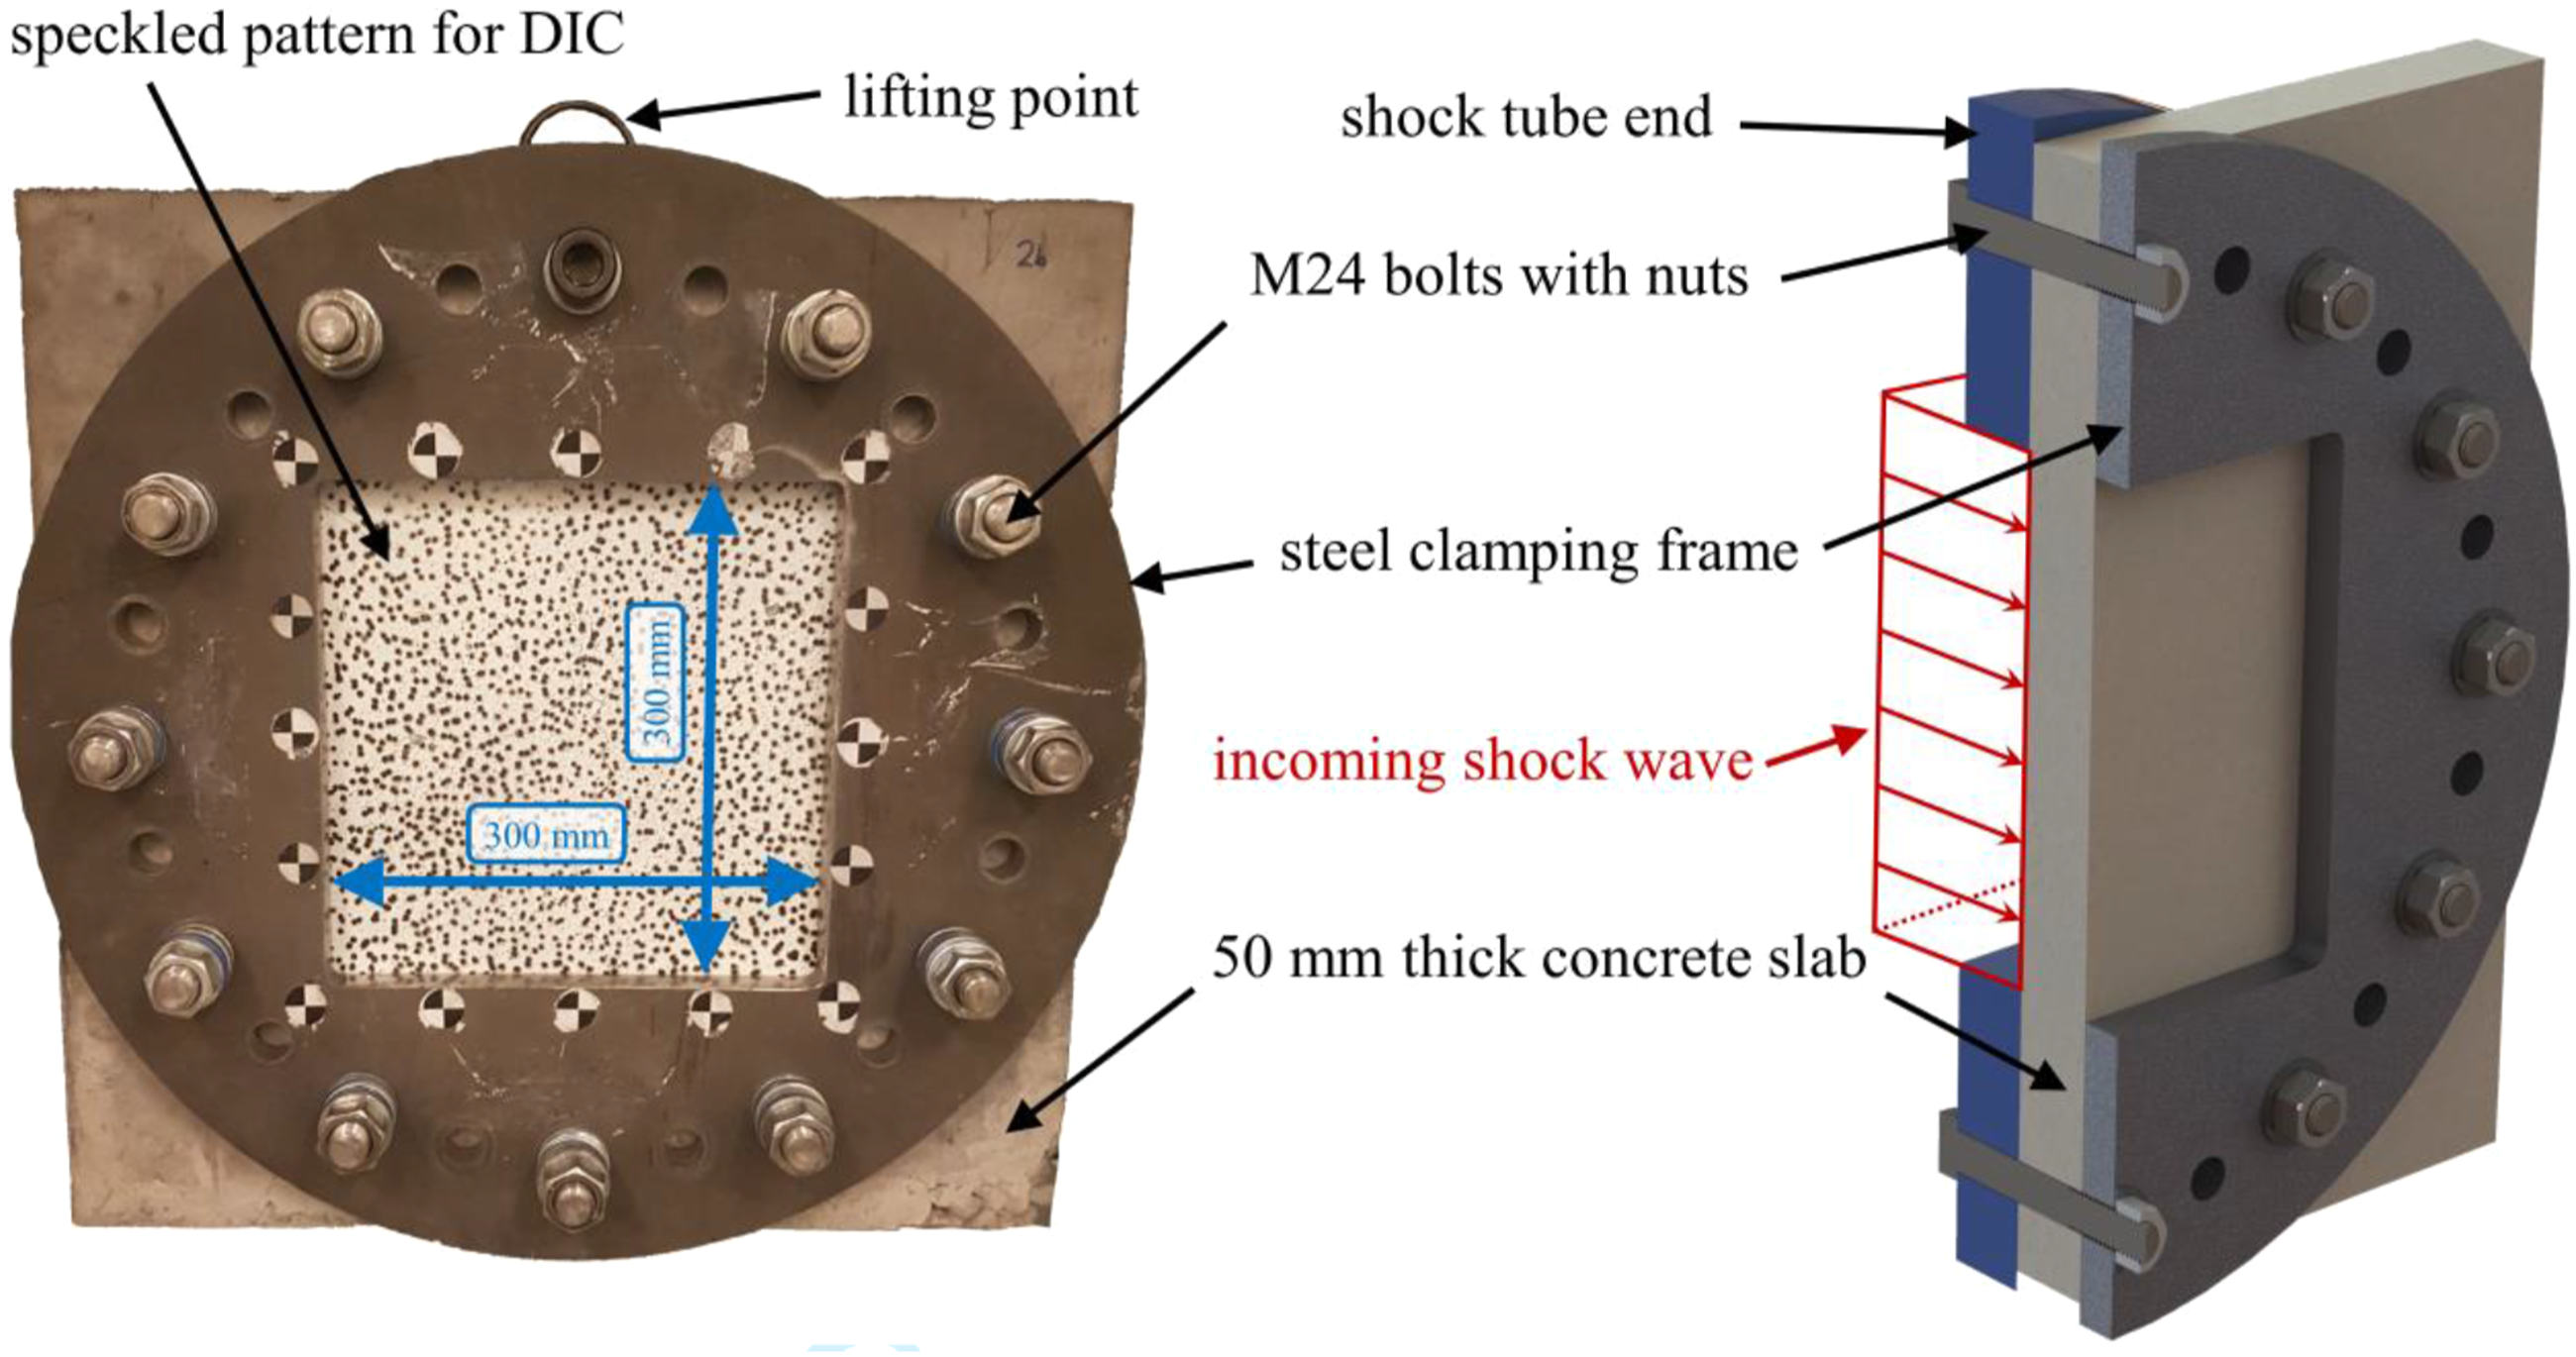
Shock tube test results
The pressure-time curves from all tests are shown in Figure 6 as logged by sensor two in Figure 4. The loading produced is seen to be repeatable and consistent, with the initial peak reflected pressure Pressure-time curves for all six concrete slabs as recorded by pressure sensor two from Figure 4. Results from shock tube tests.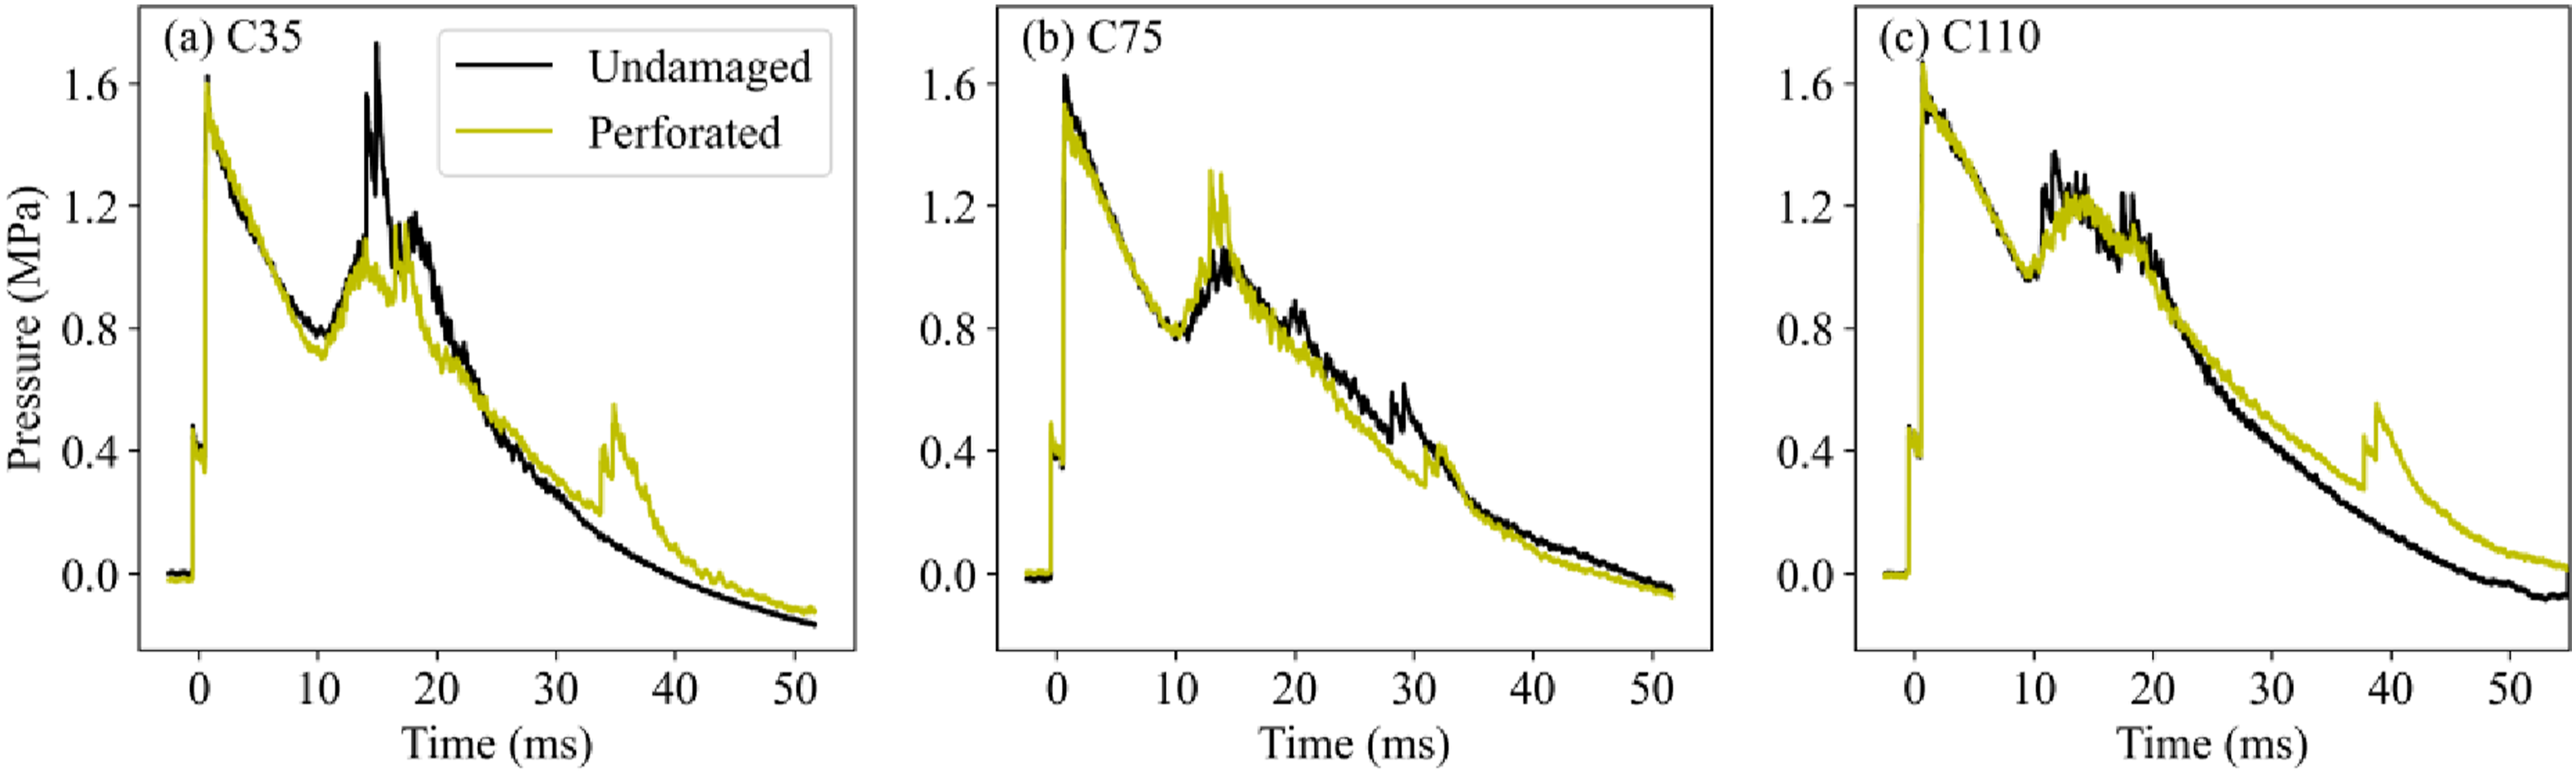
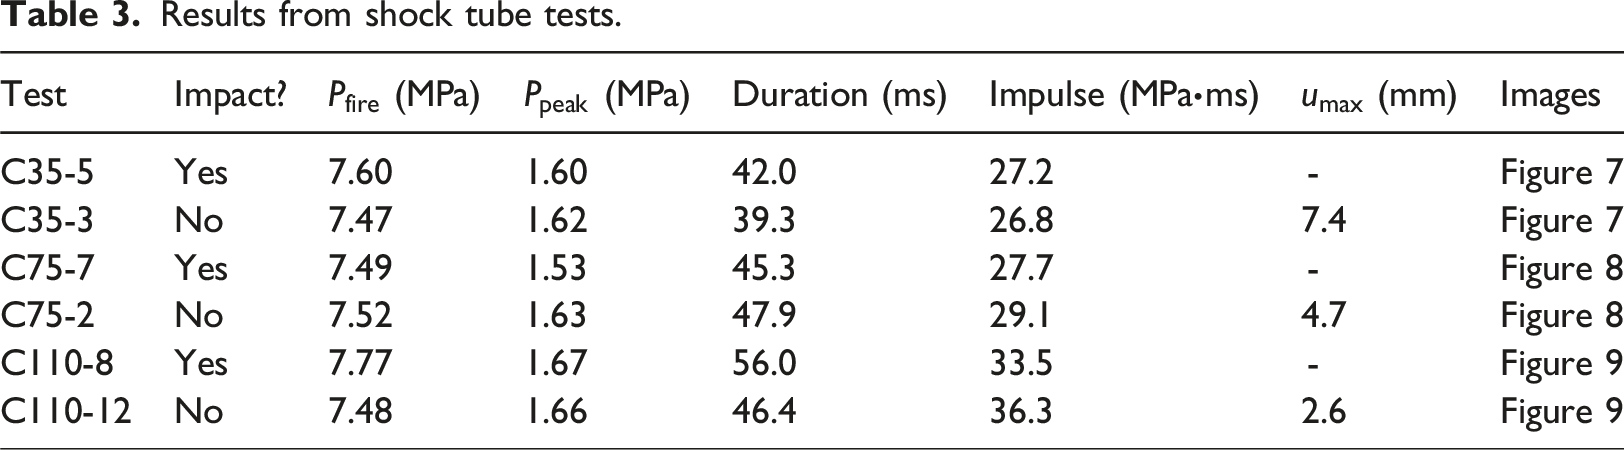
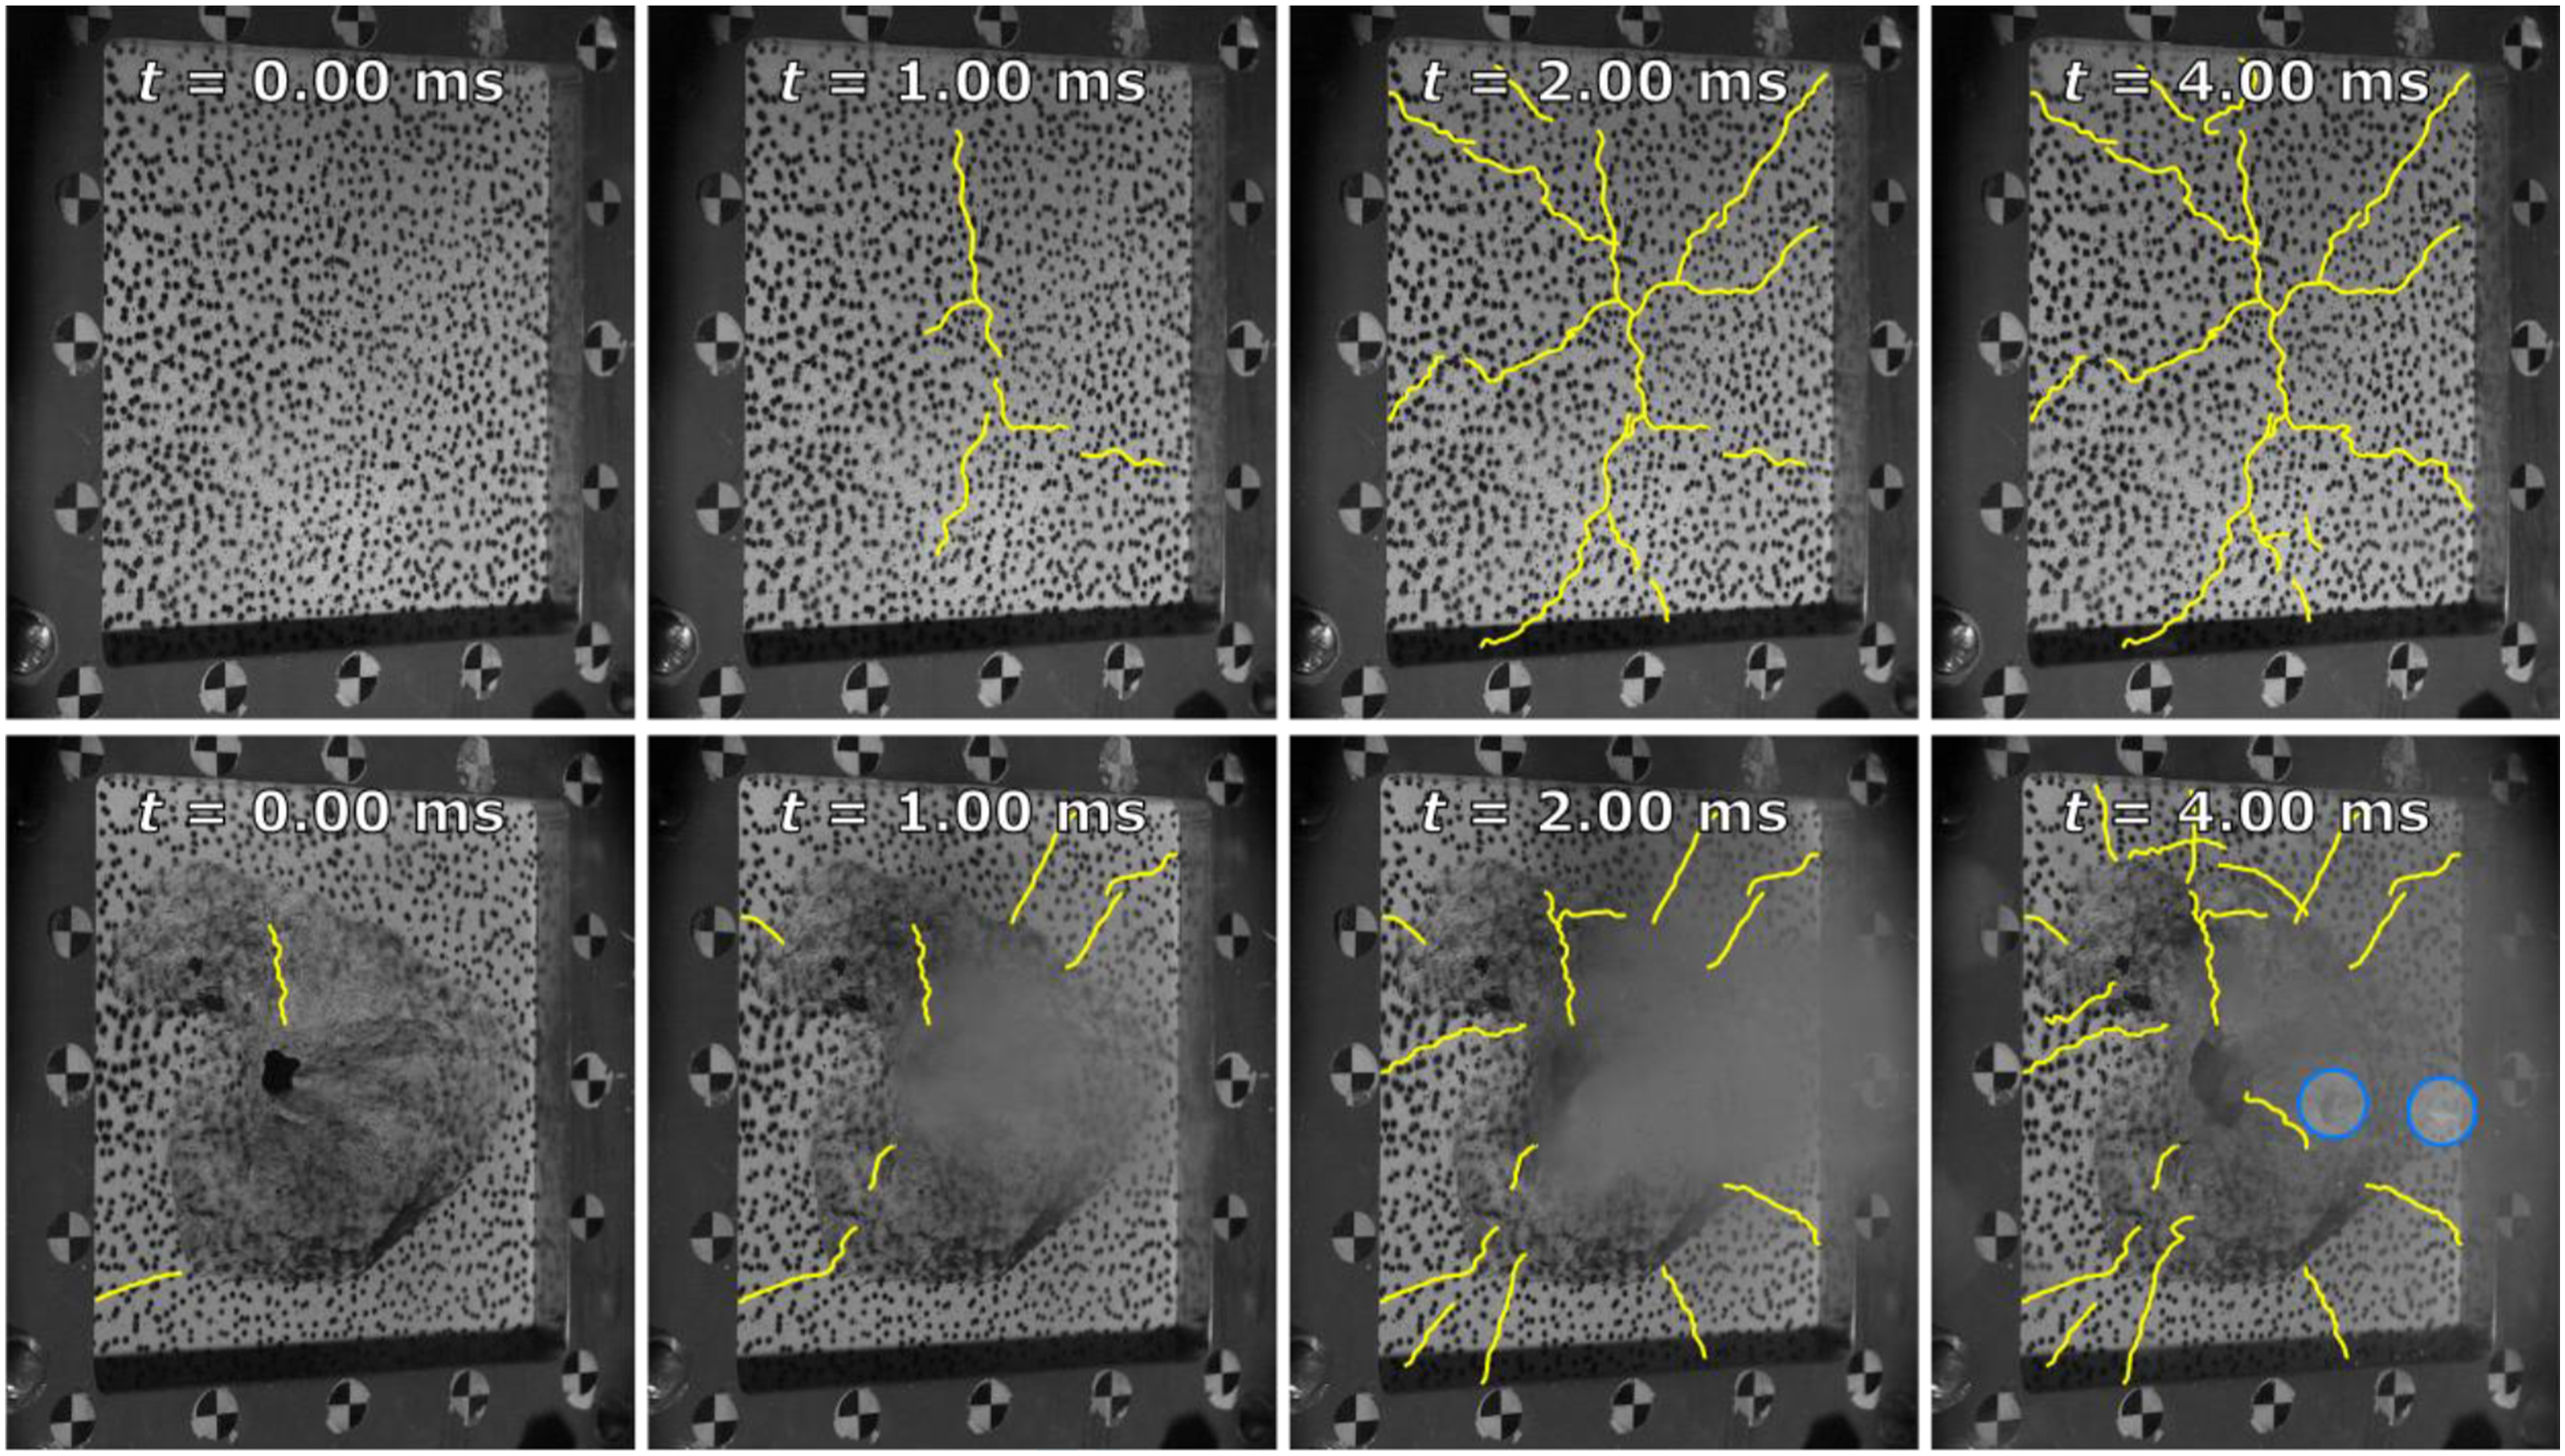
Cracks clearly developed in all six slabs, while pieces of concrete detached from the perforated slabs. The high-speed videos were essential for assessing the qualitative behaviour of the slabs. Figure 7 (C35), Figure 8 (C75) and Figure 9 (C110) show time lapses from all six tests using the images from the high-speed cameras. Yellow lines have been added after visual inspection to highlight the crack appearances. The undamaged slabs cracked in accordance with previous studies (Kristoffersen et al., 2018c), while in the perforated slabs, fragments detached due to the damage inflicted by the initial projectile perforation. In Figures 8 and 9, surface cracks were noted in the perforated slabs prior to blast loading. Further, there were no significant qualitative differences between the three concrete types when subjected to blast loading, for both the undamaged and perforated slabs. The undamaged C35 slab had cracks creating a rectangle-like central part (shown in the top right of Figure 7), while the other five slabs had diagonal cracks running through the centre area of each slab. This difference appears to be a consequence of the random nature of crack propagation in brittle materials. Time-lapse of undamaged (top row) and perforated (bottom row) C35 concrete slabs subjected to blast loading. The yellow lines imply cracks while the blue arrow in the upper right frame points to dust escaping, indicating through-thickness cracks or leakage between the slab and the frame. Time-lapse of undamaged (top row) and perforated (bottom row) C75 concrete slabs subjected to blast loading. Initial cracking prior to the blast load was noted for the perforated slab, while the blue circles in the lower right frame show fragments detaching from the same slab. Time-lapse of undamaged (top row) and perforated (bottom row) C110 concrete slabs subjected to blast loading. Initial cracking prior to the blast load was noted for the perforated slab, while the blue circle in the lower right frame shows fragments detaching from the same slab.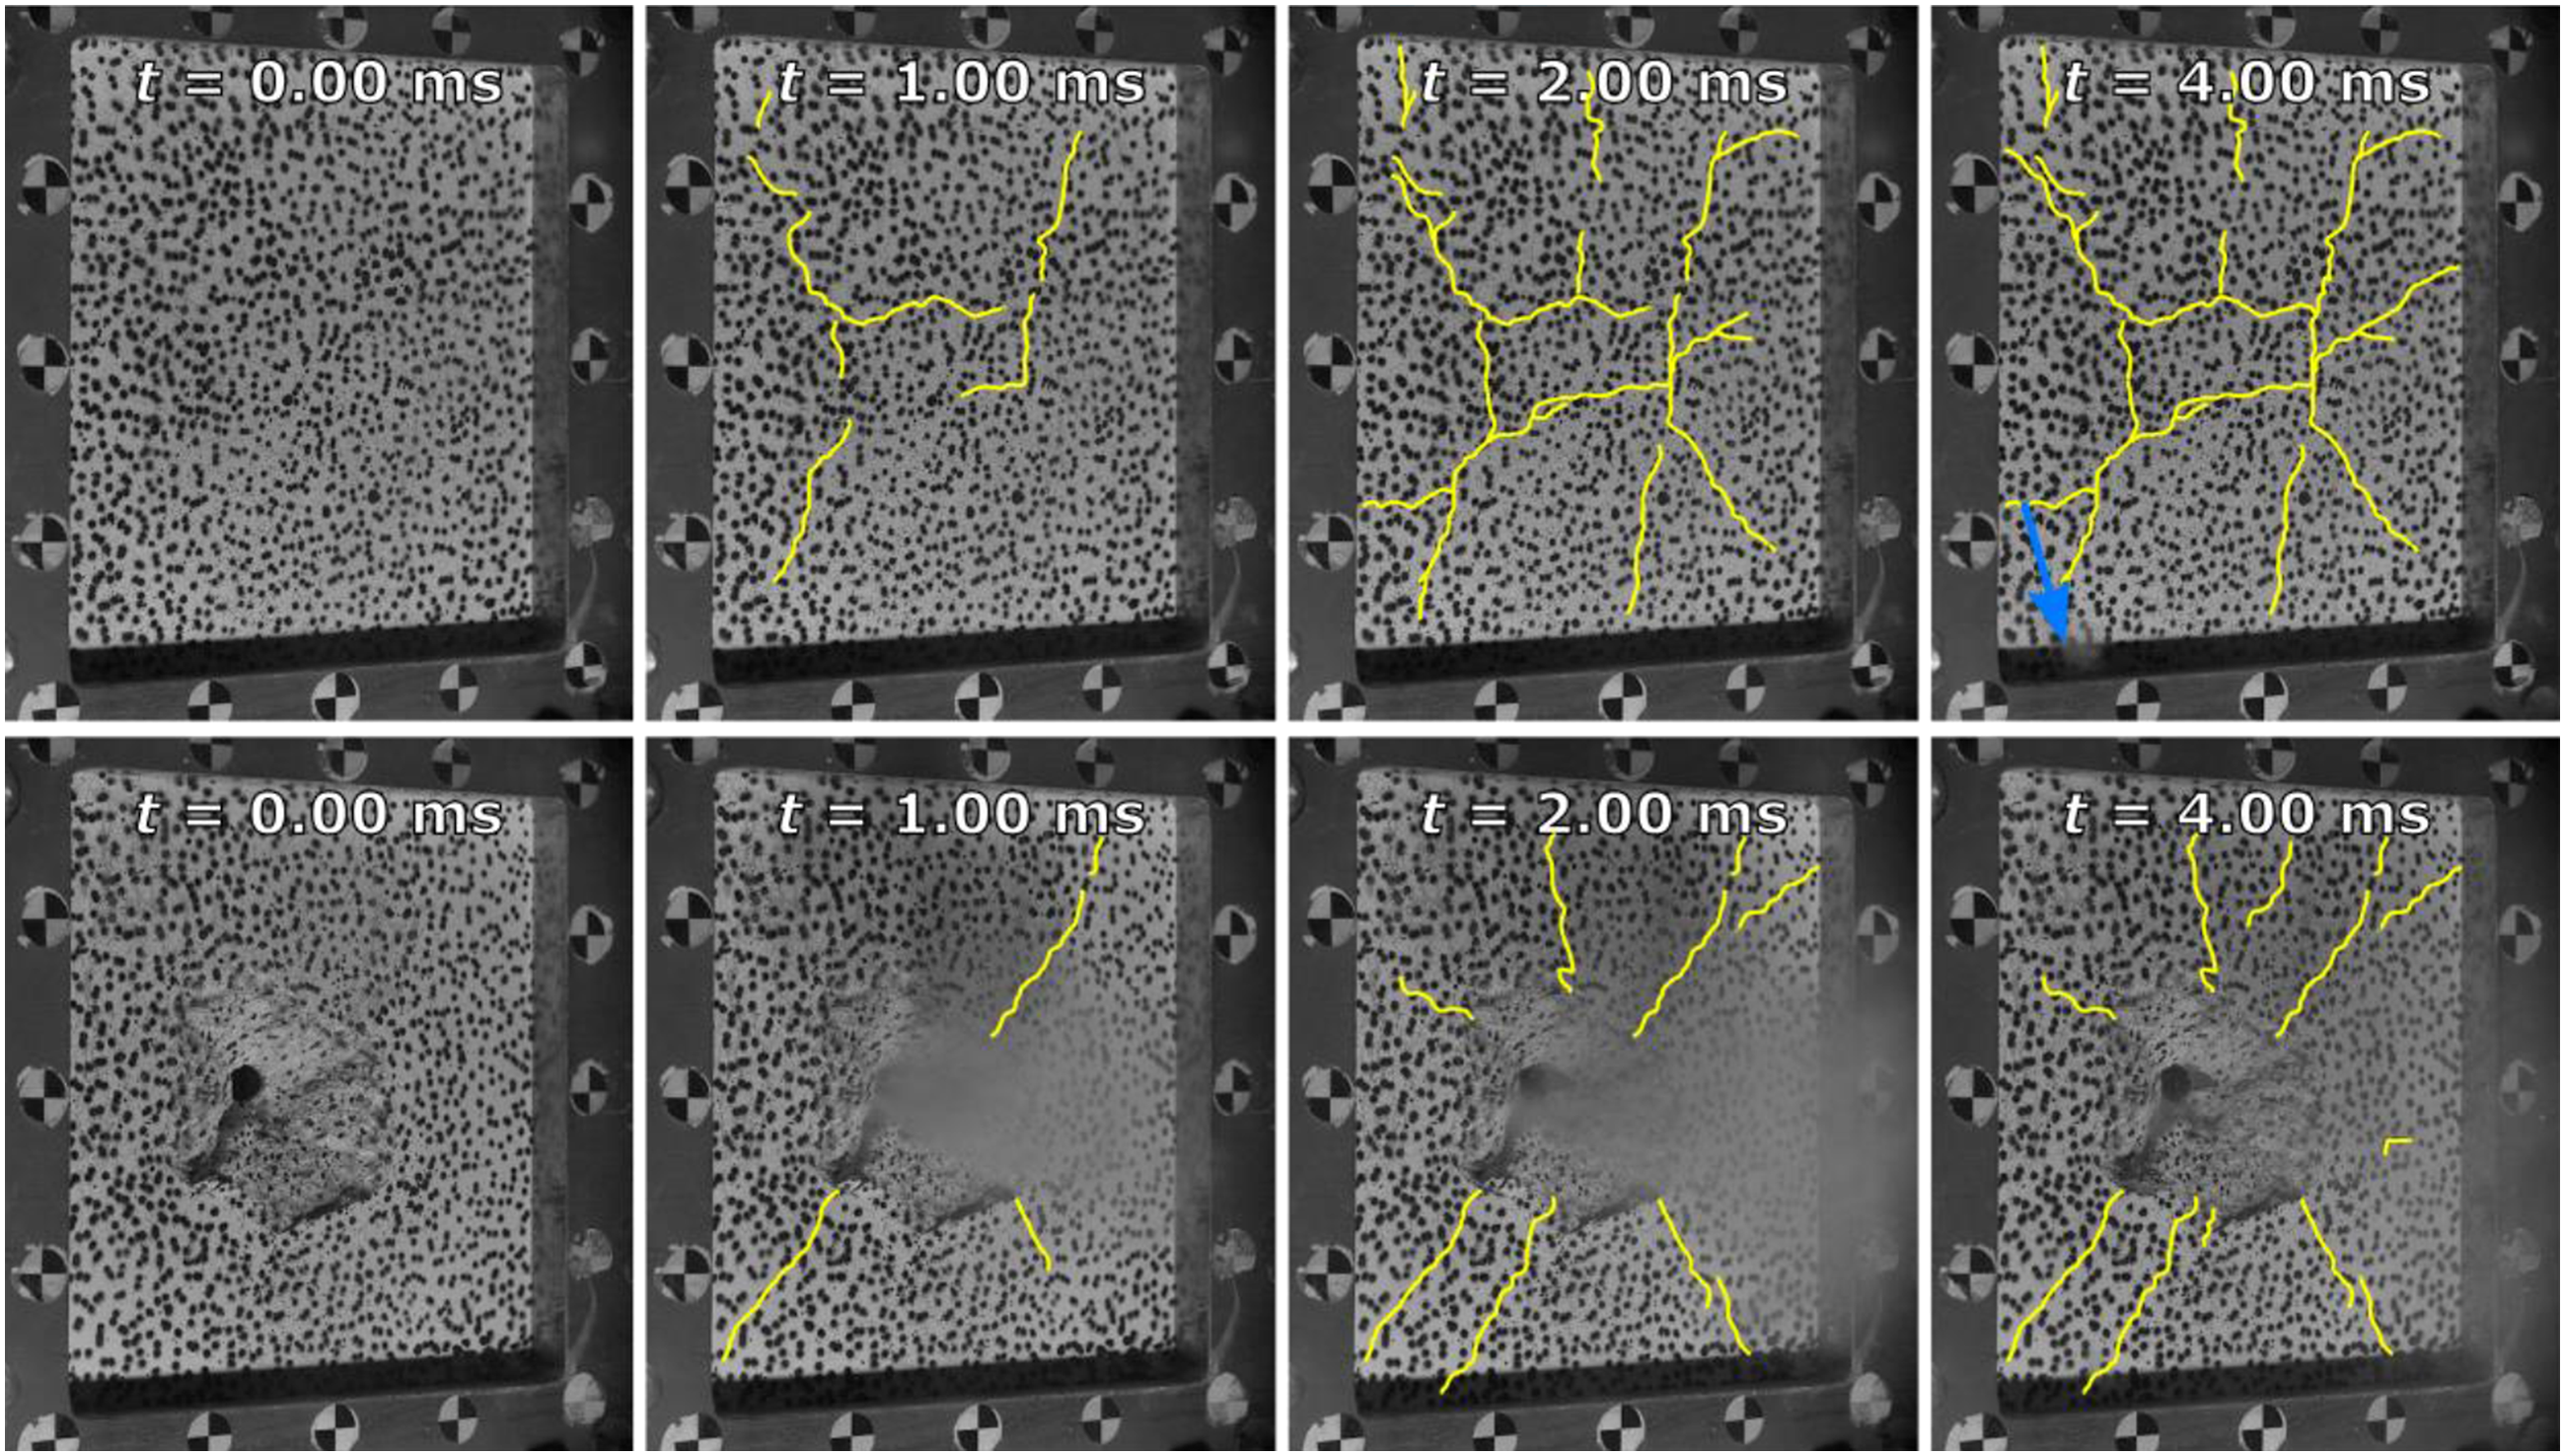
As shown in Figure 4, the shock tube setup includes two synchronised high-speed cameras. This enabled use of 3D-DIC to measure the out-of-plane deformation of the slabs after calibrating the cameras. Dual-camera setup for 3D-DIC has been used successfully for both small (Kristoffersen et al., 2018c) and large (Kristoffersen et al., 2018b) deformations. A finite element (FE) mesh was applied to the first camera view and then mapped onto the second view through a series of user-defined reference points and correlation by 2D-DIC to ensure that they represent the same surface (illustrated in Figure 10). The cylinder used for camera calibration is shown in (a), the initial finite element mesh in camera view one in (b) and the extended finite element mesh in camera view 2 (c) which enables 3D digital image correlation. The yellow squares in (b) and (c) are subsets used for tracking the rigid body motion of the frame. This case shows the undamaged C110 slab.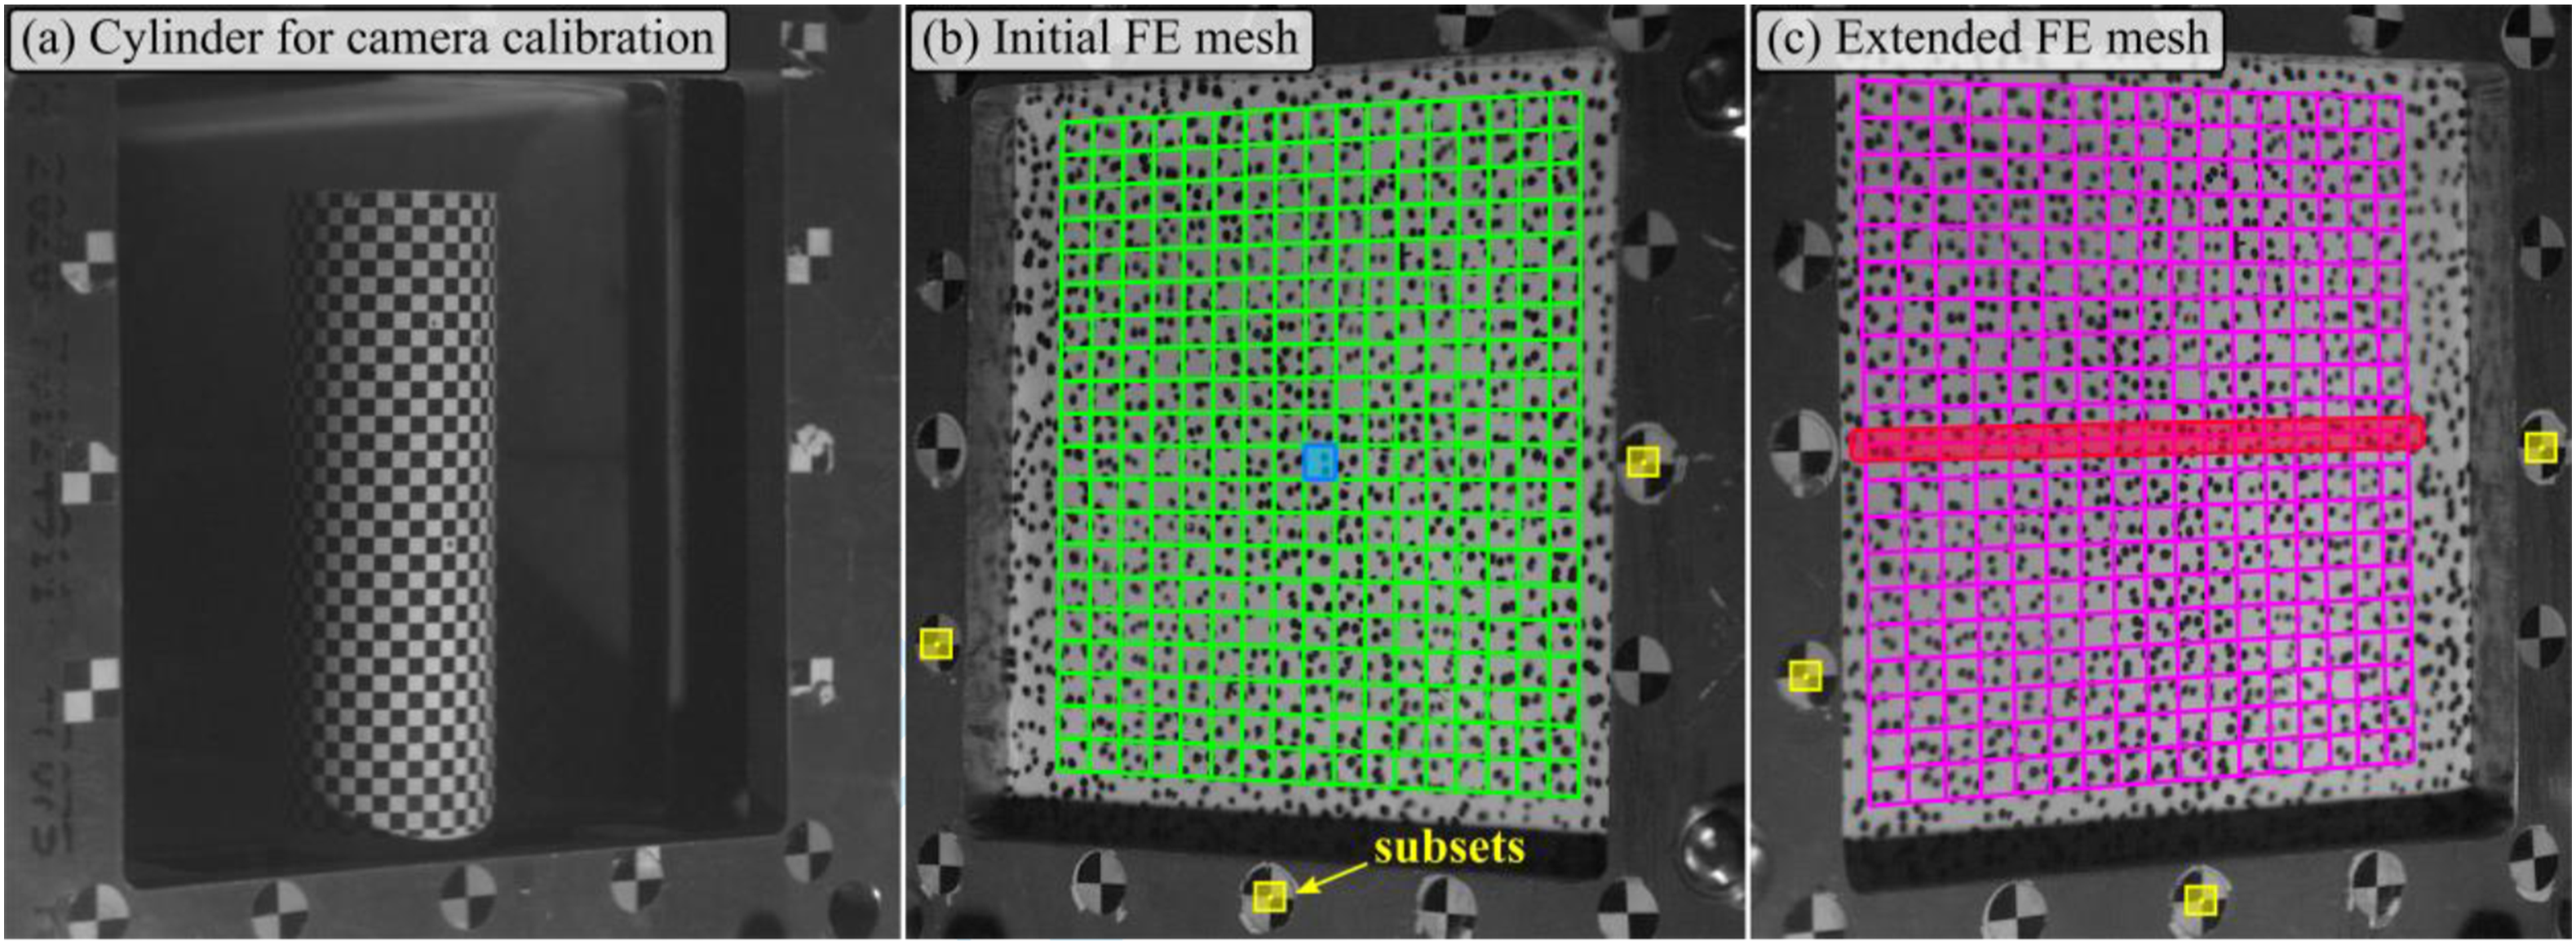
The 3D-DIC results are presented in terms of out-of-plane displacements. First, the four nodes connected to the centremost element (shown in blue in Figure 10(b)) are used to assess the midpoint displacement as a function of time. The total average out-of-plane deformation of these four nodes for the undamaged slabs are plotted in Figure 11(a). These curves include the shock tube’s rigid body motion, which is tracked by the subsets shown in Figure 10(b) and plotted in Figure 11(b). Comparisons with laser measurements have shown that the subset tracking technique employed is very accurate (Kristoffersen et al., 2018c). Subtracting the rigid body motion from the total displacement gives the relative out-of-plane deformation of the concrete slab in Figure 11(c), where the relative displacements are in line with expectations. The slabs appear to reach a “steady state” level of deformation. For the C35 slab, the deformation starts to increase at about 17 ms as shown in Figure 11(c), immediately after the secondary pressure peak, as illustrated in Figure 6(a), hits the slab. Subsequently, a secondary “steady state” deformation is attained at about 6 mm. The deformations are of the order of millimetres, demonstrating the ability of the DIC code to measure 3D displacements with high accuracy, as confirmed by the 3D scans in Figures 13 and 14. The maximum relative out-of-plane midpoint displacements Out-of-plane deformation of undamaged concrete slabs as measured by 3D-DIC, where (a) shows the total displacement, (b) the rigid body displacement of the frame, and (c) the deformation of the concrete slabs relative to the clamping frame.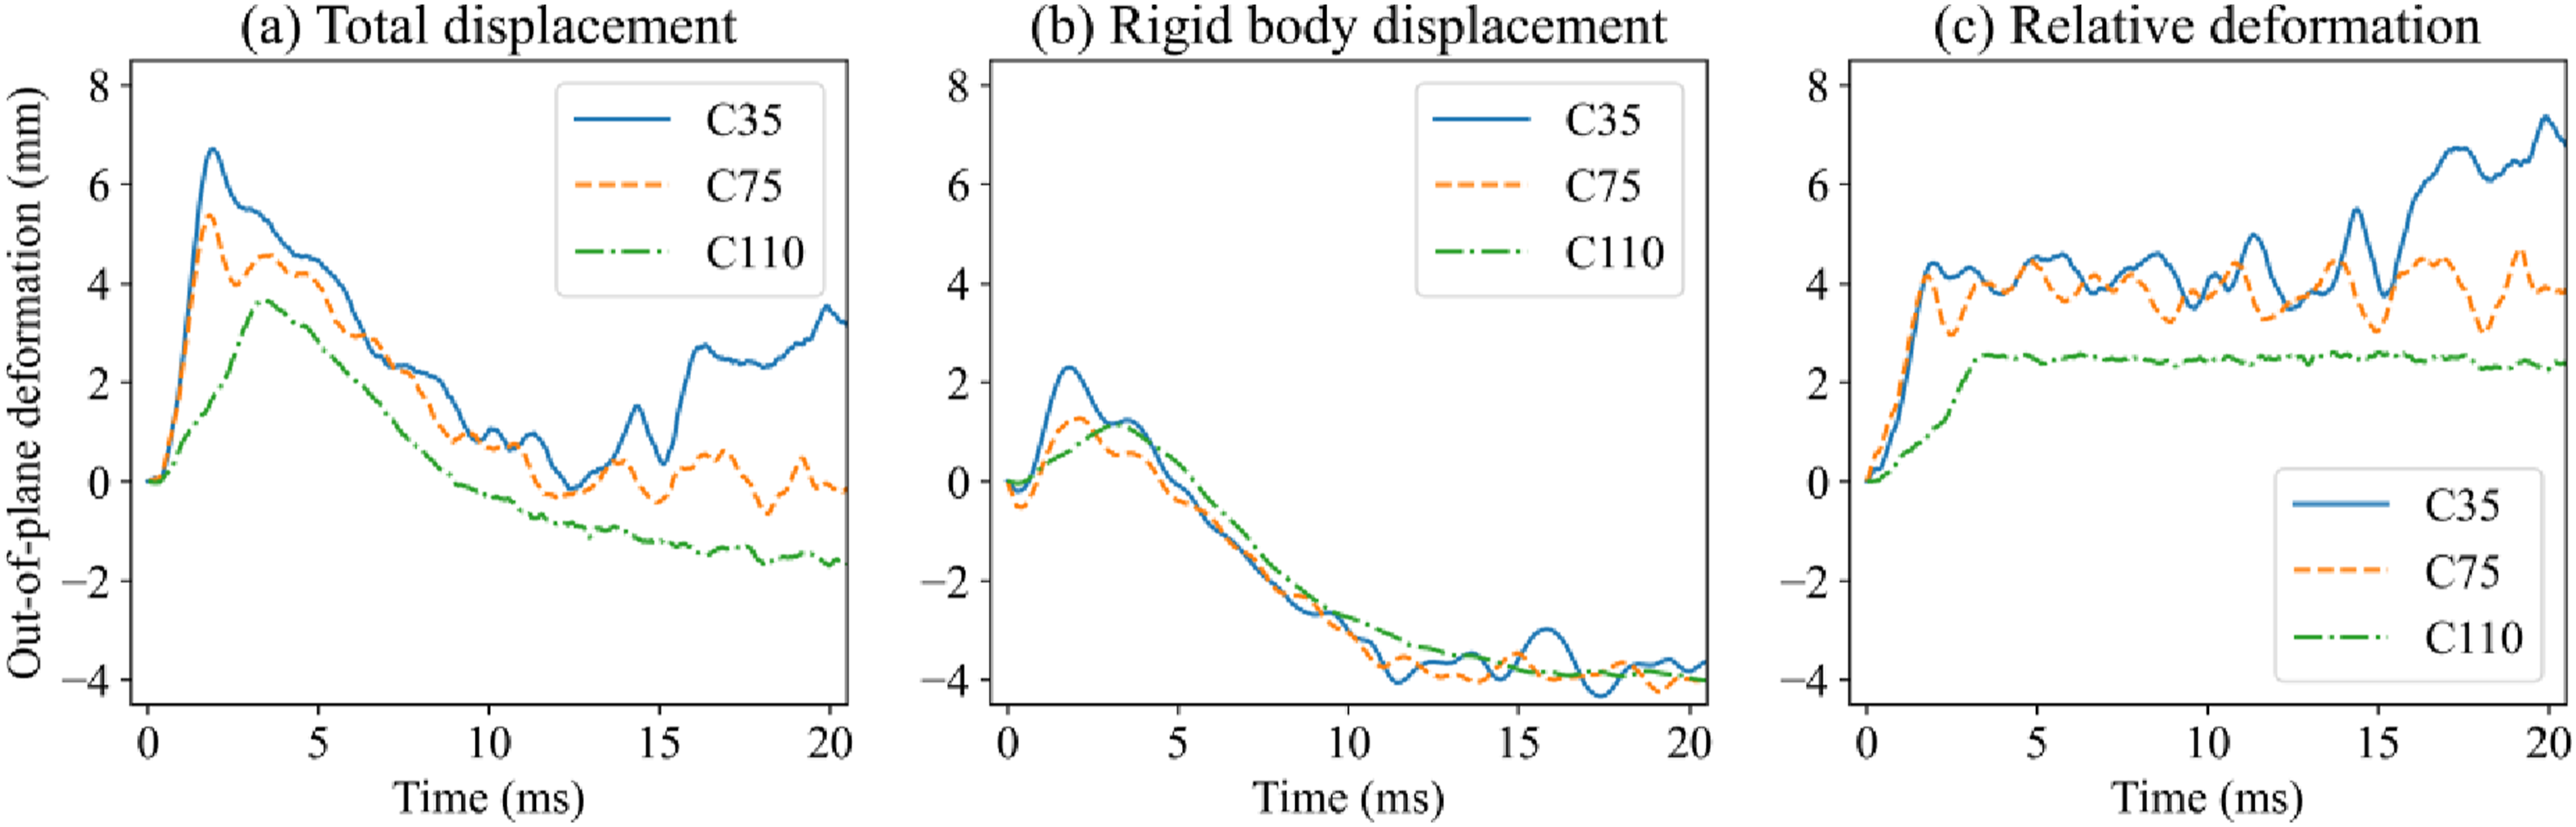
Next, the deformation profiles of the undamaged slabs are plotted for selected instances in time in Figure 12. For the C35 slab in (a), the centre rectangle-like section observed in Figure 7 can be easily recognised in the deformation profiles. The jump in deformation after about 17 ms is also captured for the C35 slab. For both the C75 and C110 slabs, the deformation profiles are in accordance with expectations and reach a “steady state” level of deformation as noted above. Their relative quantitative deformations are also as one would expect for the different concrete strengths, and again there appeared to be no significant quantitative differences between the undamaged and perforated slabs based on the deformation around the edges of the visible area of the slabs close to the clamping frame. Deformation profiles at five instances as obtained by 3D-DIC of undamaged concrete slabs.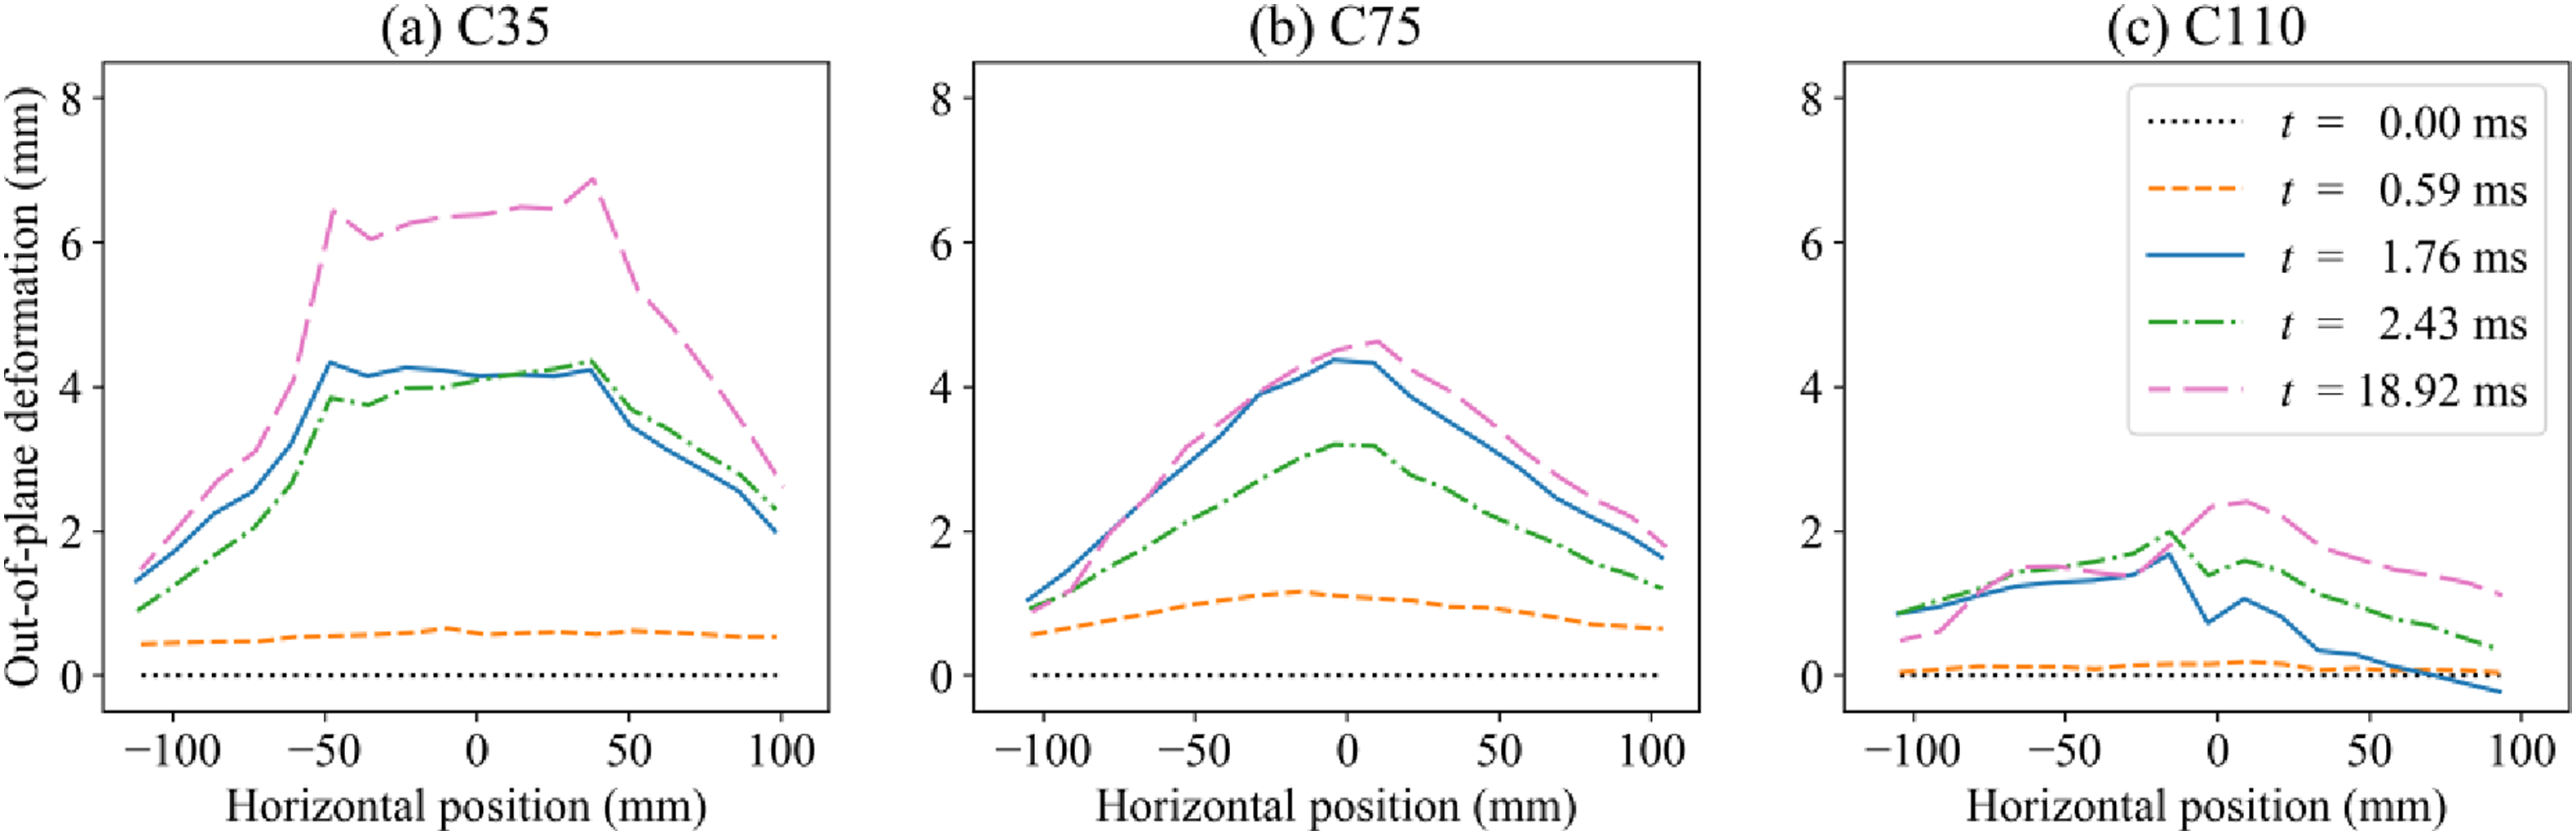
Finally, 3D scans using a ROMER Absolute Arm 7252SI, consisting of a probe and a laser scanner, were used to further assess the slabs. All slabs were scanned prior to and immediately after the blast load while still mounted to the rig. Using the undamaged C35 slab in Figure 13 as an example, the same crack pattern emerges, and the deformation profile corresponds well with the 3D-DIC measurements. Given the low magnitude of the deformations, both the qualitative and quantitative measurements are considered good. Similar results were obtained for the undamaged C75 and C110 slabs. 3D-scan of initially undamaged C35 slab after blast loading, showing a contour plot of the out-of-plane deformation in mm. The deformation corresponds well qualitatively and quantitatively with 3D-DIC measurements, showing the accuracy of the 3D-DIC measurements.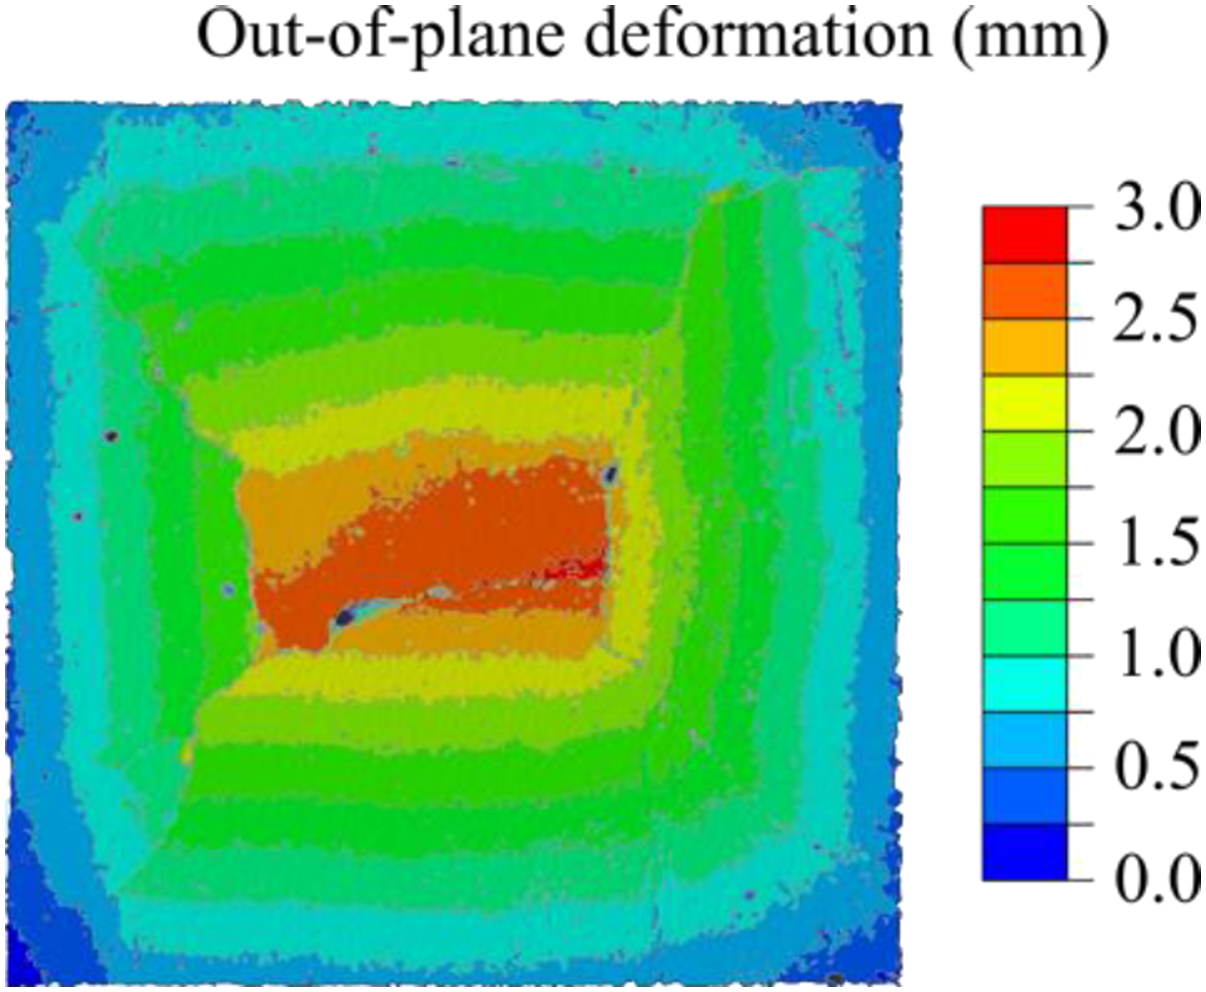
The perforated slabs were also scanned to visualise the damaged surfaces. First, the entry hole for the projectiles were – to the extent of the precision of the scanner and visual inspection – practically unchanged after applying the blast load. On the exit side, areas where fragments detached were noted in the 3D scans as exemplified by the perforated C110 slab in Figure 14. The spalling craters were confirmed to be significantly smaller than the scabbing craters, while all crater sizes remained largely the same except for some fragments detaching as mentioned. There were no notable differences between the three concrete materials aside from slightly larger out-of-plane deformations for the weaker concrete. Again, no conclusive observations were made regarding the effect of projectile perforation prior to application of the blast load aside from some fragments detaching. 3D-scan of initially perforated C110 slab pre and post blast loading, showing a contour plot of the crater depth. The yellow ellipses highlight an area where a large fragment detached (confer with bottom row of Figure 9).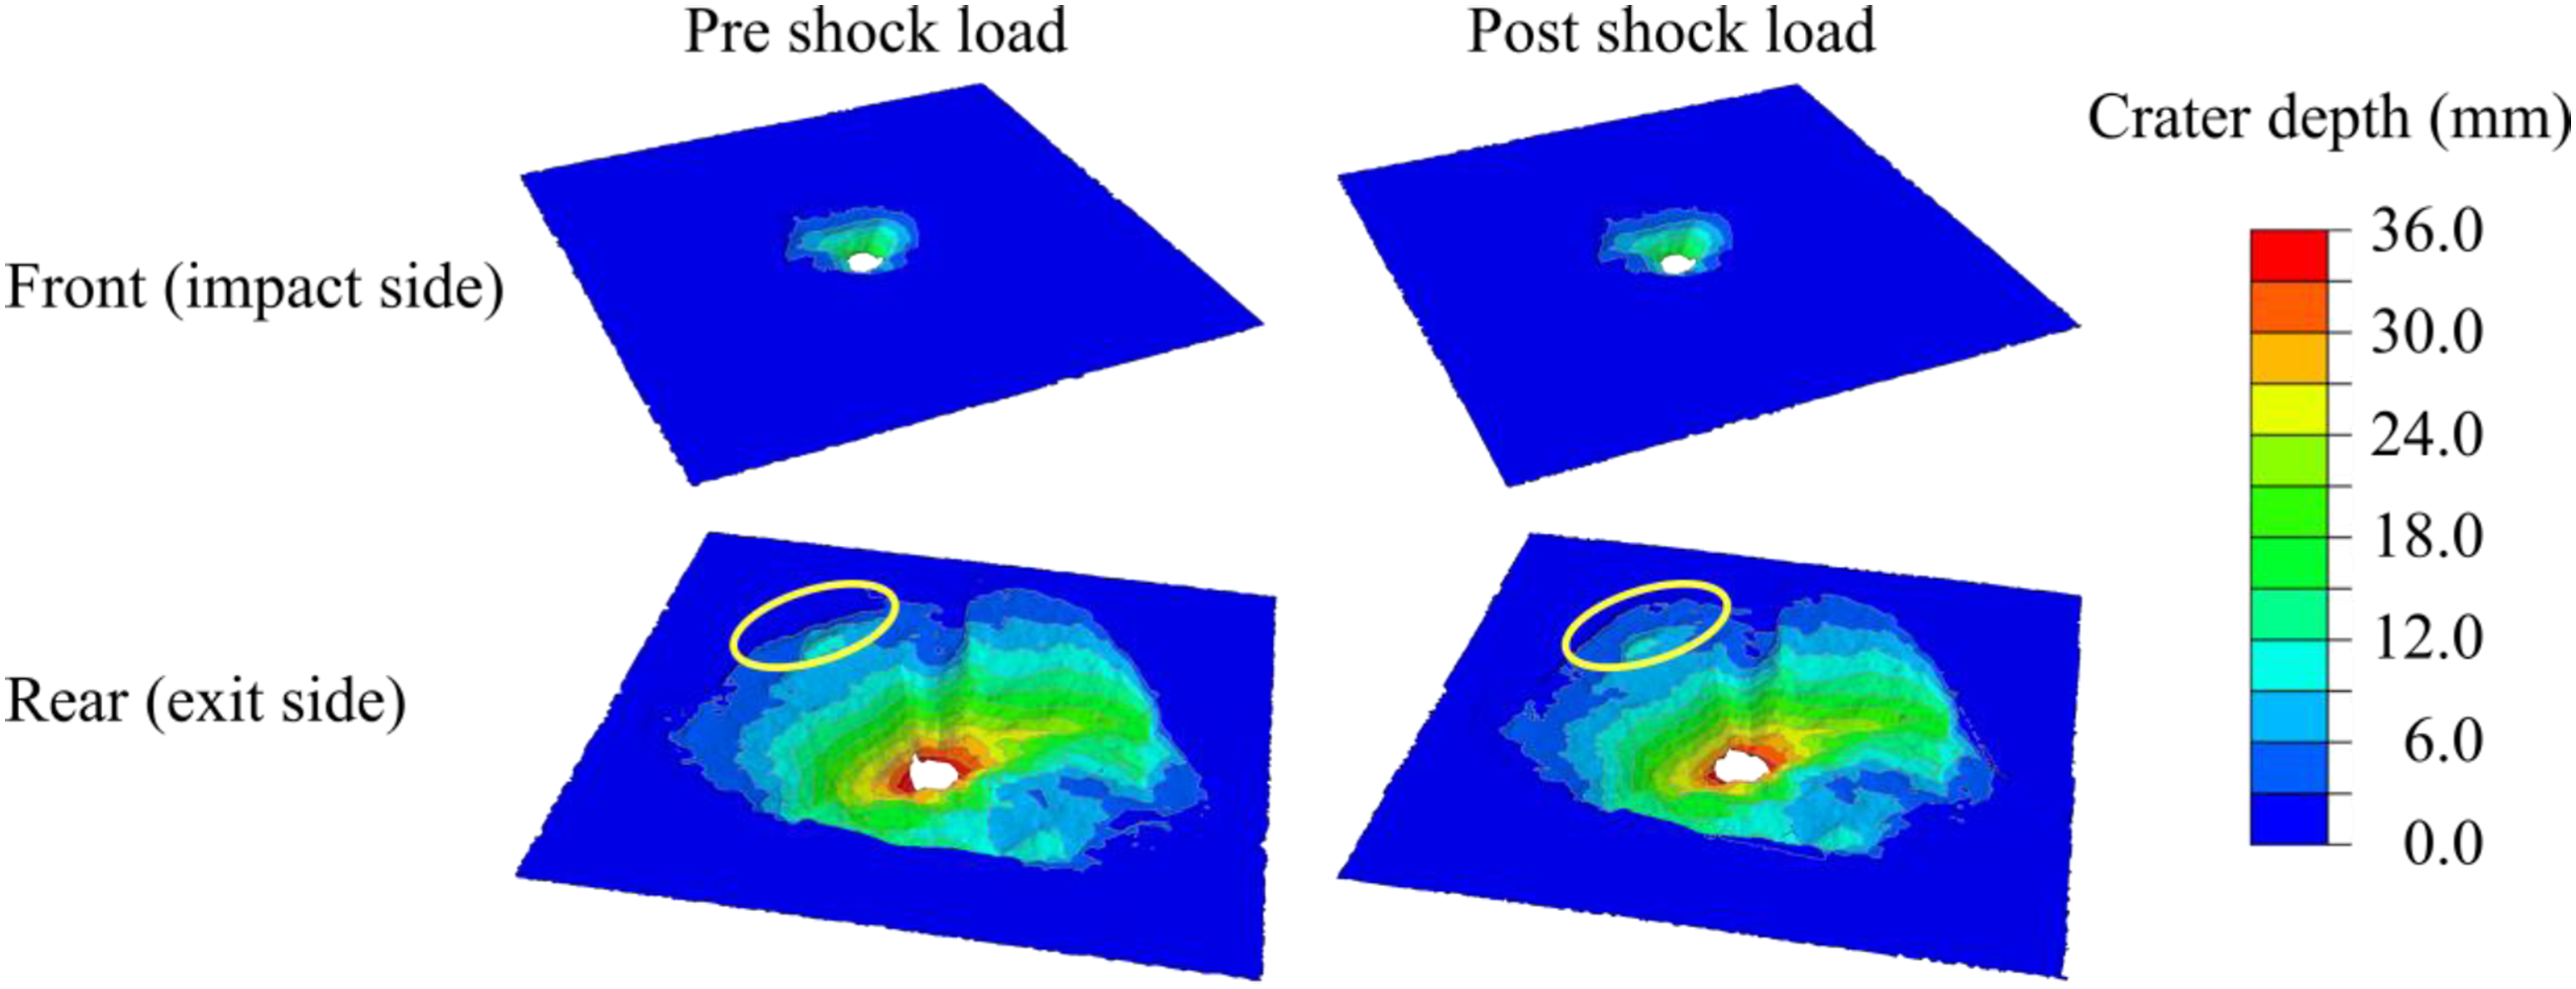
Constitutive relation and calibration
Description of concrete material model
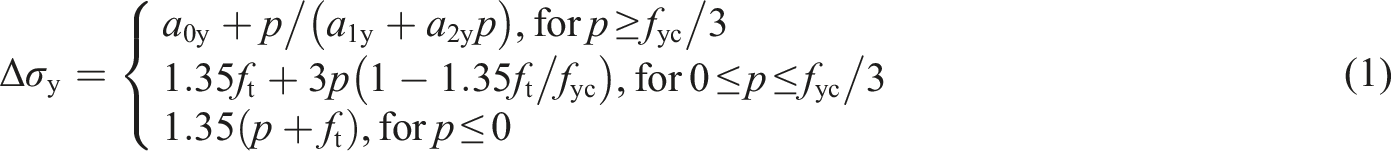
The material model chosen for this study was the Karagozian & Case (K&C) concrete model. The model features include strain hardening, strain rate hardening and damage, which make it a suitable and thus widely used model for impact and blast loading. This section briefly presents the main features of the K&C model. The K&C model uses three independent strength surfaces, namely the maximum strength surface, the yield strength surface, and the residual strength surface to describe the deviatoric behaviour. The three strength surfaces of compressive meridians are defined as follows:

The current plasticity surface is determined by interpolation between the strength surfaces in Equation (1) using a yield scaling factor 
The damage function is specified using 13 pairs of (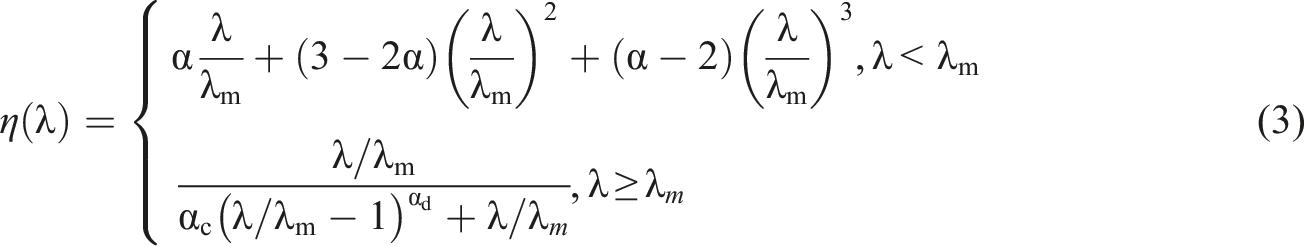
Calibration of concrete material model
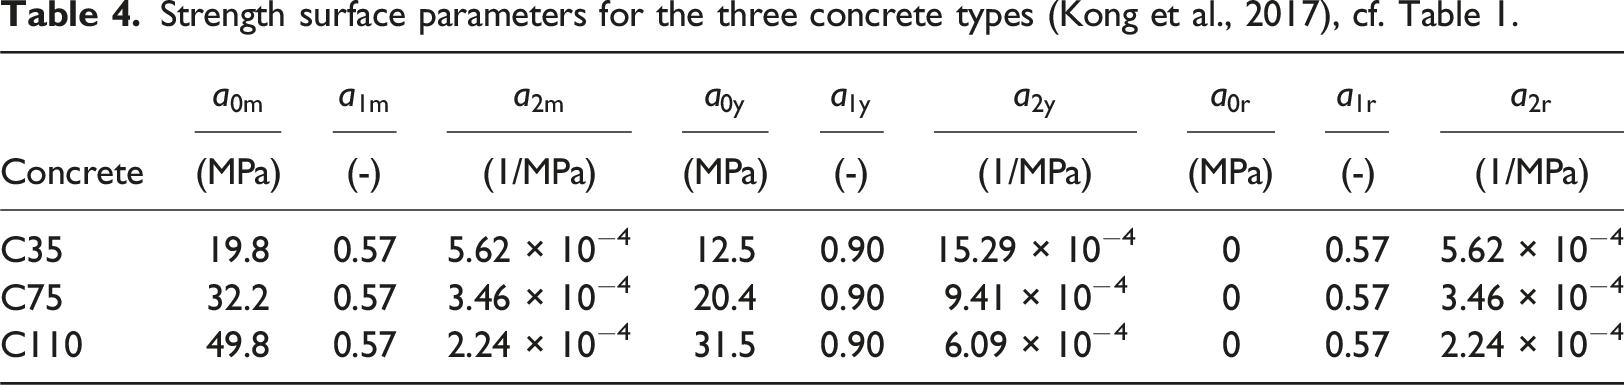
Strength surface parameters for the three concrete types (Kong et al., 2017), cf. Table 1.
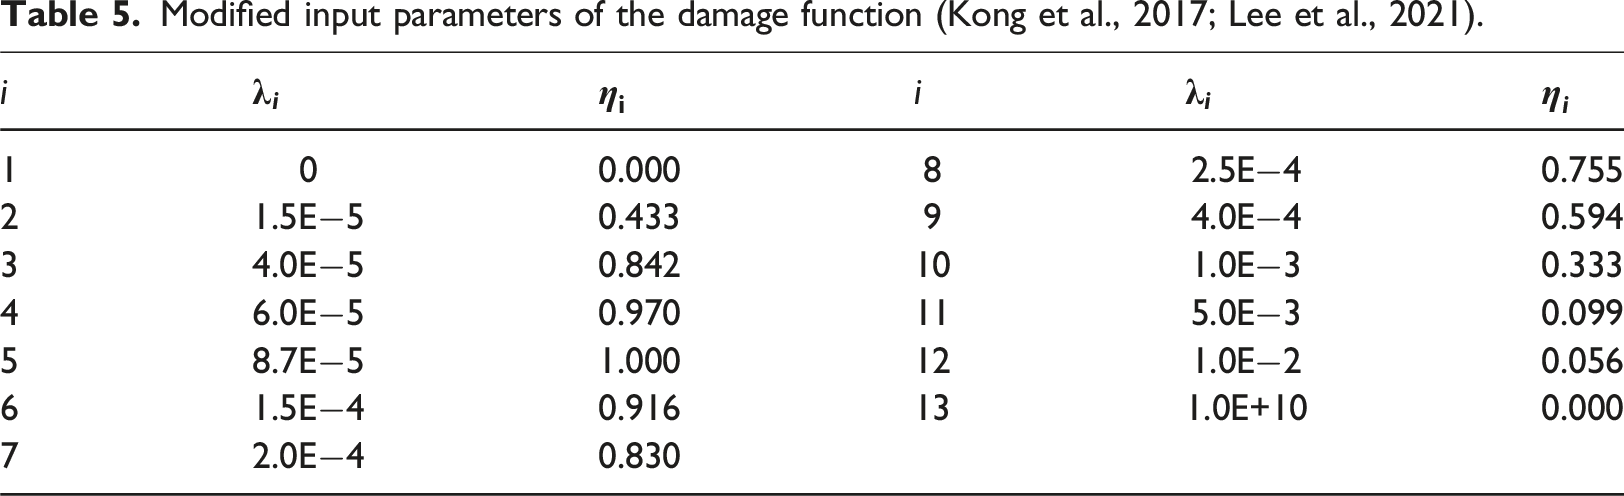
Modified input parameters of the damage function (Kong et al., 2017; Lee et al., 2021).
To describe the volumetric response of the concrete, an equation of state (EOS) is needed with the K&C model. The tabulated compaction EOS (*EOS_TABULATED_COMPACTION) was used to define the pressure-volumetric strain curve, and the EOS parameters were based on the automatic parameter generation function implemented in LS-DYNA. However, the initial bulk modulus was modified to fit the concretes used in this study. The initial bulk modulus 
To obtain the engineering stress-strain curves using the calibrated K&C model, a 2D axisymmetric model was established in LS-DYNA to simulate the cylinder compression test. The numerical model consists of the concrete cylinder, and rigid plates on the top and bottom of the cylinder. The bottom plate is fixed while the top plate moves downwards, leading to compression forces. Since the explicit version of LS-DYNA was applied, time scaling was used in the simulations of the material tests. To maintain a quasi-static material response, the strain-rate sensitivity in the material model was not activated. The cylinder was modelled using 2D-axisymmetric shell element with a size of 1.0 mm × 1.0 mm. The same element type was used for modelling the rigid plates. The configuration and dimensions of the numerical model are shown in Figure 15(a). A penalty-based contact was applied to the contact between the top rigid plate and the cylinder. The value of the friction coefficient was set to 0.4, following the range of 0.2 to 0.6 as recommended by (Baltay and Gjelsvik, 1990). Figure 15(b) shows the comparison of the experimental and numerical engineering stress-strain curves for the three concretes. The numerical model provides good estimations of the peak stress and the slope before reaching the peak load. After reaching the peak load, the numerical curve for the C110 concrete sharply decreased compared with those of the other two concretes. However, no experimental data is available to support the post-peak behaviour of the concrete model for the time being. 2D cylinder compression simulation FE model (a), and engineering stress-strain curves from experiments and numerical simulations using the calibrated K&C model for all three concretes (b).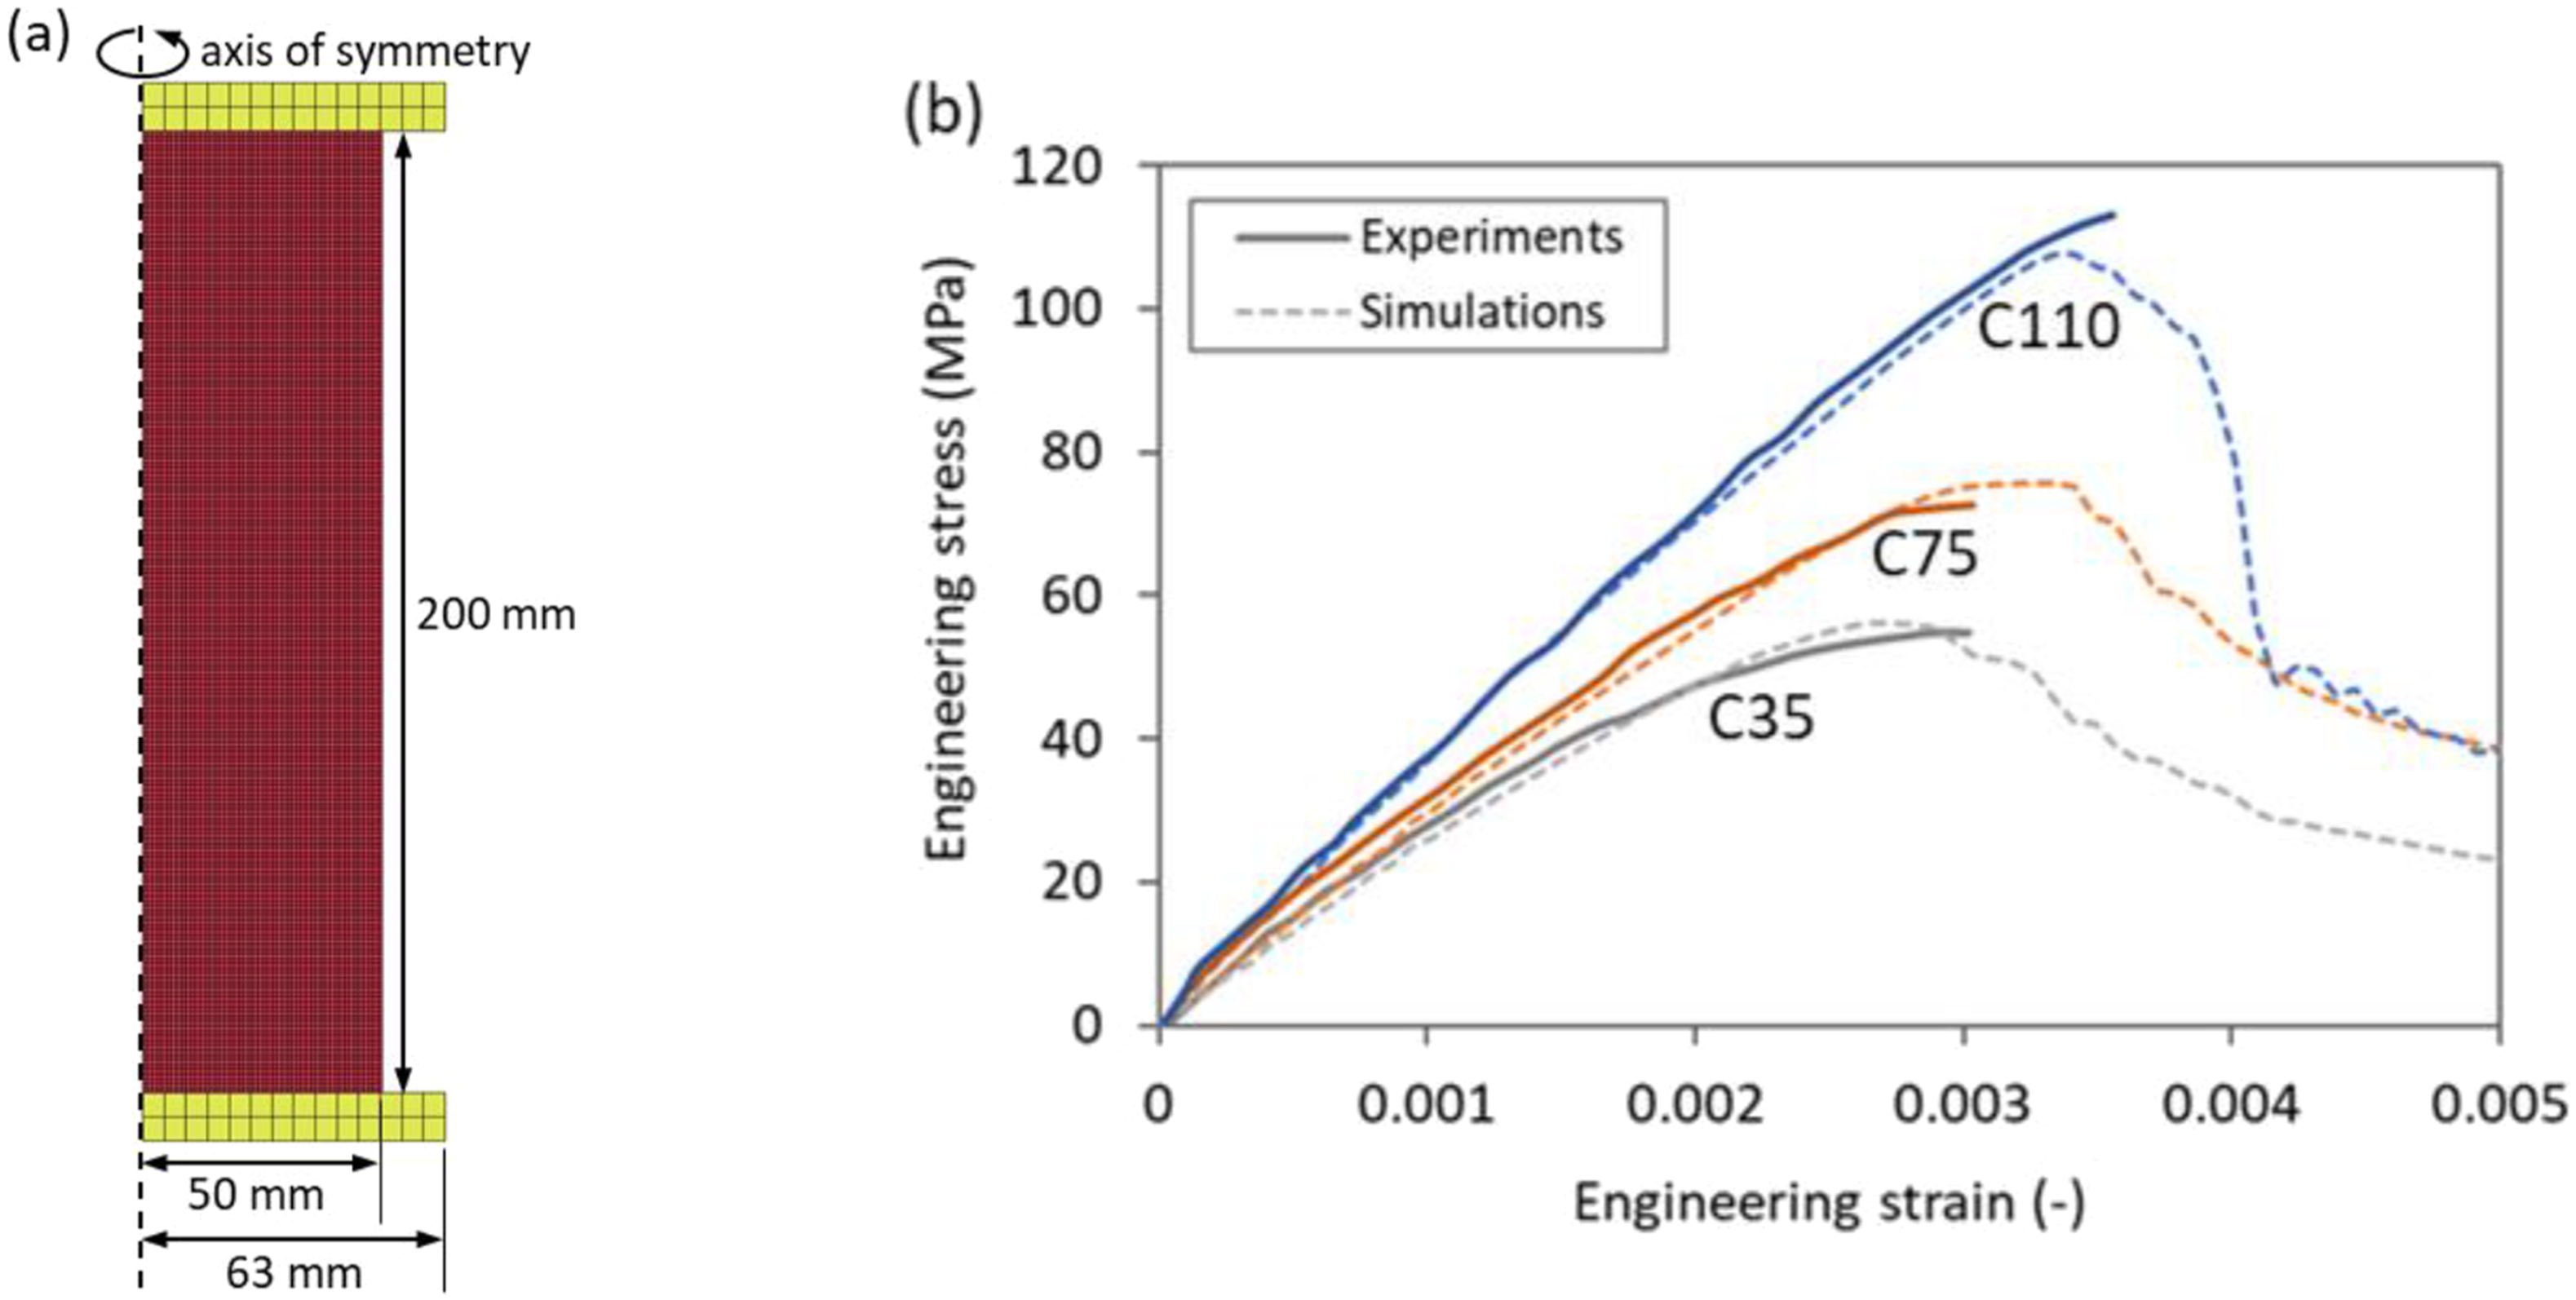
Numerical simulations
In this section, we investigate the predictive accuracy of a finite element model for projectile perforation resistance (local deformation), blast load response (global deformation), and finally the two load cases in succession. This model incorporates a suitable concrete constitutive relation, calibrated based on standard material tests, inverse modelling and data selected from the literature. A structure with existing damage from projectile perforation may completely rupture when a subsequent blast load is applied (Elveli et al., 2023); the damage caused by the projectile impact may act as a trigger for collapse. The constitutive relation and boundary conditions are thus important to achieve correct results. The former is presumed to be as accurate as presently obtainable with dynamic and triaxial material data taken from the literature (confer Figure 15), while the latter will be investigated through various modelling choices.
Geometry, discretisation, and model setup
Both a 2D axisymmetric model and a full 3D model were constructed to simulate the ballistic impact tests, and the modified K&C model was employed in both numerical models. The concrete slab in the 2D model was discretised by the same element size of 1 mm as used in the cylinder compression simulations to minimise mesh dependency based on a computational cell approach (Ruggieri et al., 1996) which has worked well in previous studies (Antoniou et al., 2023; Jacobsen et al., 2023; Kristoffersen et al., 2021b). The axisymmetric slab was modelled with an effective span length of 520 mm because this is the diametral distance between the bolt holes, and no damage was noted outside the bolt holes. The 2D automatic single surface contact algorithm in LS-DYNA was used. The details of the geometry and discretisation for the 2D ballistic impact model can be seen in Figure 16. A sketch of the numerical setup for 2D axisymmetric ballistic impact simulations where the yellow line indicates a fixed boundary.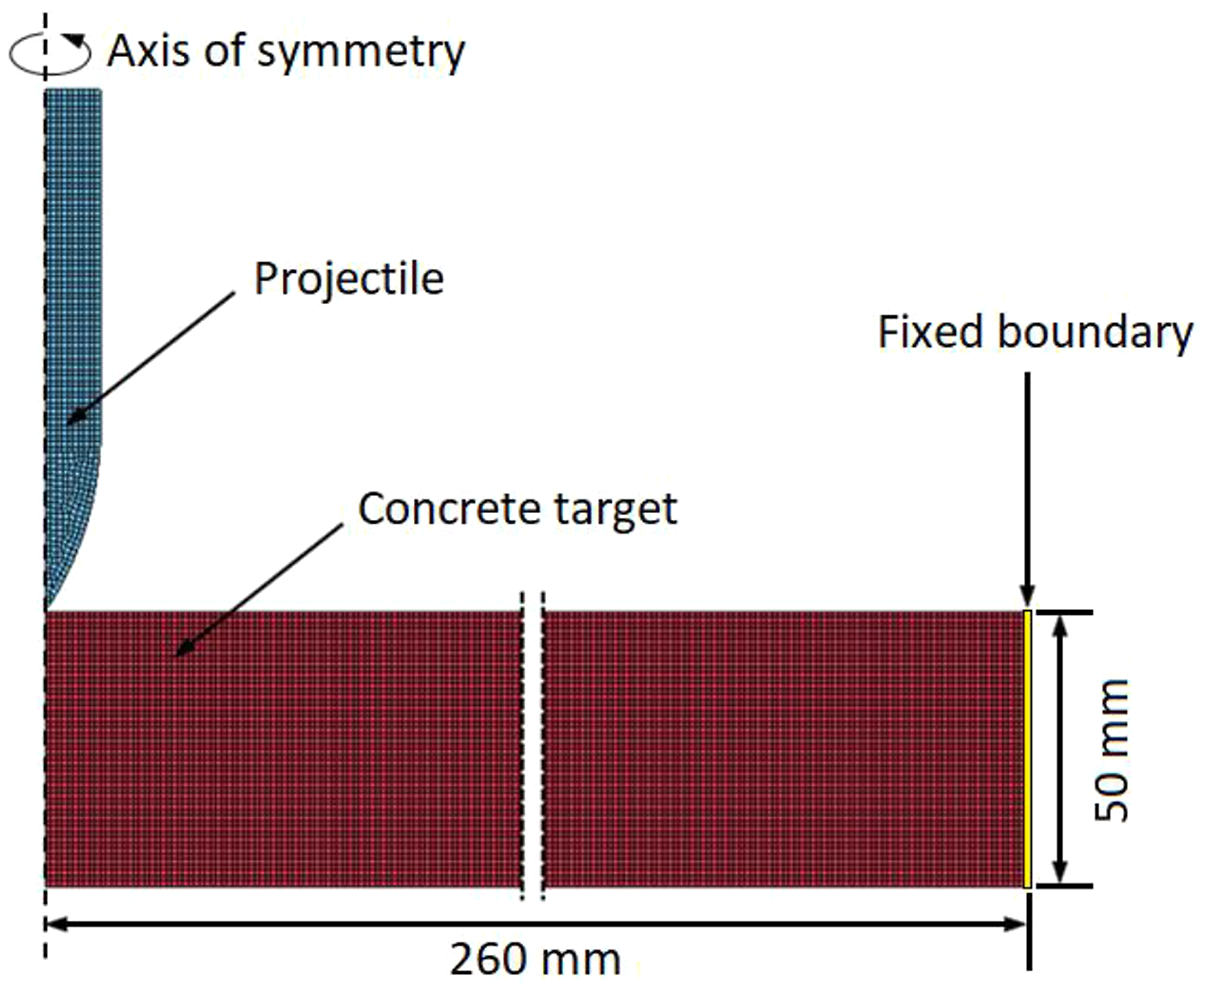
Figure 17 shows the two types of 3D slab geometries used to investigate the effect of bolt holes on the results of the impact simulations. One slab uses an effective span length of 520 mm without bolt holes, while the other has the full length of 625 mm including bolt holes, which are needed to provide more realistic boundary conditions in later blast simulations. The slab was modelled with solid elements of varying sizes to reduce the CPU time. Regardless of the presence of bolt holes in the 3D models, the centre region of the slab where contact with the projectile occurs was modelled by fine elements with side lengths of 1 mm as in the 2D model using a computational cell approach (Ruggieri et al., 1996) to reduce mesh size dependency and to avoid recalibration of the material model. The element size increased from 1 mm in the centre of the slab to 10 mm for the outer rim (see Figure 17). A surface-to-surface contact algorithm between the slab and projectile was adopted for the 3D model. Global translational constraints were applied to the slab edges in both the 2D and 3D models. The material properties of the three concrete types used in the simulations are summarised in Table 1. Dynamic increase factors (DIFs) for compression and tension were needed to consider the strain-rate effect on the strength, and the CEB-FIP model (Beton CE-Id, 1993) was adopted as the DIF equation for all three concretes. More information on DIF equations can be found in the CEB-FIP model code (Beton CE-Id, 1993). To mitigate or limit possible inertial effects in DIF values, a constant DIF for strain rates above 300 s−1 was employed. The hardened projectile was assigned a Young’s modulus of 204 GPa, a yield stress of 1900 MPa, and a density of 7802 kg/m3 (Kristoffersen et al., 2021b). The numerical setup for 3D ballistic impact simulation and details of discretisation in the centre region. (a) The slab model without bolt holes. (b) The slab model with bolt holes.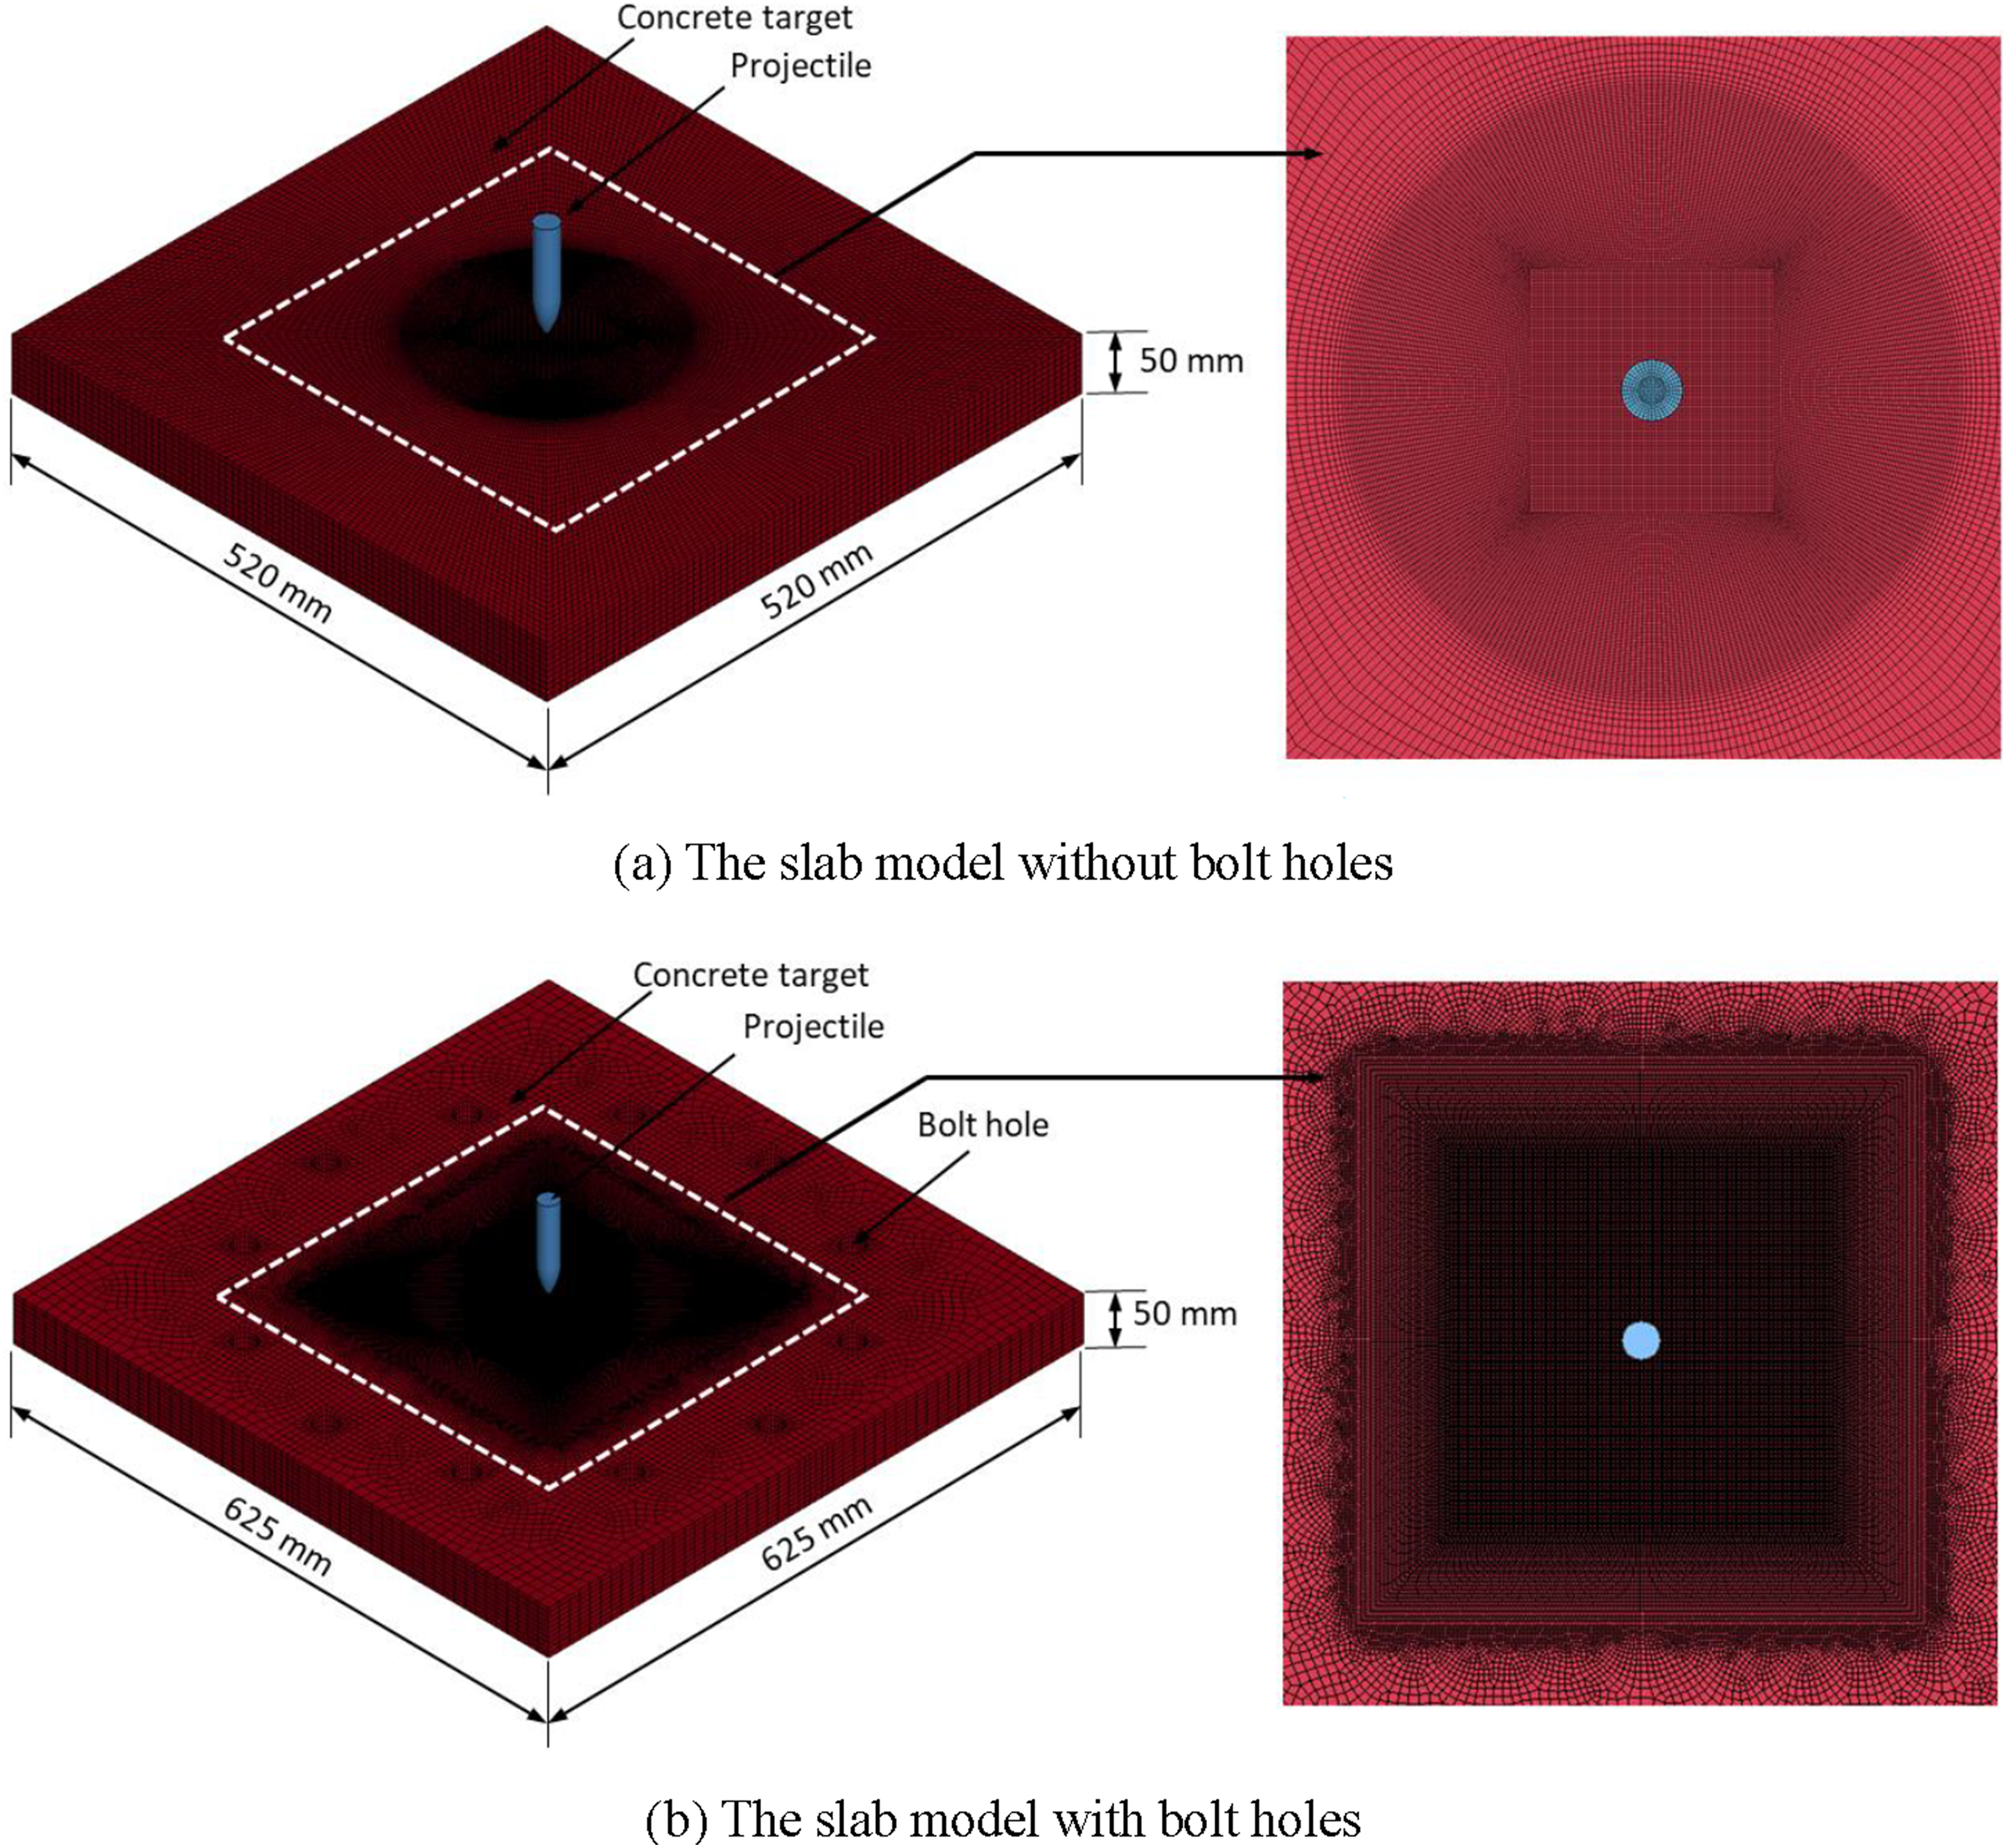
In addition, the numerical models shown in Figure 18 were established for the blast simulation. The shock tube flange and clamping plate were modelled separately by solid elements, and these parts were assigned an elastic material model using common steel properties. The concrete slab was placed between the shock tube flange and the clamping plate as in the experiments, and the contact between each part was defined by a surface contact. The detailed representation of the boundary condition is required to accurately predict the damage distribution of the slab as mentioned in (Kristoffersen et al., 2018c). The concrete material model was the same as those in the impact simulation. For the impact and blast loaded slabs, the perforation analysis was run first, and the resulting state of the model was used as initial conditions in a restart analysis for the blast load phase. The numerical setups for the blast simulation. (a) FE model using the slab with bolt holes. (b) FE model using the slab without bolt holes.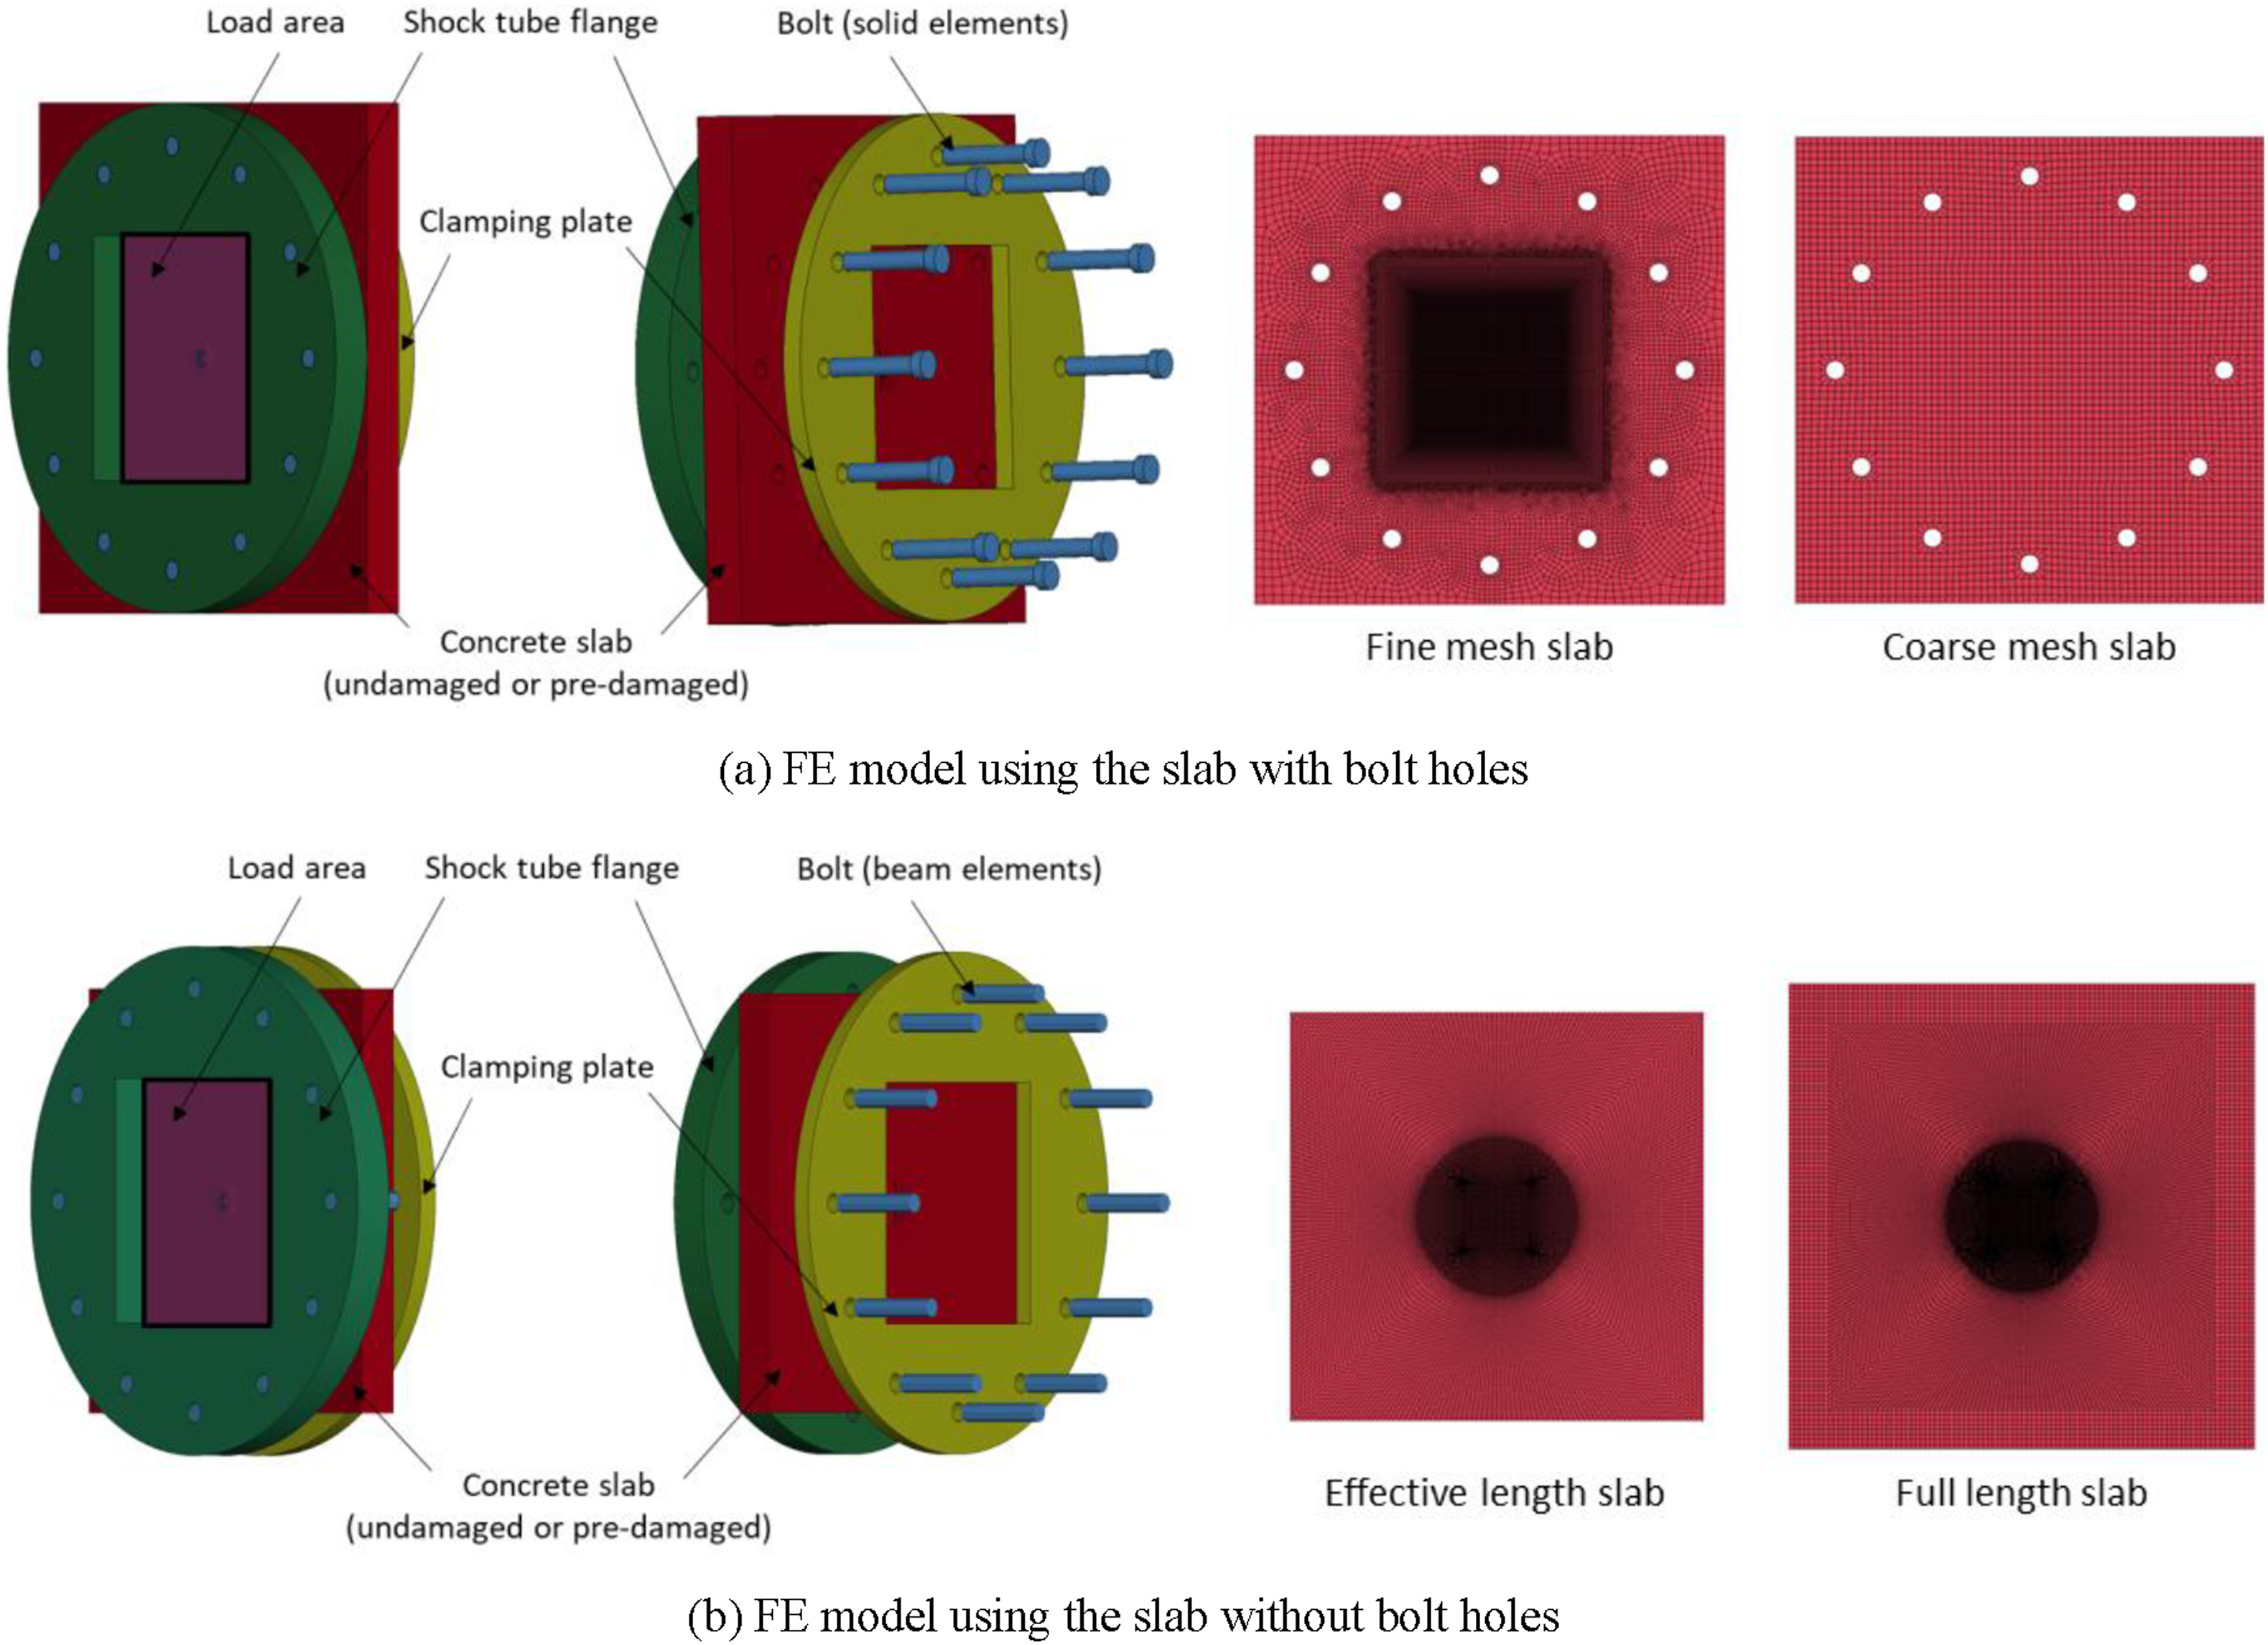
The 12 bolts modelled by solid elements hold all components together, and a pretension force of about 25 kN was applied to each bolt. Blast simulations were performed on both an undamaged slab and a slab perforated by a projectile for all concrete types. The fine mesh slab in Figure 18(a) has an element size of 1 mm in the blast-loaded area and the coarse mesh slab has an element size of about 9-10 mm over the entire slab. To investigate the effect of the clamping on the blast response of the slab, a mesh without bolt holes was also considered as shown in Figure 18(b). In this model, the bolts were modelled by beam elements to fix the slab between the flange and the plate. Two different span lengths, that is, the effective span length and the full span length, were in addition considered, and the numerical results from the two models are compared. The effects of span length and mesh size on the response of the slab are also discussed.
For the concrete slab with bolt holes, shown in Figure 18(a), the pressure-time histories were taken directly from the experiment and applied to the load area of 300 mm × 300 mm in the middle of the slab as a uniform pressure. Sensor two does not measure the pressure exactly at the slab, but 245 mm upstream from the test specimen. Thus, the recorded experimental pressure was extrapolated back in time to estimate the reflected overpressure at the slab, as illustrated by the pressure curve for the undamaged C110 slab in Figure 19. Determination of pressure-time curves for input to LS-DYNA simulations, where the left plot shows the full curves for 50 ms, while the right plot shows the first 5 ms and the extrapolation back in time using the experimental data from the undamaged C110 slab (sensor 2, slab C110-12).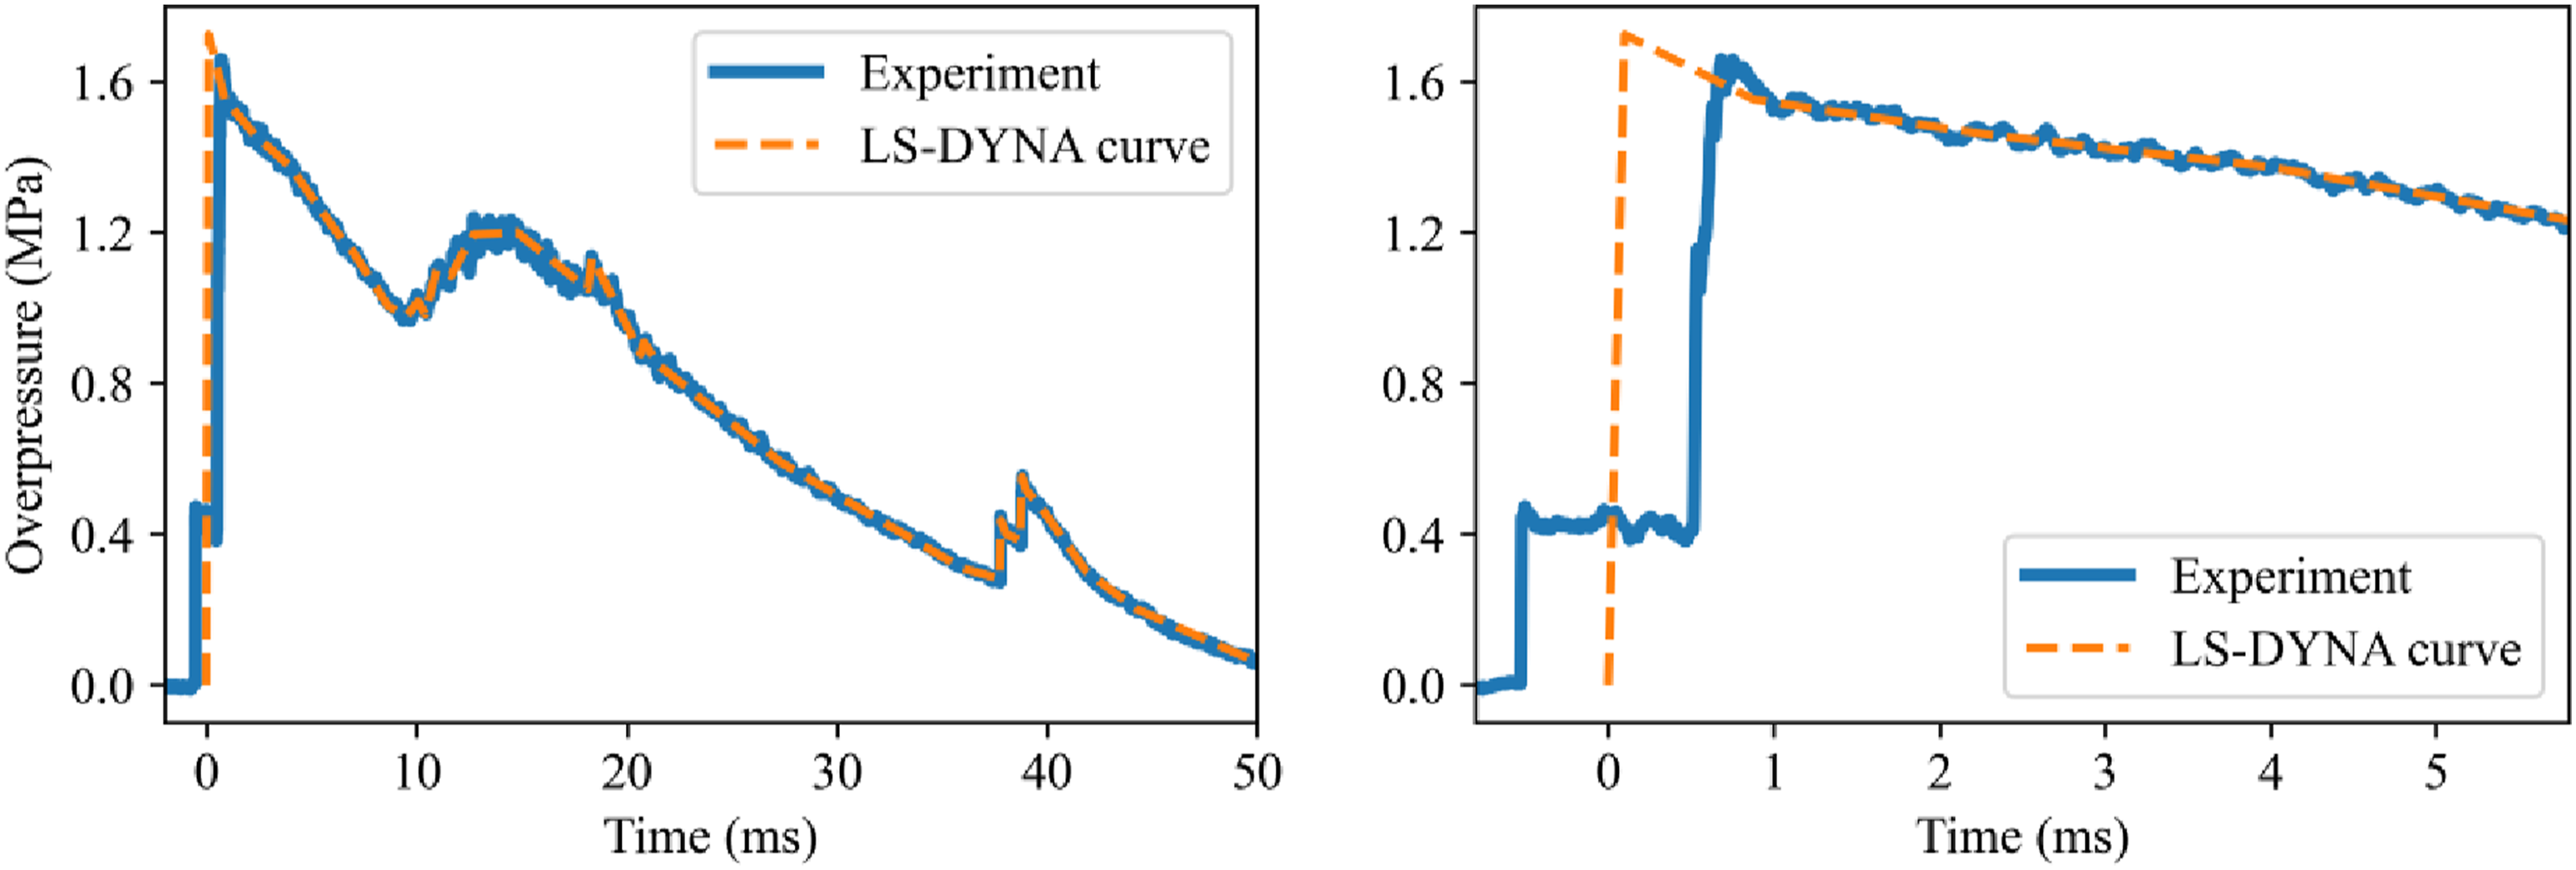
Ballistic impact simulation results
The performance of the 2D and 3D numerical models against the experimental results is revealed in Figure 20, showing a comparison of the velocity-time profiles of the projectile from the numerical simulations and the experiments for the C35-5, C75-7 and C110-8 slabs from Table 2. In the experiment, when the projectile was not visible to the high-speed camera during the perforation process, the velocity-time profile of the projectile is indicated by a dashed line. This is because the debris due to scabbing from the rear side of the concrete slabs prevented the high-speed camera from capturing the projectile until it has escaped the debris cloud. The ballistic impact response was captured with sufficient accuracy for each concrete model. In the case of the C35-5 and C75-7 slabs, both 2D and 3D numerical models provide the velocity-time profiles very similar to the experiment. For the C110-8 slab, the difference between the numerical results and the experimental data increased. The 3D FE model without bolt holes gave a less conservative result than the 2D FE model. There is little difference in the numerical results based on the bolt holes and span length because the ballistic impact causes localised damage in the slab. While the spalling and scabbing in the 3D simulations have the correct relative size, their absolute size is smaller compared to the experiments. A comparison of numerical results and test data for projectile velocity-time profiles (a) C35-5, (b) C75-7, and (c) C110-8.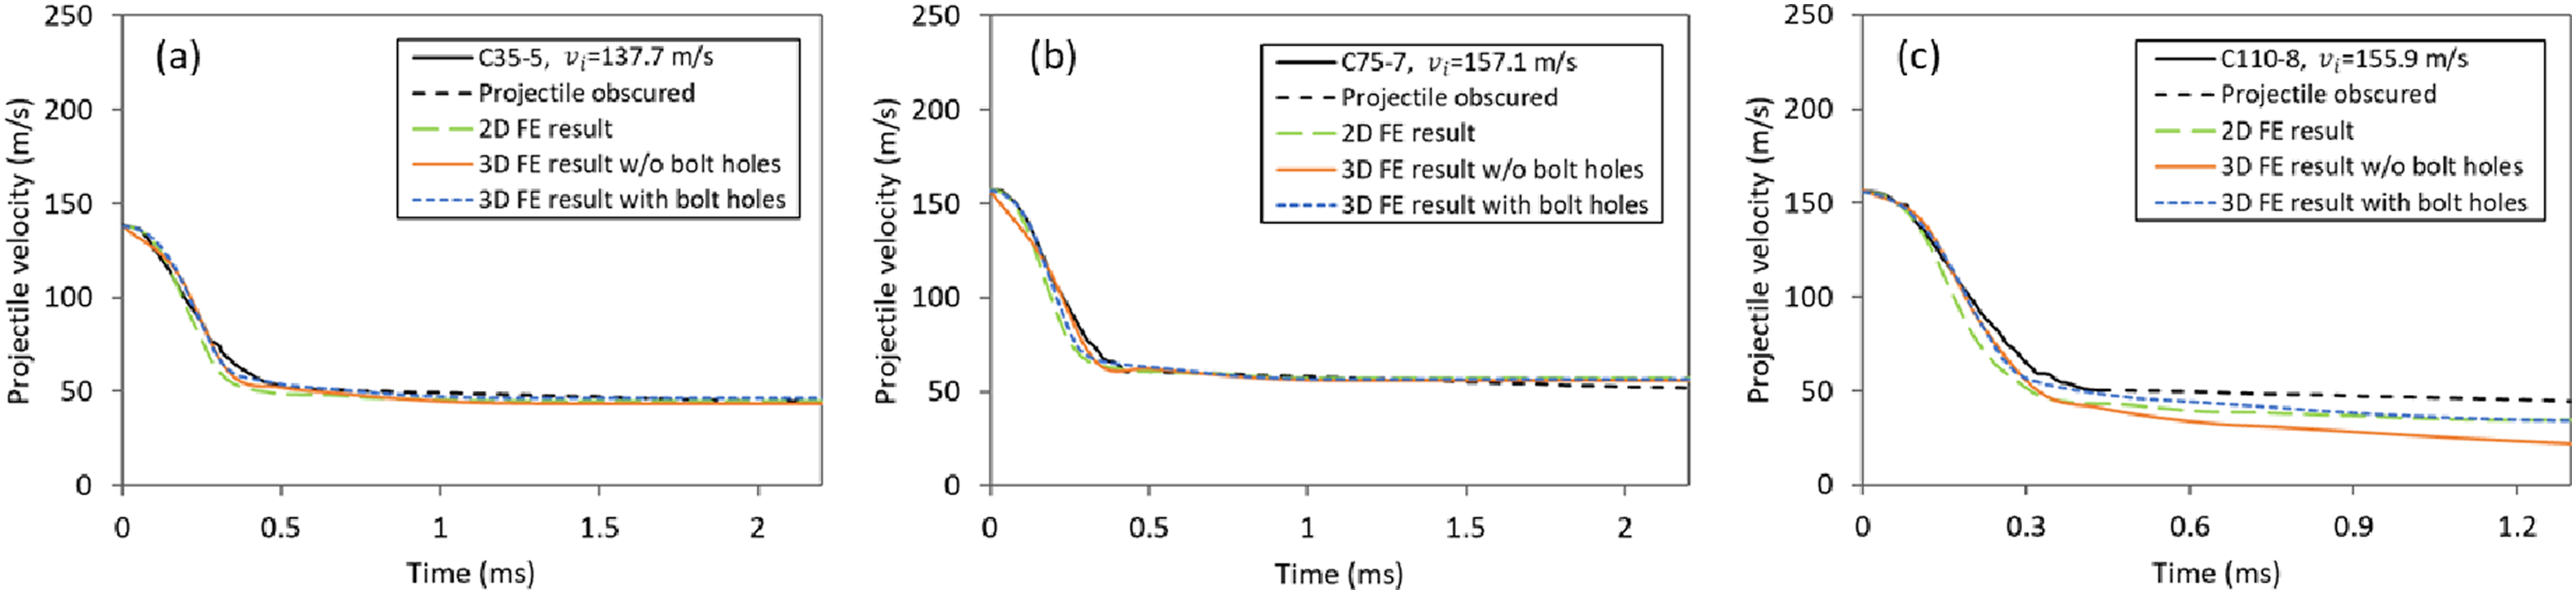
For an additional verification of the calibrated material model, the ballistic limit curves obtained from the 2D axisymmetric impact model were compared with test data reported by (Kristoffersen et al., 2021b) in Figure 21. The numerical simulations were carried out at five different velocities of the projectile between 115 m/s and 300 m/s for each concrete type to obtain the ballistic limit curve. The Recht-Ipson (RI) model, which gives the residual velocity Ballistic limit curves of ballistic impact test and FE simulations using the 2D axisymmetric model for all three concrete types (a) C35, (b) C75, and (c) C110.
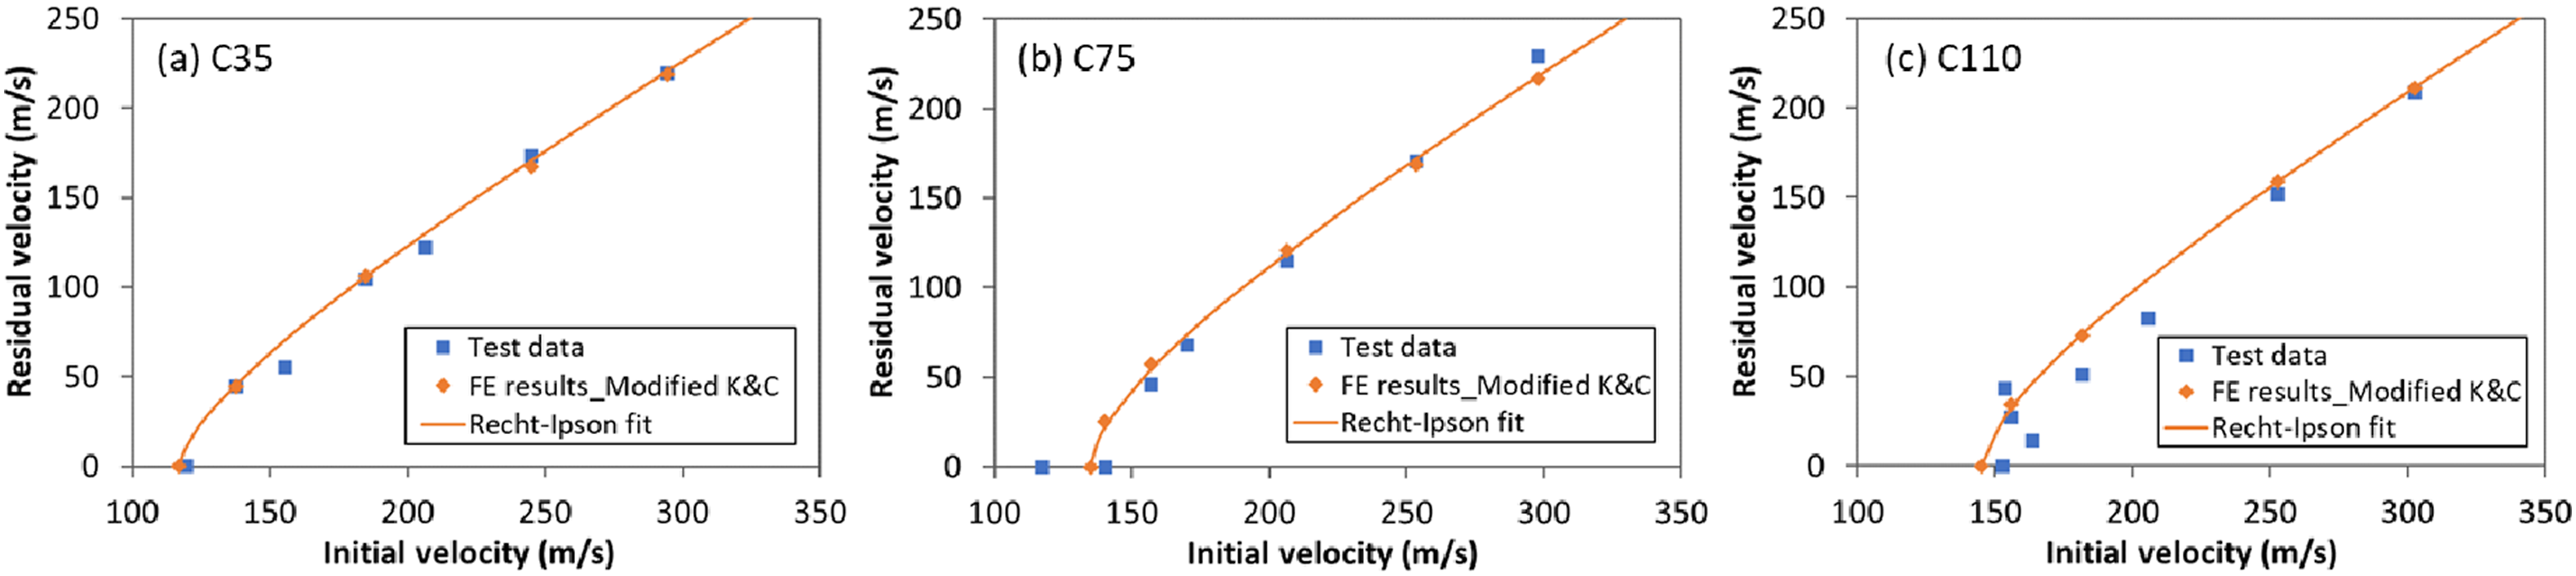
Parameters in the Recht-Ipson model from experimental results (Kristoffersen et al., 2021b) and numerical results with the K&C model.
Shock tube simulation results
All numerical results are presented as fringe plots of the 1st principal Green-St. Venant strain, where the strain value at which cracks were sure to occur was assumed to be 0.003 based on the material tests, Further, this value gave good and consistent representations of the strain field across all mesh configurations. Figure 22 shows the damage distribution of the undamaged C35 slab with different geometric models. As shown in Figure 22(b), the slab with the effective span length of 520 mm suffered severe diagonal crack propagation on both faces. This is because the length of the slab affects the blast resistance and bending behaviour of the slab. Also, the slab without bolt holes in Figure 22(c) shows a difference in the location of the circumferential cracks; the cracks of the slab occurred along the position of where the bolts would be, whereas the cracks of the slab with actual bolt holes occurred in the area where the shock tube flange connects with the slab (see Figure 22(d) and (e)). There was no change in the crack pattern according to the element size, but the numerical result of the coarse mesh slab was stiffer than that of the fine mesh slab in Figure 22(e). From these results, the inclusion of bolt holes is seen to have a significant effect on the overall response of the slab, and seemingly more than the element size. Crack pattern and damage distribution of the undamaged C35 slab according to the slab modelling (a) Experiment, (b) effective length slab without bolt holes, (c) full length slab without bolt holes, (d) fine mesh slab with bolt holes, (e) coarse mesh slab with bolt holes. The fringe plots show the 1st principal Green-St. Venant strain.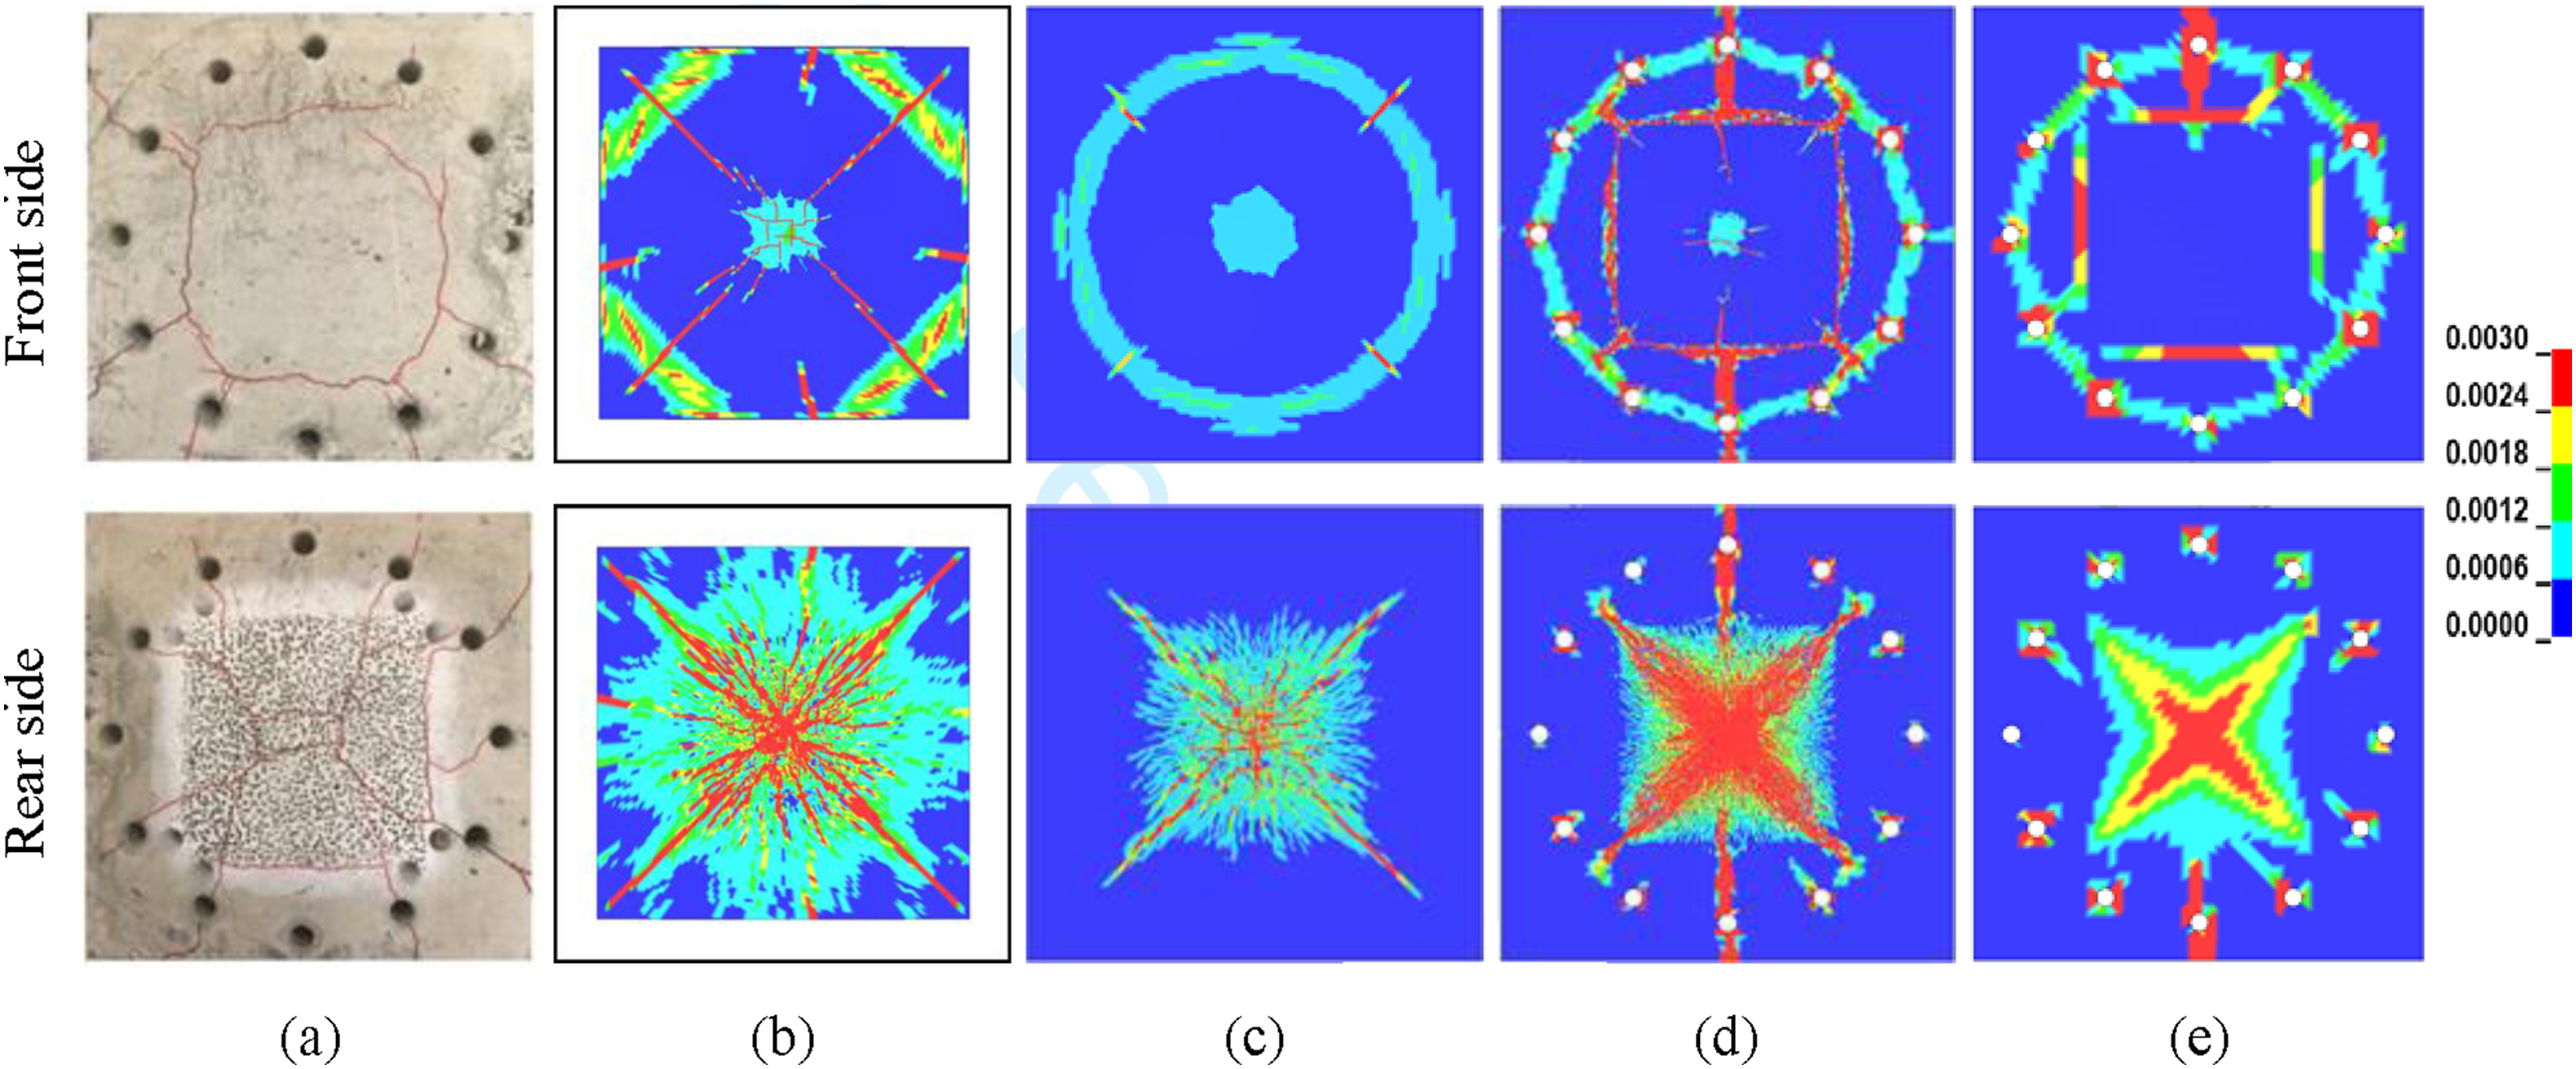
Figure 23 shows the numerical results of the undamaged slabs for the three concrete types using the fine mesh from Figure 22(d). The experimental results show circumferential cracks on the front of the slab side along the area where the blast pressure was applied. The numerical results also show this circumferential damage pattern on the front side, and the cracks on the rear side extend radially from the centre to the edges as found in the experimental tests. The cracks of the slabs were influenced by boundary conditions as enforced by the clamping plate. Except for the rectangular area observed experimentally in the C35-3 slab, there was no significant qualitative difference in the crack distribution between the C75-2 slab and the C110-12 slab and the numerical simulations. Crack pattern and damage distribution of the undamaged slabs for all three concretes (a) C35-3, (b) C75-2, (c) C110-12. The C110 slab had to be retrieved from storage for photography, and thus had some marks on the rear surface from the wrapping. The fringe plots show the 1st principal Green-St. Venant strain.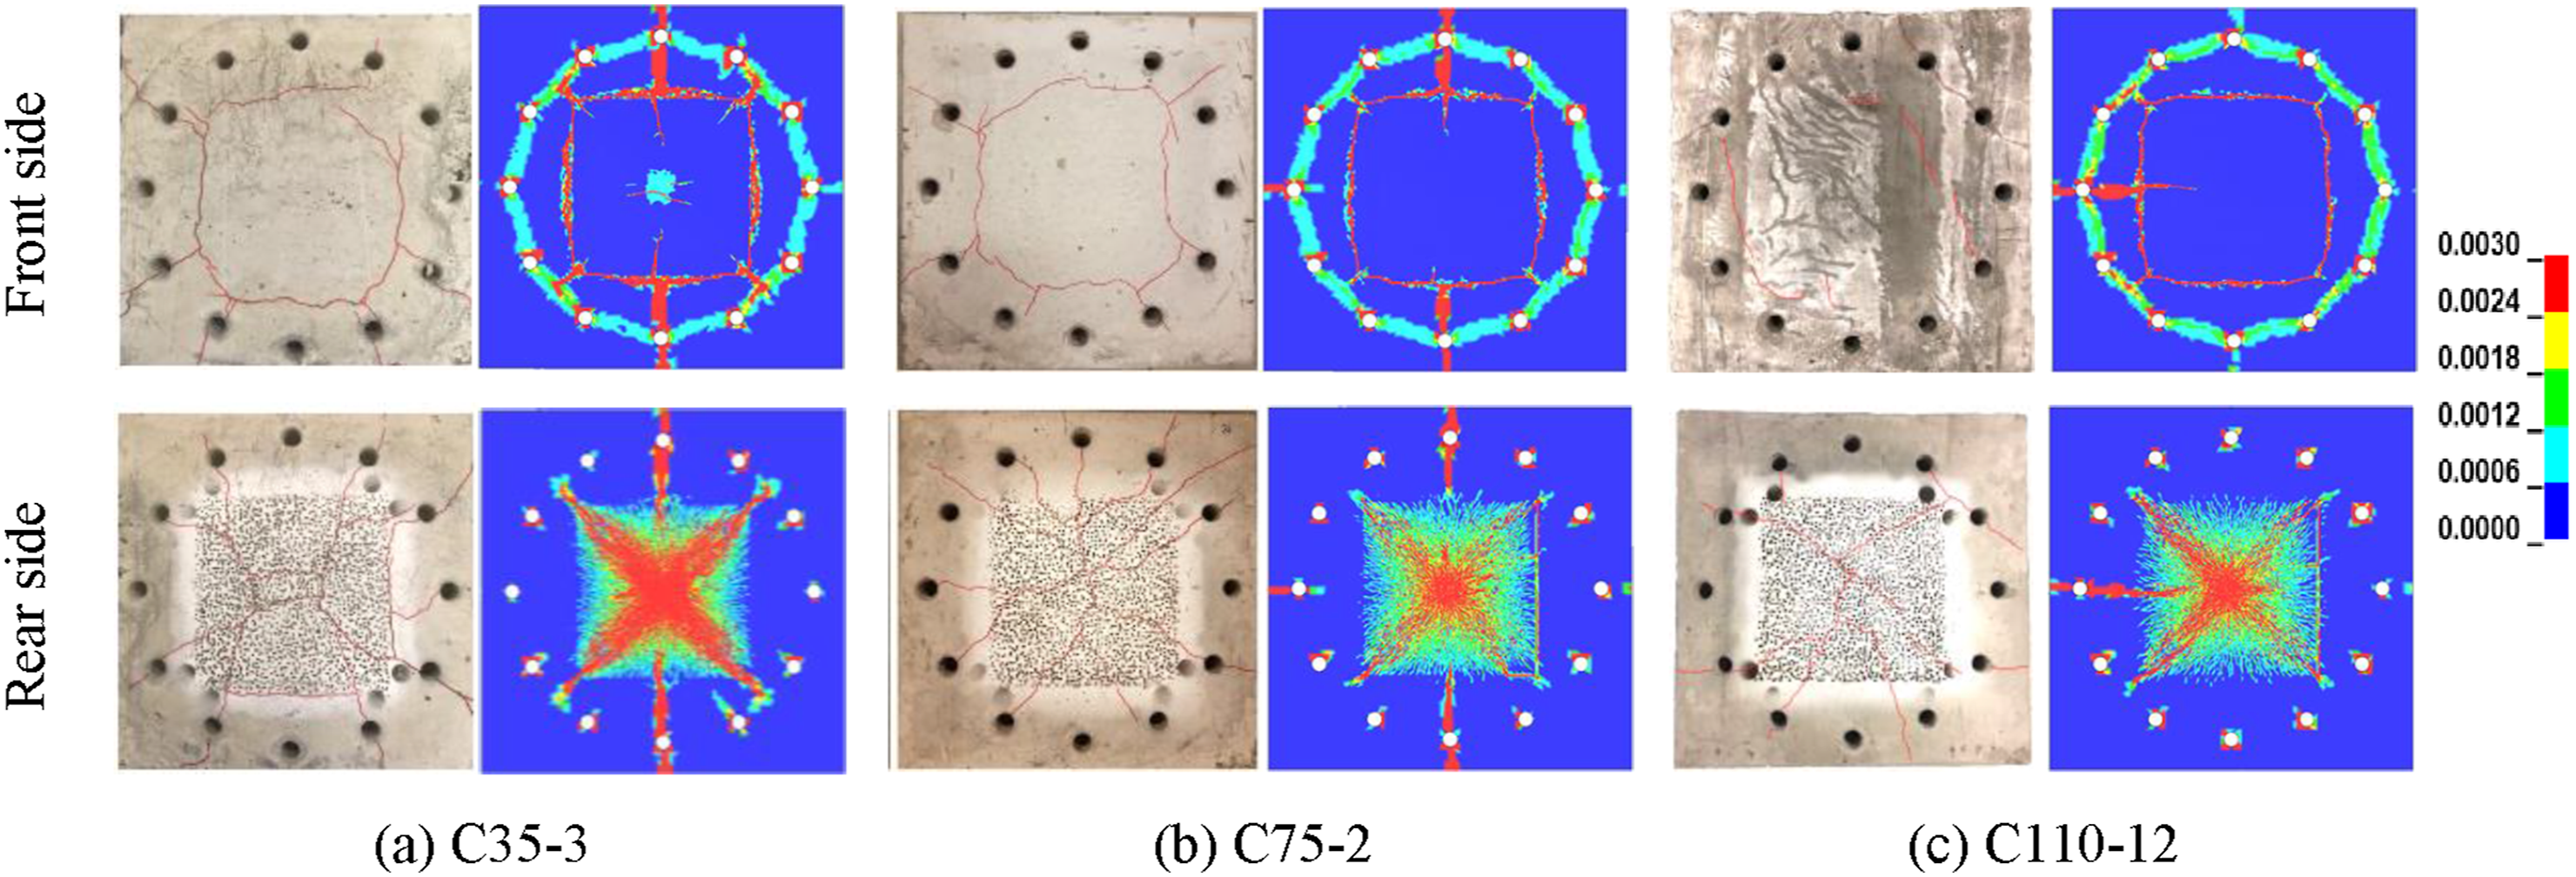
Figure 24 shows the crack pattern and damage distribution of the perforated slabs. The numerical model produced a similar trend on both sides of the slab in comparison to the experiment. A circumferential crack along the boundary condition appeared on the front side. The damage appears to be concentrated around the crater hole of the rear side and the main cracks are formed towards the edges. Although the same blast load was applied, the C35-5 slab suffered a smaller amount of damage than the C75-7 slab in both experimental and numerical cases. This is because the C75-7 slab had previously experienced more damage from the high-velocity impact of the projectile. Thus, the effect of the concrete strength on the structural resistance was not clear for pre-damaged slabs. In addition, the numerical results of the C75-7 slab clearly show that the damage overlaps with the experimental scabbing crater in Figure 24(b). The numerical results also show the difference in resistance between undamaged and pre-damaged slabs, that is, the undamaged slabs have a stiffer response than the pre-damaged perforated slabs. For the perforated slabs, no clear trend for the different concrete types could be found. The degree of damage due to projectile impact may predominantly affect the resistance of the pre-damaged slabs under the blast loading. Crack pattern and damage distribution of the pre-damaged slabs for all three concrete (a) C35-5, (b) C75-7, (c) C110-8 (top row: front side, bottom row: rear side). The fringe plots show the 1st principal Green-St. Venant strain.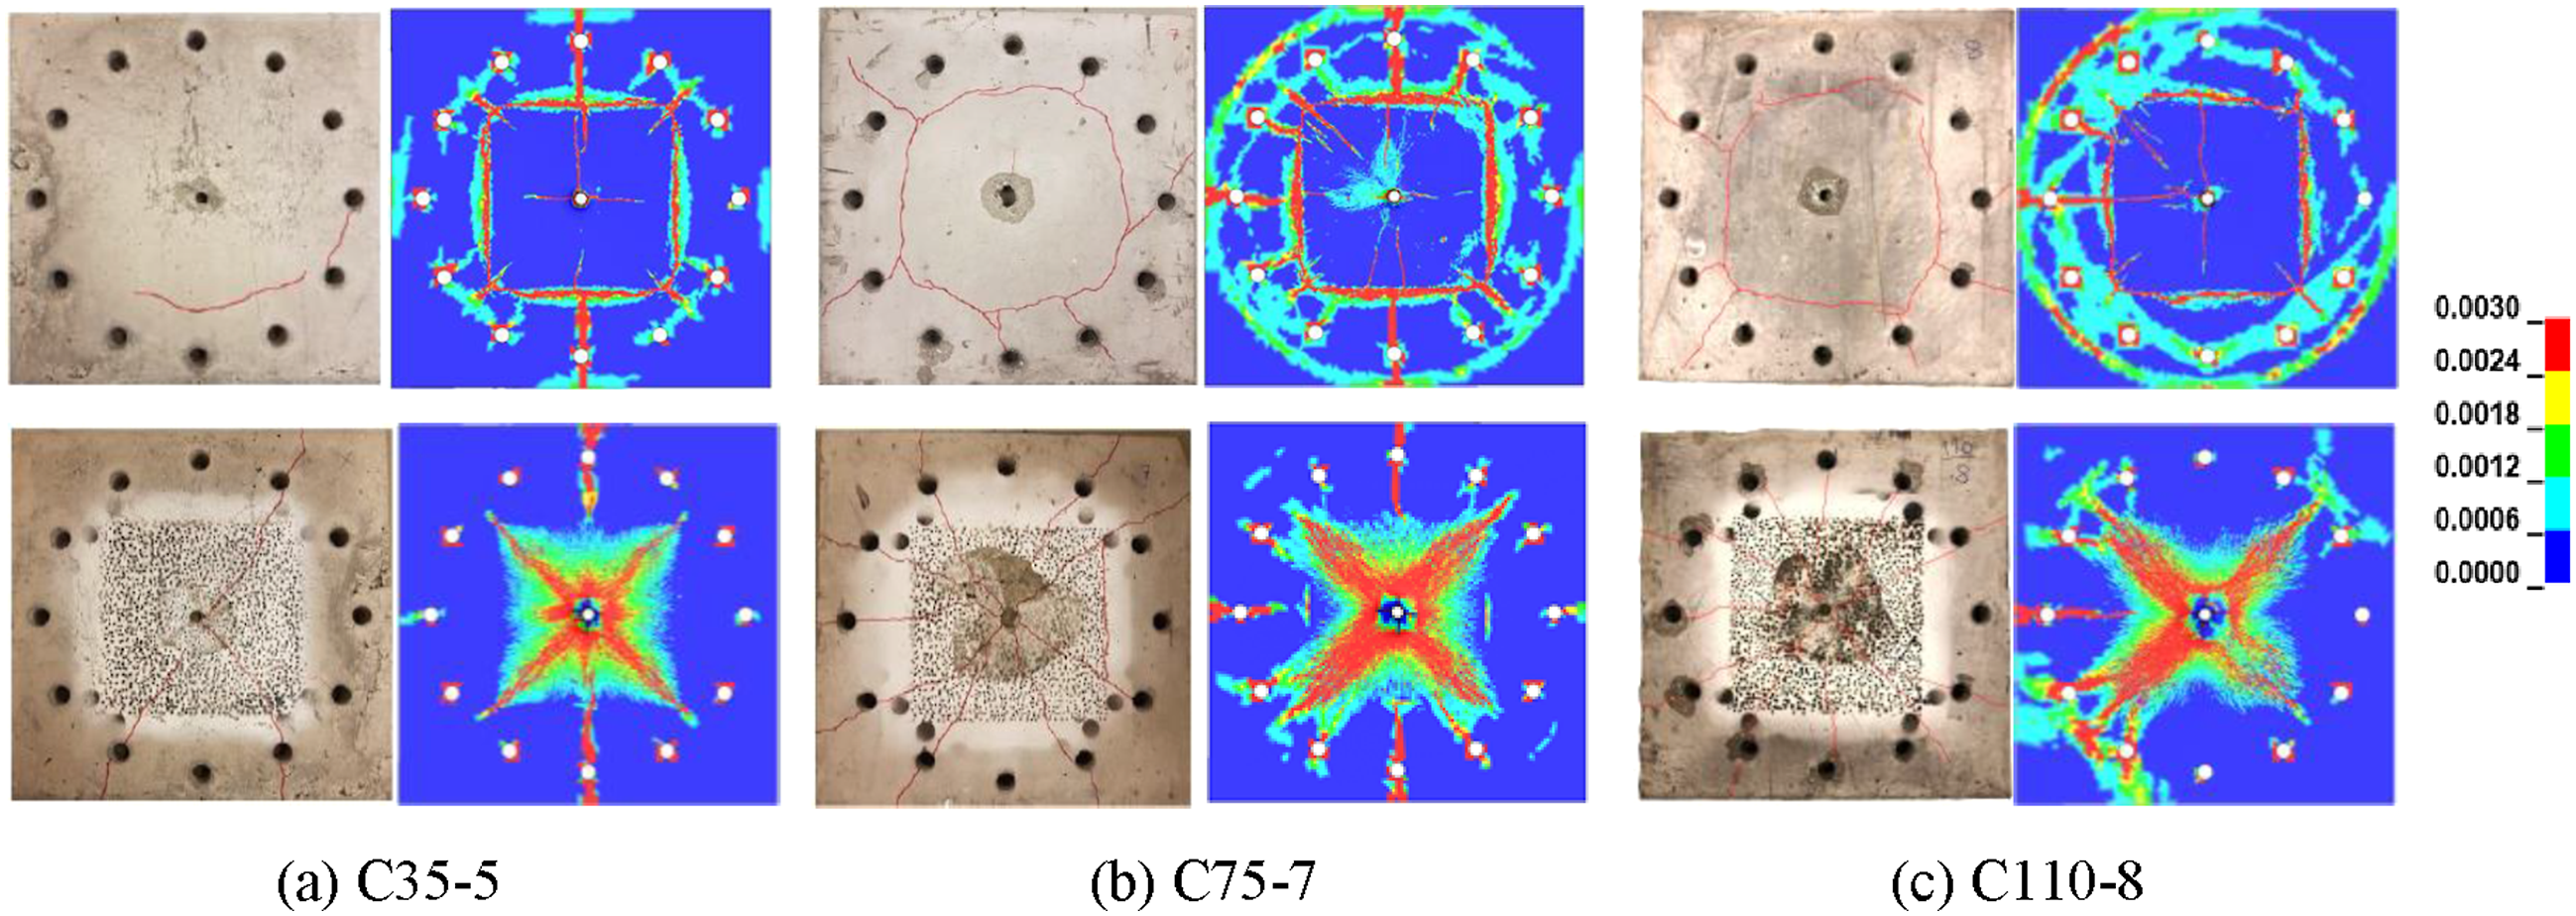
Figure 25 shows out-of-plane deformations over the Deformation profiles during blast loading for undamaged (top) and perforated (bottom) slabs (a) C35-3, (b) C75-2, (c) C110-12, (d) C35-5, (e) C75-7, (f) C110-8. The out-of-plane displacements are underestimated compared with the final deformations from the experiments which ranged from 1 to 3 mm as exemplified by Figure 13.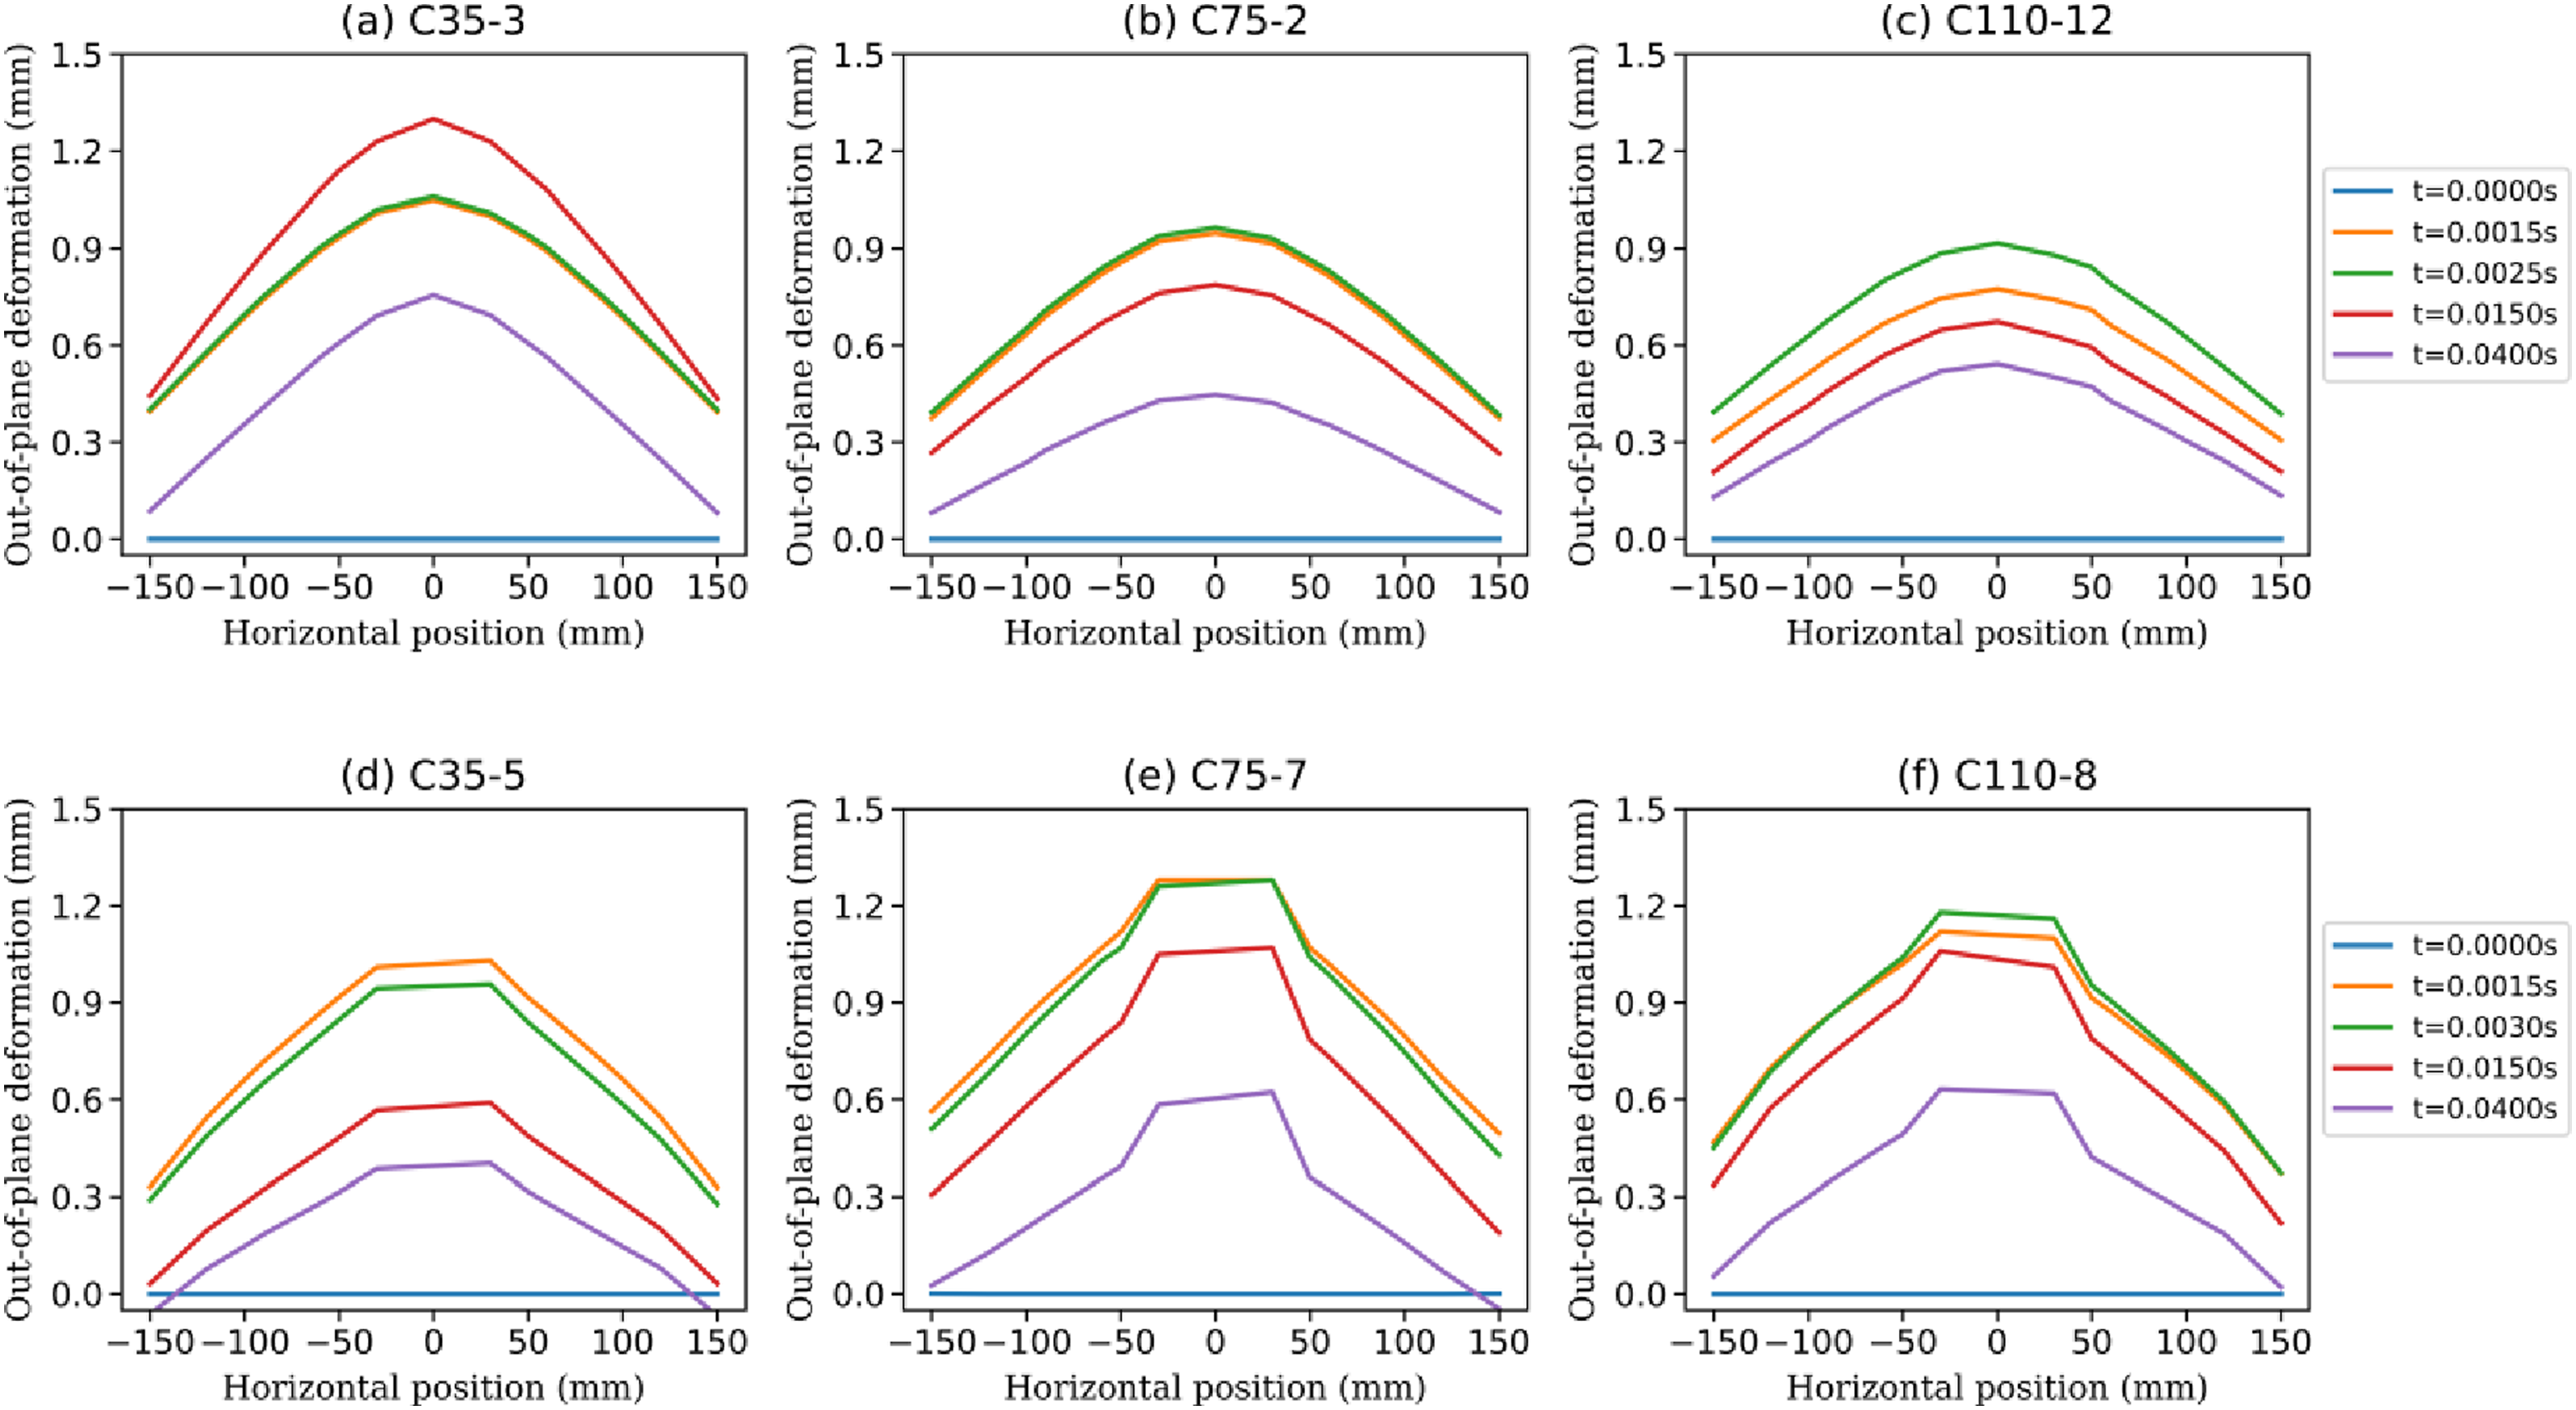
Sequential versus simultaneous loading
As discussed in the literature, the load sequence may be important for the overall structural response (Nyström and Gylltoft, 2009). Due to the nature of the experimental setup, it was not feasible to apply a blast load at the same instant as the projectile impacts the slab. This is, of course, comparatively easy to do numerically. Thus, the blast load simulations were repeated with the inclusion of a projectile impacting the slab simultaneously with the blast wave in full 3D including bolt holes. The same impact velocities and blast magnitudes were used in all simulations.
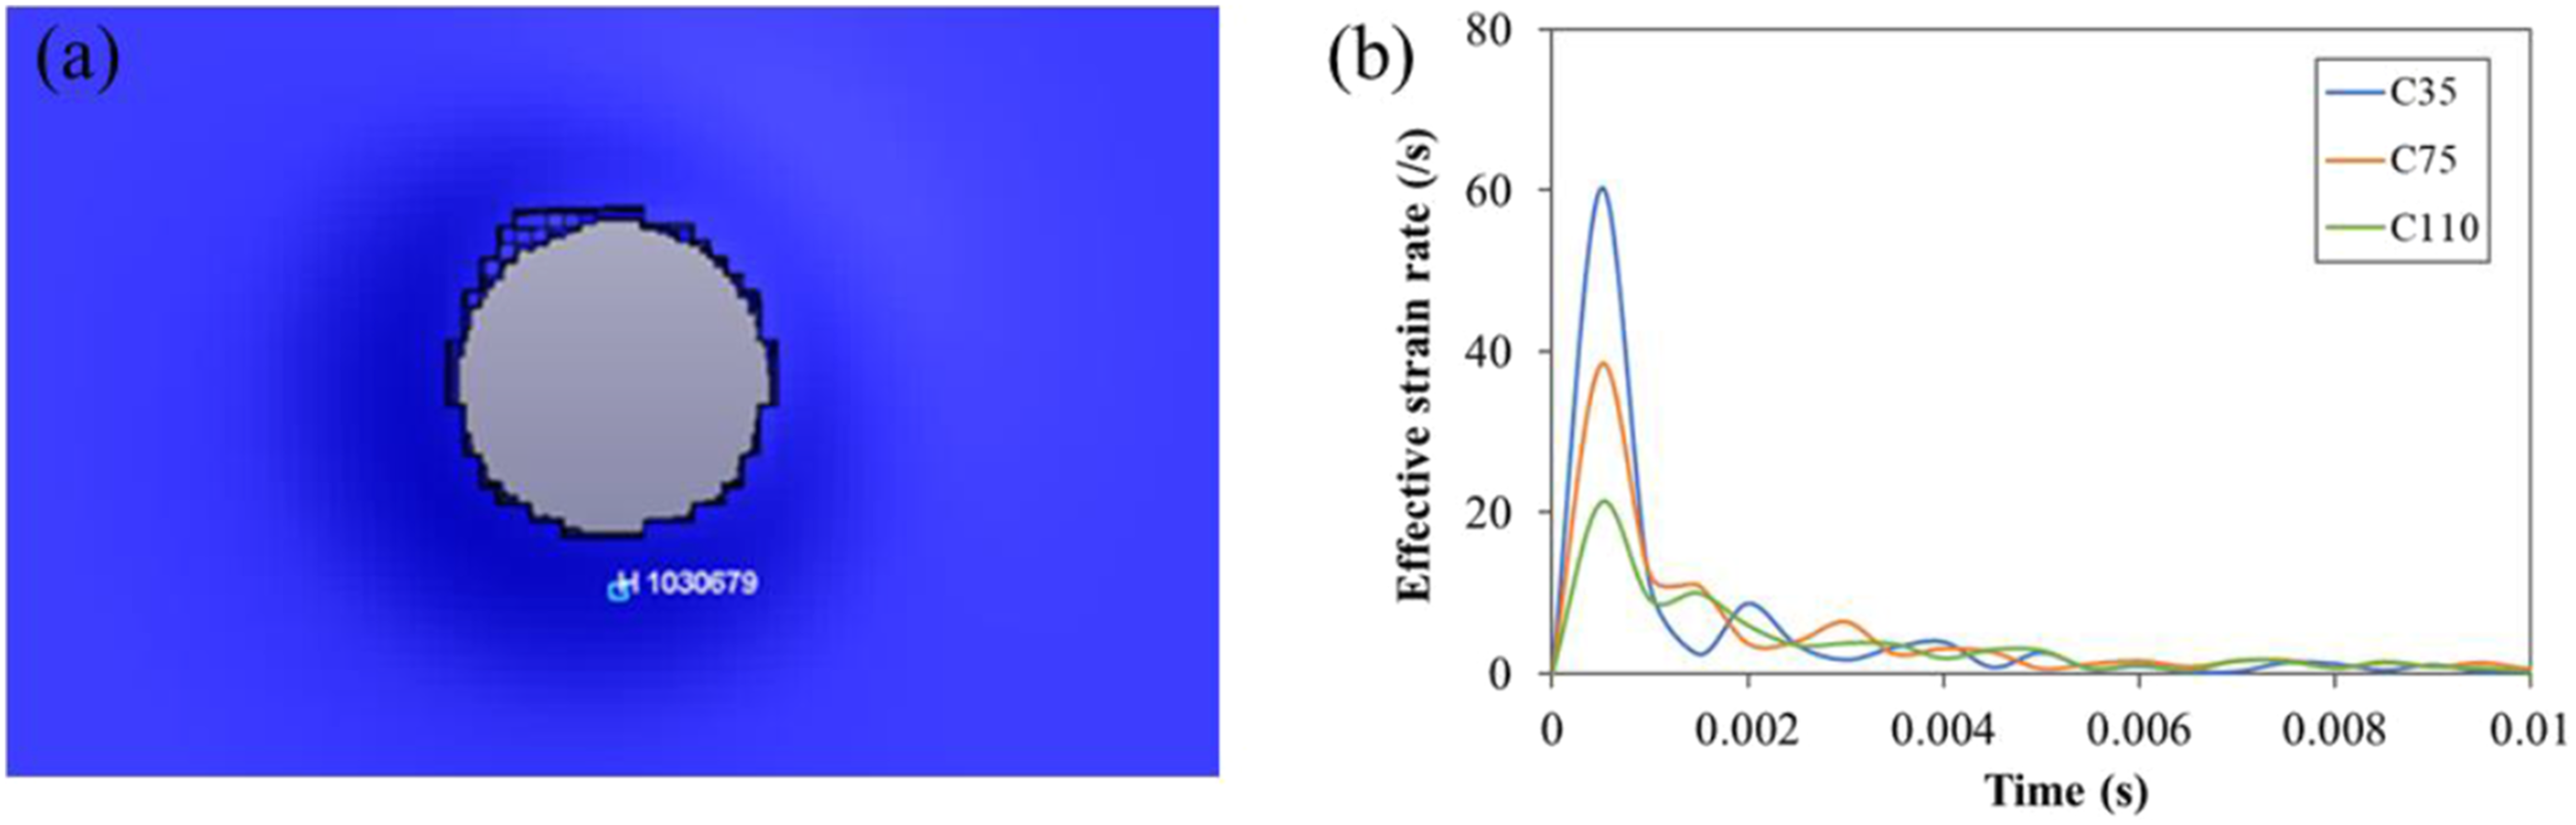
The results are plotted in Figure 26 and are somewhat surprising: for the C35 and C75 slabs, the projectile is stopped when the blast load is applied simultaneously, but the qualitative shape of the velocity-time curve remains the same. For the C110 slab, the residual velocity is approximately the same, but the projectile takes longer to decelerate, and the shape of the velocity-time profile is thus altered. We believe that there are two main factors influencing the results in Figure 26: the first is strain rate sensitivity, whereby the blast wave deforms the slab leading to an increased strain rate. Lower strength concrete is typically more sensitive to strain rate than high strength concrete (Malvar and Crawford, 1998), which is accounted for in the model. As shown in Figure 27 for an element close to the penetration channel, the C35 slab exhibited the highest effective strain rate among the three concretes, with peak values reaching approximately 60 s−1 at the selected element close to the hole, compared to 39 s−1 for C75 and 21 s−1 for C110 at the same location. This results in a higher dynamic increase factor for the C35 concrete than for the C110 concrete, and the projectile is thereby stopped in the former when the blast load is applied simultaneously. Projectile impact versus time for (a) C35 and (a) The element to be measured, and (b) effective strain rate versus time for three concrete slabs.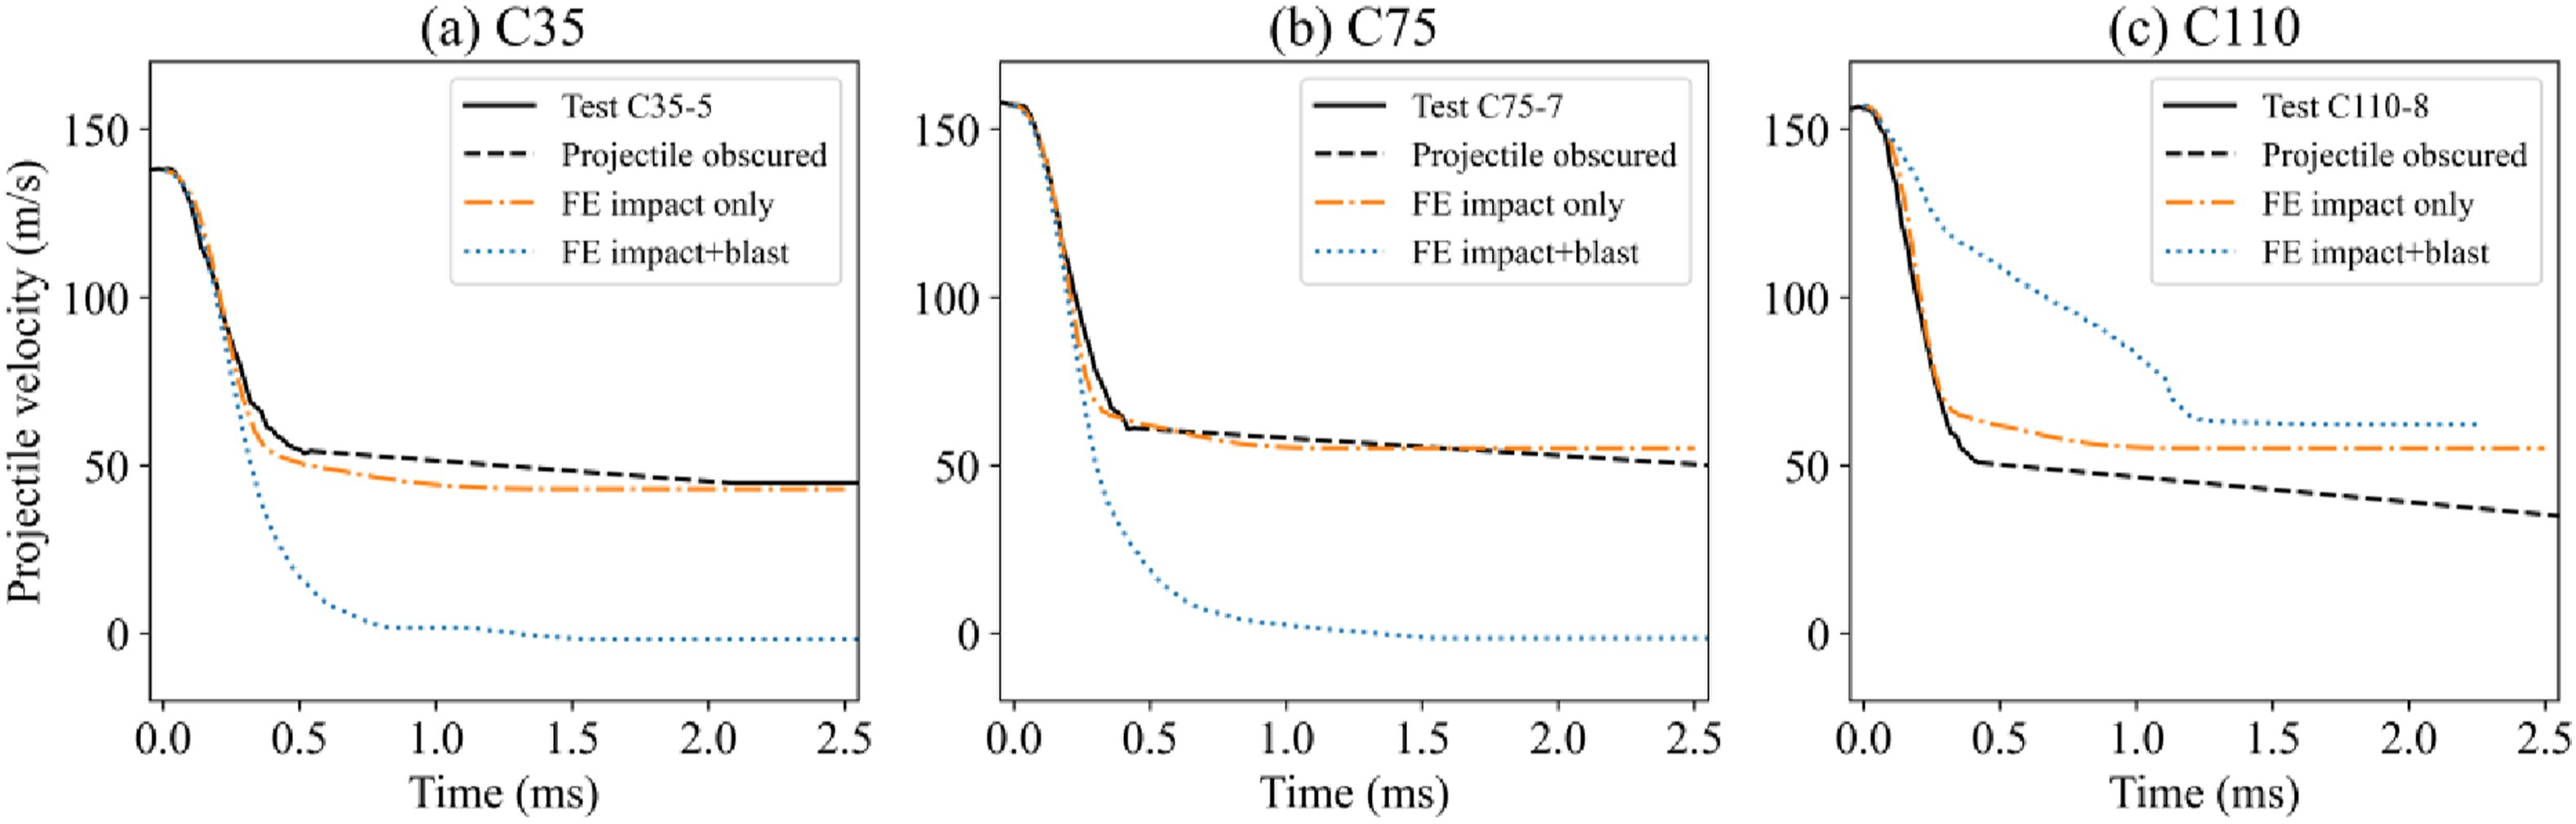
The second factor is the confining effect arising from the bending caused by the blast load. When impact and blast loads are applied to a target simultaneously, the structural behaviours caused by each load are affected by each other. Here, the bending behaviour due to the blast load causes compression on the projectile’s entry side, which is likely to give rise to pressure hardening as described in Equation (1). Increased bending may thus result in higher confining pressure, so for the C110 slab, which has the lowest out-of-plane deflection, the effect is less significant compared to the C35 slab although the higher Young’s modulus for C110 competes with this effect. It should also be noted that all impact velocities considered are close to the ballistic limit, and the results are more sensitive within this range. For higher impact velocities the effects may diminish; the tip of the projectile will penetrate further in the same time span and eventually pass the neutral axis and progress into the tensile side of the slab.
Extra simulations were run to evaluate this assertion, and the results are shown in Figure 28. As seen, the residual velocities for the higher impact velocities are similar to the impact only cases. The shape of the velocity-time is altered in the same way as in Figure 26(c). Factors other than the impact velocity and concrete strength are likely to influence the slab behaviour under simultaneous impact and blast loading, for example, the type and magnitude of the blast pressure, slab thickness, projectile shape, friction, the spacing of reinforcing bars, etc. Various combinations of these factors may affect both global and local responses of the concrete slabs. Blast pressures generally elicit global bending deformation while projectile impact results in local damage, which means that different effects may interact with each other and thus add further complexity to the problem. A quantitative assessment of this requires a large number of simulations (which may be reduced by using for instance the Latin hypercube sampling method (McKay et al., 1979)) and is thus out of scope for the current study. Projectile impact versus time for various impact velocities (including 200 m/s and 250 m/s) for concrete (a) C35, (b) C75 and (c) C110, where the square markers on each curve indicate when the projectile penetration is 25 mm (halfway through the slab) and the circular markers indicate a projectile penetration of 50 mm (perforation).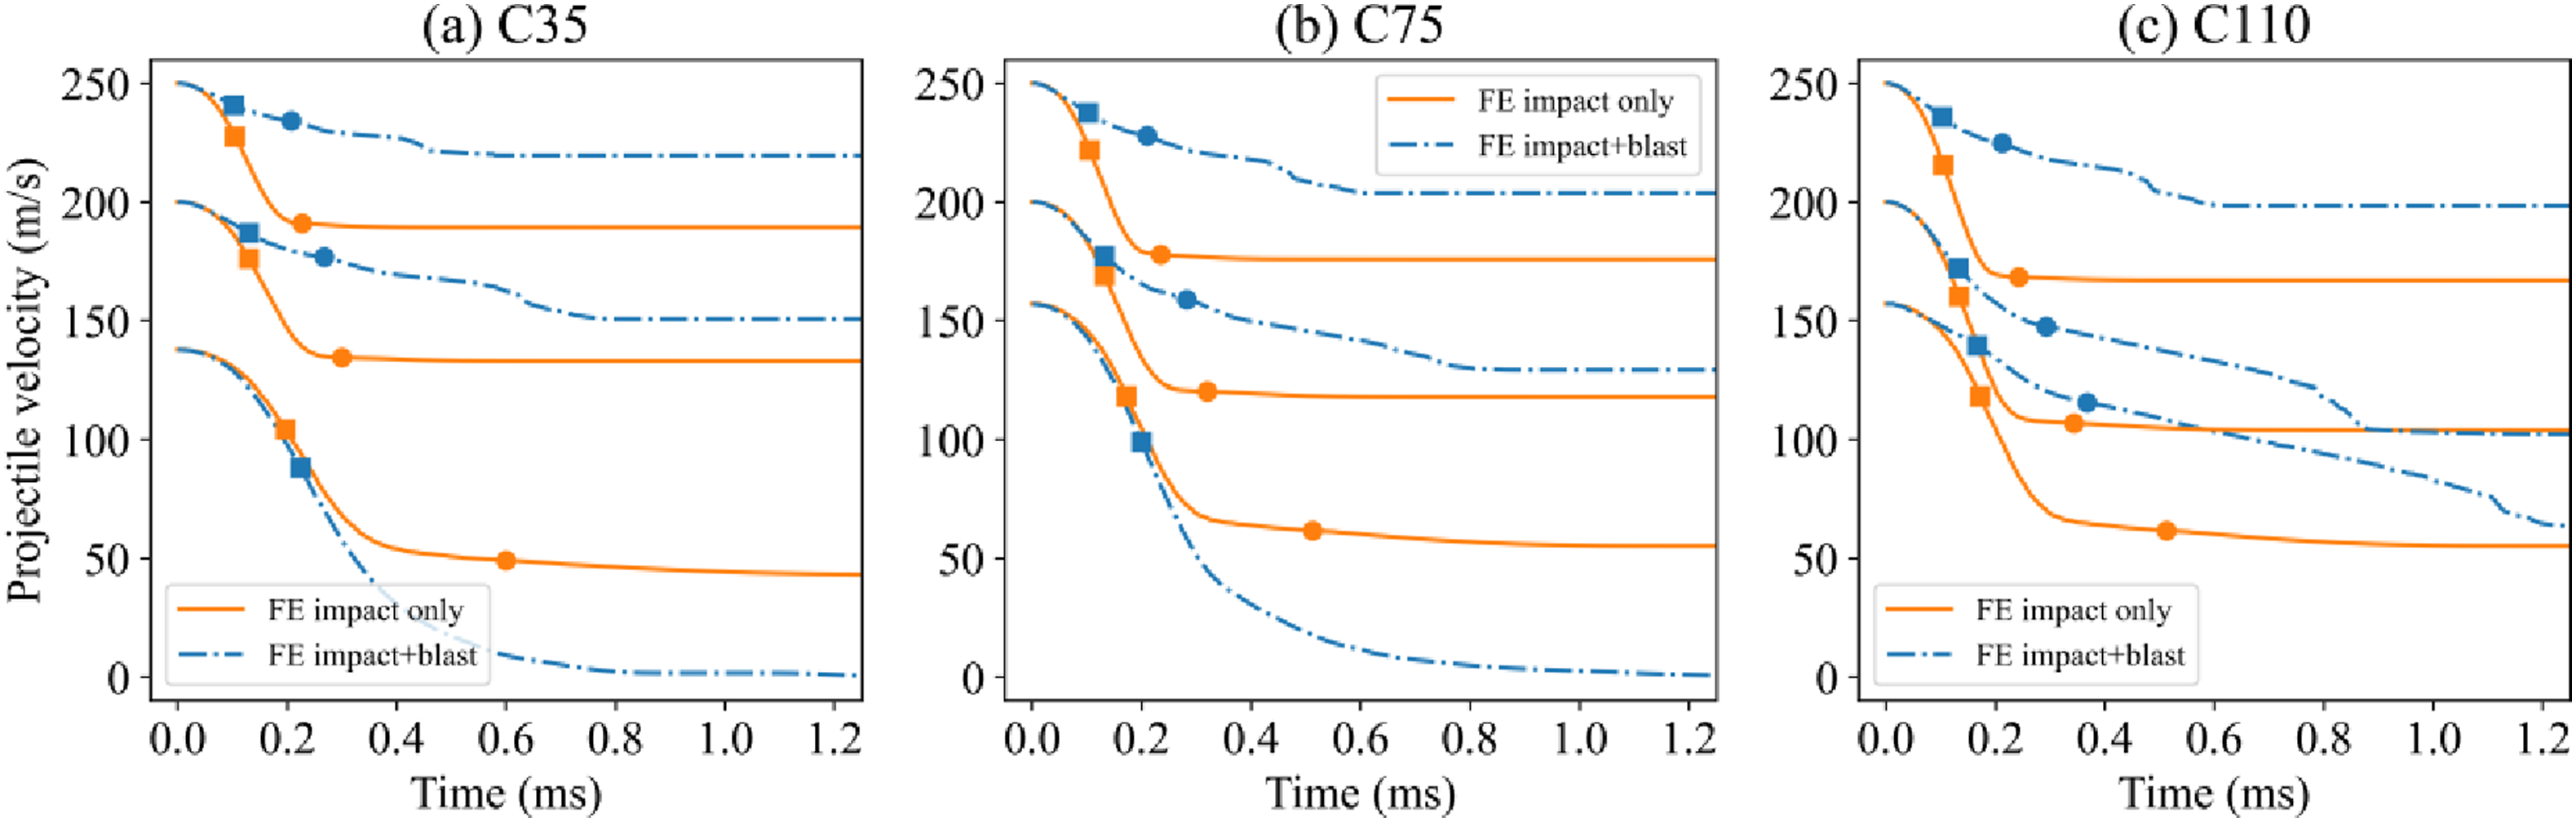
Discussion
While the compressive strength of the concrete is important when considering, for example, deep penetration, the tensile strength appears to be a more influential parameter for determining the perforation resistance of relatively thin concrete slabs (Riera, 1989). Increasing the compressive strength 2.5 times from 44.6 MPa to 112.5 MPa has been shown to yield a modest ∼30 % increase in ballistic limit velocity for 50 mm thick slabs (Kristoffersen et al., 2021b). It is also noted that the tensile splitting strength does not increase in proportion with the compressive strength – from 4.0 MPa for the C35 concrete to 6.2 MPa for the C110 concrete. Further, the tensile splitting test itself may underestimate the tensile strength (Resan et al., 2020).
The global bending deformation elicited by the blast load results in tensile stresses on the rear face of the target, implying that the tensile capacity is also important in determining the structural response to the blast load. Given the lack of reinforcement and the somewhat low thickness of 50 mm, an increase in compressive strength is not expected to contribute greatly. The final out-of-plane midpoint deformation of the undamaged slabs subjected to blast loading was about 6.4 mm, 4.0 mm, and 2.5 mm for the C35, C75 and C110 concretes, respectively. While the out-of-plane deformations appear to be more in proportion with the compressive strength than the tensile splitting strength, it should be kept in mind that these are very small deformations relative to the span length (300 mm) and that small fluctuations may have large influences. Further, more material is involved in the global bending deformation than in the local perforation caused by the projectile.
Regarding the effect of combined impact and blast loading on the slab response, there were no notable quantitative differences for the materials and pressure magnitude investigated. The change in out-of-plane deformation between a perforated and undamaged slab was negligible. Qualitatively, fragments detached more easily from the perforated slabs, thereby posing an additional hazard to the surroundings. Whether these results hold for thicker slabs and/or reinforced slabs across a wider range of pressure levels remains to be investigated.
Reinforcement appears to have limited effect on the perforation resistance of concrete slabs unless the reinforcement is struck directly (Jacobsen et al., 2023). Having a reinforcement bar cut in half by a projectile prior to a blast load may, however, affect the response to the blast load notably. Specifically, since reinforcement of concrete barriers generally improve the flexural response and mitigate concrete scabbing, the effect of the combined loadings on structural response may be different from that of unreinforced concrete. Further research should explore this possibility and its implications for protective structure design. Members under compression, e.g., a column or a wall, may perfectly well withstand both projectile impact and a blast load separately. A combination of the two may, however, result in eccentric compressive loading which may initiate bucking and collapse of the member.
In the impact simulations, both the 2D and the 3D FE models gave good predictions. The rather simple axisymmetric 2D model can be effectively used to obtain numerical results at a large range of initial velocities due to the short CPU time. The axisymmetric assumption only marginally affects the residual velocity of the projectile, but the description of the damage distribution (e.g., spalling and scabbing) is limited, and fragmentation is ruled out entirely. Compared with the 2D model, the full 3D model gives a more realistic representation of the slab, and possible oblique impacts can be simulated. However, the CPU time increases significantly due to the large number of elements. In the 3D models, the bolt holes and span length have a negligible influence on the local response of the slab caused by the ballistic impact. The 3D FE model with sufficiently fine discretisation gives accurate results for the cases herein. Nevertheless, the computational cost still makes it difficult to obtain numerical results in the blast simulations. The simulation time was about 120 hours on five CPUs. However, the 3D model with coarse discretisation provided reasonable results with a relatively low CPU cost of about 38 minutes given adequate boundary conditions. Thus, it is necessary to select a FE model based on accuracy and efficiency according to the purpose of the numerical analysis. If a more realistic crack pattern is desired, accounting for the heterogeneity by mesoscale modelling (Zhou and Hao, 2009) is an option.
The pretension in the bolts has a major effect on the boundary conditions of the concrete slab. The actual boundary conditions of the slabs are somewhere between fully clamped and simply supported. Figure 29 shows the crack pattern of the slab when varying the pretension force in the bolts. A low pretension force of 5 kN leads to asymmetric bending deformation. At a high pretension force, the bending deformation is suppressed, and cracking on both faces is reduced as the slab is closer to fully clamped. The estimation of pretension in numerical analysis is complex, which makes it difficult to predict the accurate behaviour of the slab with respect to crack patterns and damage distribution. In addition to the FE model, the material model and its calibration is important to achieve accurate numerical results. However, the engineering strain-stress curves from the material tests were only measured until reaching the peak strength, and the post-peak behaviour was not calibrated in this study. A calibration of the material model including the tensile post-peak behaviour, along with triaxial and dynamic material data, is expected to improve the constitutive description of the concrete. Crack pattern and damage distribution of the undamaged slab for C35 according to the pretension force of the bolts (a) 5 kN, (b) 25 kN, (c) 35 kN, (d) 45 kN, (e) 65 kN. The fringe plots show the 1st principal Green-St. Venant strain.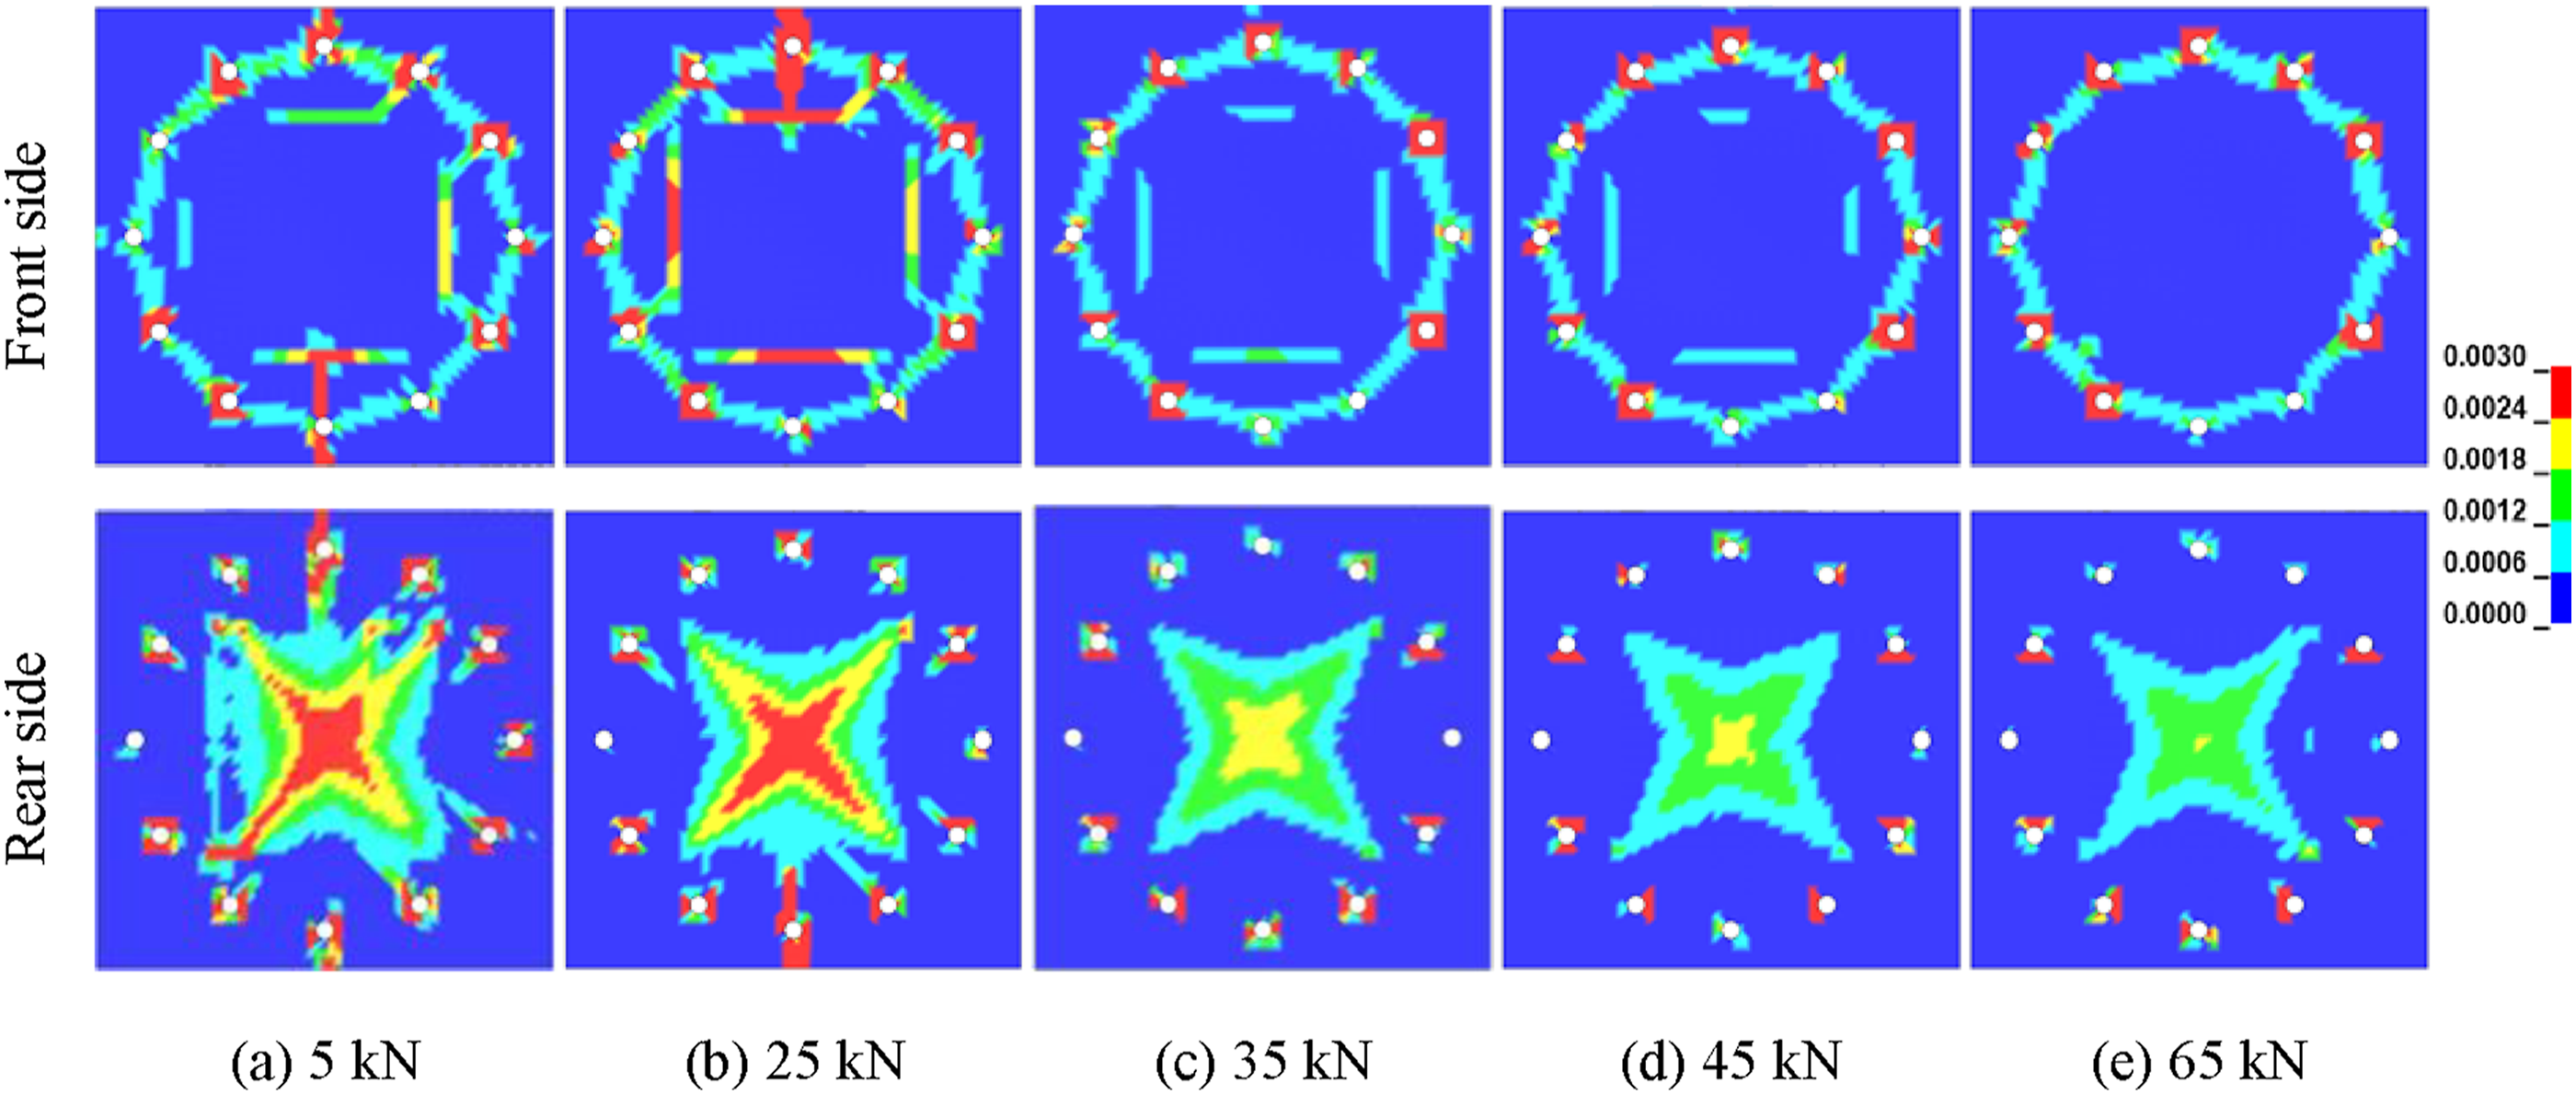
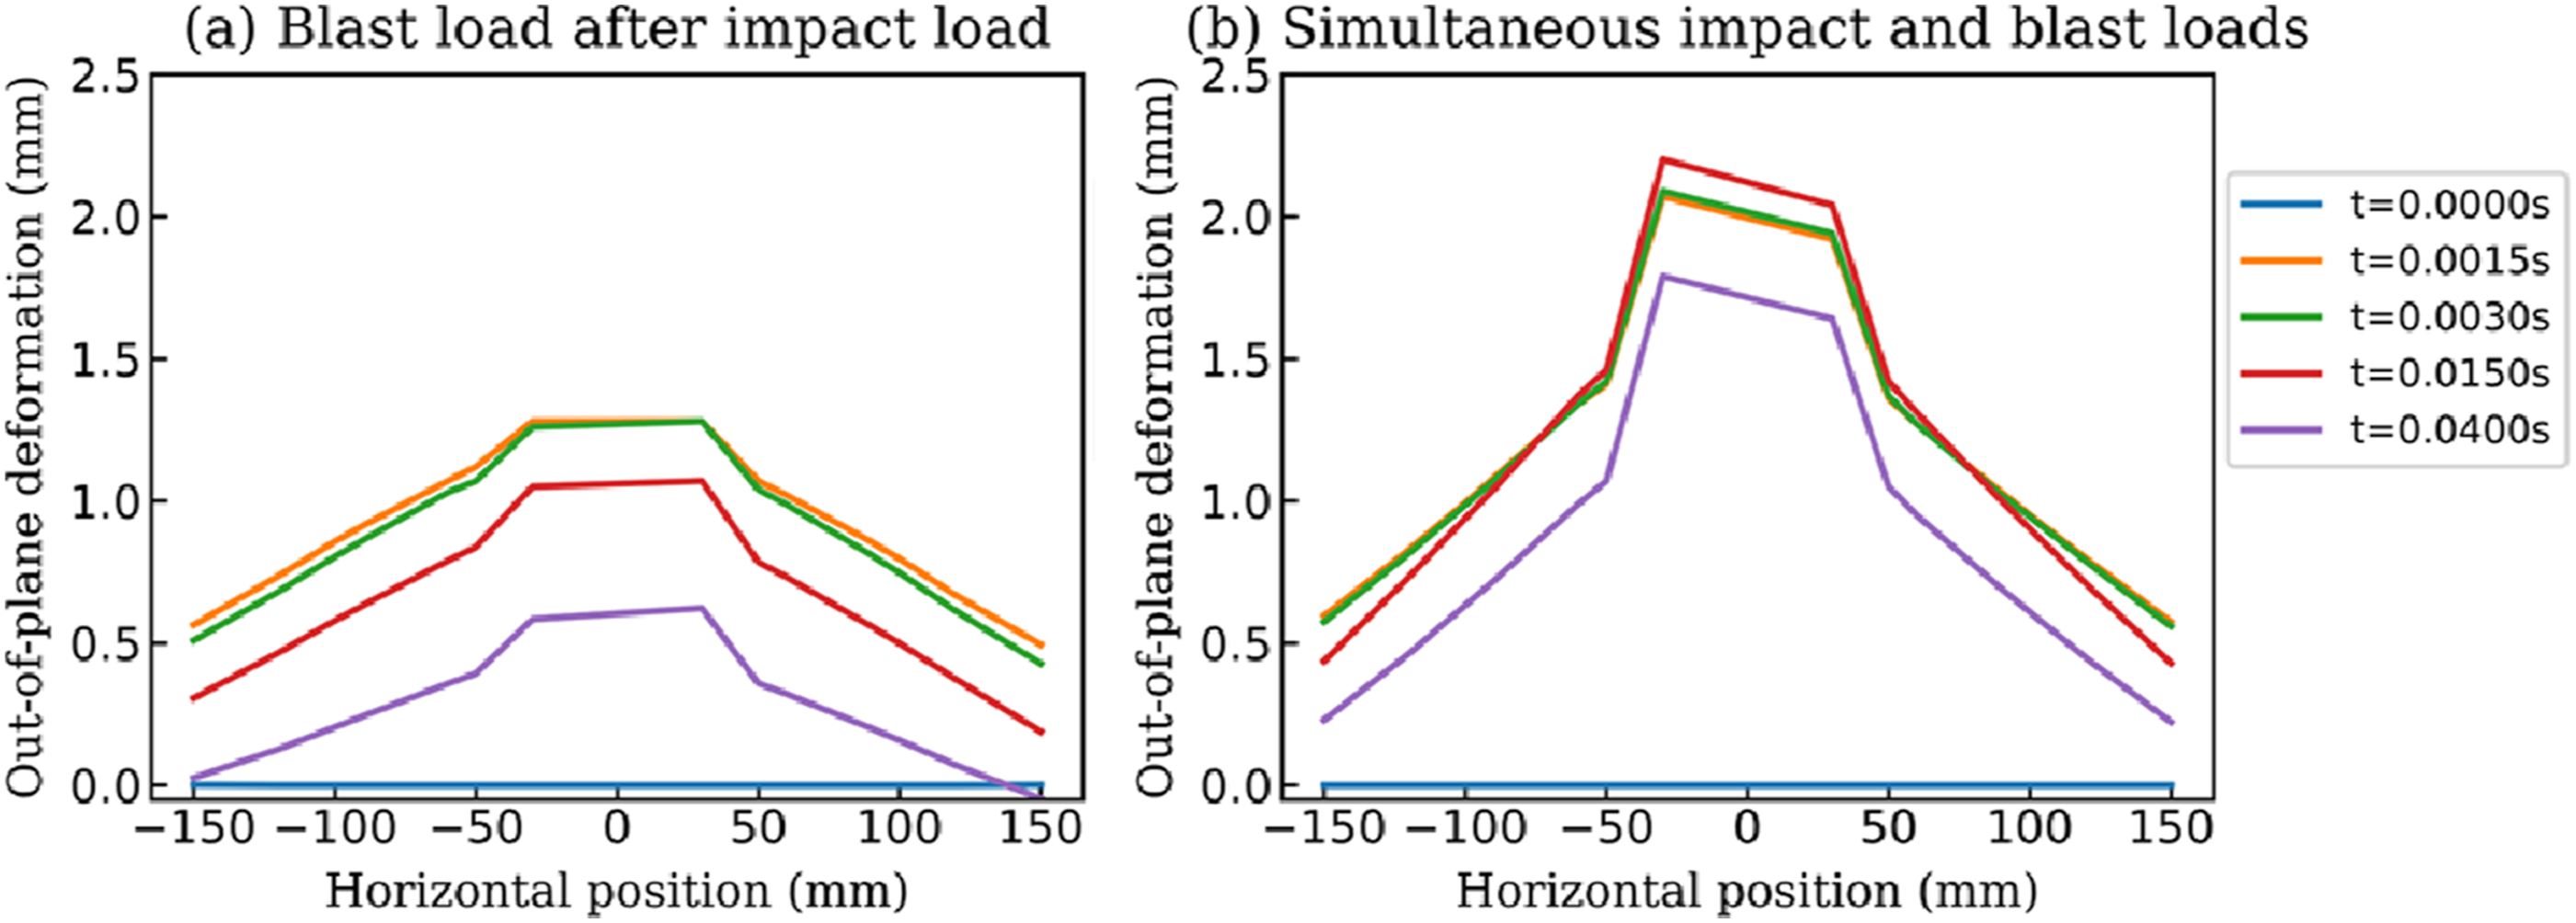
In addition, to assess the combined effects of impact and blast loadings on the structural response, two loading scenarios were considered: impact and blast loads applied separately and simultaneously. The case of separate loading represents the experimental C75-7 slab which was subjected to sequential impact and blast loads (blast load after impact load). In the case of simultaneous loading, the projectile impact was applied simultaneously to the blast model for the C75 slab in Figure 18(a). As shown in Figure 30, the crack pattern on both sides of the slab in the two load conditions is similar, but the projectile did not completely perforate the slab on the rear side when the simultaneous impact and blast loads was applied to the slab. We pose two main reasons for this, as previously mentioned in Section 4.4 and in Figure 26, and those are the added strain rate enhancement from the global dynamic response to the blast load, and the confining pressure on the entry side of the slab due to the bending. This effect is not unambiguous and depends on the initial velocity of the projectile. Nevertheless, the case of simultaneous loading does show a larger midpoint deflection of the slab than that of the separate loading as shown in Figure 31. This result is consistent with what was found in the study by Nyström and Gylltoft (Nyström and Gylltoft, 2009). Crack pattern of a C75 slab subjected to impact and blast loads separately or simultaneously. The fringe plots show the 1st principal Green-St. Venant strain. Deformation profiles for a C75 slab in the two loading scenarios: (a) Blast load after impact load, and (b) simultaneous impact and blast loads.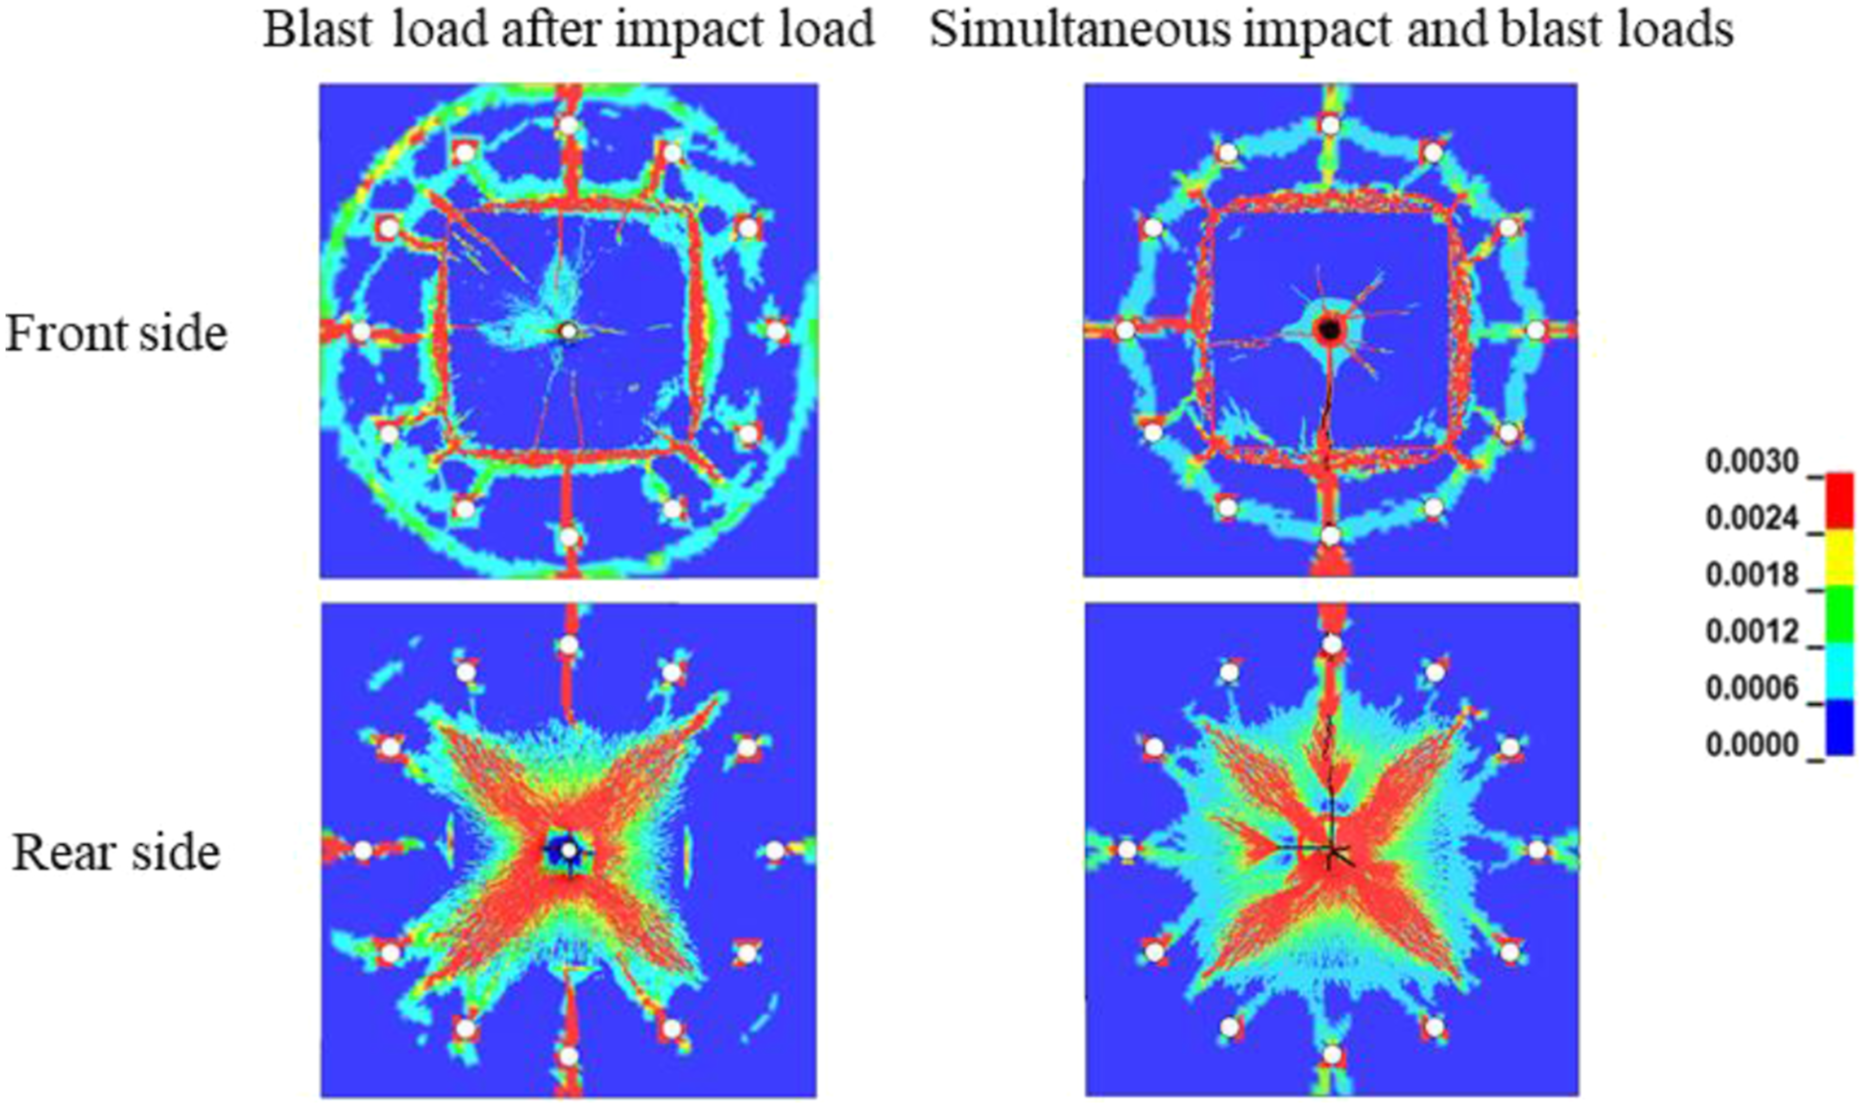
Conclusions
Based on the experimental work performed on both perforated and undamaged slabs, the following conclusions are drawn: • The ballistic limit velocity and the blast load response varied according to the concrete strength, with a seemingly stronger correlation for the blast load. • The ballistic impact load elicited a local response compared with the global bending deformation induced by the blast-like load. A blast load thus invoked the response of a larger fraction of the structure, which may explain the stronger correlation with material strength for the blast load. • Based on the shock tube tests, undamaged and perforated slabs showed no significant qualitative or quantitative difference in terms of the applied pressure magnitude. This means that the hole produced by the ballistic impact from the projectile did little to alleviate the pressure from the shock wave. • Perforated slabs subjected to blast loading suffered more fragment detachment due to prior cracking, but the out-of-plane deformations were comparable to that of the undamaged slabs. • No significant effects resulting from combined impact and blast loading were found, apart from the detachment of more fragments.
The main findings from the finite element simulations are as follows: • Finite element models of ballistic impact require a fine mesh in the impact zone for accurate results. This has negative consequences for subsequent blast load simulations, which must capture a global response over a much larger time span. • The span length and bolt holes of the concrete slab have a negligible effect on the perforation simulations because the deformations are limited to the local area around the perforation channel. However, the damage distribution in the blast simulation depends on the boundary conditions because the global response is significantly affected by the span length and the pretension of the bolts. • The simulation results indicated that the perforation resistance of the concrete slab increased when the impact and blast load occurred simultaneously for impact velocities close to the ballistic limit. Thus, applying the impact load and the blast load separately, rather than simultaneously, appears to yield more conservative results.
Footnotes
Acknowledgements
The authors would also like to thank Mr Steinar Seehuus, Mr Trond Auestad, Ms Guri Lillehaug and Ms Marte Vestermo Nesje for assistance with the experimental programmes.
Declaration of conflicting interests
The author(s) declared no potential conflicts of interest with respect to the research, authorship, and/or publication of this article.
Funding
The author(s) disclosed receipt of the following financial support for the research, authorship, and/or publication of this article: The present work has been carried out with financial support from the Norwegian Defence Estates Agency and the Centre for Advanced Structural Analysis (SFI CASA) at the Norwegian University of Science and Technology (NTNU) supported by the Research Council of Norway through project no. 237885 (CASA). The National Research Foundation of Korea (NRF) grant funded by the Korean government (MSIT) (no. RS-2023-00212437) is also acknowledged. The authors would also like to thank Mr Steinar Seehuus, Mr Trond Auestad, Ms Guri Lillehaug and Ms Marte Vestermo Nesje for assistance with the experimental programmes.