
Abstract
In the traditional design method, structures are usually assumed as rigid base structures without considering soil-structure interaction (SSI). However, whether the effect of SSI on the seismic performance of structures is beneficial or detrimental is far from consensus among researchers. Moreover, previous literature mostly concentrated on the seismic behaviour of mid-rise buildings and moment-resisting frames. Therefore, it is in real need to comprehensively investigate the seismic response of tall buildings considering SSI. In this study, a soil-foundation-structure model developed in finite element software and verified by shaking table tests is used to critically explore the effects of SSI on high-rise buildings with a series of superstructure and substructure parameters. The beneficial and detrimental impacts of SSI are identified and discussed. Numerical simulation results indicate the rise in the stiffness of subsoil can dramatically amplify the base shear of structures. As the foundation rotation increases, inter-storey drifts are increased, and base shears are reduced. In general, SSI amplifies the inter-storey drifts showing detrimental effects of SSI. However, as for the base shear, SSI exerts detrimental effects on most piled foundation cases as well as classical compensated foundation structures resting on Ce soil, whereas, for compensated foundation structures resting on soil types De and Ee, effects of SSI are beneficial since the base shear is reduced. Moreover, regarding buildings with different structural systems and foundation types, minimum base shear ratios considering the SSI reduction effect are presented.
Keywords
Introduction
With the reduction of urban construction land and the rise of land price, high-rise buildings with multiple underground stories are becoming more and more popular than several years ago (Al Agha et al., 2021; Bryce et al., 2019; Segaline et al., 2022). Among the various structural forms of tall buildings, frame-core tube structures and frame-shear wall structures combine the advantages of flexible layout and high ductility of frame structures and the advantages of large stiffness and high bearing capacity of shear wall structures (Gao et al., 2005). In general, when resisting earthquake action, the shear wall (core tube) is the first line of defence, and the frame is the second line of defence, forming dual lateral force resistance systems to provide excellent abilities to resist earthquake effects (Lu, 2005; Son et al., 2017). As a result, frame-core tube structures and frame-shear wall structures with multiple basement stories are the most common structural forms of tall buildings in the world today (Ayala et al., 2022; Karki et al., 2021).
In the design process of tall buildings, the fixed-base assumption is only valid when the structure is constructed on a stiff soil medium because the foundation input motion is almost equal to the free-field motion (Far, 2020; Haydar et al., 2018; Saleh et al., 2018). If the structure is rested on relatively soft subsoil, the foundation input motion will not conform to the free-field motion due to the rigidity of the foundation (Anand and Satish Kumar, 2018; Far and Flint 2017; Lin et al., 2019). In addition, the seismic response of the structure may deform the subsoil and alter the input motion (Wolf and Deeks, 2004). These two impacts, normally referred to as kinematic interaction and inertial interaction, are the main mechanisms behind soil-structure interaction (SSI).
After the soil system is considered, a large part of the energy is dissipated into the subsoil when the superstructure is in vibration (Wolf, 1985) and the increased damping will considerably alleviate the seismic response and decrease the base shear (V). Nevertheless, horizontal movement and rotation of the foundation will be incorporated into the soil-structure system because of the flexibility and compatibility of the subsoil, which can increase the lateral deformations (Δ) and inter-storey drifts (δ) of the superstructure (Far, 2019; Tabatabaiefar and Clifton, 2016). Therefore, whether the effect of SSI is beneficial or detrimental needs to be further investigated and discussed.
Summary of SSI Effects in Previous Studies.
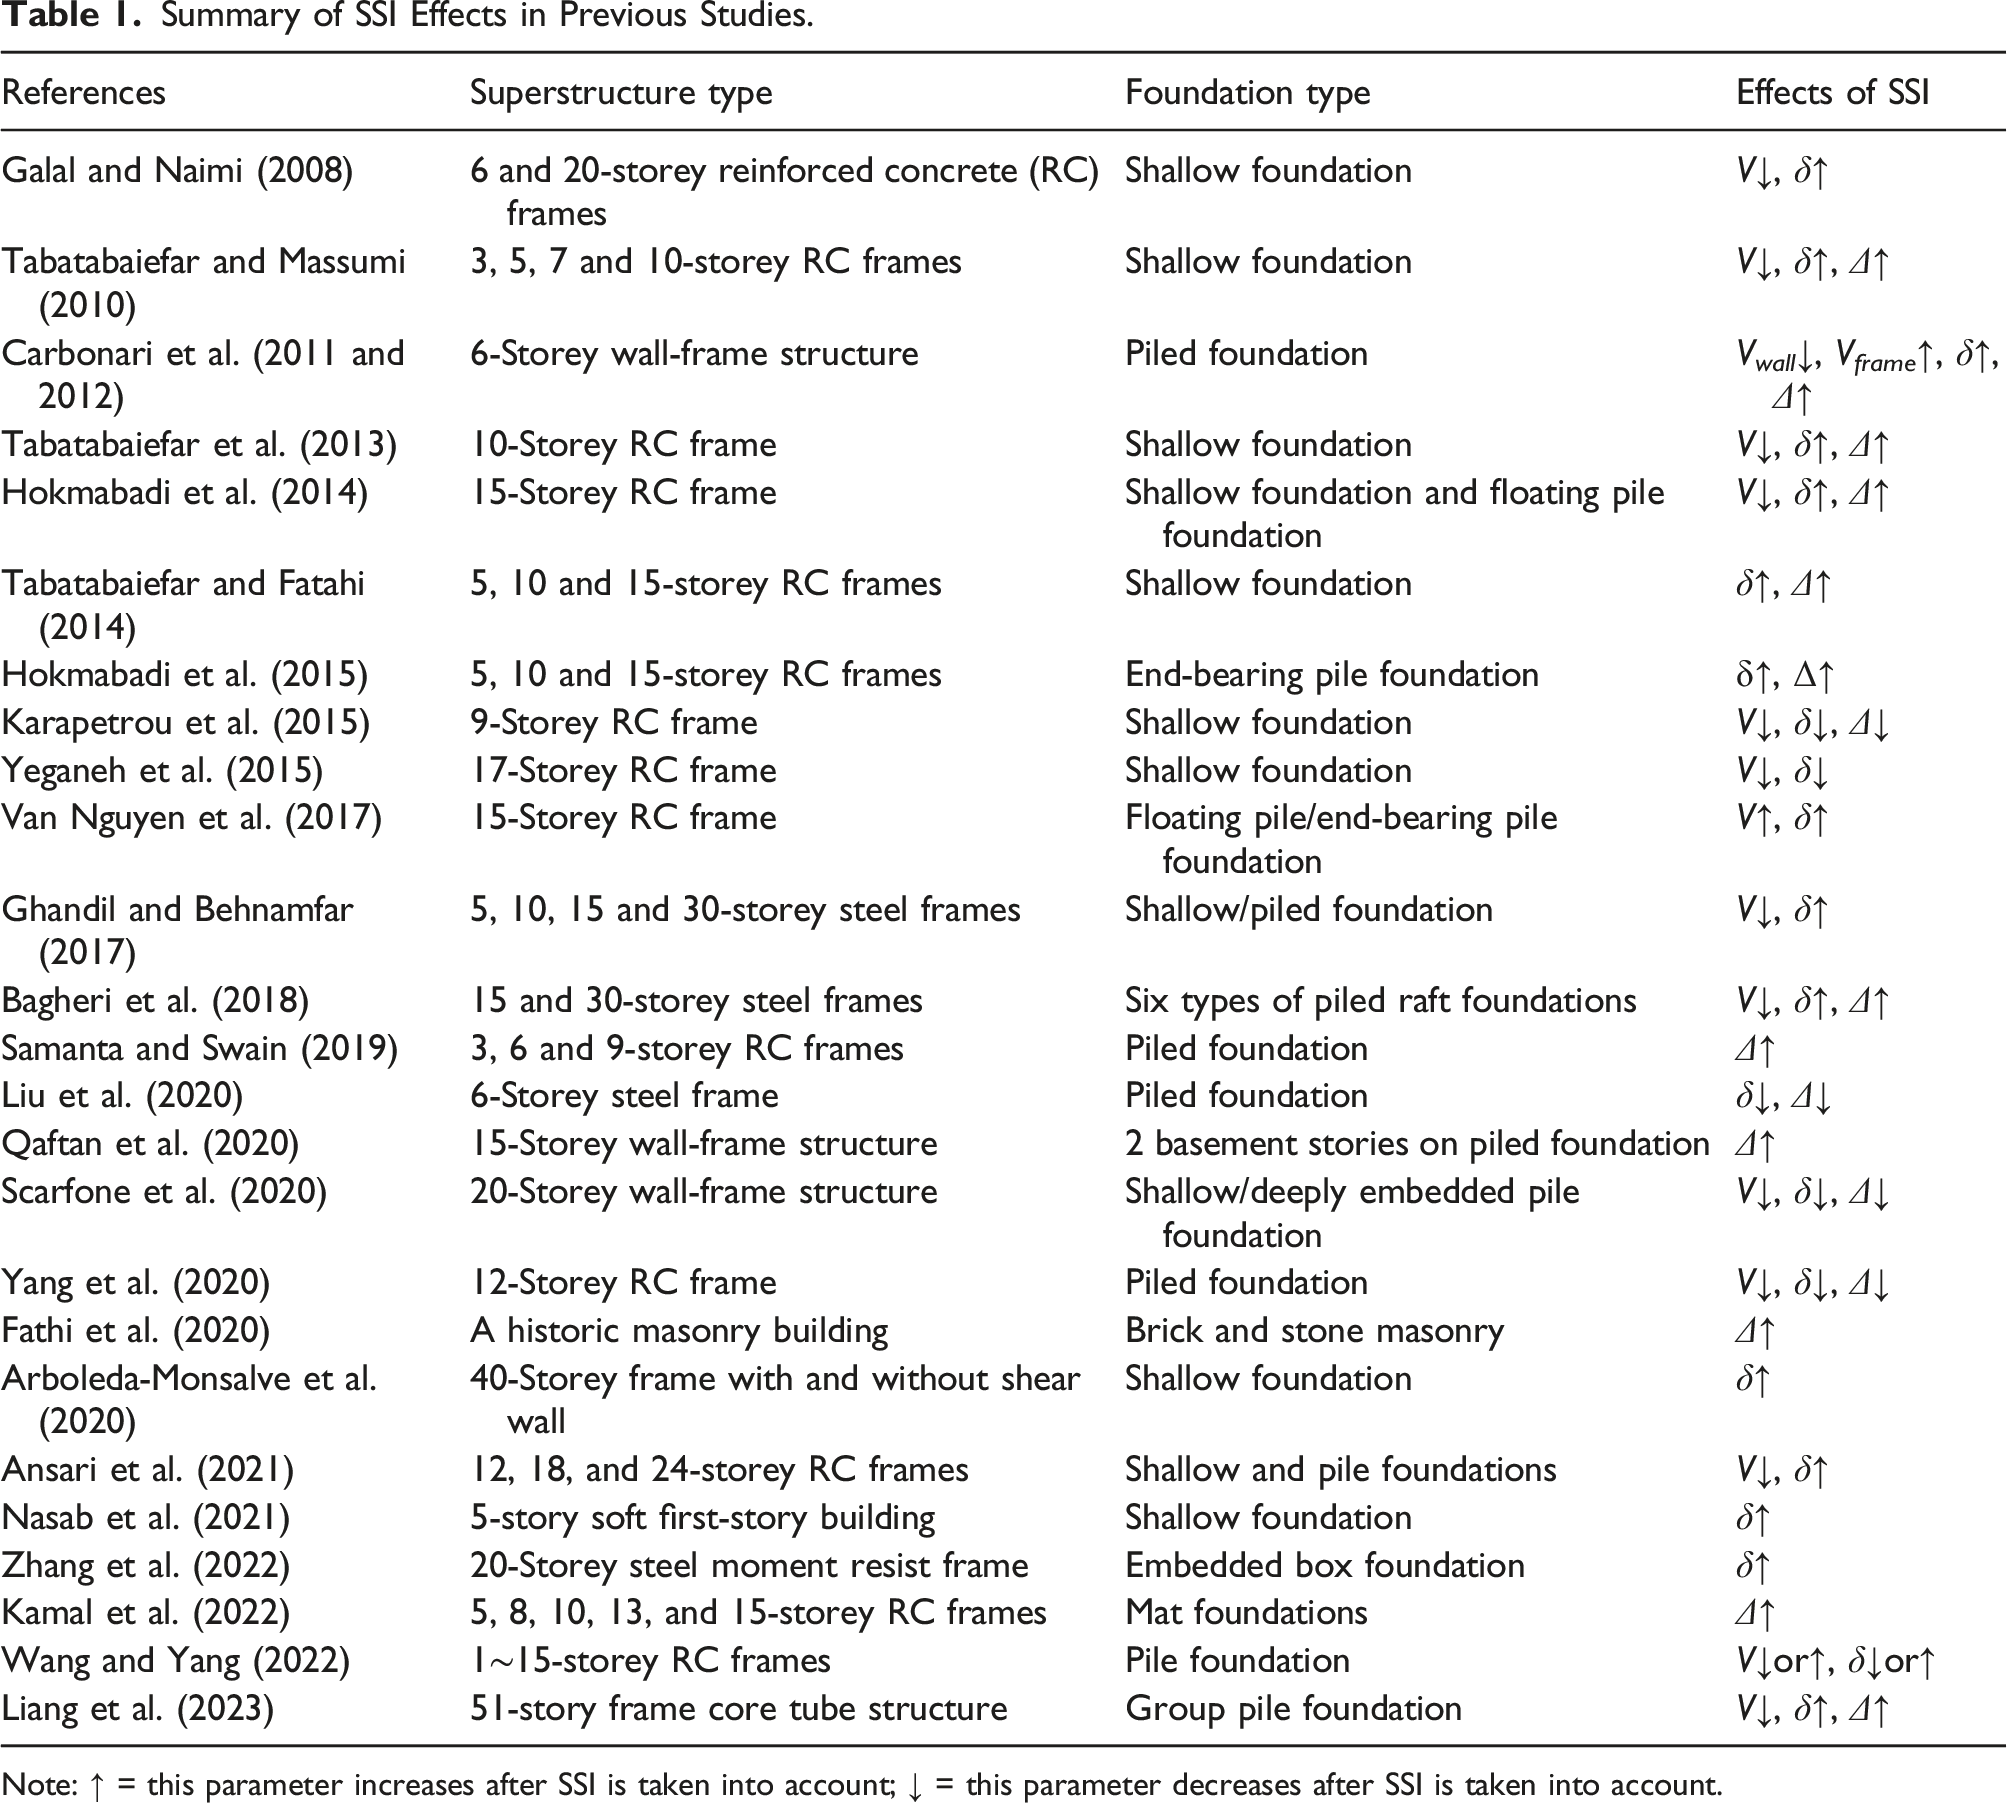
Note: ↑ = this parameter increases after SSI is taken into account; ↓ = this parameter decreases after SSI is taken into account.
In this study, a numerical soil-structure model is established using Abaqus to investigate the seismic response of high-rise buildings. The shaking table tests were employed to verify the validity of the numerical model. After that, extensive parametric studies have been conducted on frame-core tube structures and frame-shear wall structures. The parameters include structural heights, height-width ratios (HWR), foundation types, soil types and bedrock depths (BD). For each case, four different seismic records were applied to investigate the seismic governing factors (V and δ) of the superstructure. Therefore, this study has calculated a total of 72 rigid base cases and 720 flexible base cases. By analysing the seismic response of a great number of tall buildings cases, the beneficial and detrimental scenarios for high-rise buildings considering SSI can be identified and code-based procedures are developed to provide a safe and economical structural design method.
Parameters of the structure and the subsoil
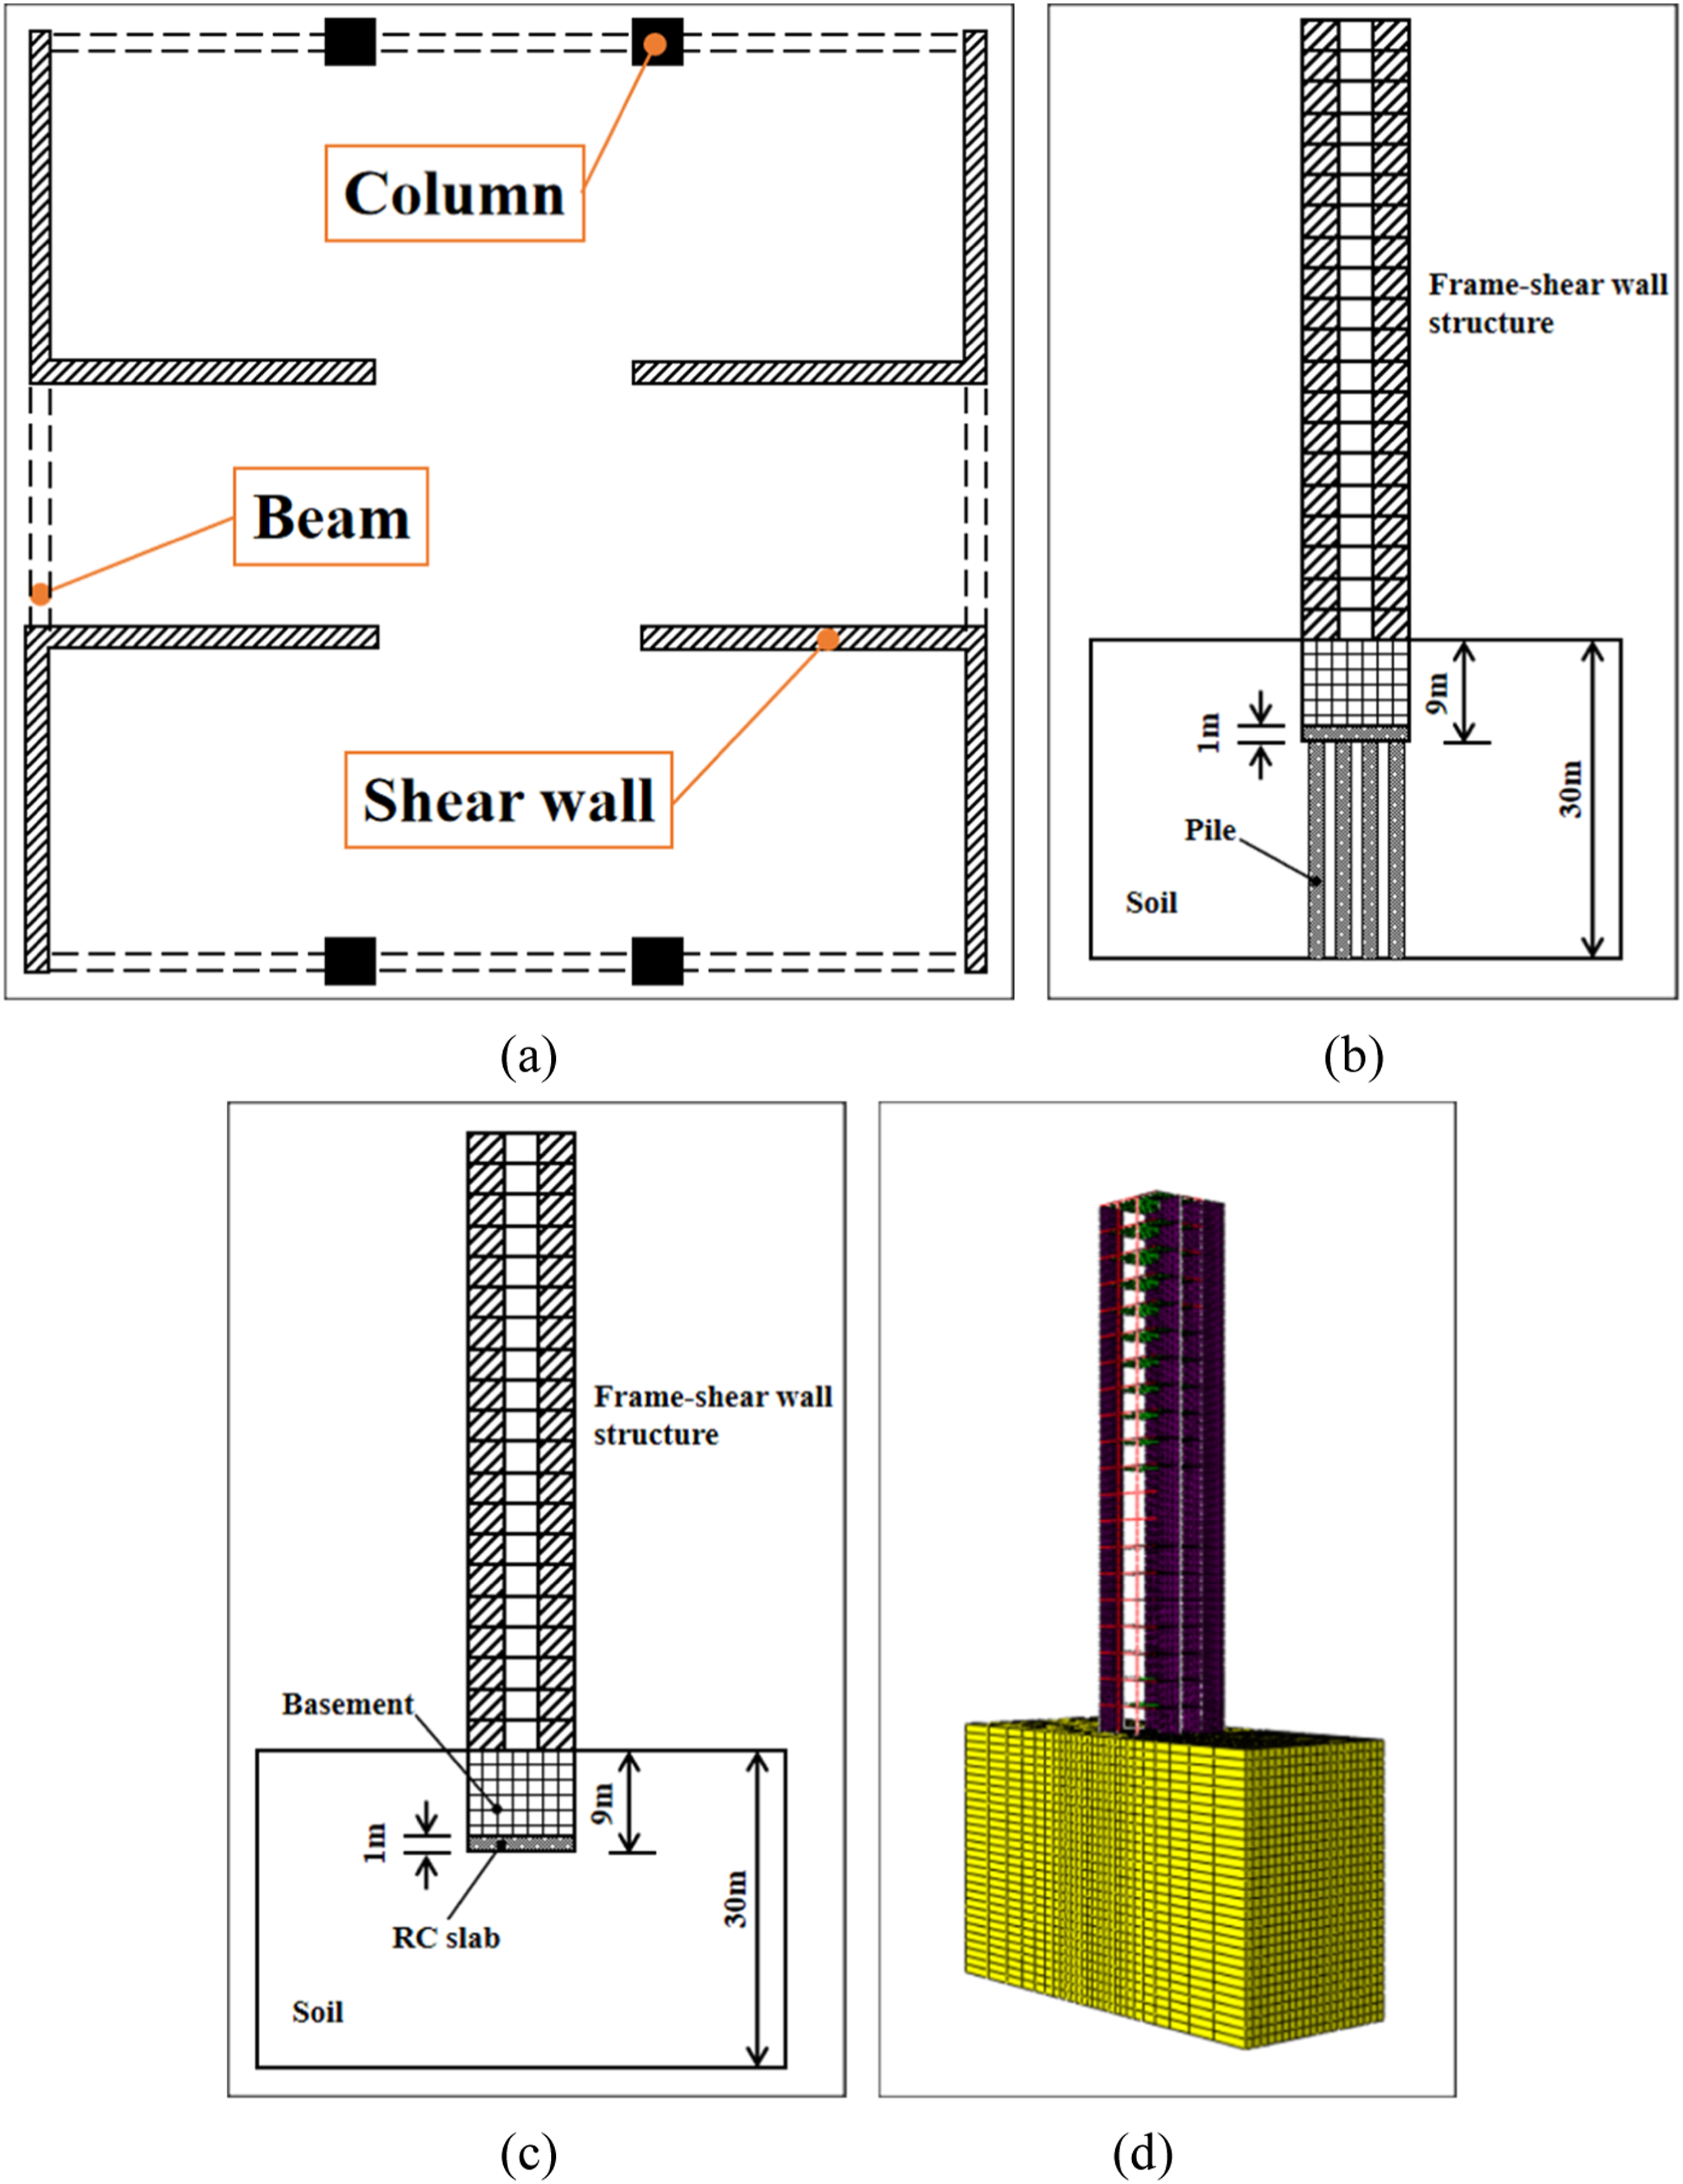
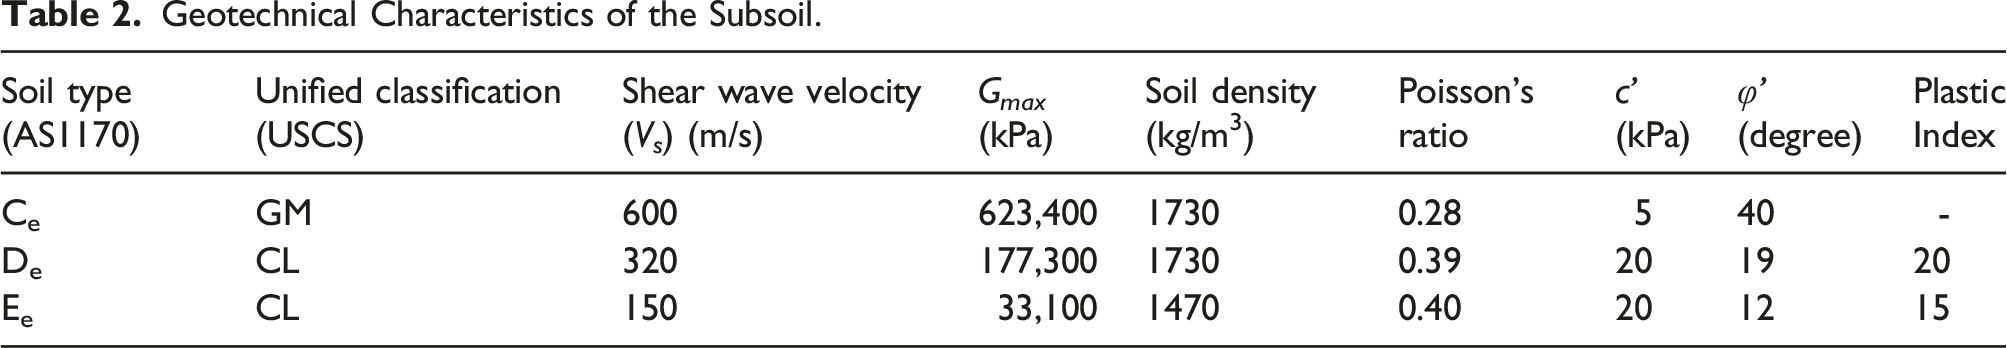
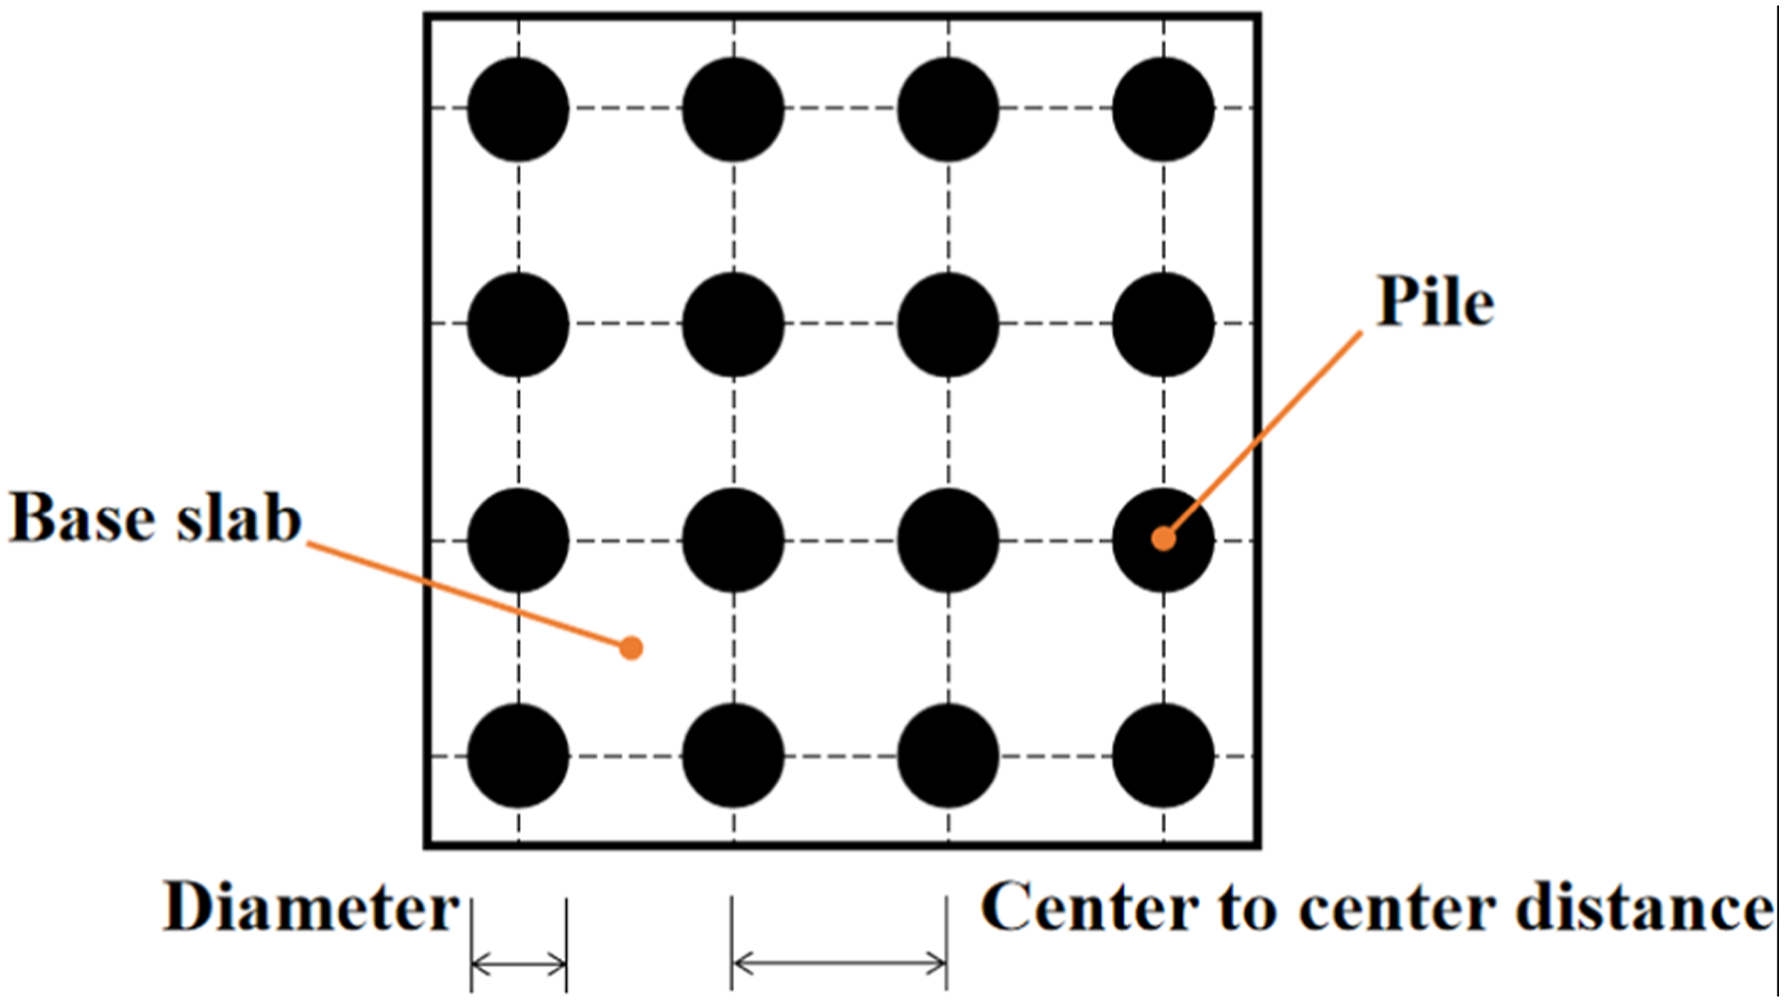
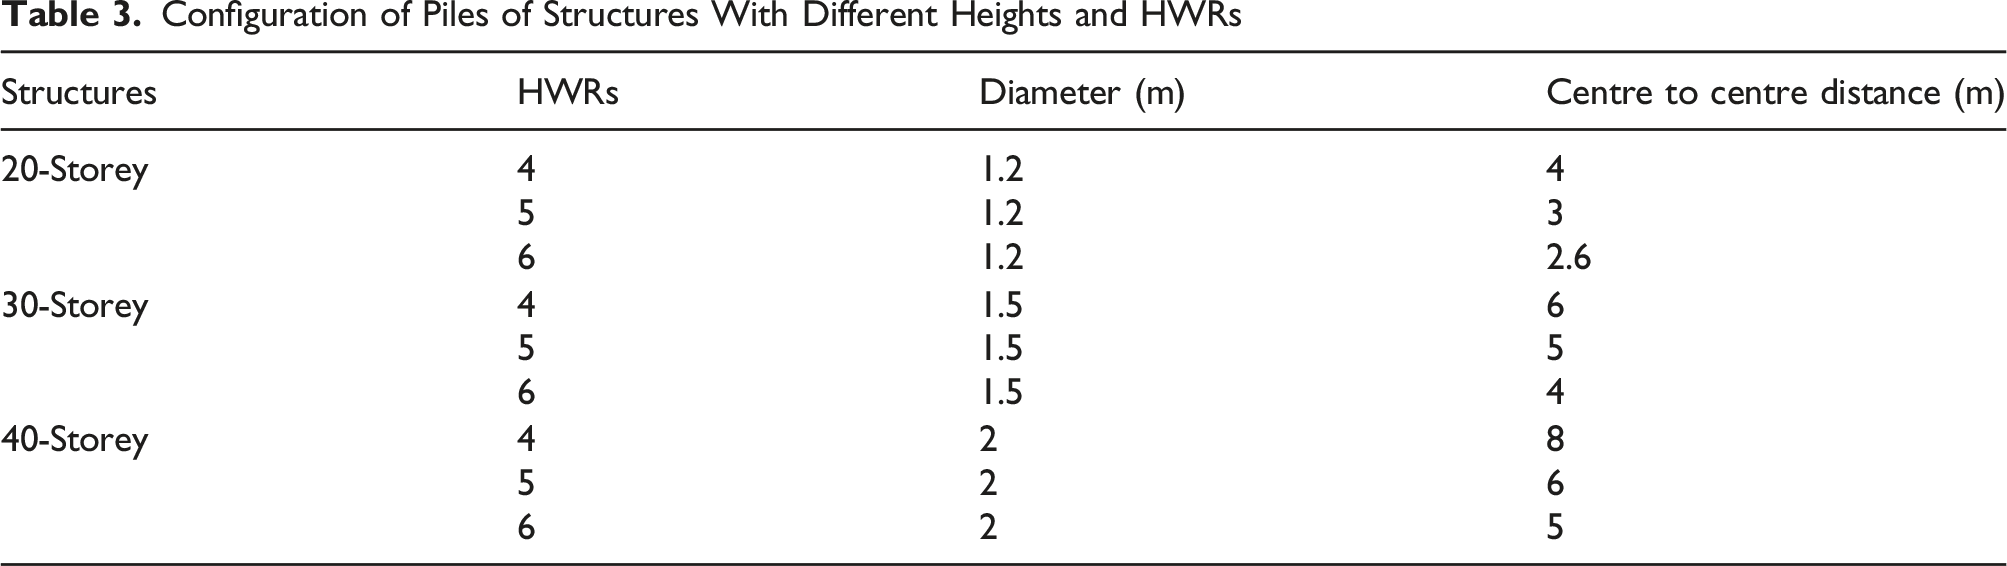
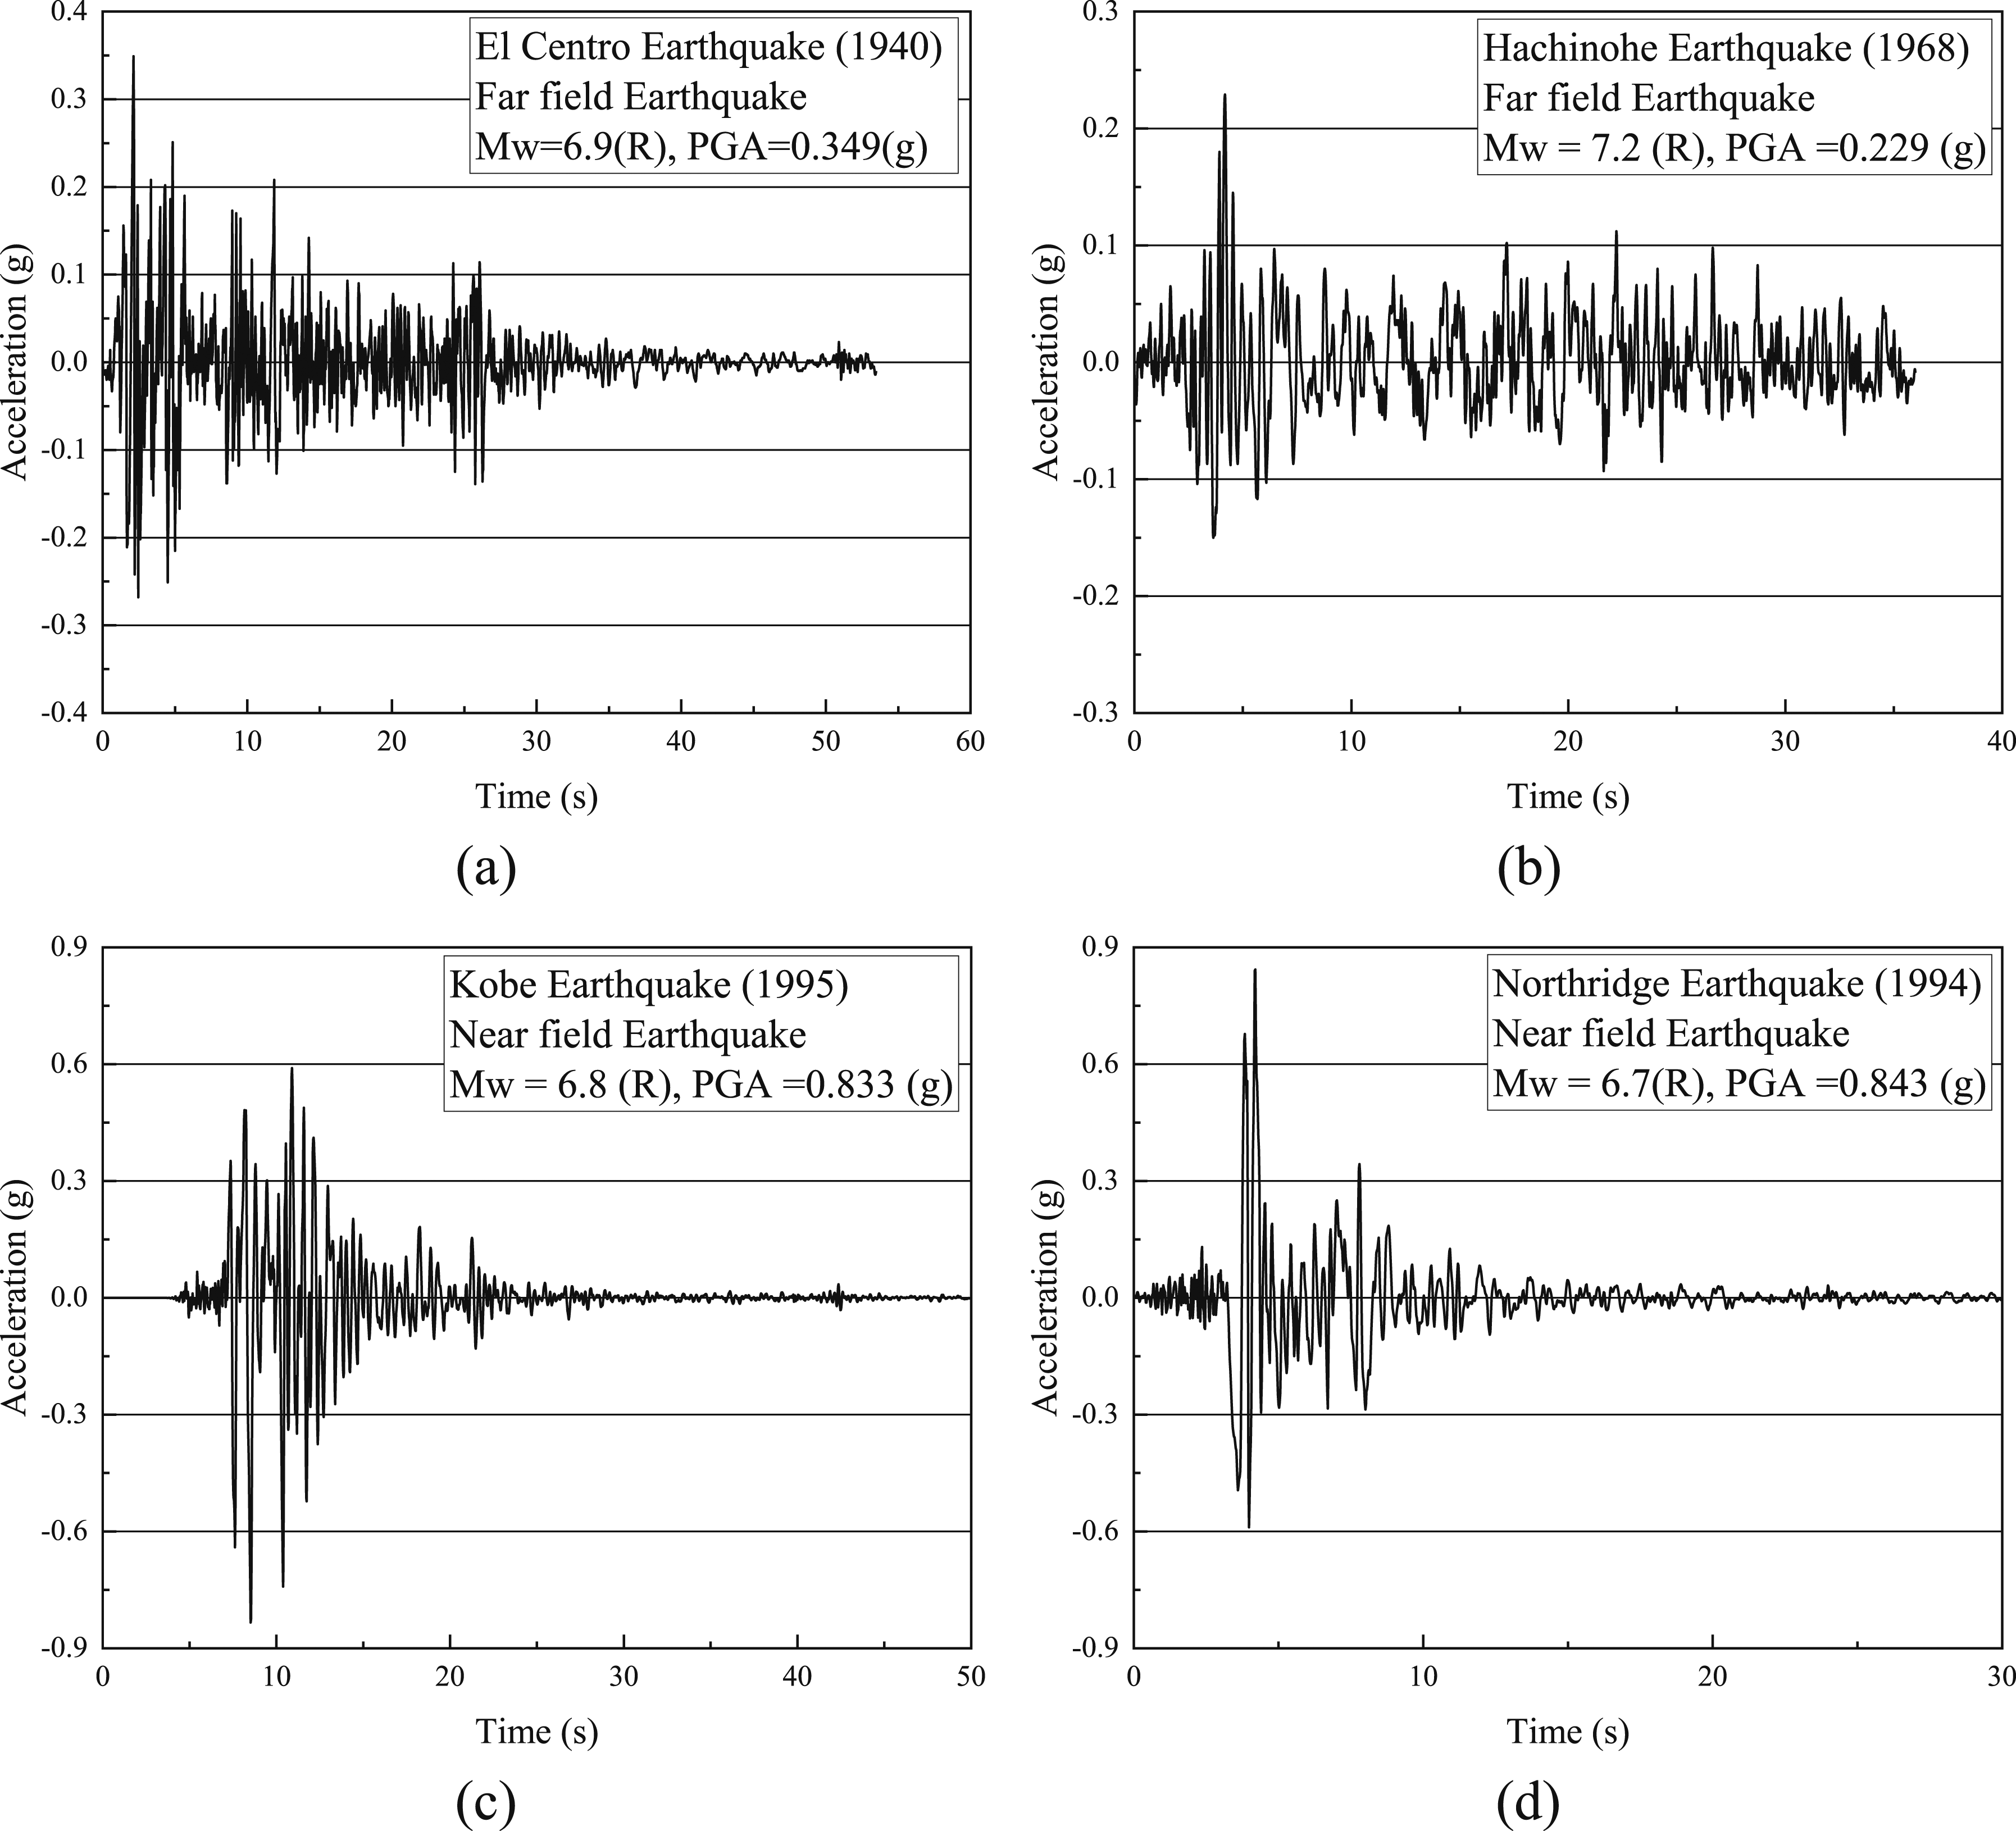
Two commonly used structural systems: frame-core tube structure and frame-shear wall structure with three different structural heights: 60 m (20-storey), 90 m (30-storey) and 120 m (40-storey) are considered in this study. For each structural height, three HWRs of 4, 5, six are considered. The arrangement of shear walls (core tube) and columns is shown in Figure 1(a) and Figure 2(a). According to AS 1170.4 (2007), three different soil types: Ce, De, and Ee soil are adopted and their geotechnical properties are presented in Table 2 (Tabatabaiefar and Fatahi, 2014). Additionally, as shown in Figure 1(b) and (c) and Figure 2(b) and 2(c), end bearing piled foundation and classical compensated foundation are taken into account. A compensated foundation in building design is sufficiently deep to allow the removed soil weight to offset the building weight. The arrangement and dimensions of piles for buildings of different heights and HWRs have shown in Figure 3 and Table 3. For each model, two far-field and two near-field earthquake motions (Figure 4) are applied. The setup of the frame-core tube structure: (a) plan view of the standard storey (b) end bearing piled foundation-supported structure (c) classical compensated foundation-supported structure (d) the finite-element model. The setup of the frame-shear wall structure: (a) plan view of the standard storey (b) end bearing piled foundation-supported structure (c) classical compensated foundation-supported structure (d) the finite-element model. Geotechnical Characteristics of the Subsoil. Pile arrangement adopted in this study. Configuration of Piles of Structures With Different Heights and HWRs Adopted seismic records: (a) El Centro earthquake; (b) Hachinohe earthquake; (c) Kobe earthquake; (d) Northridge earthquake.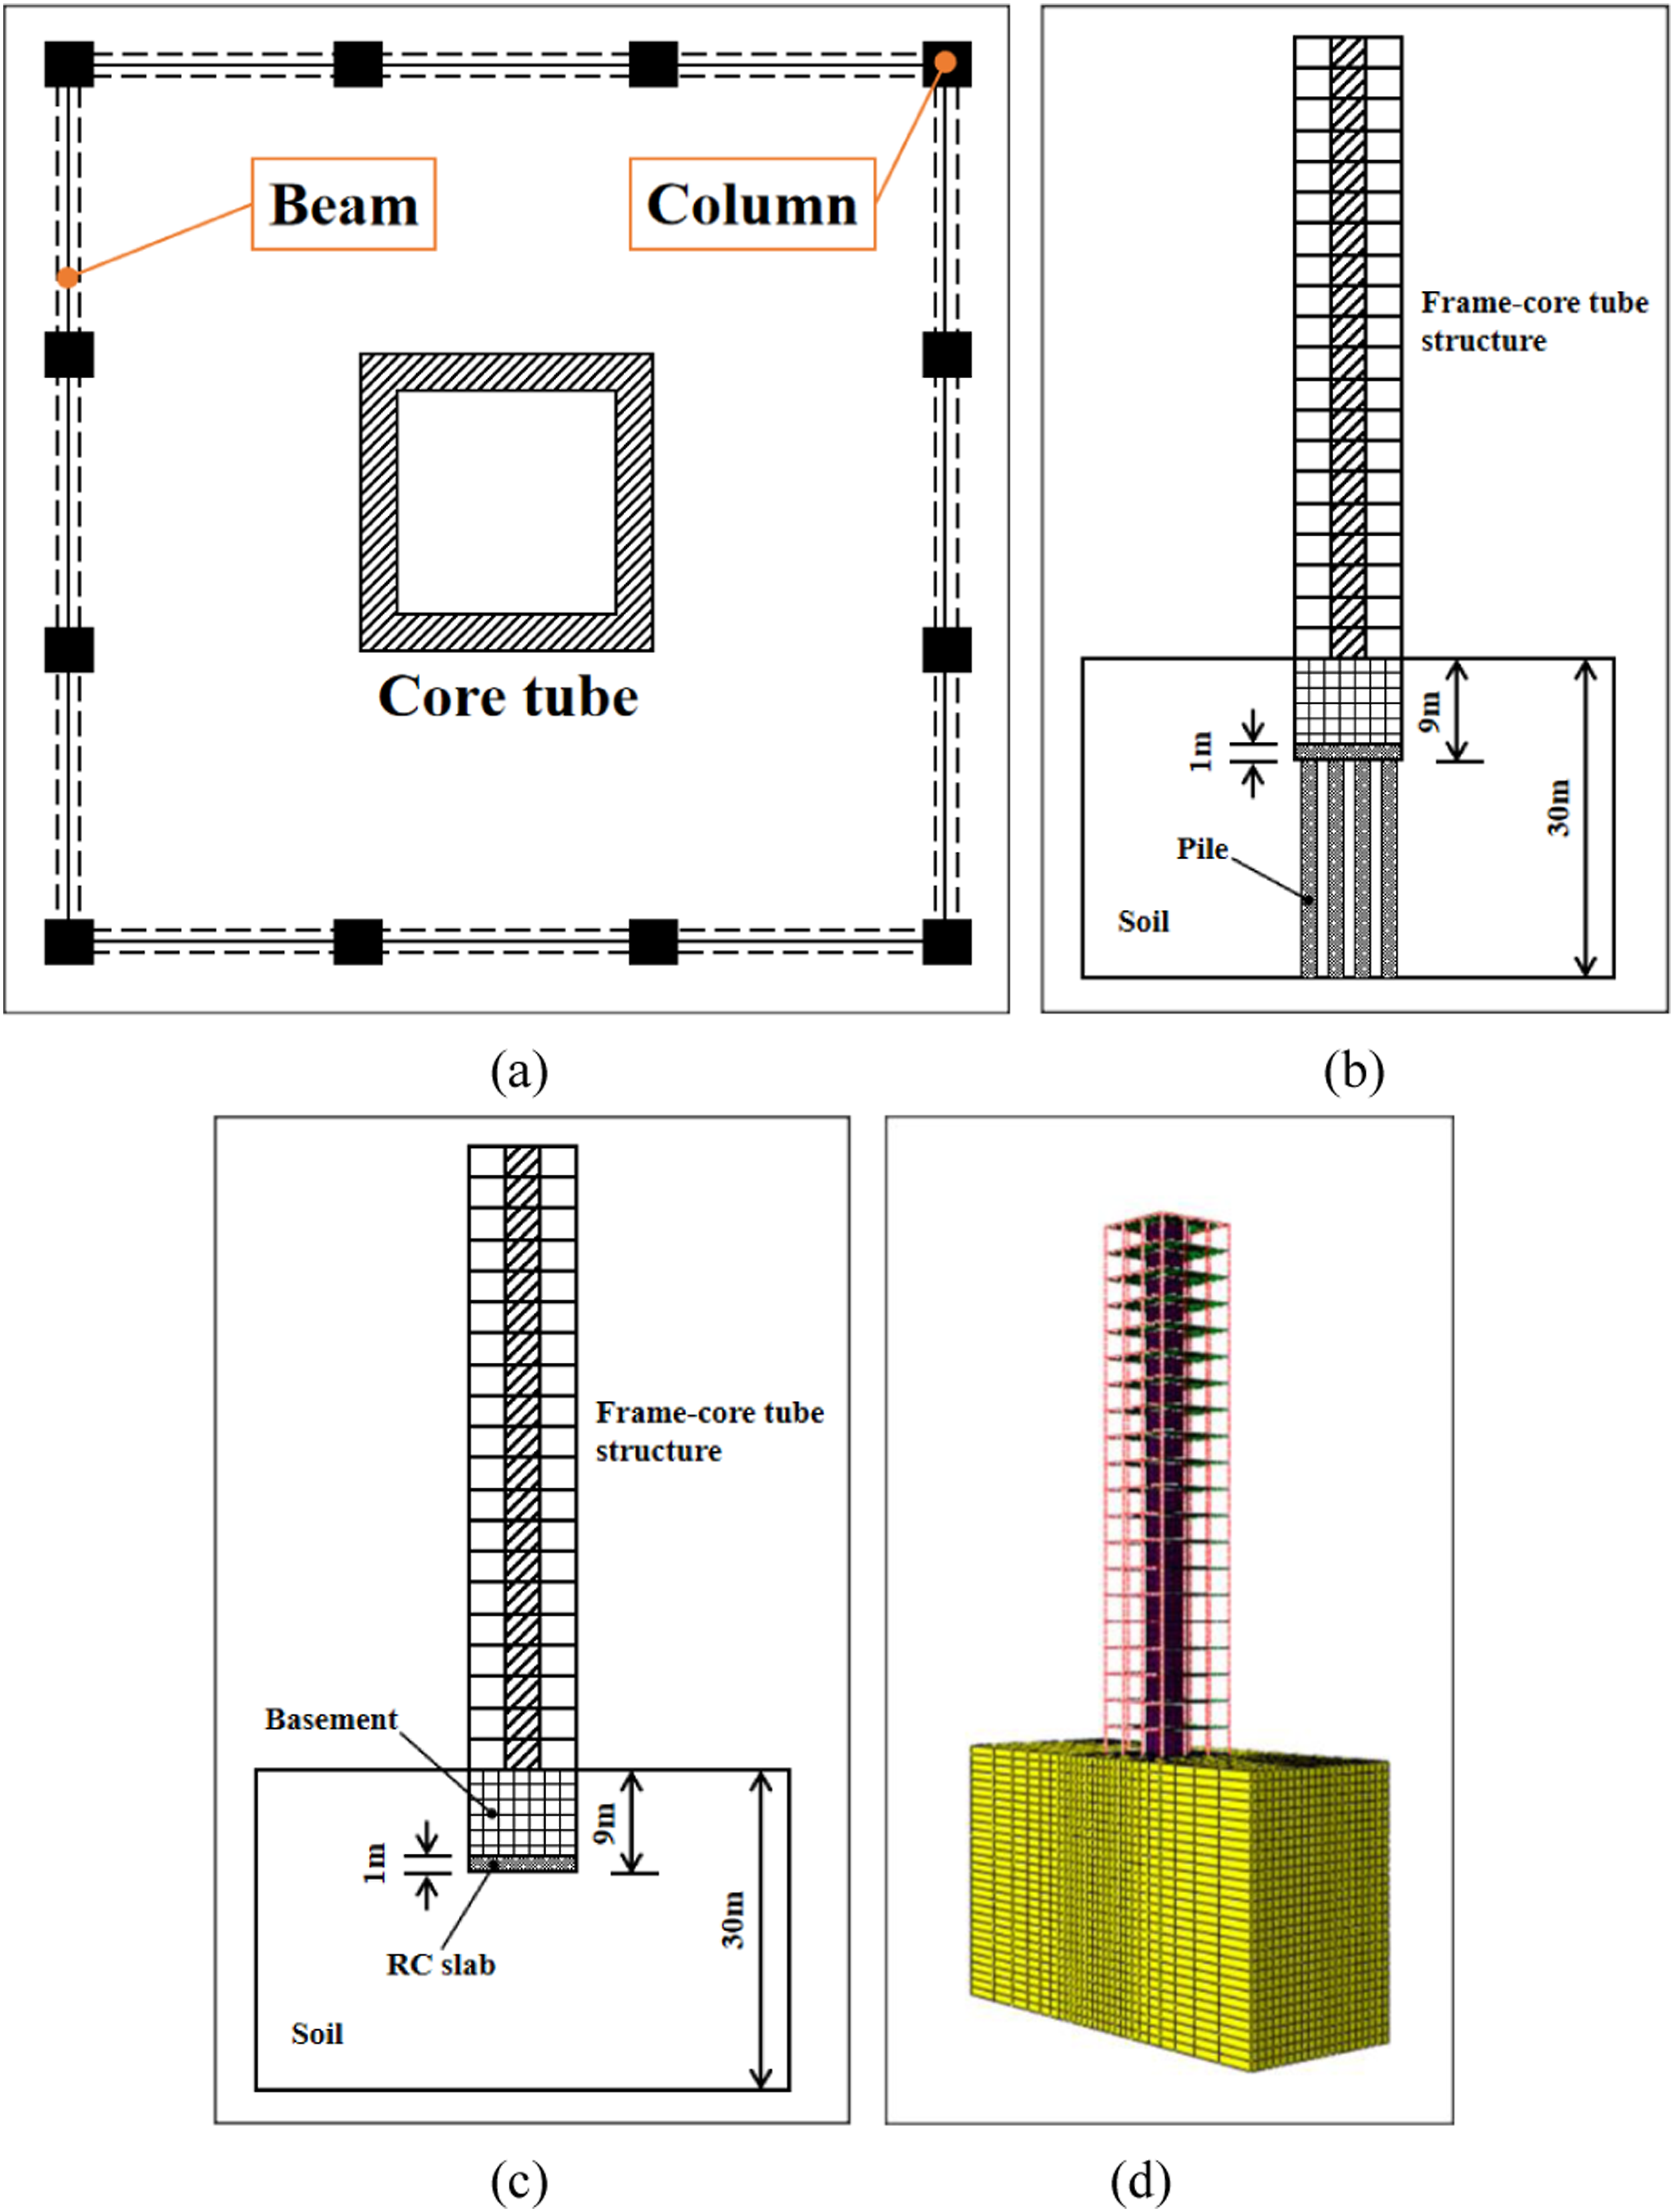
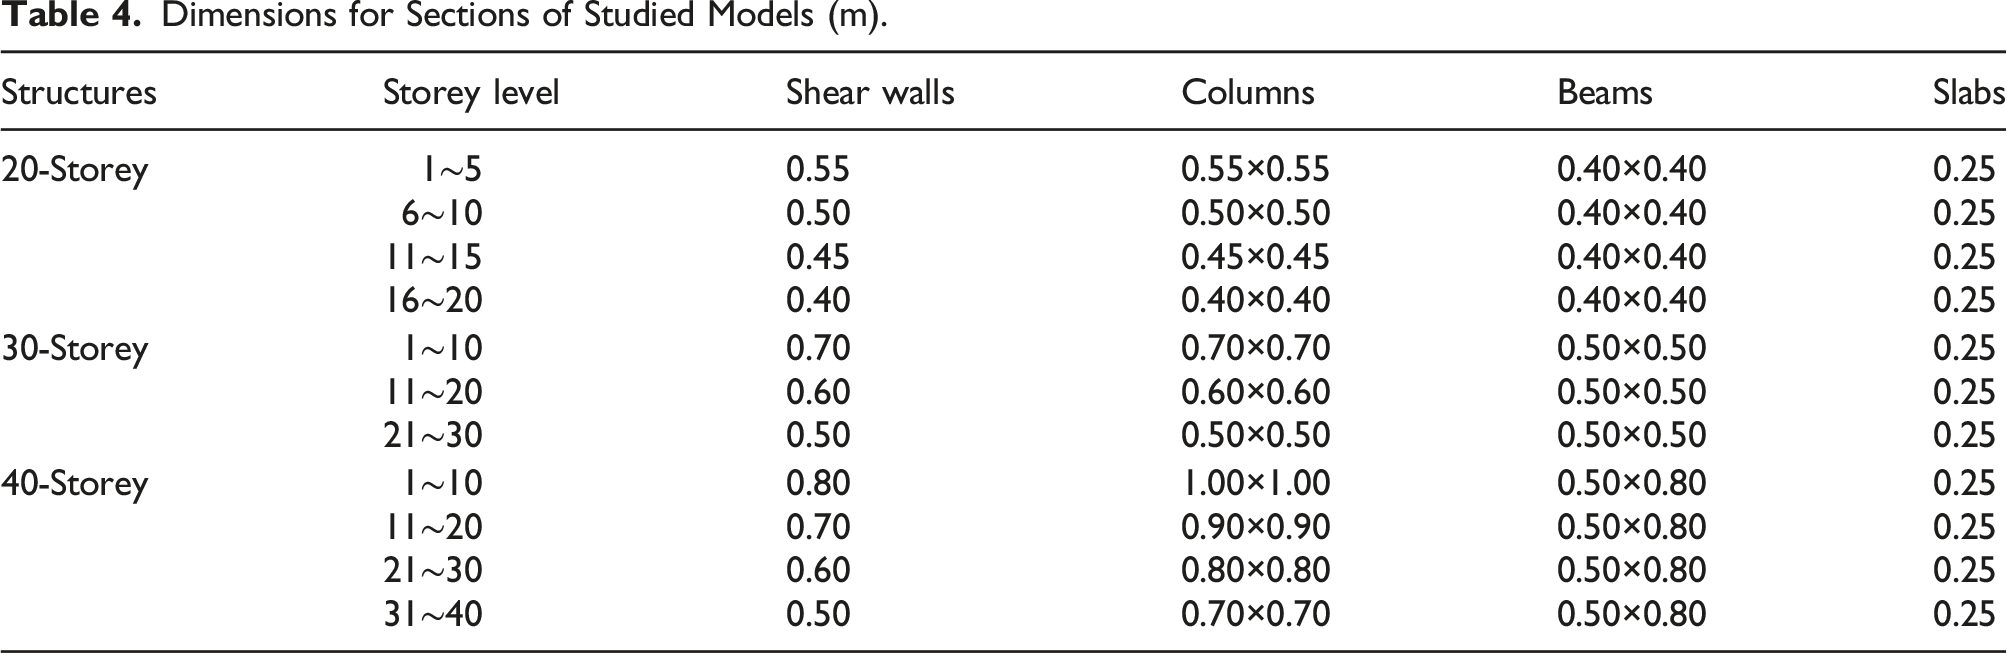
Dimensions for Sections of Studied Models (m).
Natural Periods of 20-Storey Fixed-base and Flexible-base Frame-core Tube Models (s).

Natural Periods of 30-Storey Fixed-base and Flexible-base Frame-core Tube Models (s).

Natural Periods of 40-Storey Fixed-base and Flexible-base Frame-core Tube Models (s).

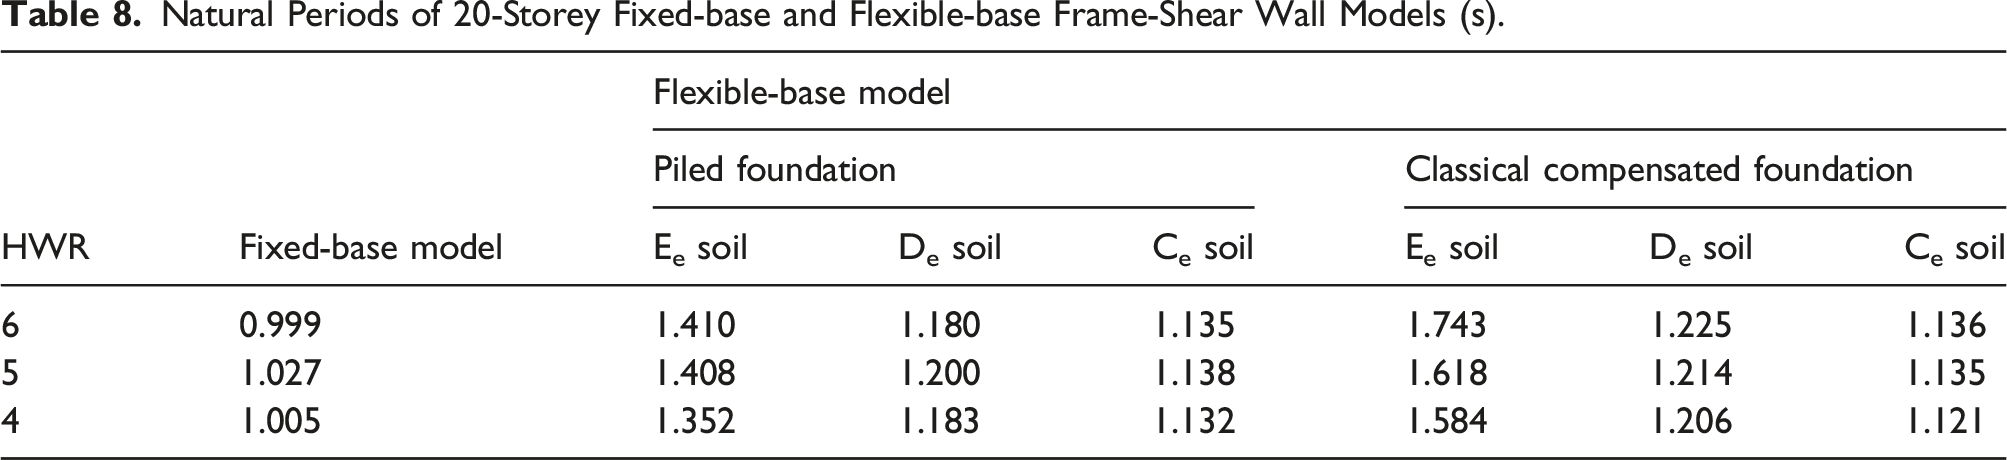
Natural Periods of 20-Storey Fixed-base and Flexible-base Frame-Shear Wall Models (s).
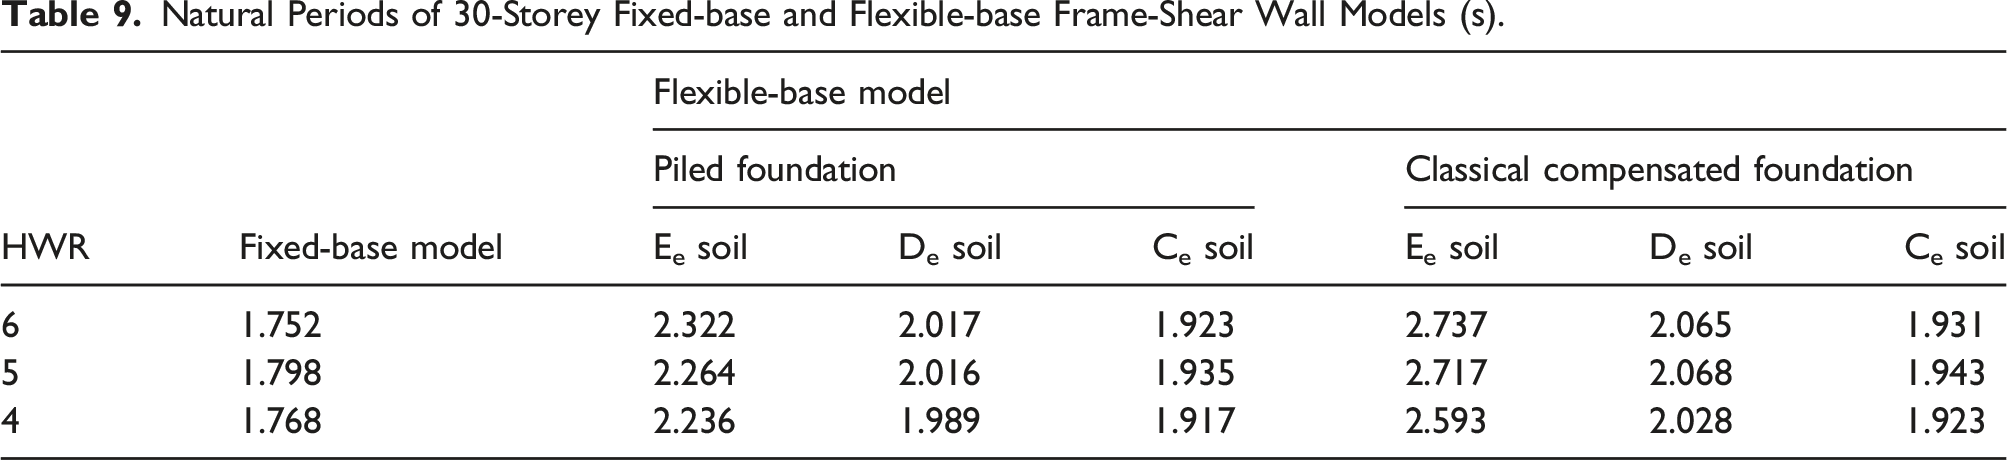
Natural Periods of 30-Storey Fixed-base and Flexible-base Frame-Shear Wall Models (s).
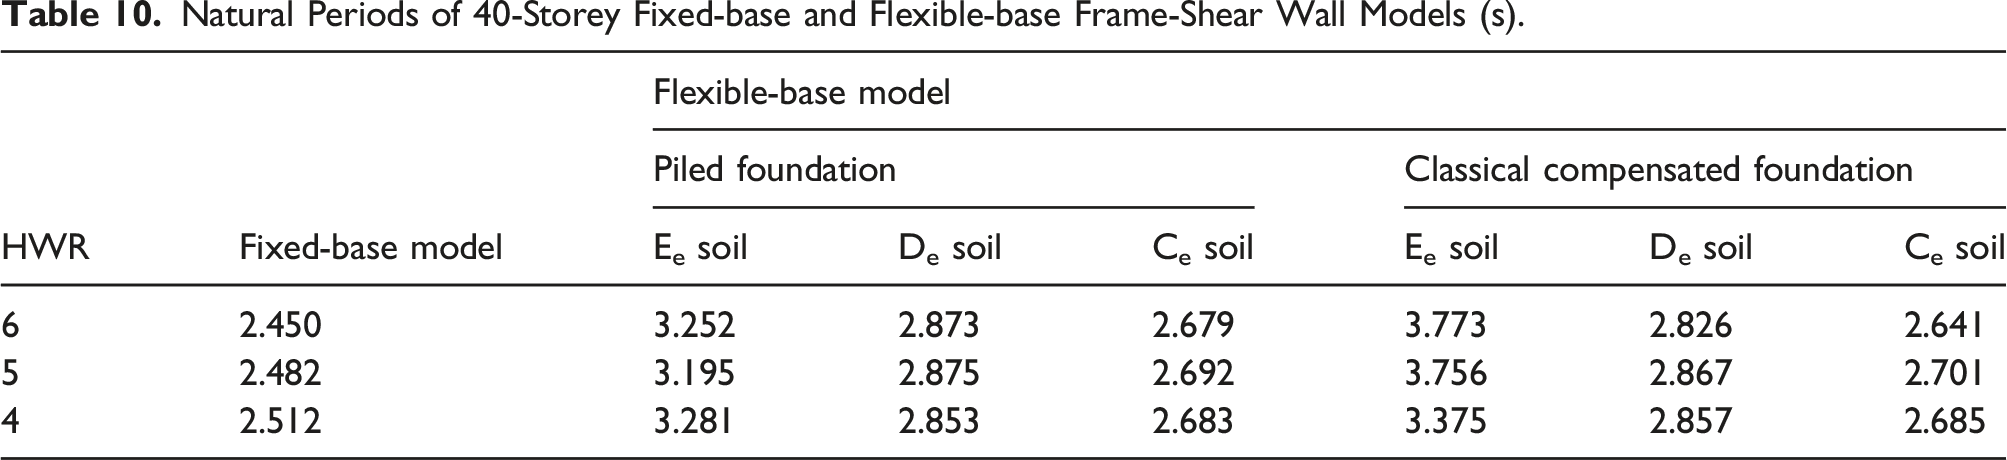
Natural Periods of 40-Storey Fixed-base and Flexible-base Frame-Shear Wall Models (s).
Numerical simulation procedure
Numerical model of the superstructure
Abaqus 6.14 software (Dassault Systèmes SIMULIA, 2012) is adopted to model the soil-structure system. To reduce the calculation time of a single model under the premise of ensuring accuracy, 4-node general-purpose shell elements with reduced integration are selected to simulate slabs and shear walls. Three dimensional 2-node linear beam elements are selected to simulate beams and columns. The basement, piles and soil domain are modelled by 8-node solid elements with reduced integration. Figure 1(d) and Figure 2(d) present the mesh of the finite element model. Moreover, elastic-perfectly plastic behaviour is adopted in superstructure elements. Because the superstructures in this study are all reinforced concrete structures, the damping ratio is taken as 5%.
Numerical model of the subsoil
Rayhani and Naggar (2008) suggests the horizontal dimension of the soil domain should be at least five times the width of the superstructure. Because the superstructure height and HWR adopted in this study are variable, the width of the superstructure is also variable (from 10 m to 30 m). Therefore, the horizontal dimensions of the soil domain vary between 50 m and 150 m (five times the width of the superstructure). Moreover, as shown in Figures 1 and 2, the bedrock depth is assumed to be 30 m since the most amplification effects occur within the top 30 m of the subsoil (Rayhani and Naggar, 2008).
When meshing the ground soil, the guideline proposed by Gazetas (1983) is employed. The height of the soil element should be (1/5∼1/8) versus/f max , where f max is the highest wave frequency considered. In this study, seismic records are filtered to prevent frequencies higher than 25 Hz so as to limit the dimension of soil elements without affecting the accuracy of results.
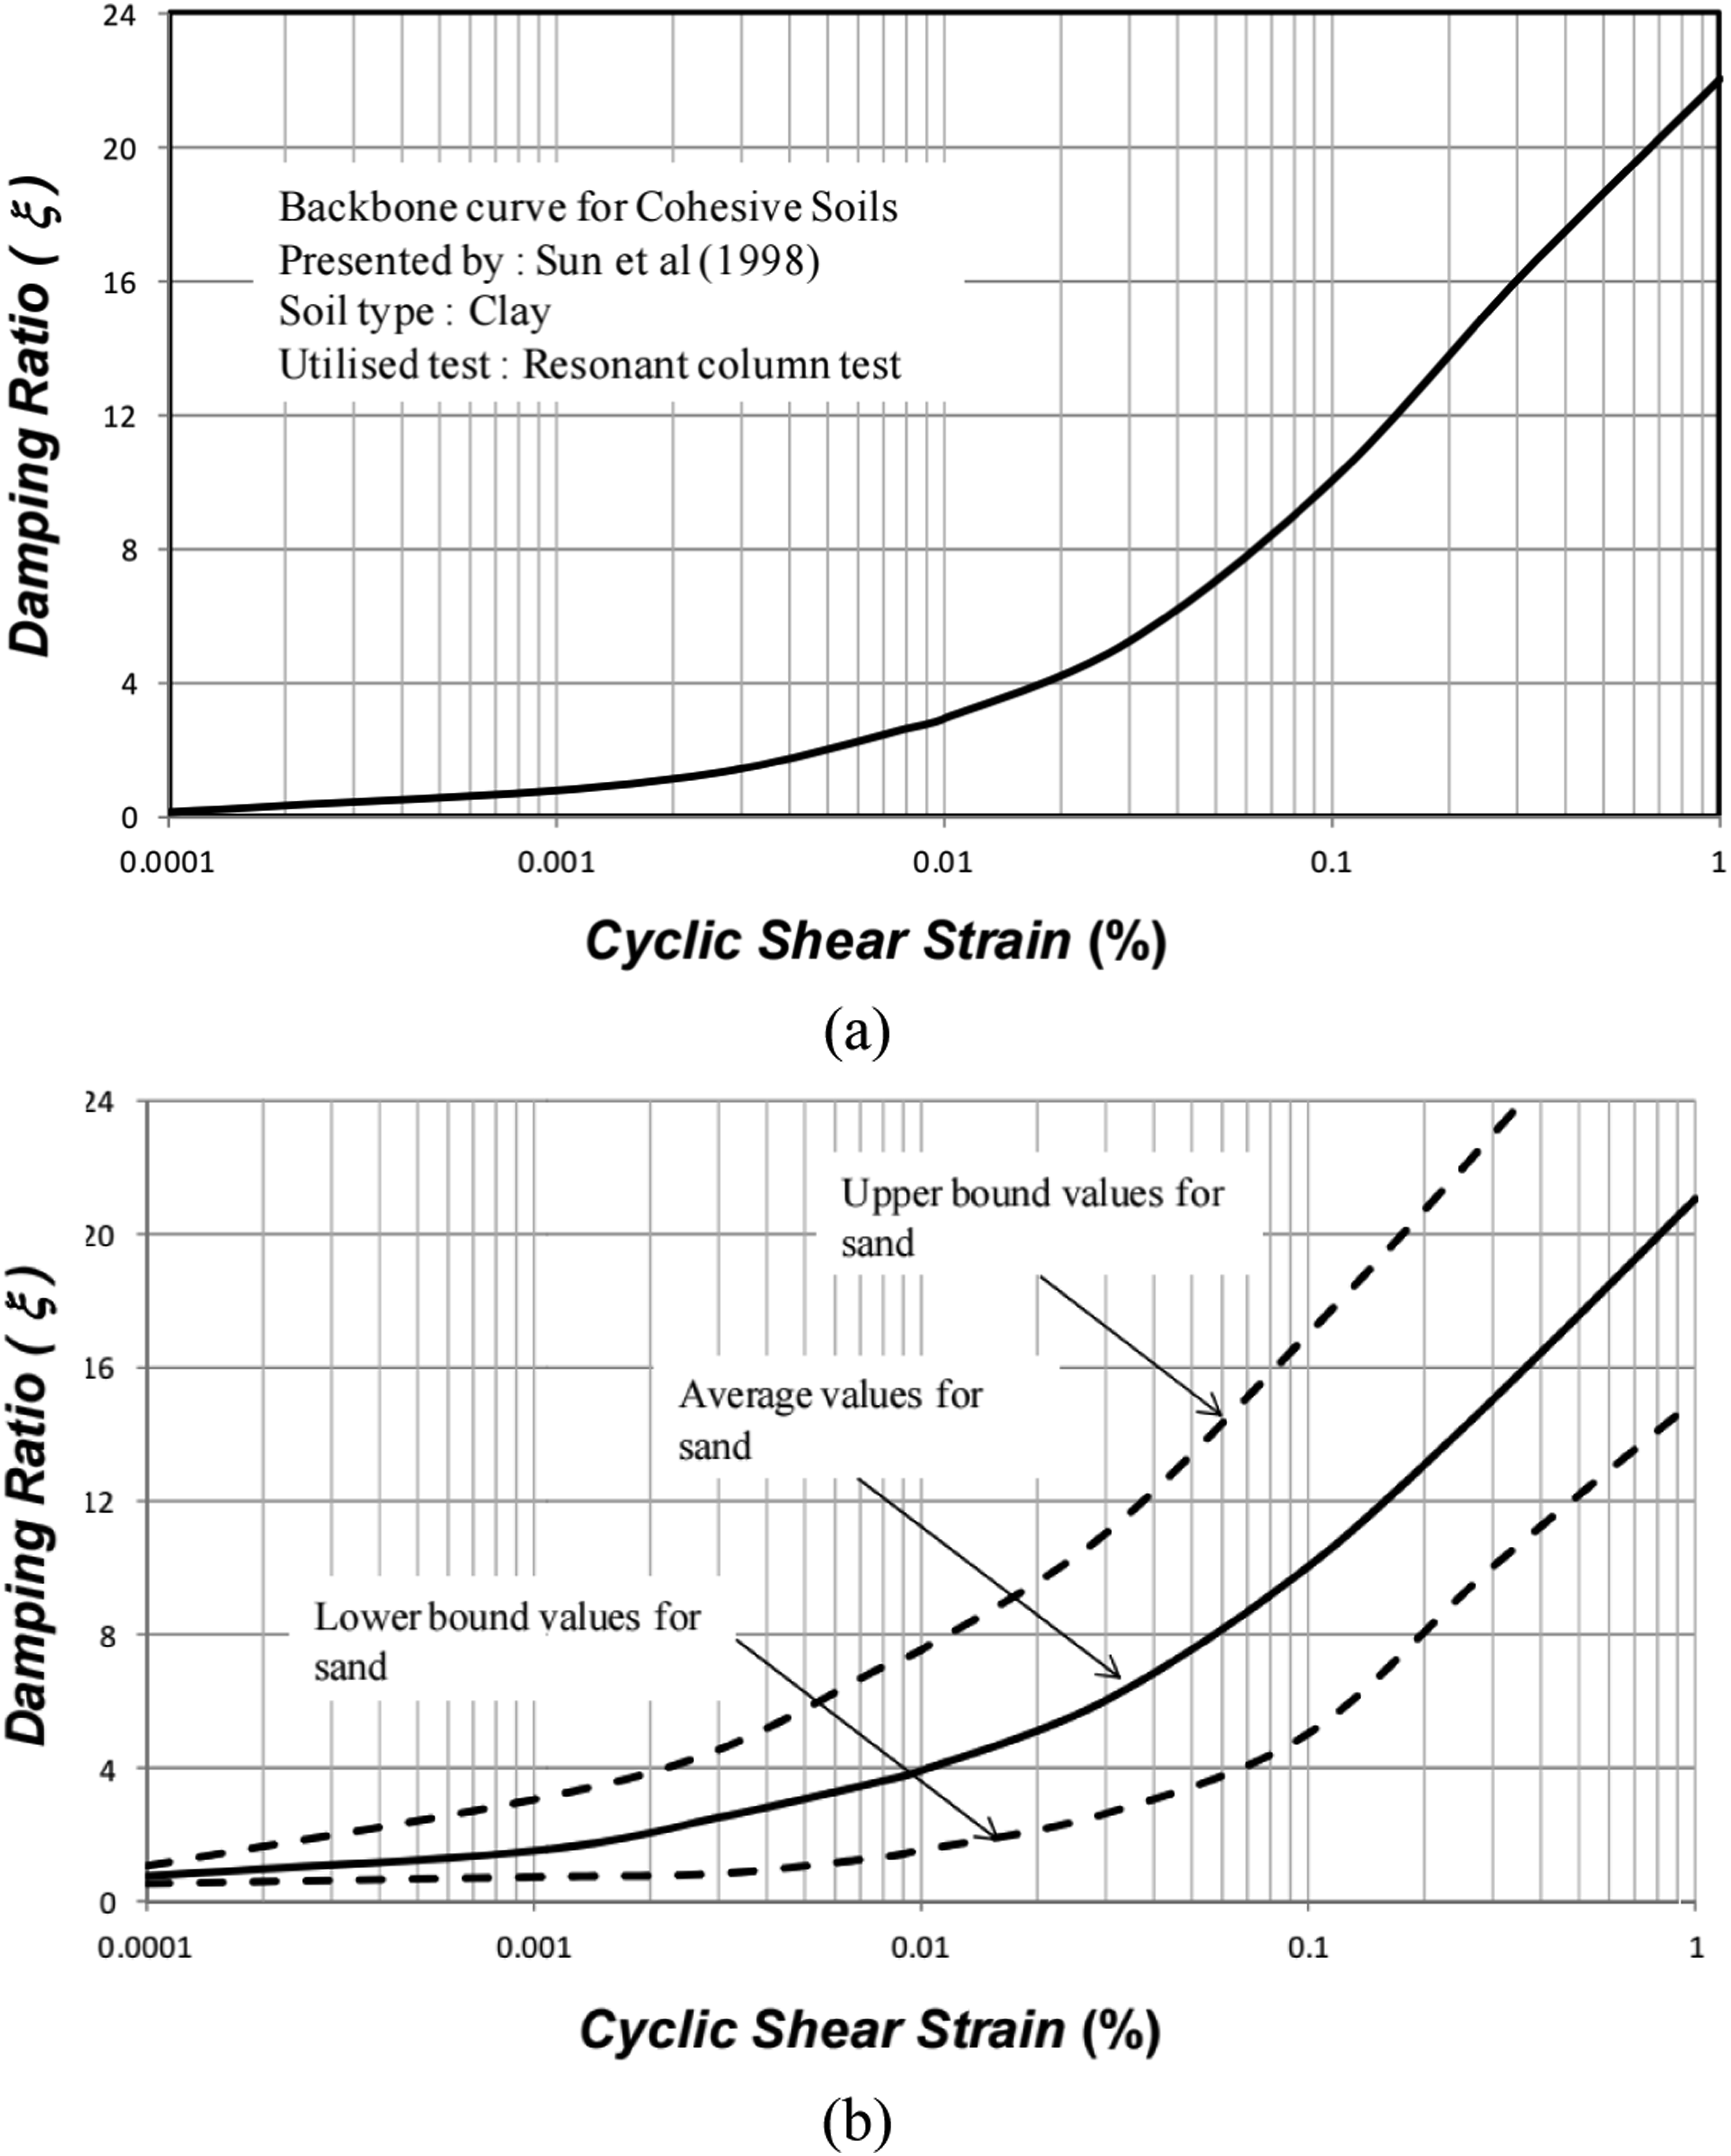
To accommodate the nonlinearity of the subsoil, the approach adopted involved the utilisation of cyclic shear strain-dependent shear modulus curves (Figure 5) and damping ratio curves (Figure 6). These curves were integrated into the analysis to better capture the intricate response of the subsoil under seismic loading conditions. The determination of strain-compatible values for soil damping and shear modulus under different seismic records necessitated the application of a trial and error methodology. This method involved the systematic adjustment of these parameters until a satisfactory alignment between predicted and observed responses was attained for each seismic event. For a comprehensive understanding of this approach, reference is directed to the detailed procedures delineated in the works of Tabatabaiefar et al. (2013) and Fatahi and Tabatabaiefar (2014). These seminal contributions offer thorough insights into the theoretical framework and practical implementation of the proposed methodology, elucidating the steps involved in calibrating soil properties to accurately reflect the observed nonlinear behaviour. Rayleigh damping is adopted to take into account the energy loss in the subsoil in an earthquake event. When calculating damping coefficients, two soil-structure model frequencies covering the range with a significant amount of input motion are adopted (Park and Hashash, 2004). Shear modulus reduction curves: (a) cohesive soil (after Sun et al., 1998); (b) cohesionless soil (after Seed et al., 1986). Damping curves: (a) cohesive soil (after Sun et al., 1998); (b) cohesionless soil (after Seed et al., 1986).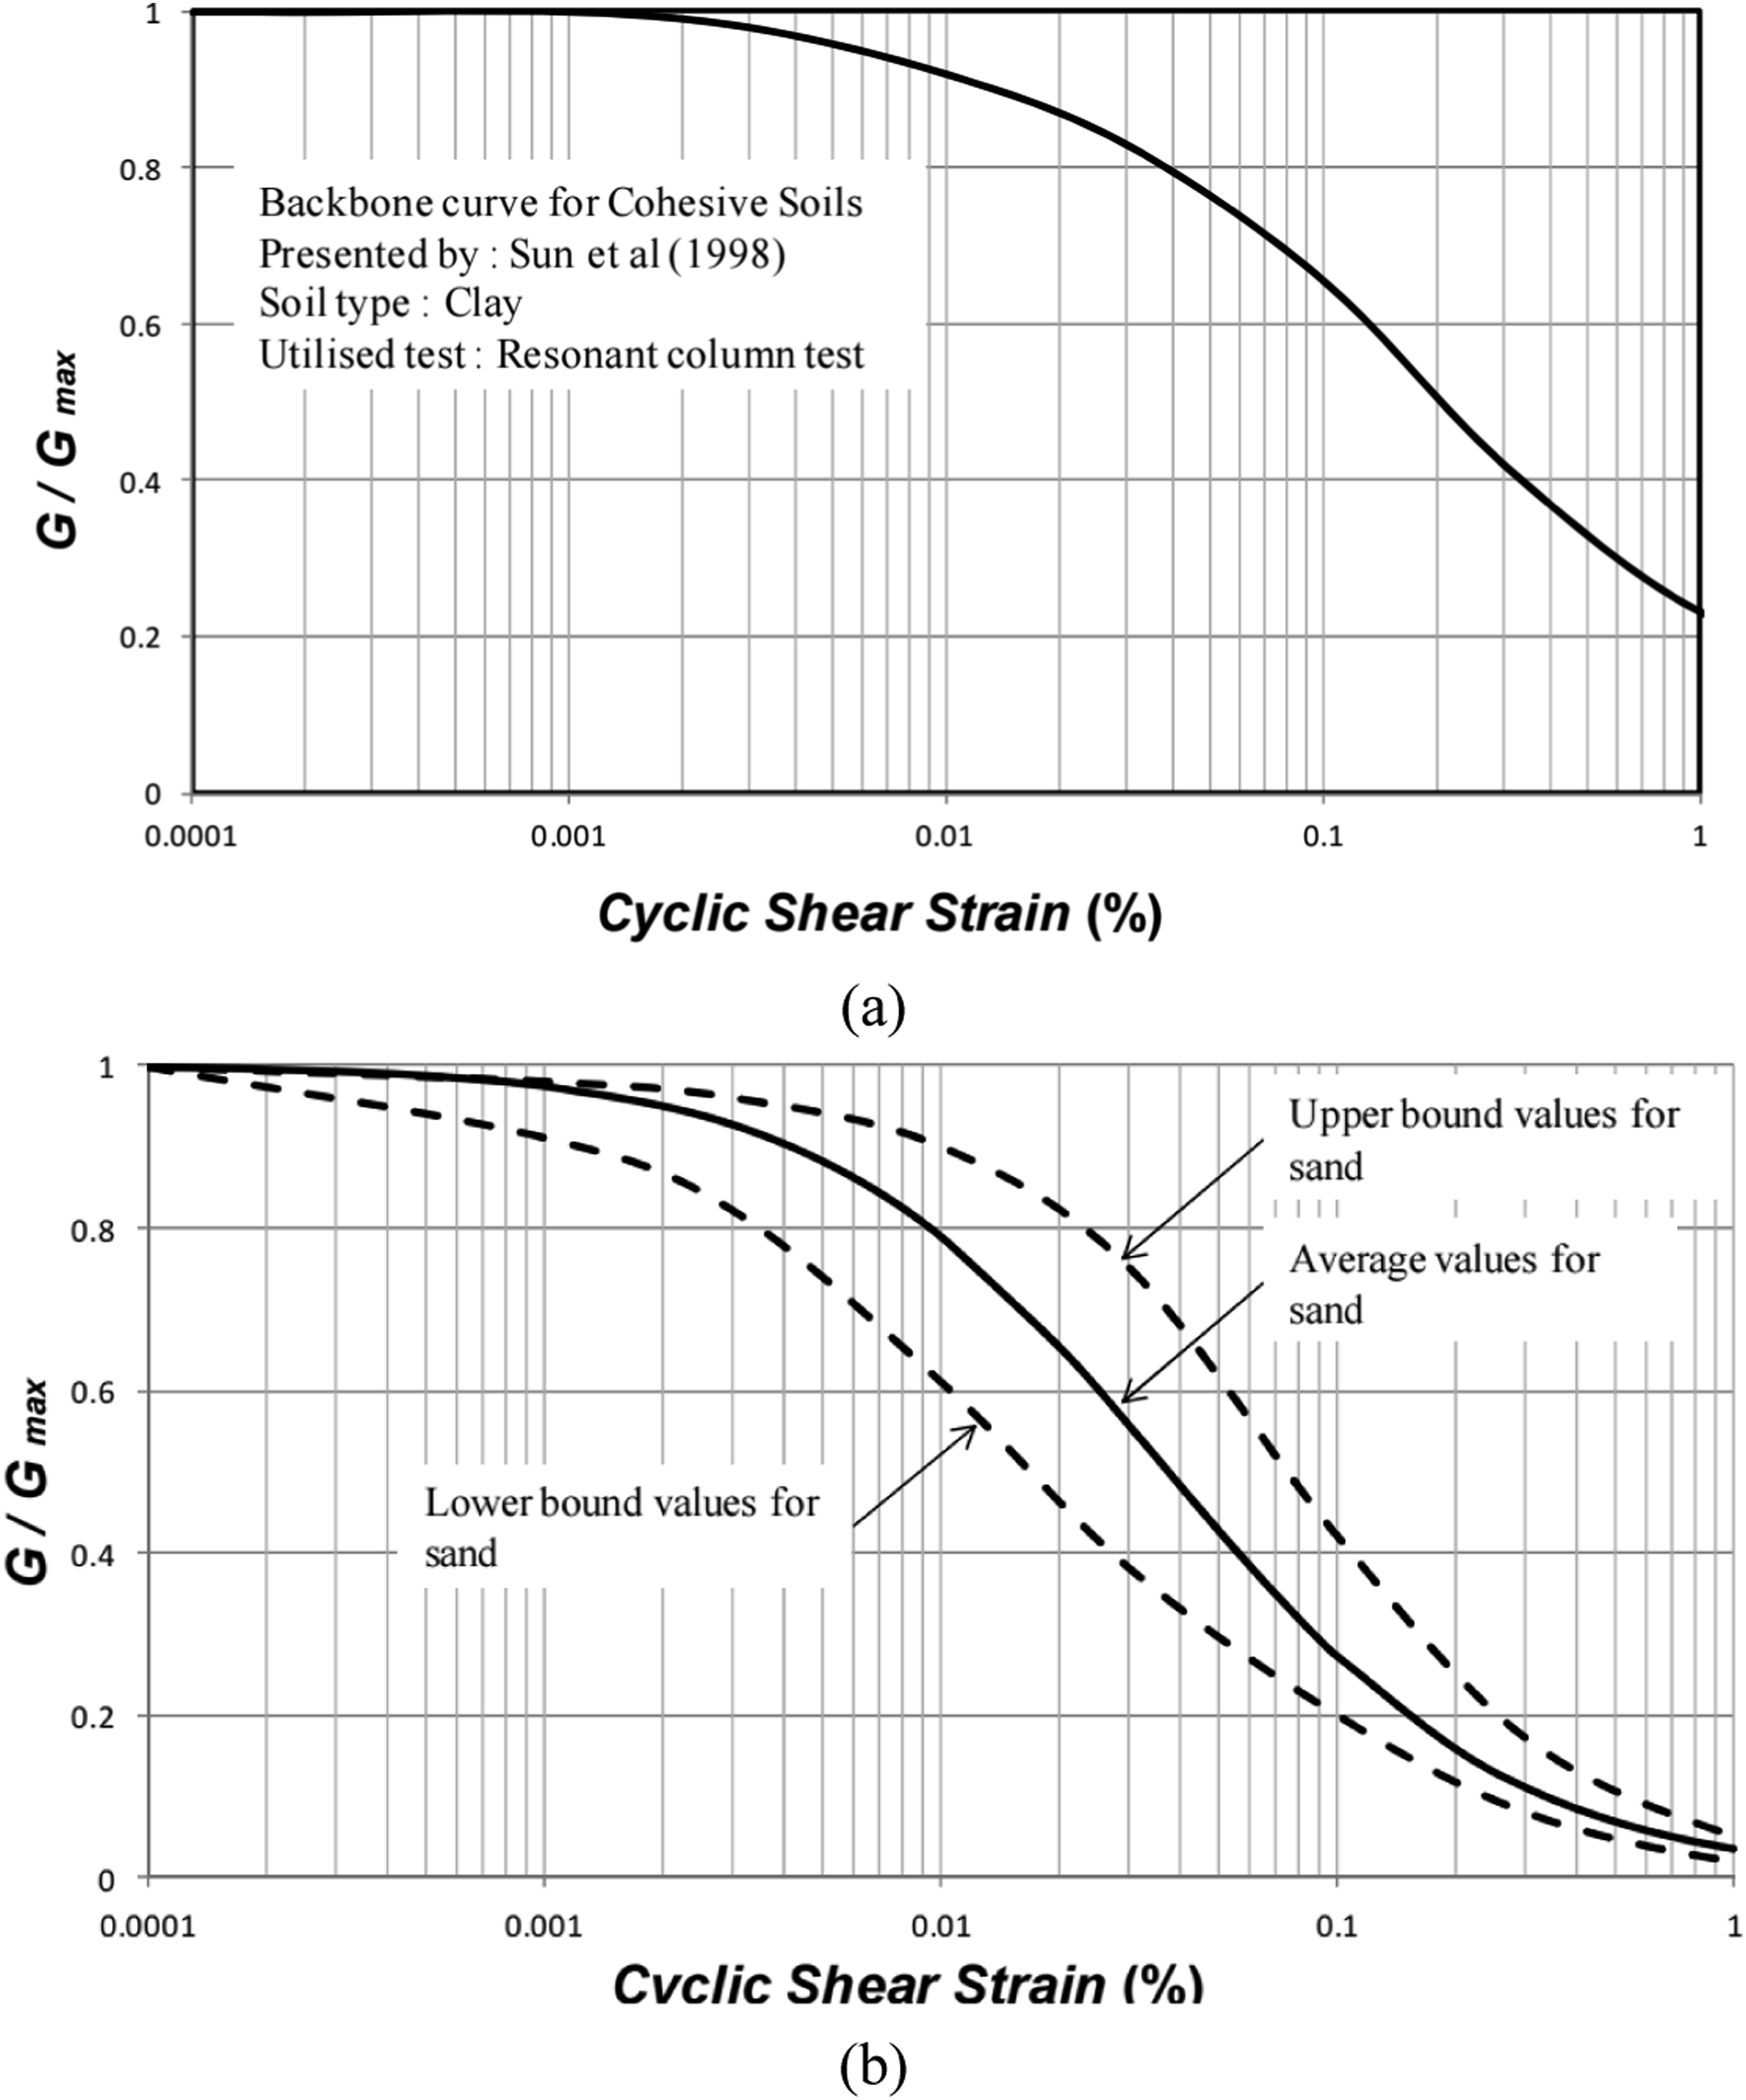
Boundary conditions
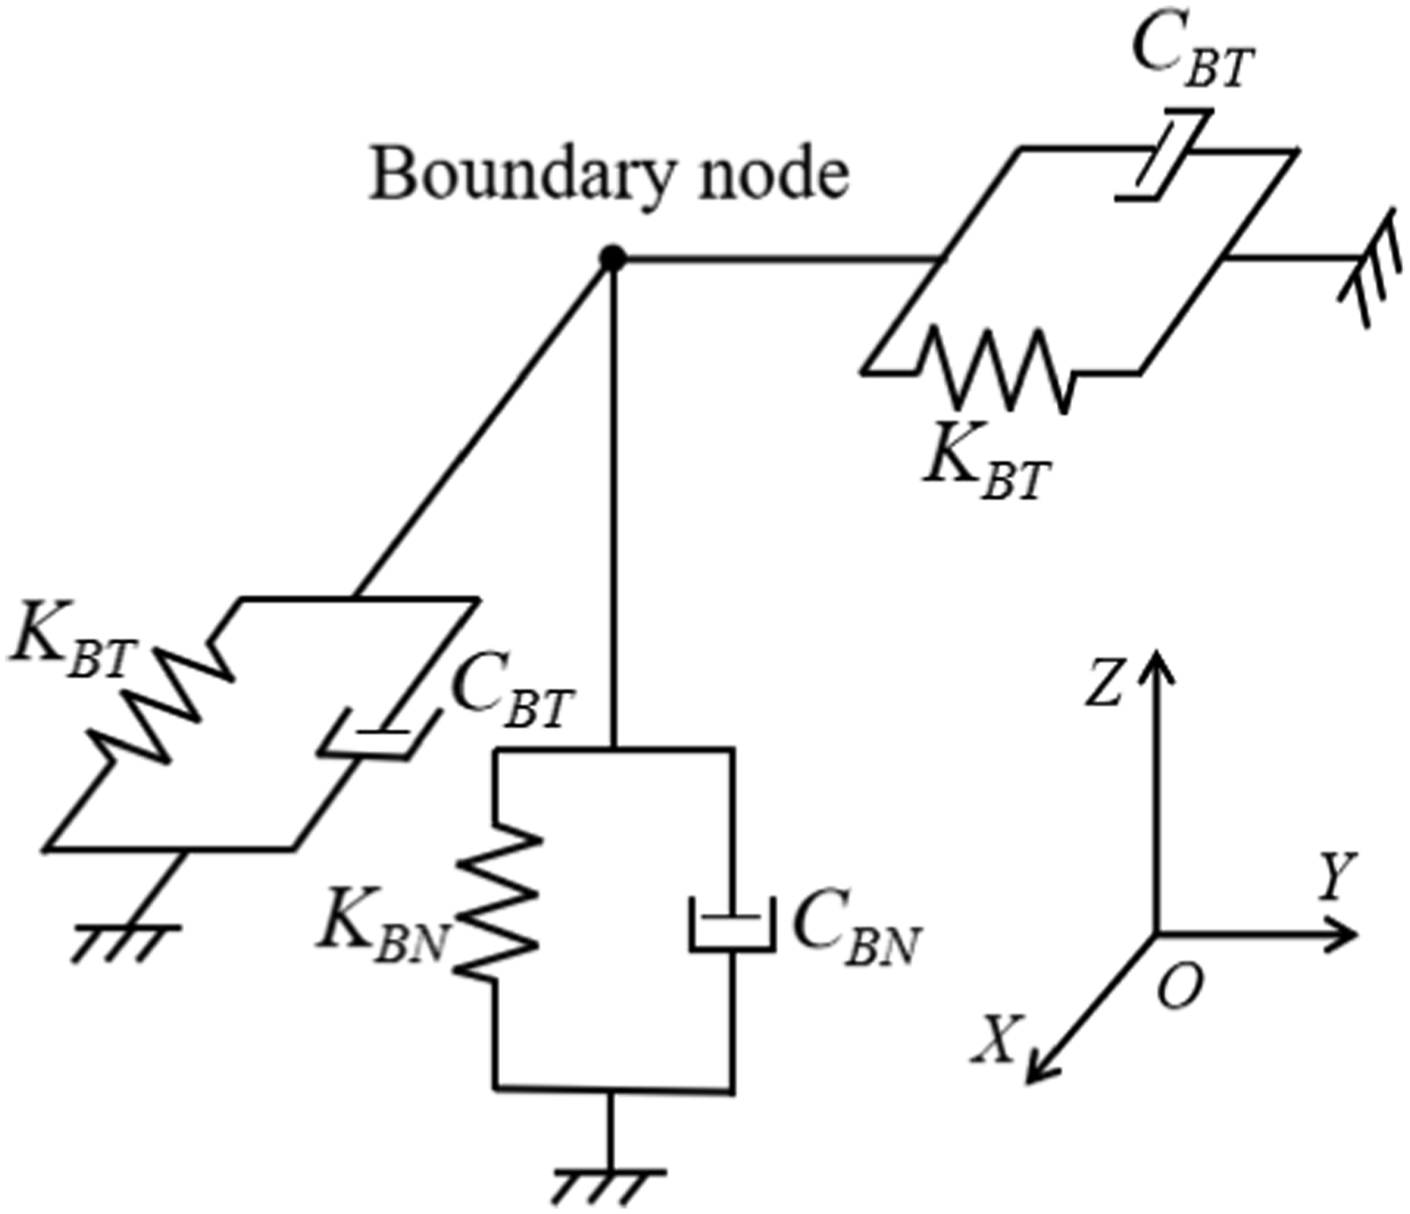
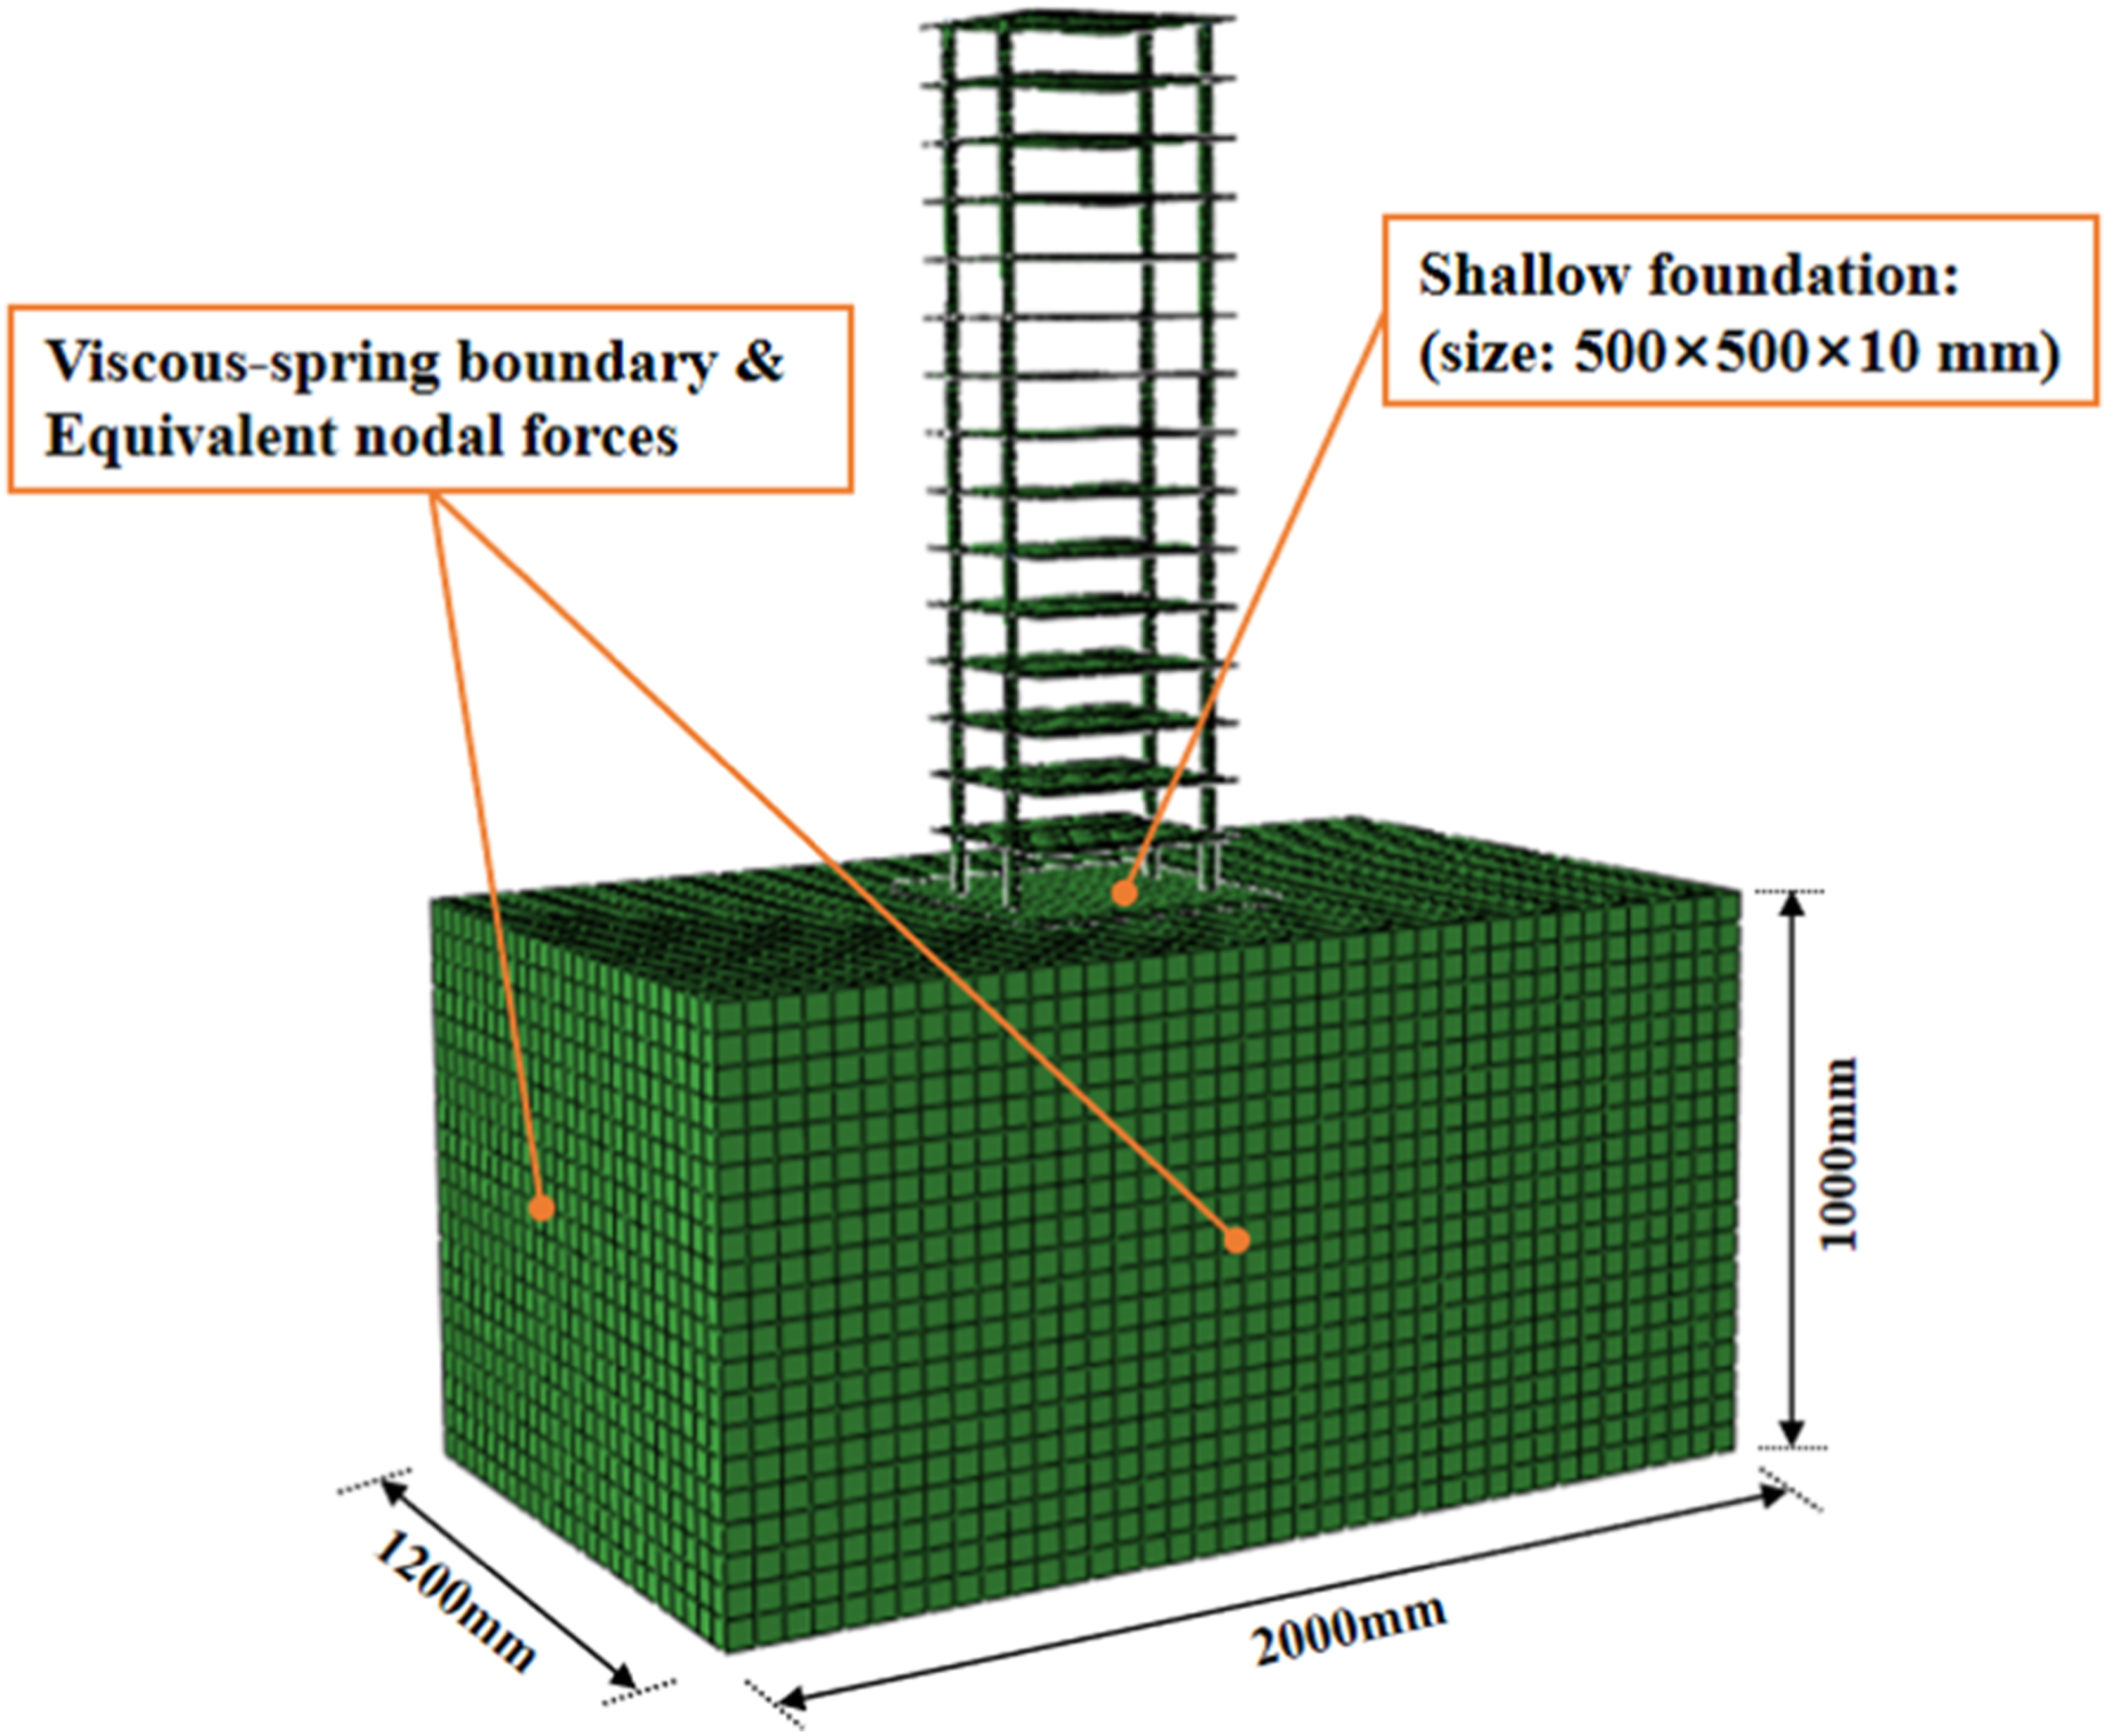
In this study, viscous-spring boundary was applied on lateral and bottom surfaces of the subsoil domain to avoid the reflection of outward propagating waves, independent springs and dampers in three directions are specified on the boundary nodes (Figure 7). The coefficients of the springs (K
T
and K
N
) and dampers (C
T
and C
N
) can be obtained as follows (Gu et al., 2007): Viscous-spring boundary.

Input of earthquake motions
During dynamic time-history analyses, the motion of boundary nodes is supposed to conform to the free-field motion to supply conditions identical to the infinite model. To achieve this goal, the equivalent node force method is adopted. In this method, first of all, the free-field strain of the boundary is obtained from the geometric equation, and then the stress on the boundary is obtained by stress-strain relationship. After that, the boundary node balance relationship is used to calculate the equivalent earthquake load on the boundary node, that is, the equivalent node force (

According to the seismic motion input approach described above, a MATLAB program was compiled by the authors to calculate the amplitudes of
Verification of the numerical simulation method
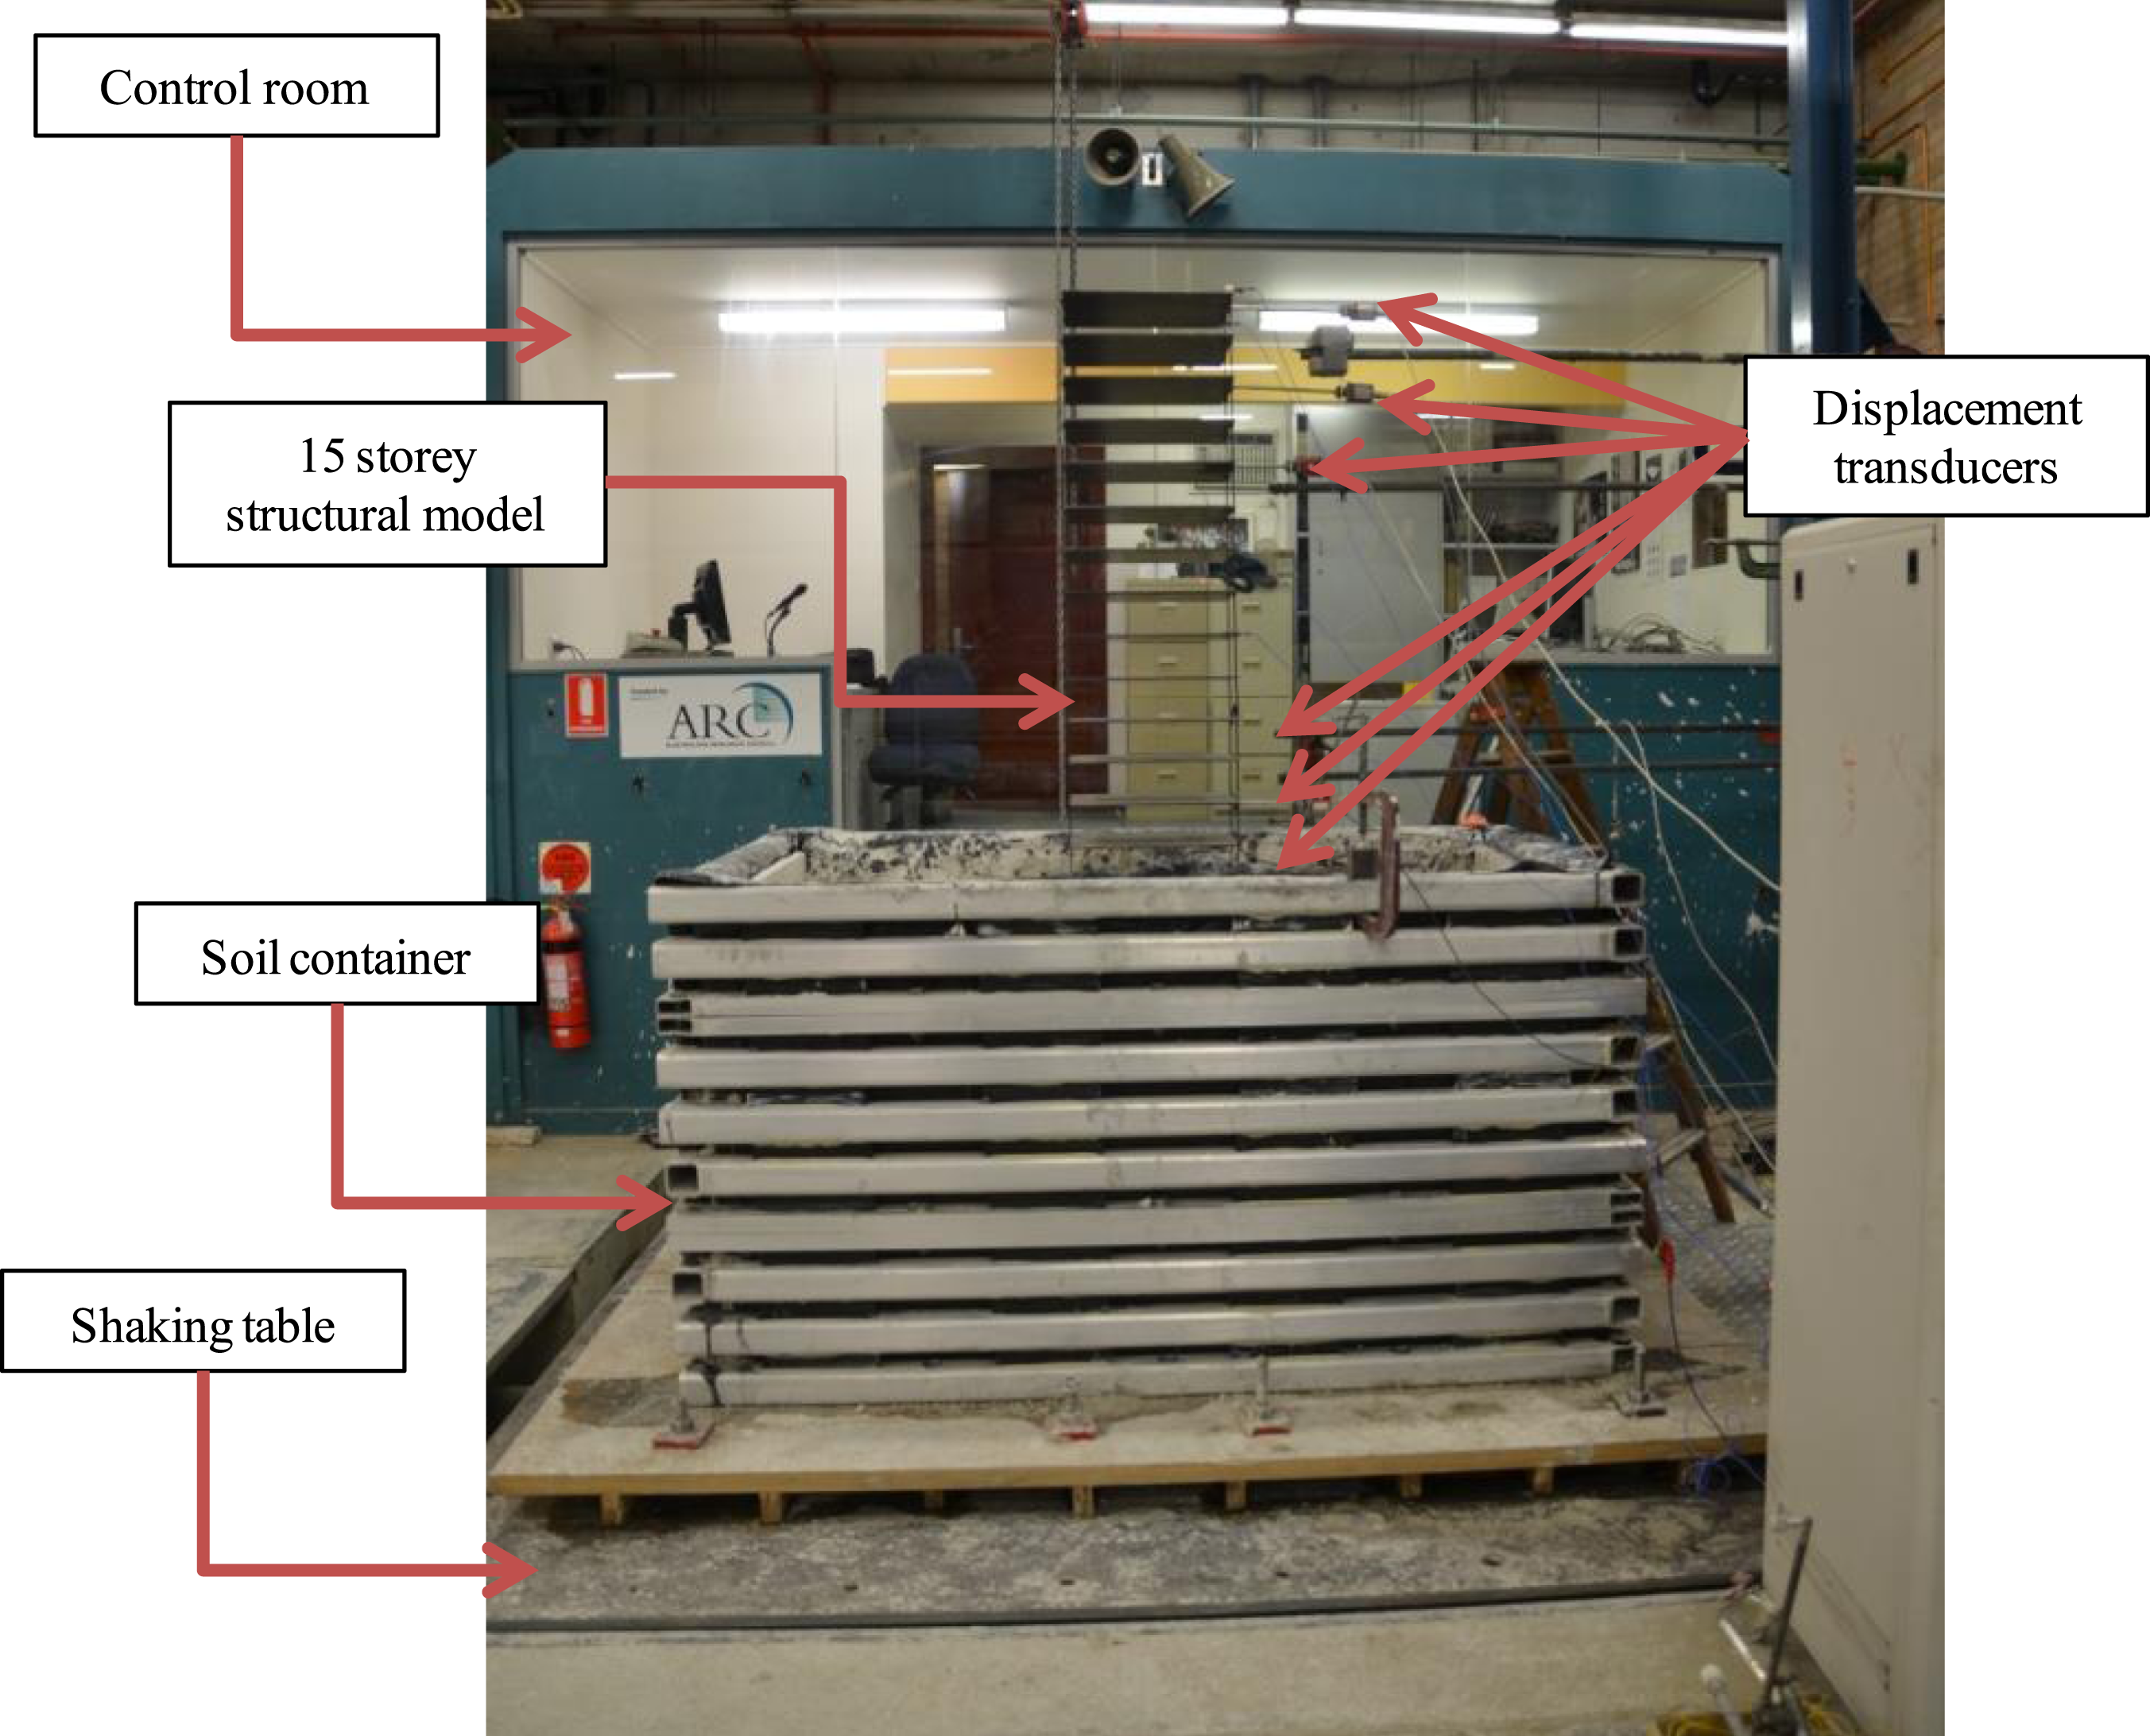
To examine the accuracy of the adopted numerical modelling technique, shaking table tests were conducted on a 15-storey frame structure, and the results of numerical simulation were compared with the experimental results.
The fundamental frequency and mass of the prototype structure are 0.384 Hz and 953 tonnes respectively, and the structure is assumed to be built on clayey soil. In the scaling process, the objective is to achieve “dynamic similarity”, in which same or similar accelerations and density of shaking table test model and prototype are desired (Meymand, 1998). After determining the scaling condition of the acceleration and density, the scaling relations for other variables, such as mass, time, length, etc., can also be derived and expressed in terms of geometric scaling factor (λ). By comparing specifications of the shaking table and characteristics of scaled models with different λ, λ of 1:30 is adopted. Therefore, the dimensions of the scaled structural model can be easily calculated to achieve geometric similarity. Moreover, the fundamental frequency and mass of the scaled model are determined to be 2.11 Hz and 106 kg respectively to achieve the dynamic similarity.
The mass of the assembled structure (Figure 8) is 104 kg and the fundamental frequency is 2.19 Hz, which are very close to the calculated value above. The scaled soil-structure model is shown in Figure 9. More details about the shaking table tests can be found in Tabatabaiefar et al. (2014a), Fatahi et al. (2015), Tabatabaiefar and Mansoury (2016) and Tabatabaiefar (2016). Completed fixed-base model of shaking table tests (Tabatabaiefar and Mansoury, 2016; Zhang and Far, 2022). Completed soil-structure model of shaking table tests (Tabatabaiefar and Mansoury, 2016; Zhang and Far, 2022).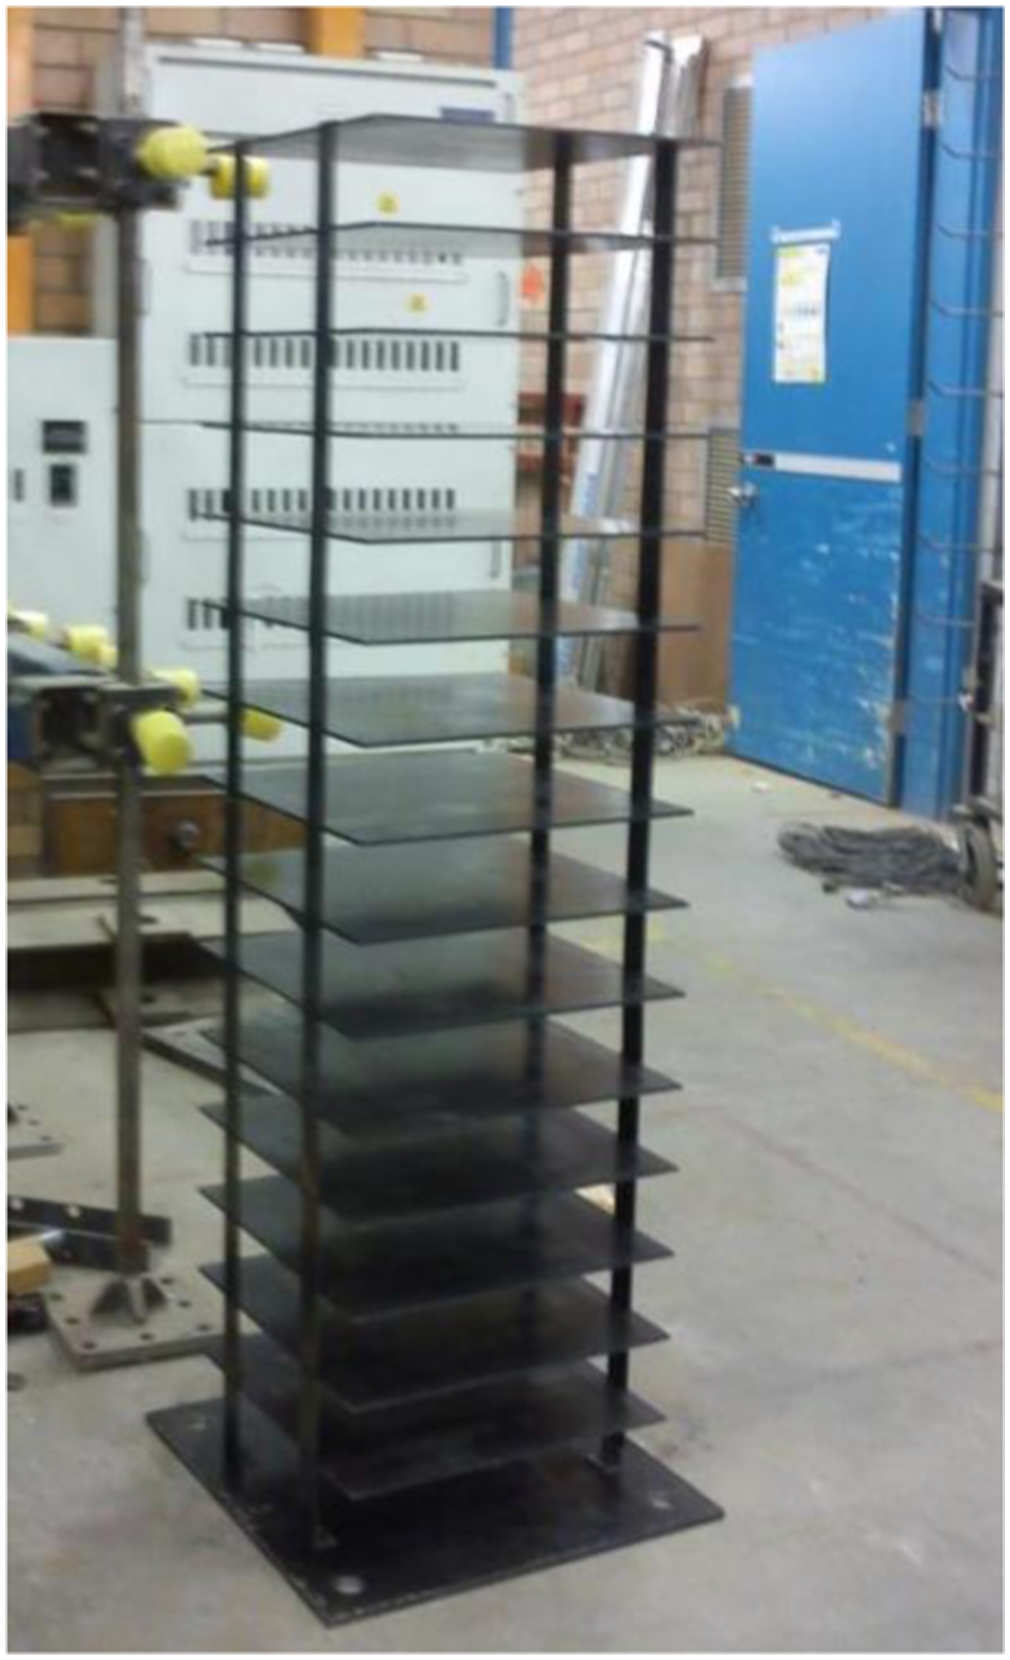
The identical numerical models (Figures 10 and 11) were also established in Abaqus software using the modelling technique described earlier. After that, numerical time-history analyses and shaking table tests were conducted under the action of four seismic records. The results in terms of the Δ of frame structure obtained from these two approaches are compared in Figures 12 and 13. Fixed-base numerical model in Abaqus. Flexible-base numerical model in Abaqus. Numerical and experimental maximum lateral deflections of fixed-base and flexible-base models under the scaled (a) El Centro earthquake (b) Hachinohe earthquake (c) Kobe earthquake (d) Northridge earthquake. Average values of maximum lateral deflections of numerical and experimental models.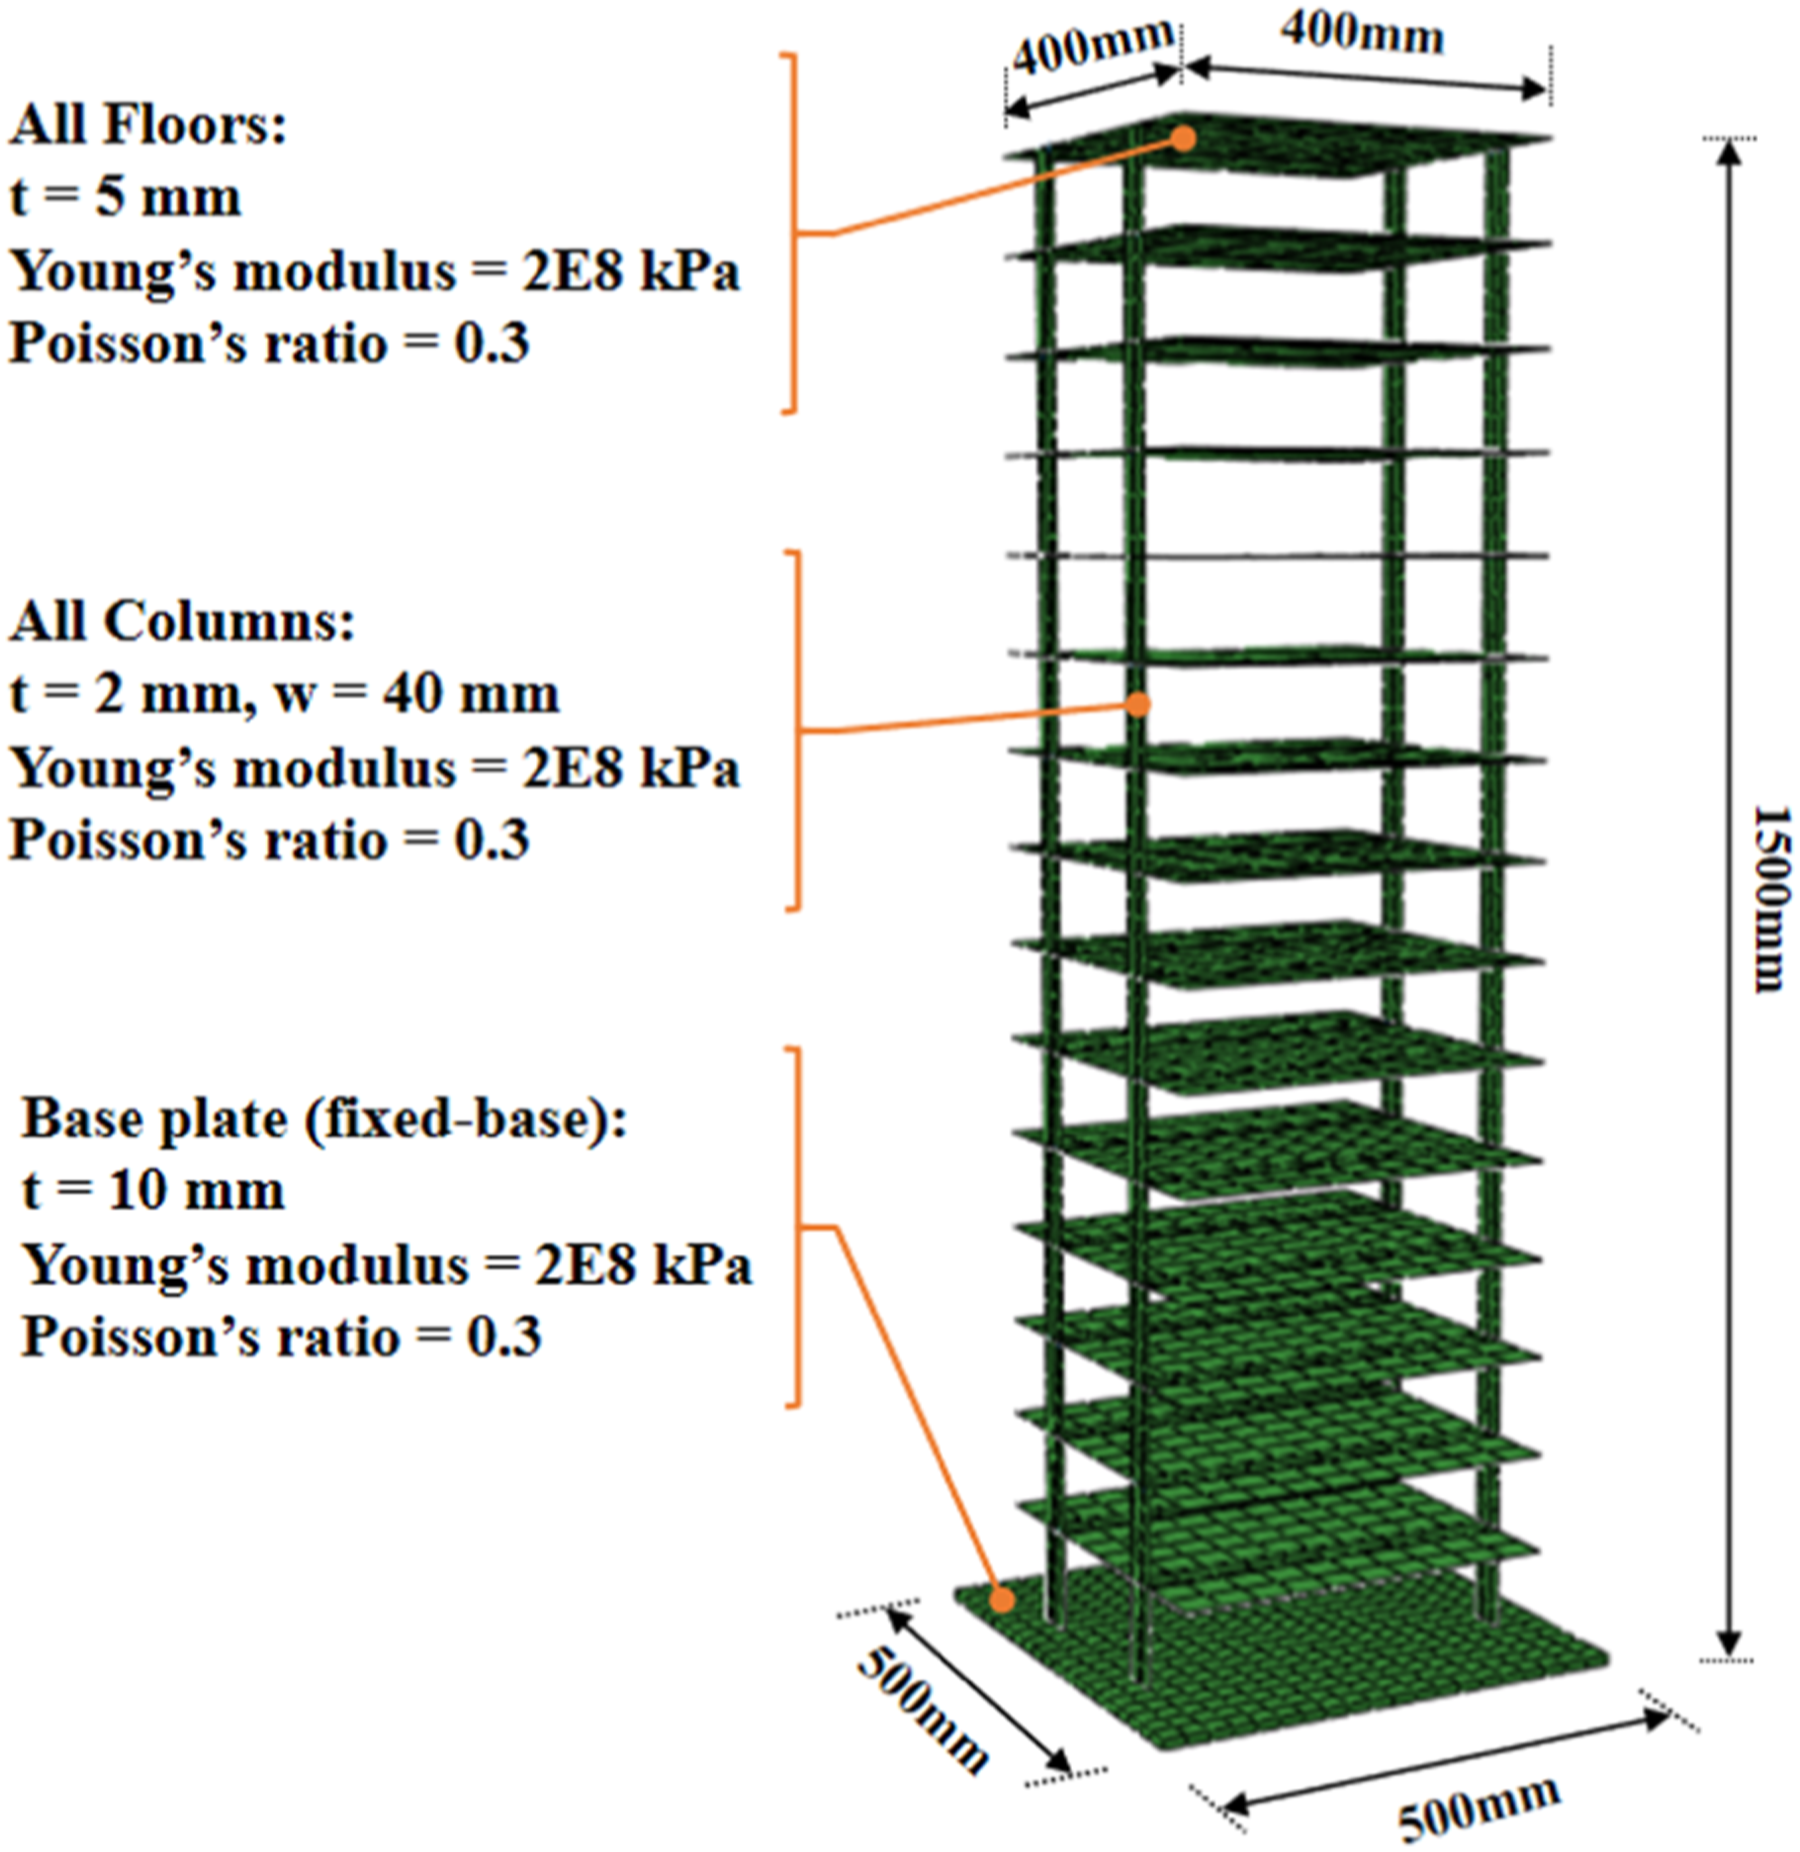
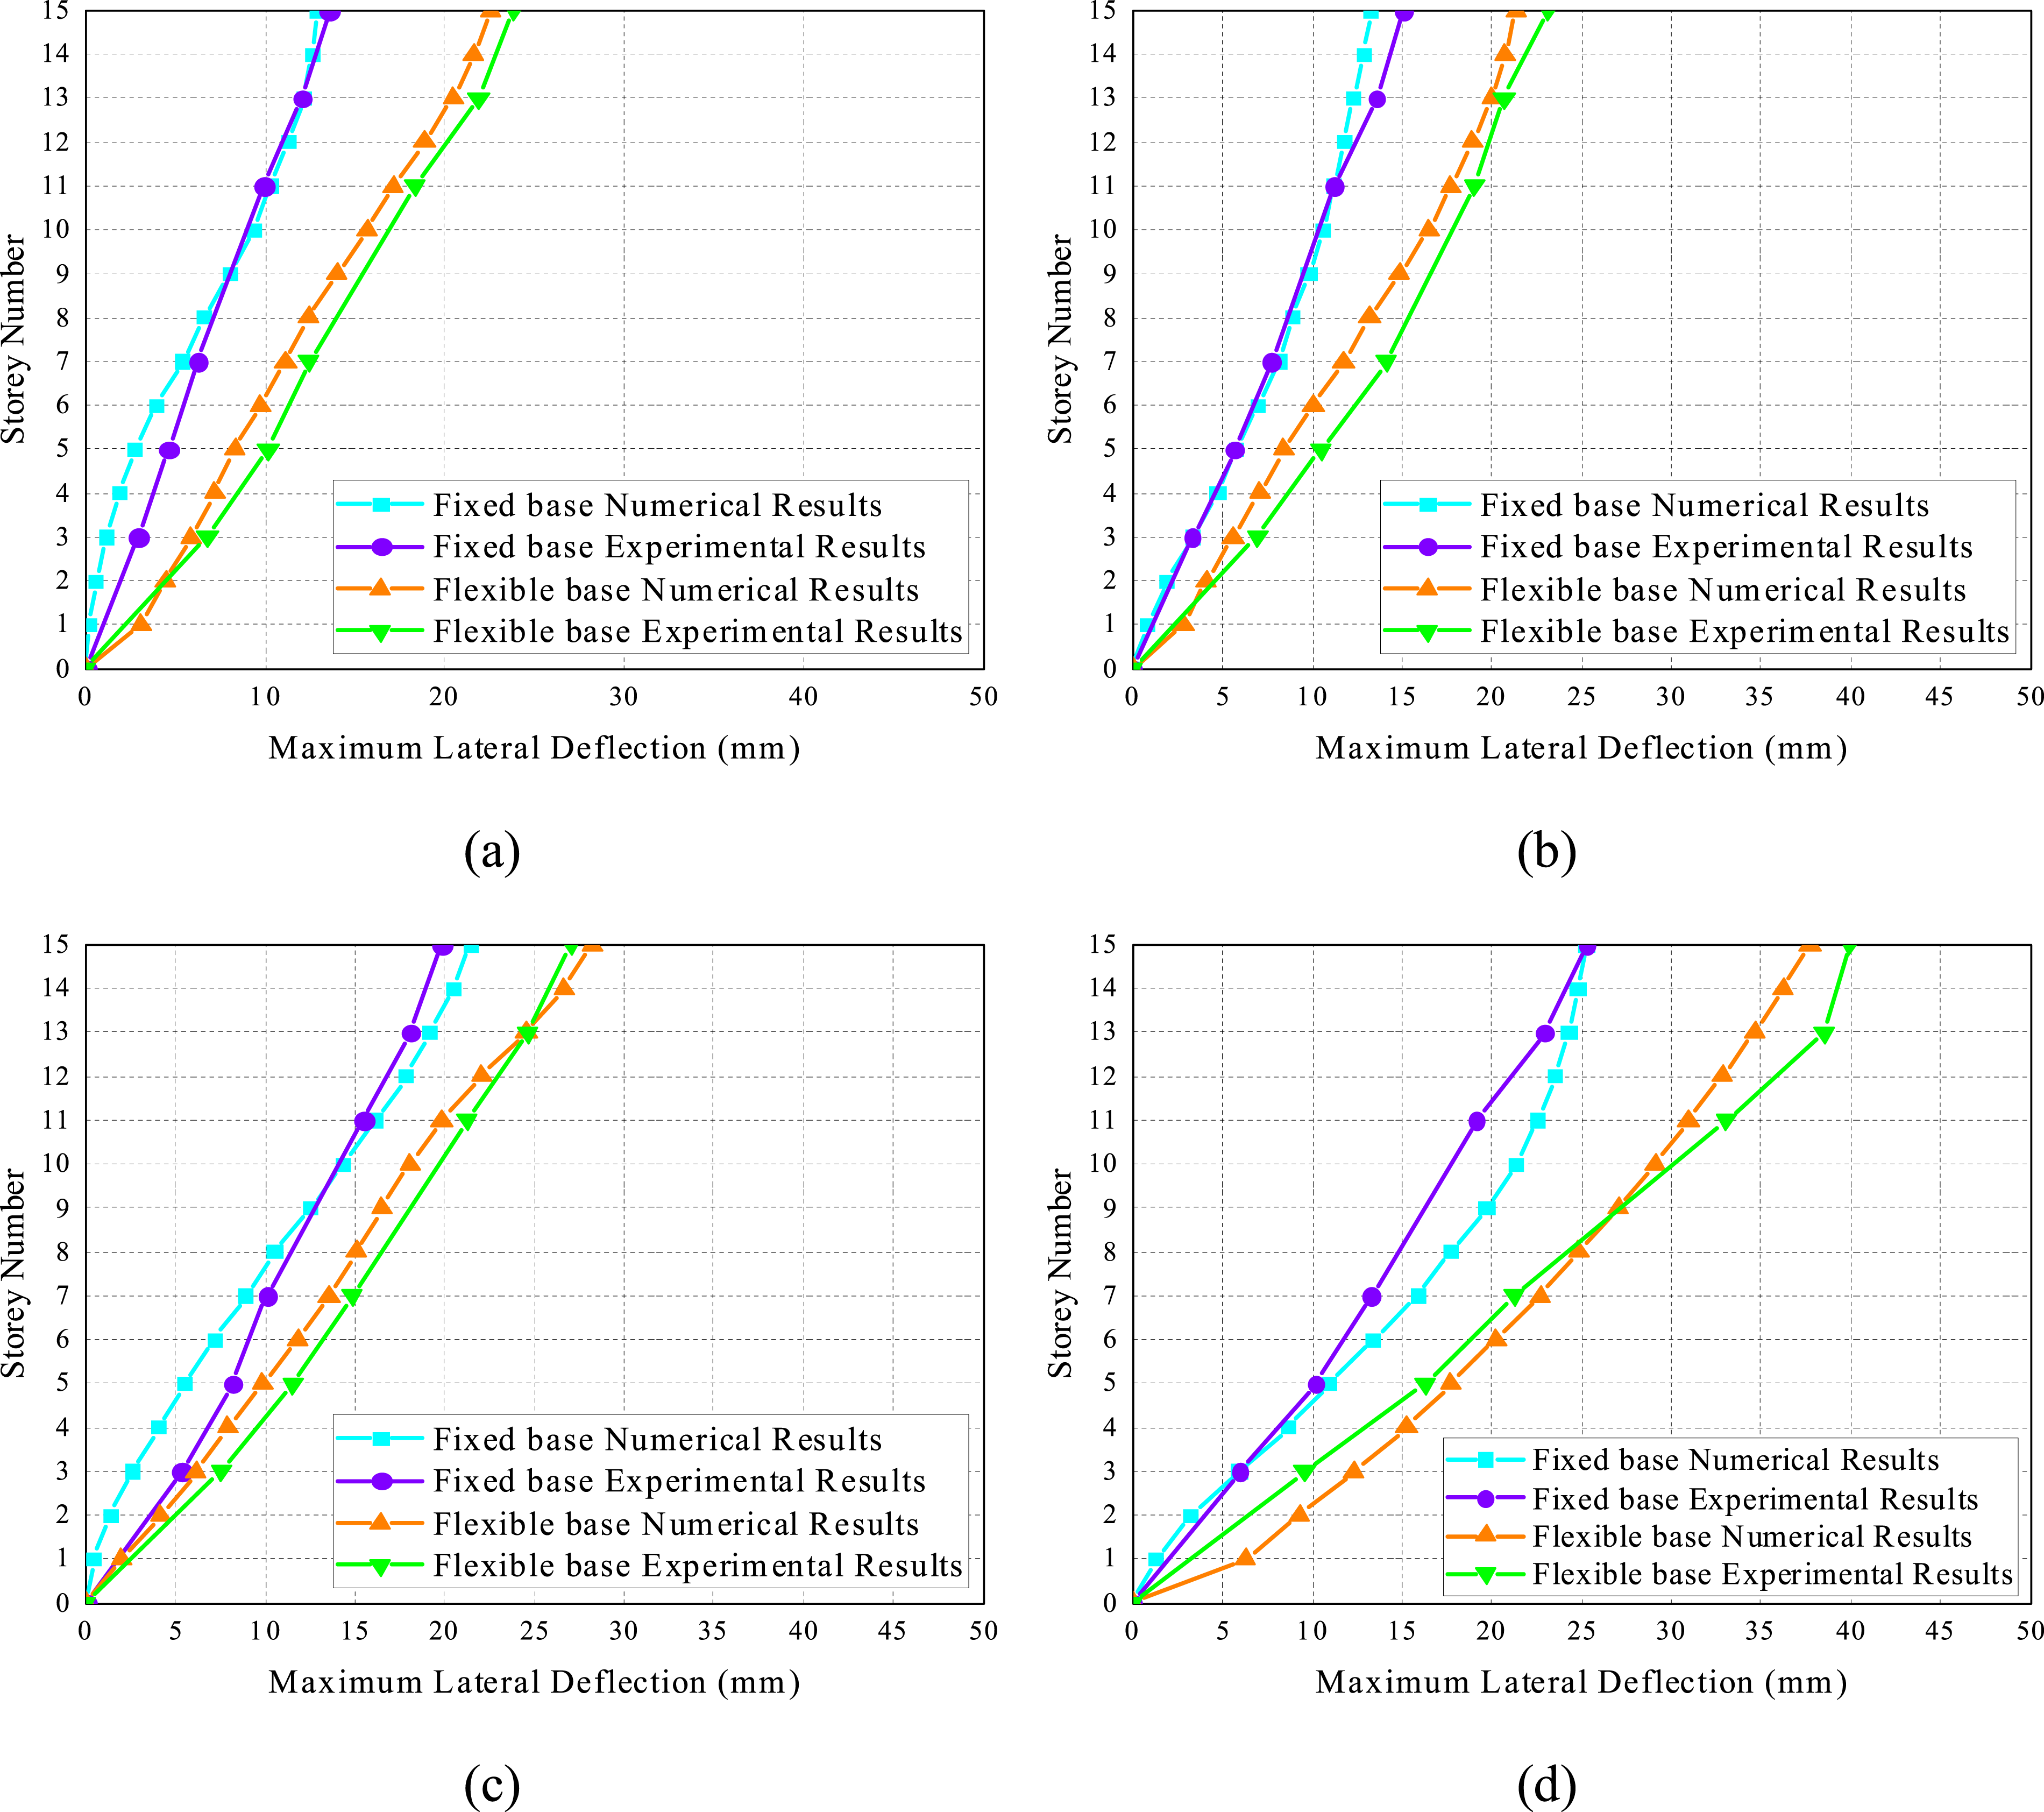
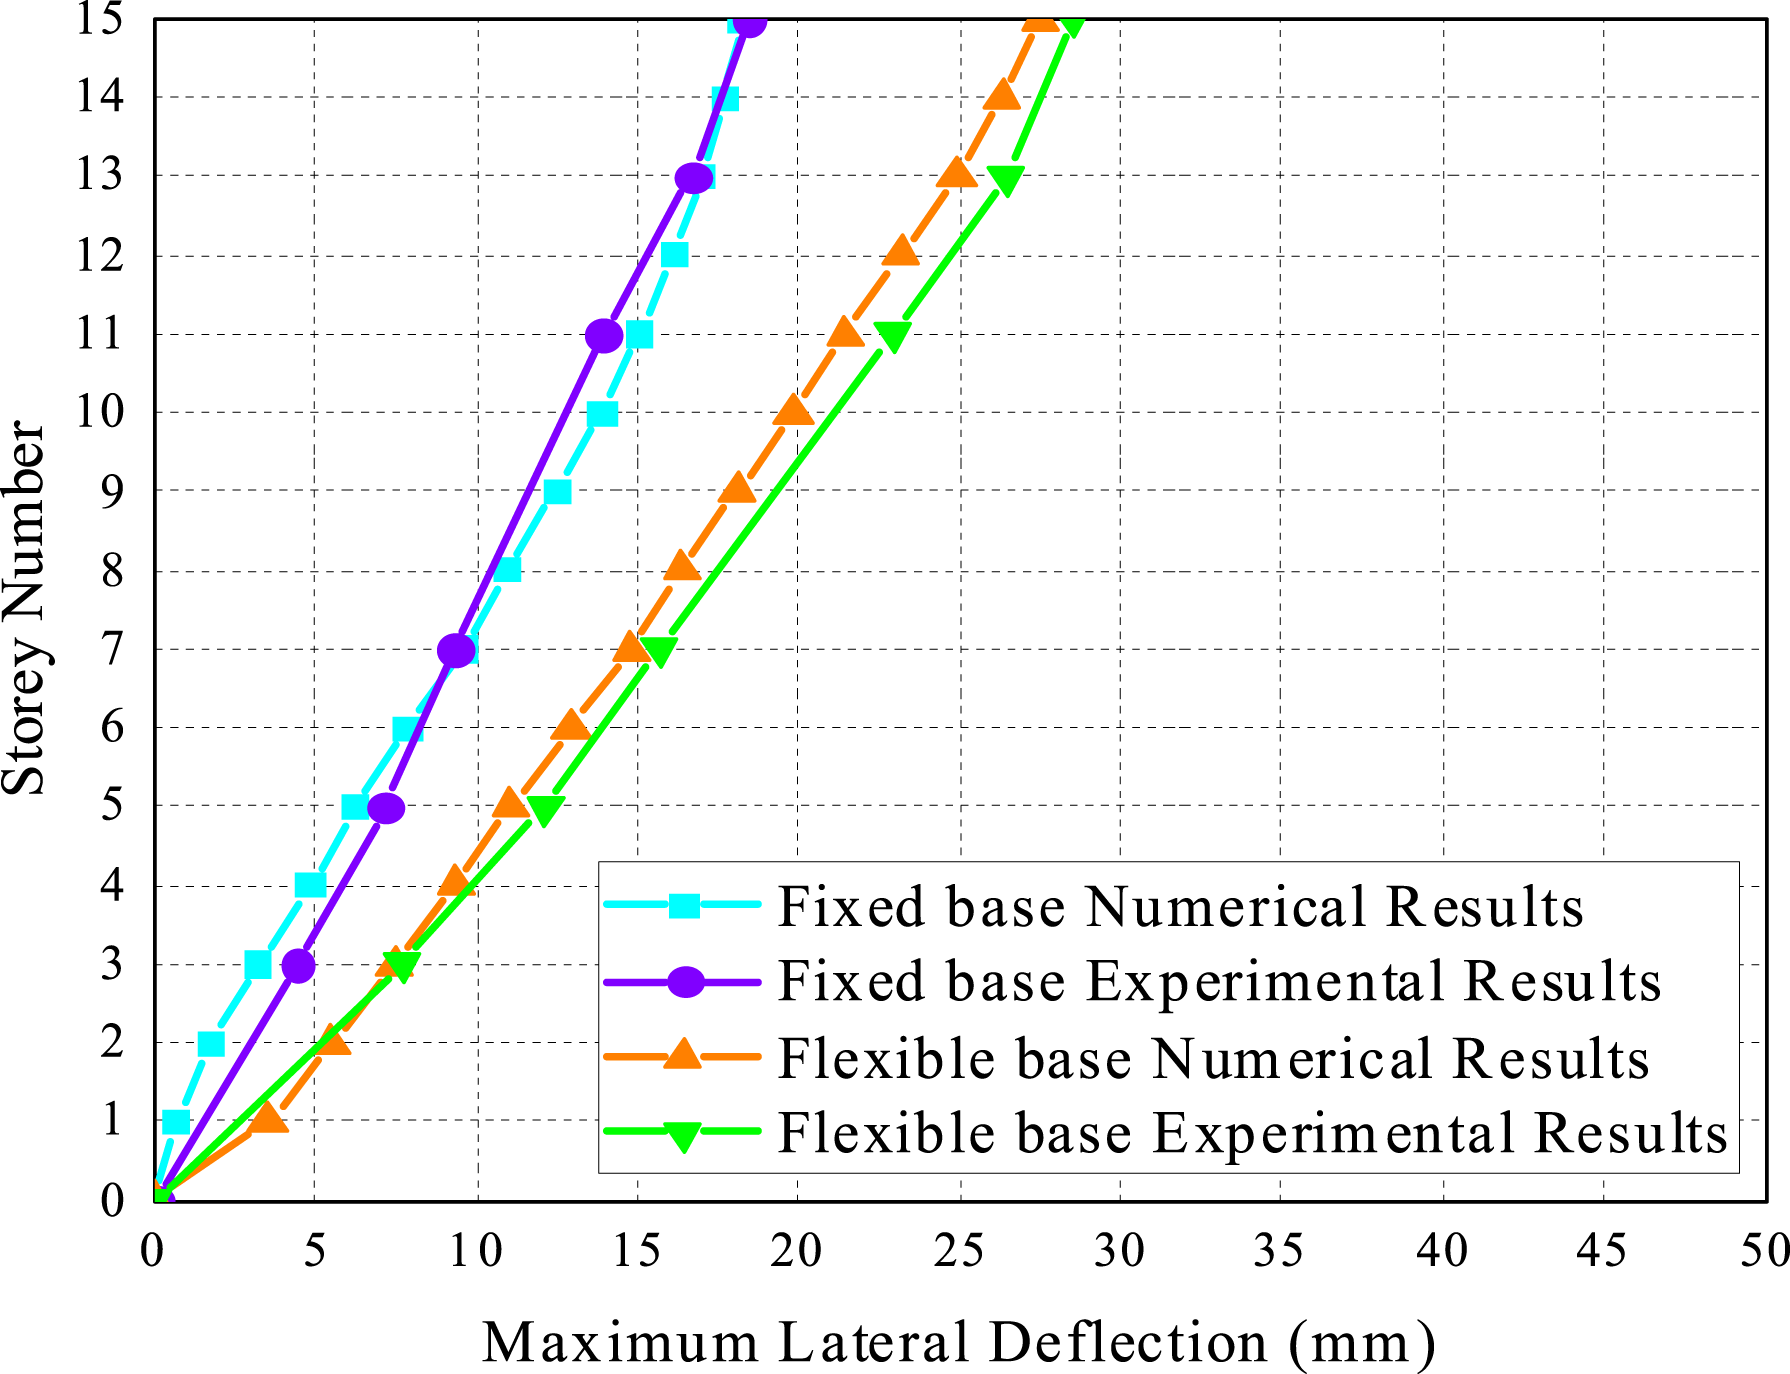
As shown in Figure 12, by comparing the values and trends of numerical calculations and experimental results, it can be drawn that the numerical model proposed in Section 3 is accurate enough to capture the seismic behaviour of buildings. Figure 13 indicates that errors of average Δ of fixed-base and flexible-base models are only 8.8% and 5.6%, respectively. Therefore, the numerical simulation technique developed in this study is a rational and appropriate tool for SSI analyses.
Results and discussions
To compare the effects of different parameters more intuitively, the results determined from numerical soil-structure models including base shears (V fle ) and maximum inter-storey drifts (δ fle ) are normalised by those obtained from conventional fixed-base models (V fix and δ fix ). As a result, if the value of the base shear ratio (V fle /V fix ) or inter-storey drifts ratio (δ fle /δ fix ) is greater than 1, it means that the SSI amplifies the V or δ and thus, its effect is detrimental. In addition, values of V fle /V fix and δ fle /δ fix under the action of four seismic records (Figure 4) are averaged in this study so as to analyse and compare the data comprehensively and clearly demonstrate the impacts of superstructure and substructure parameters on high-rise buildings.
Effects of parameters on frame-core tube structures
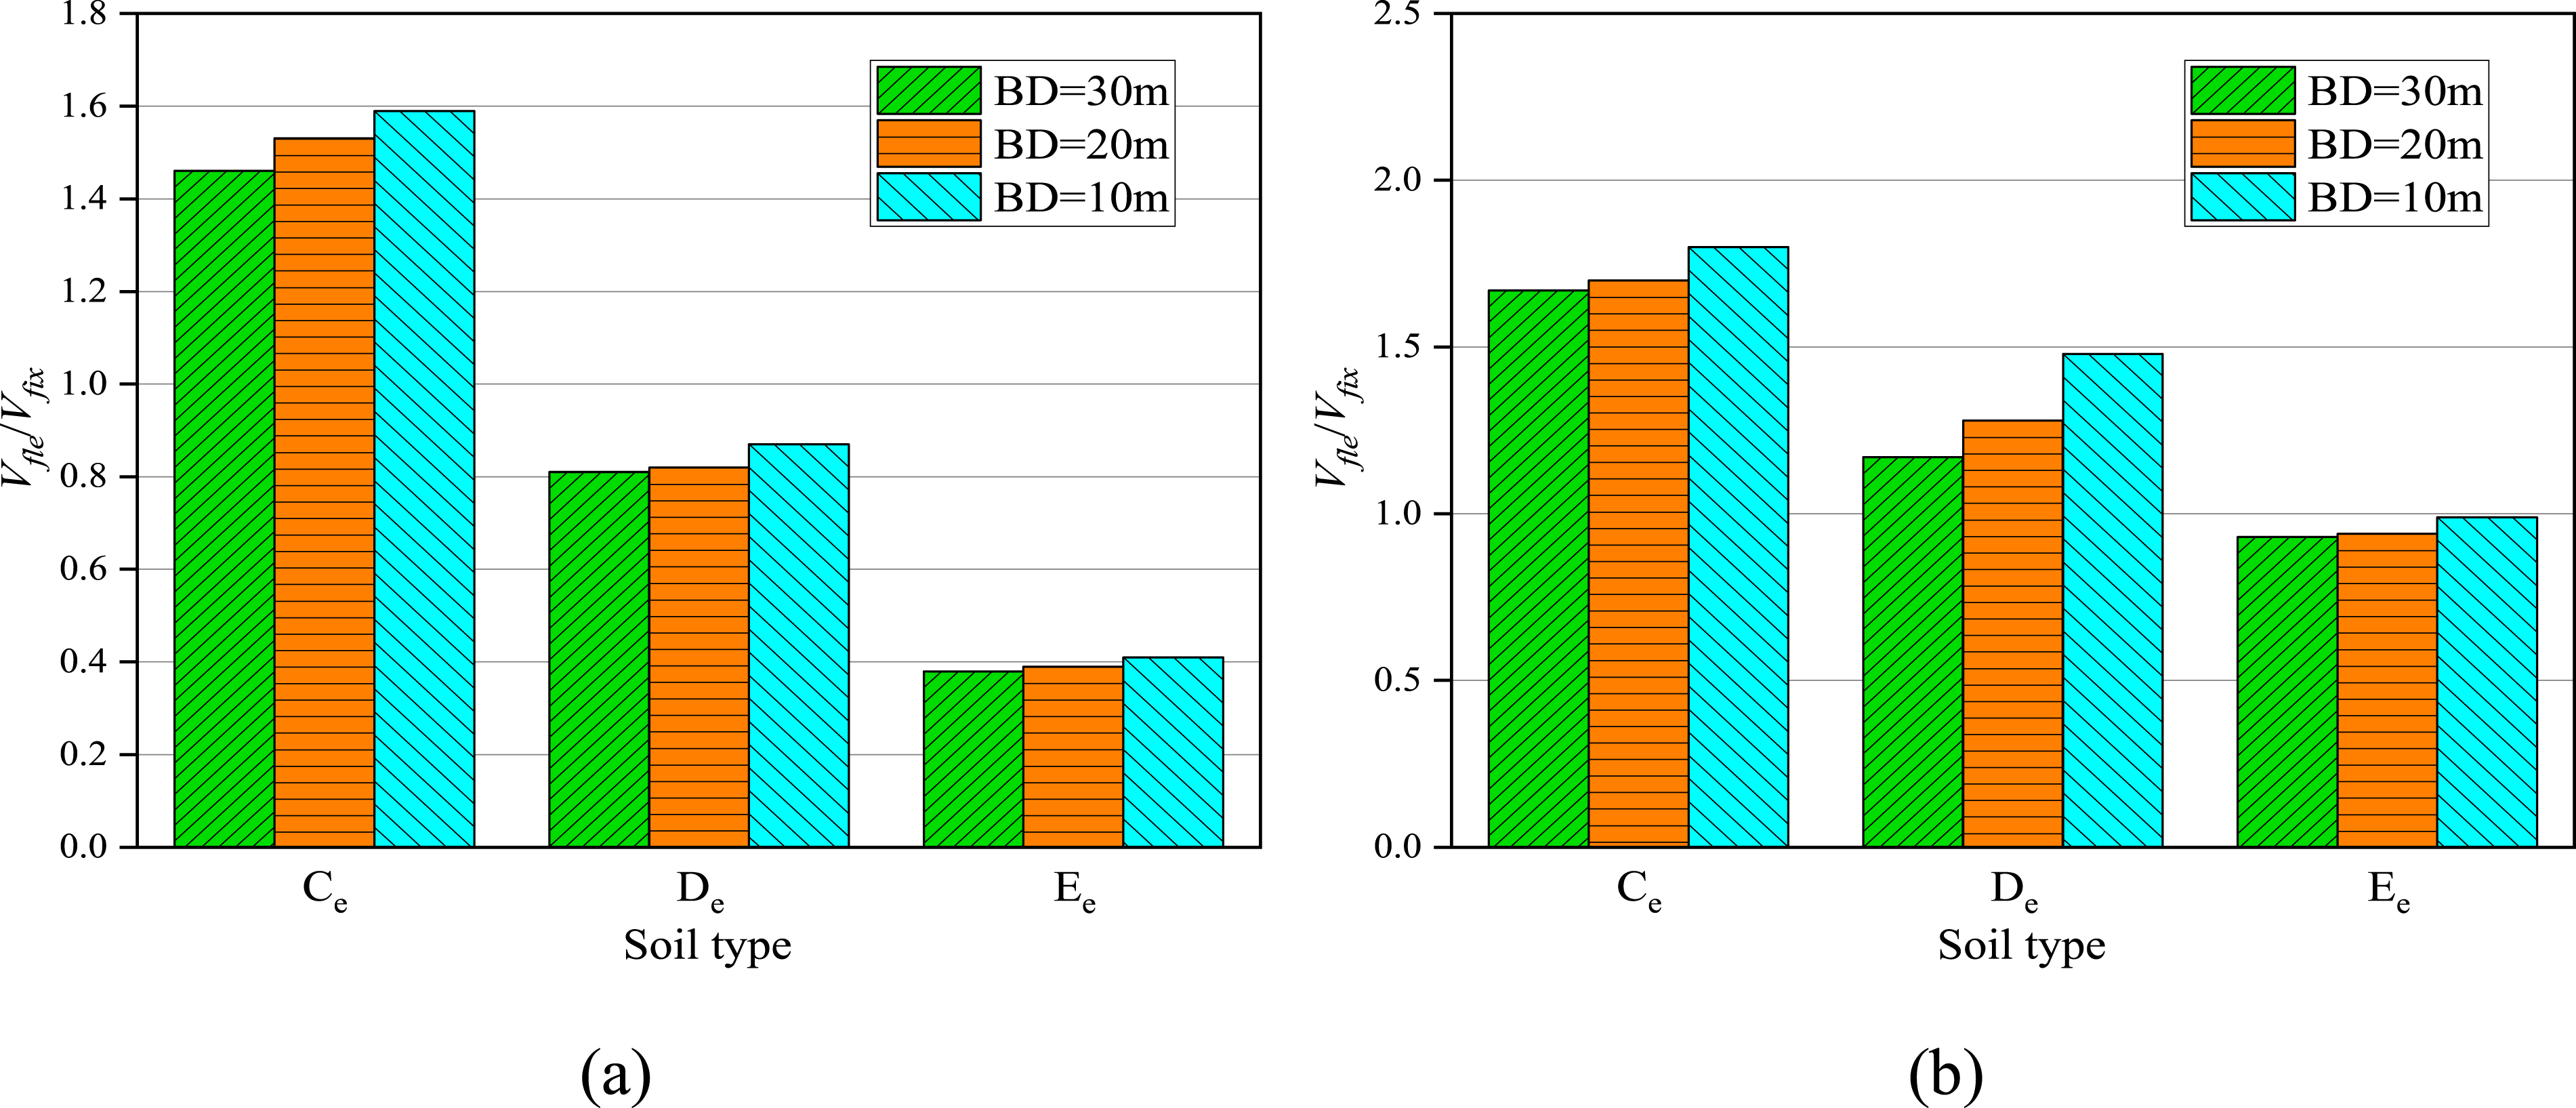
Firstly, the value of V
fle
/V
fix
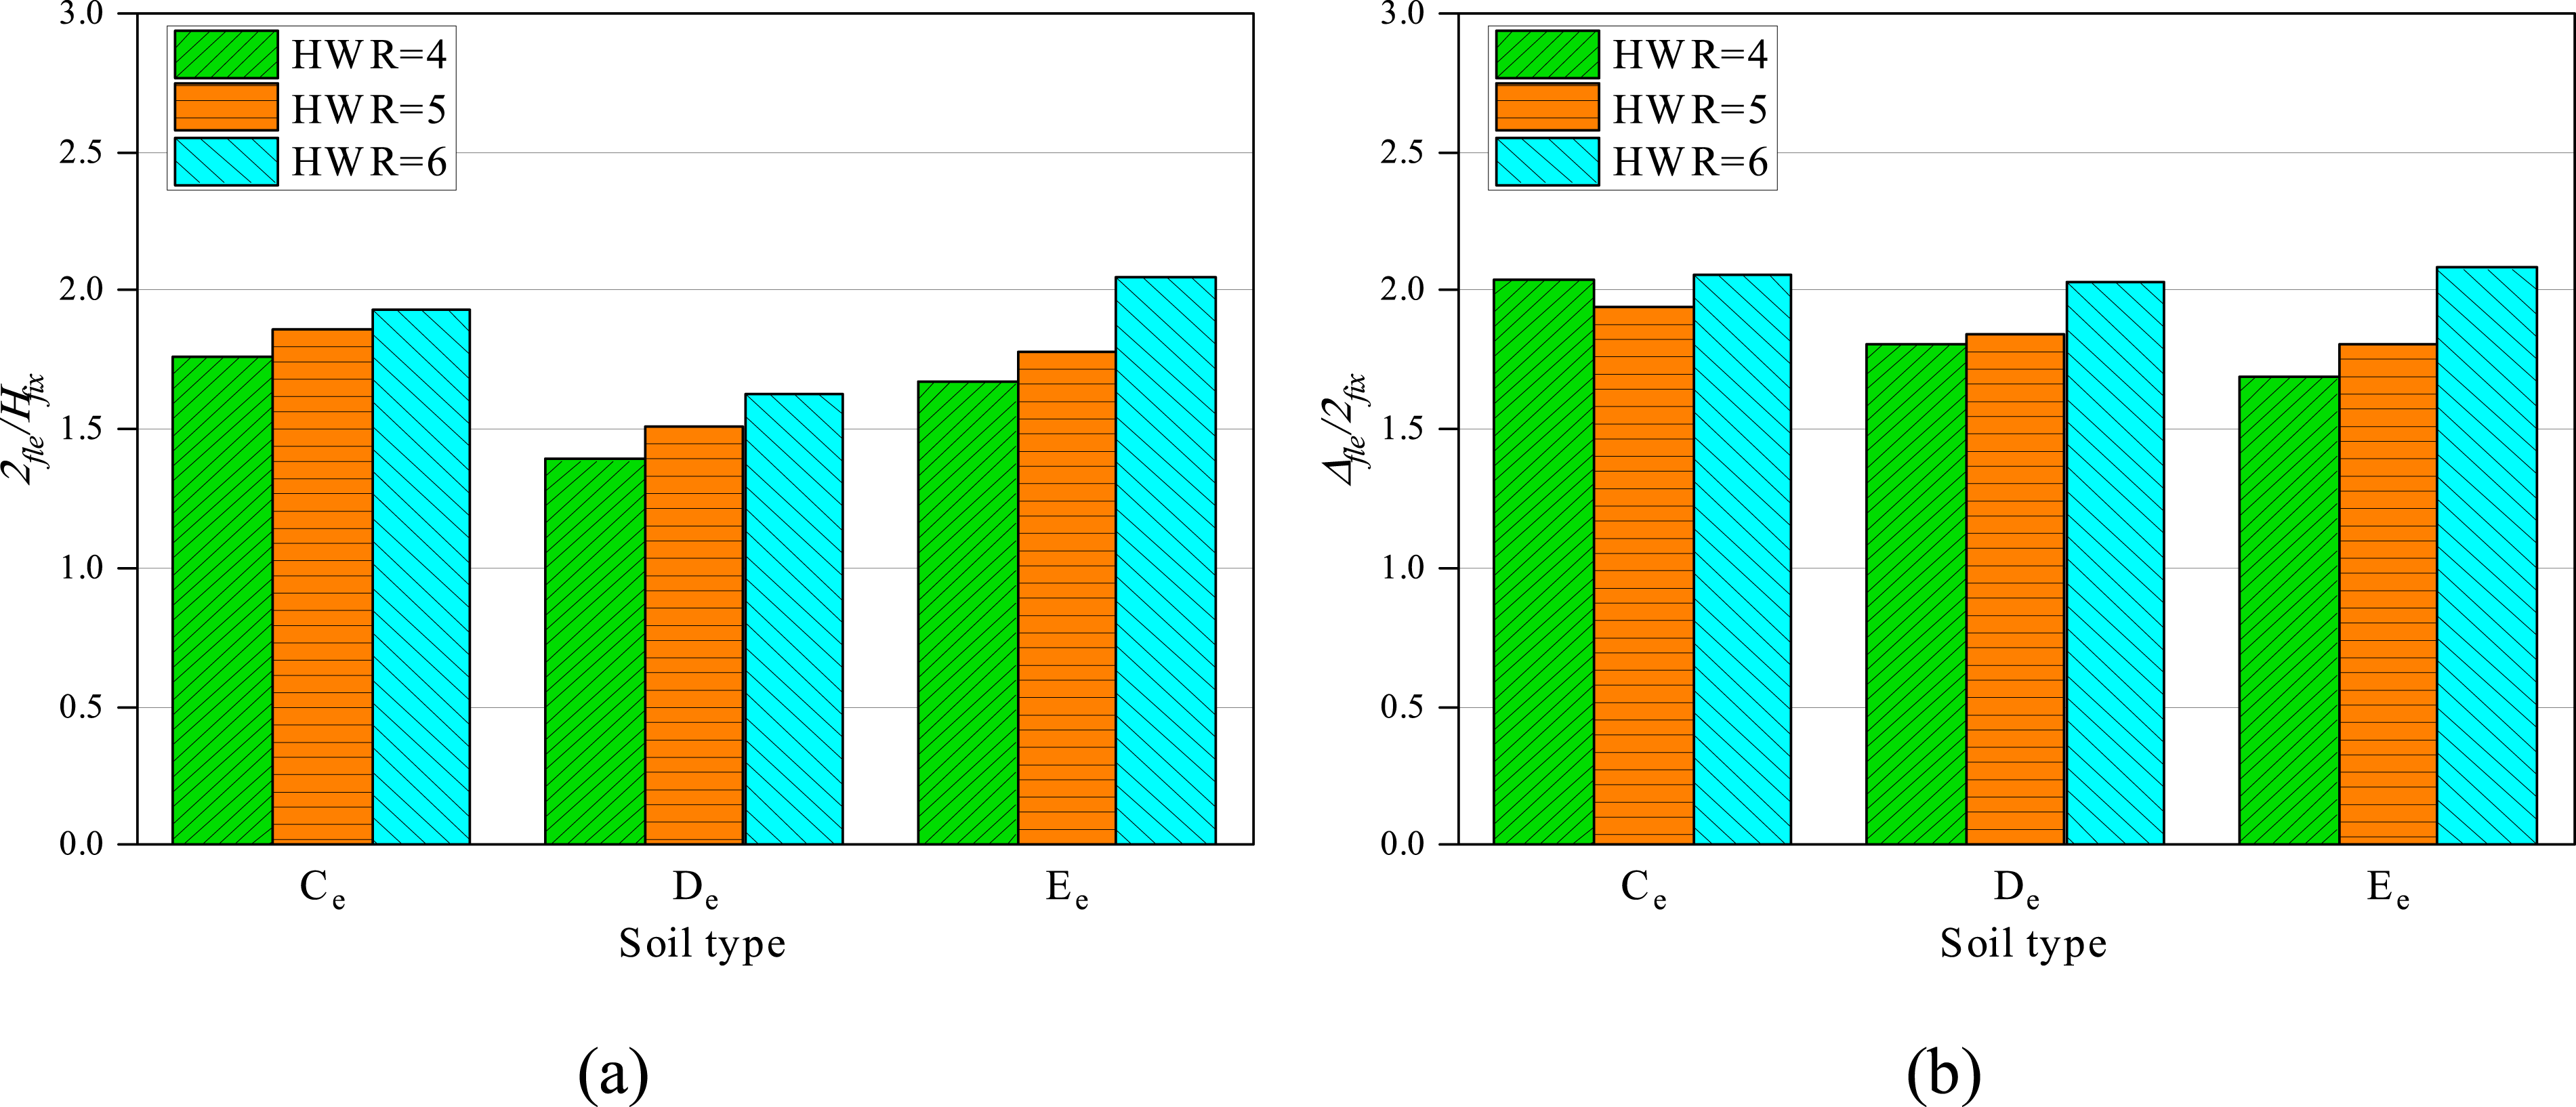
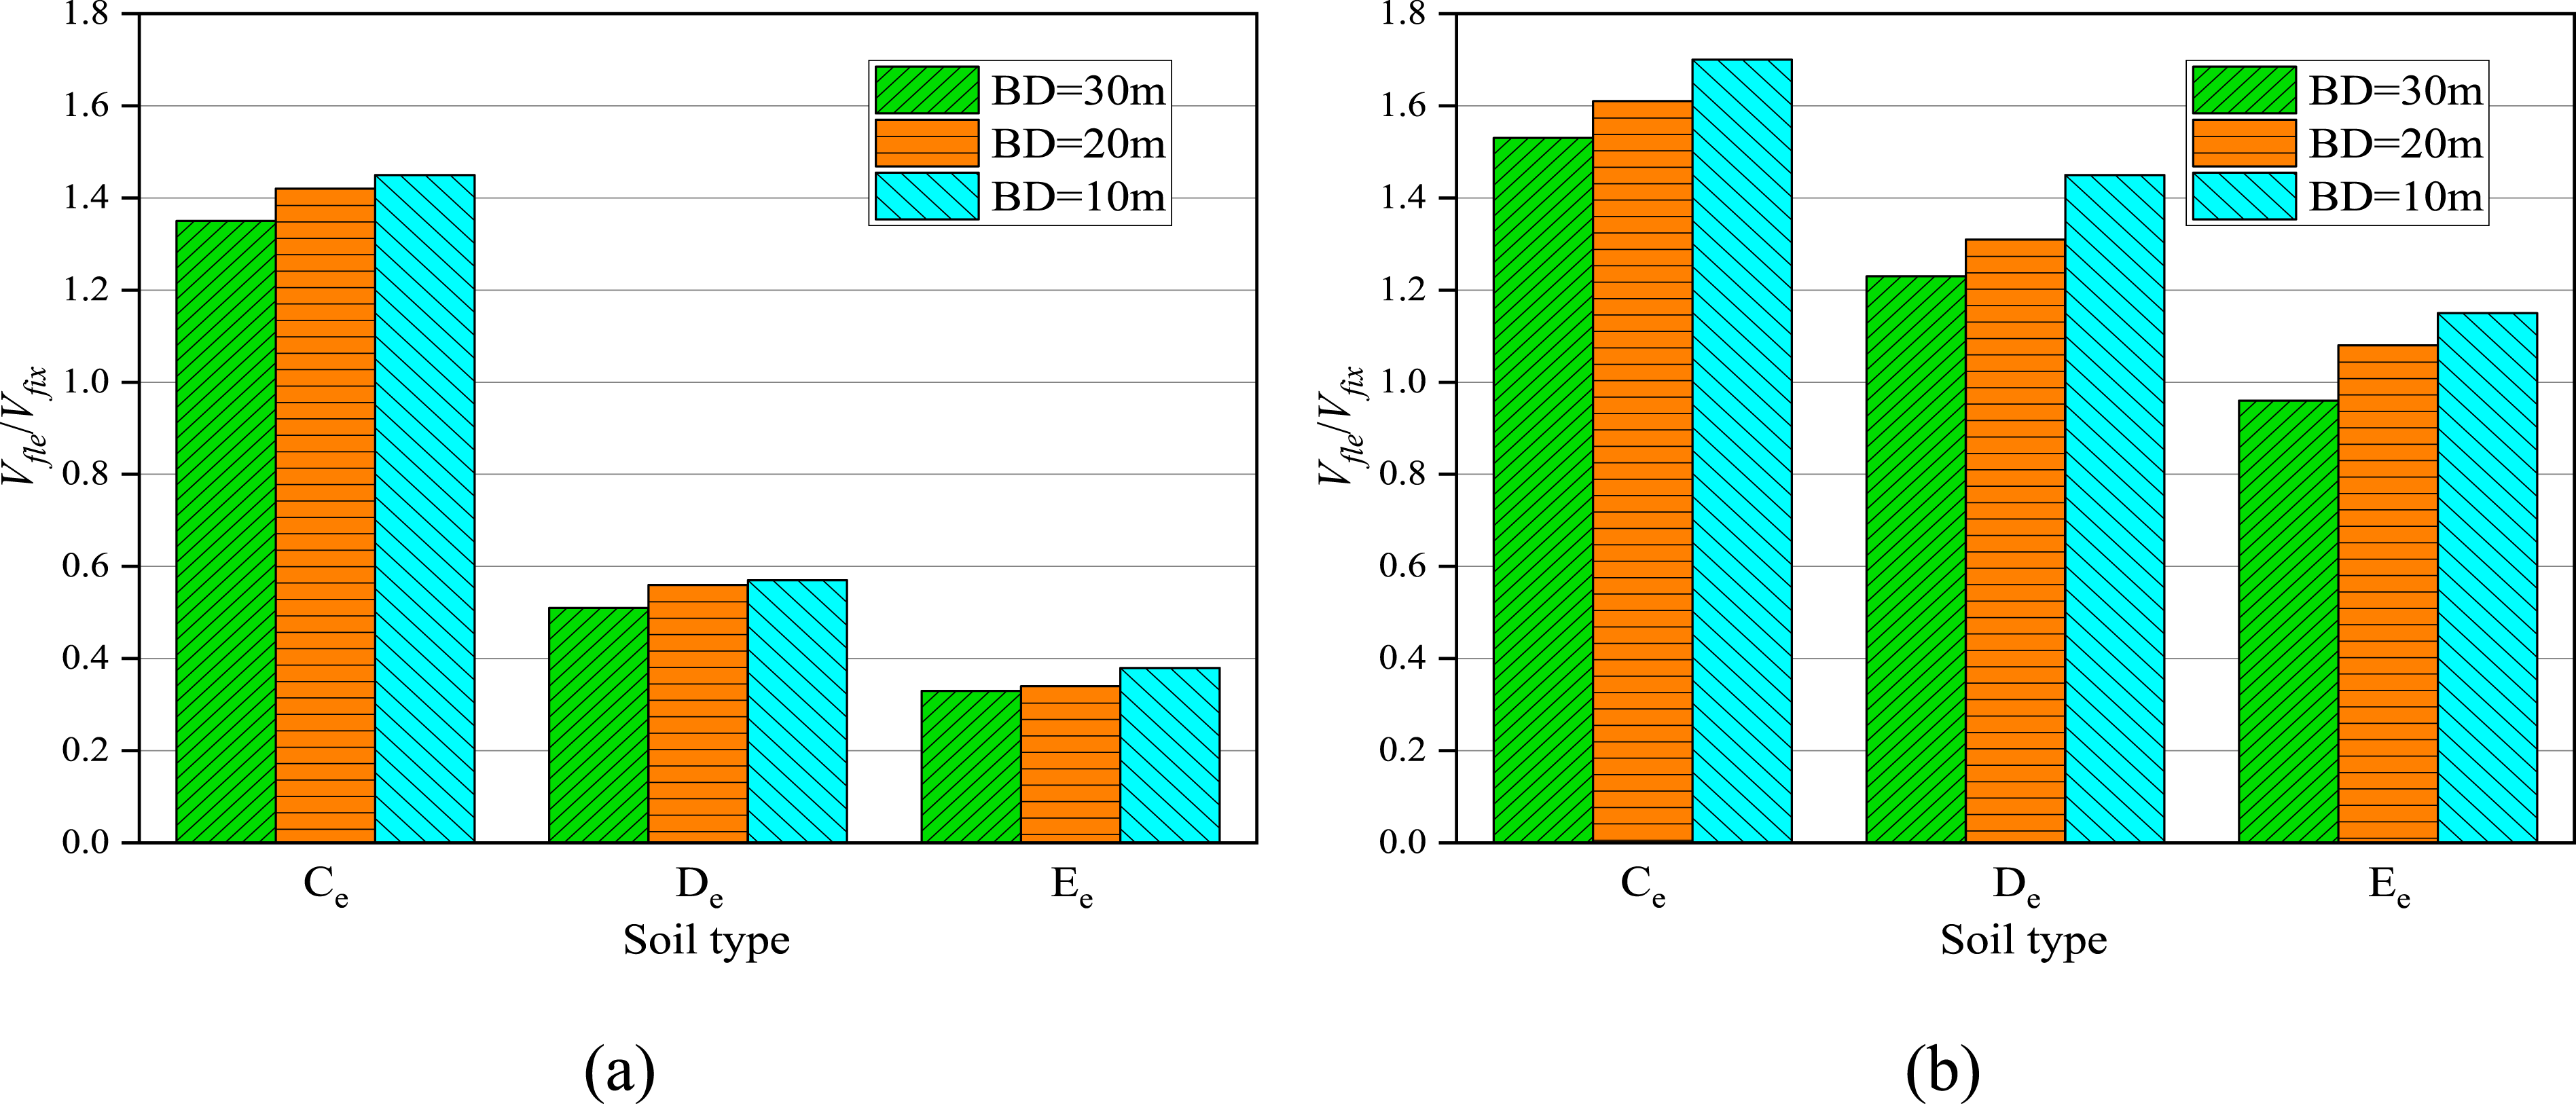
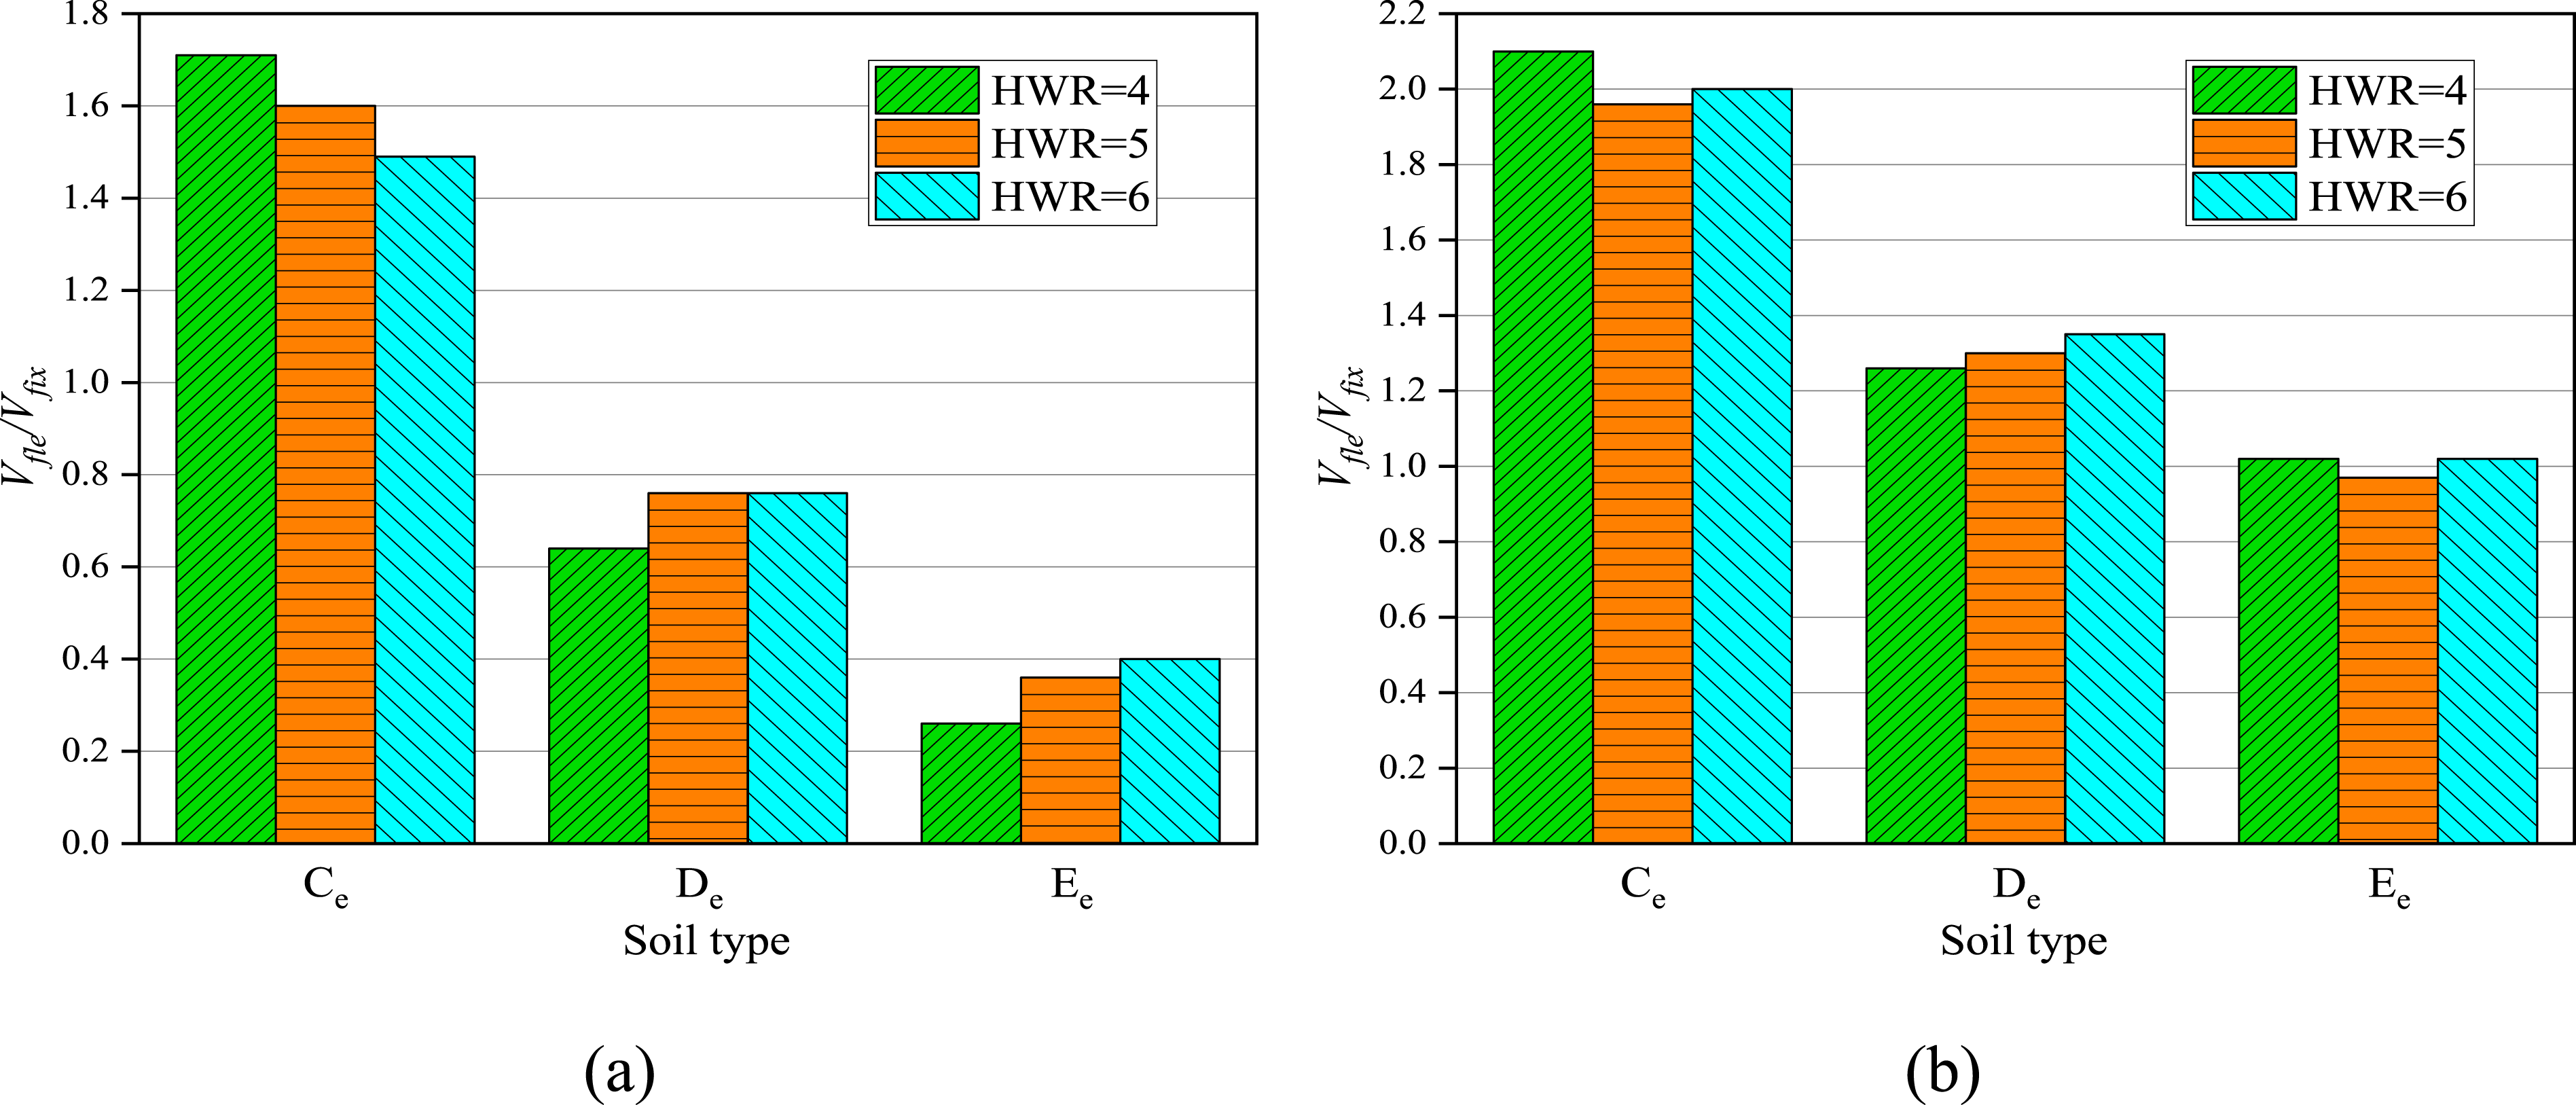
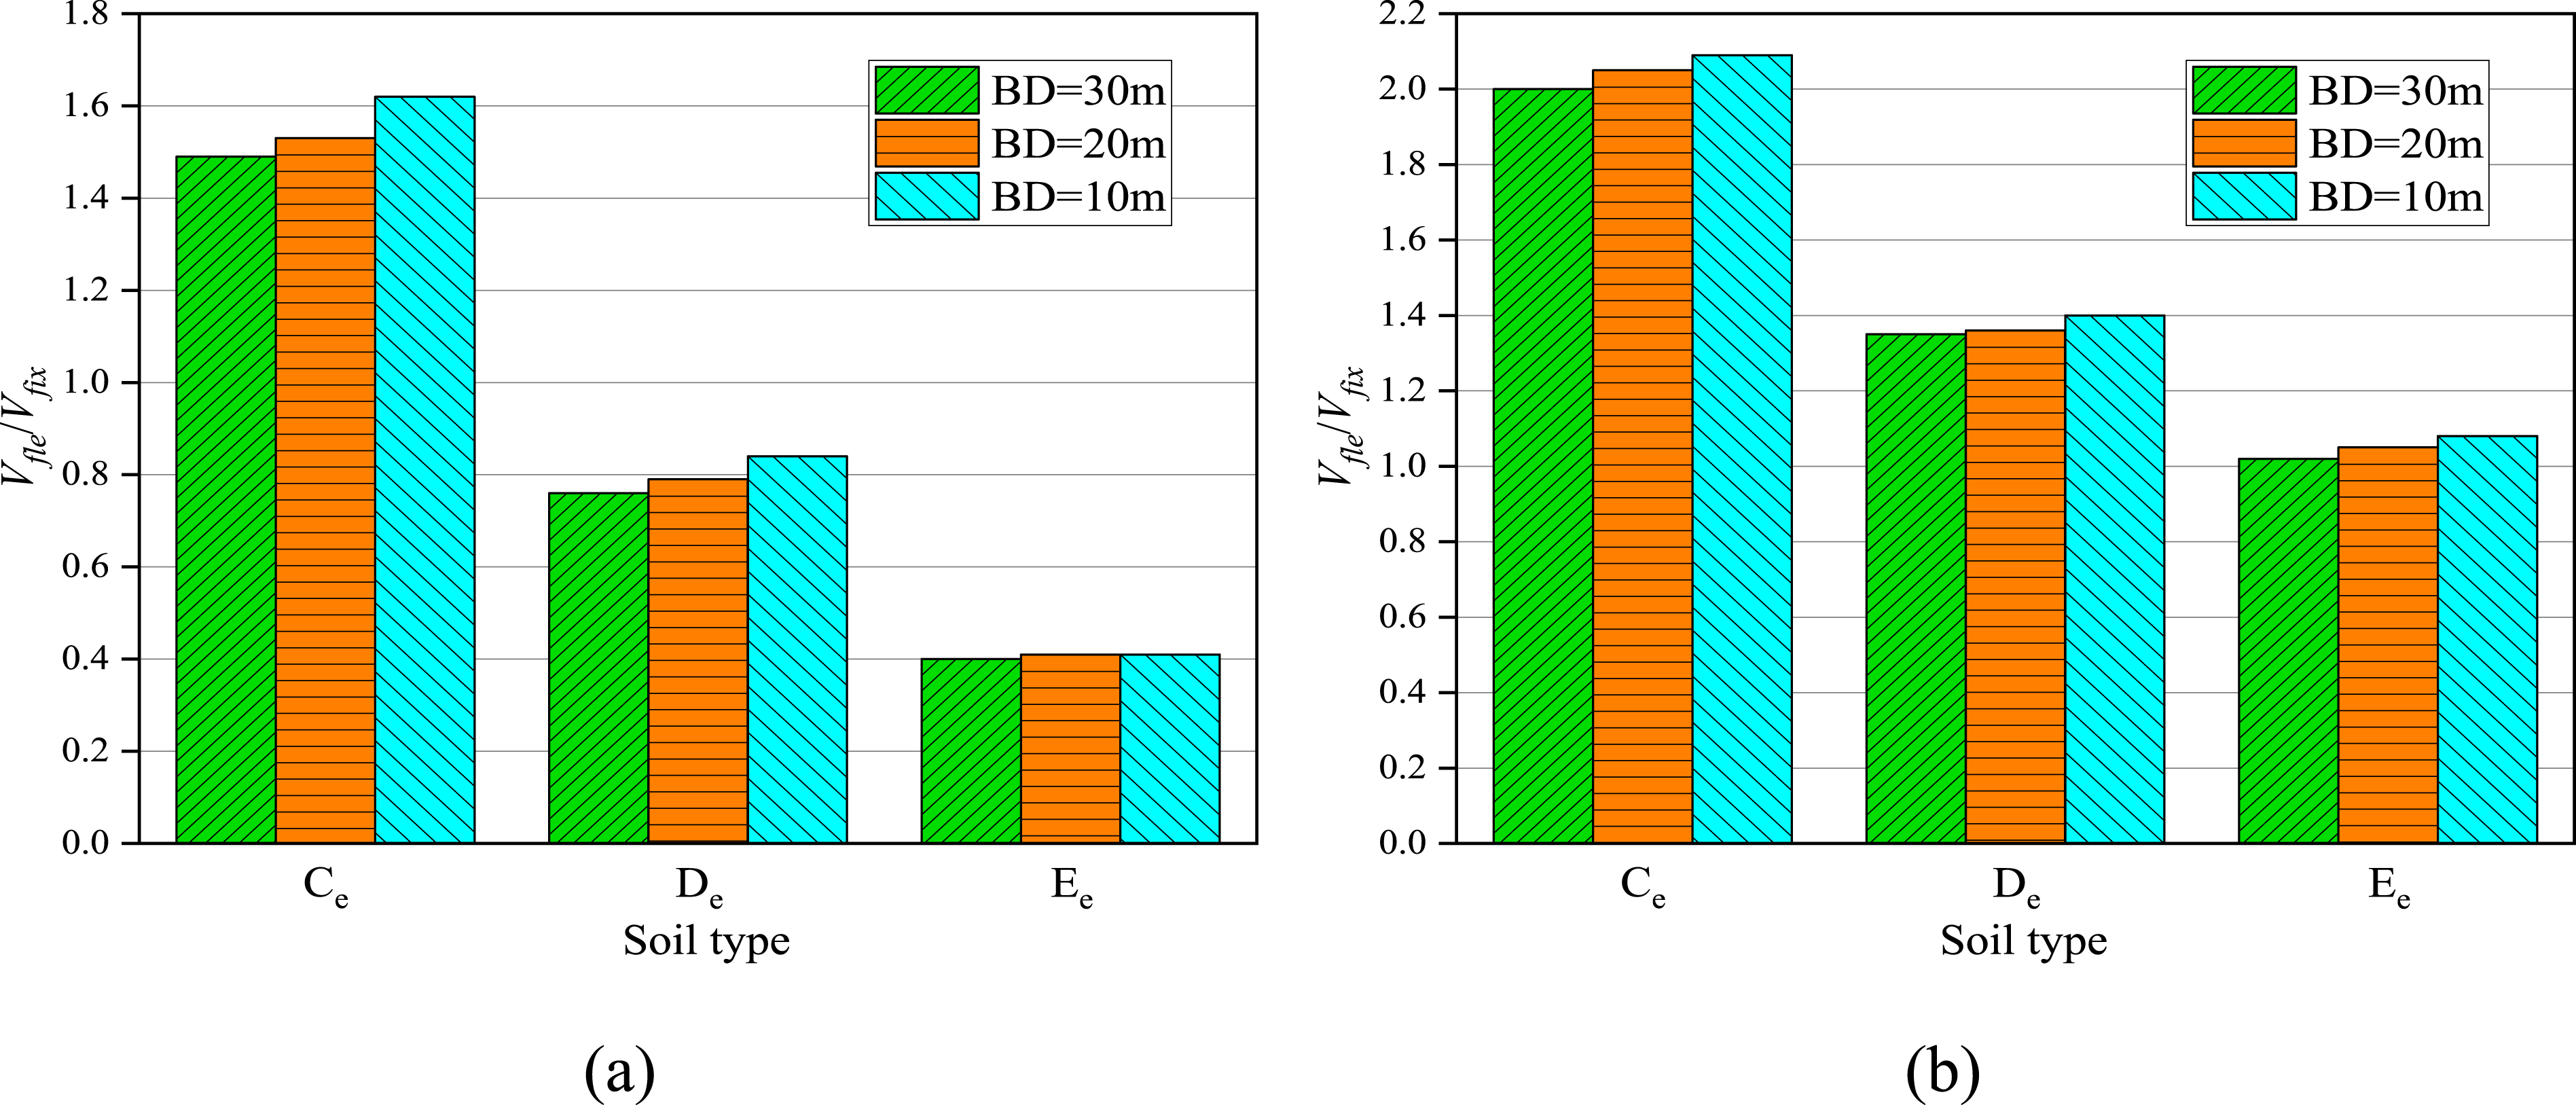
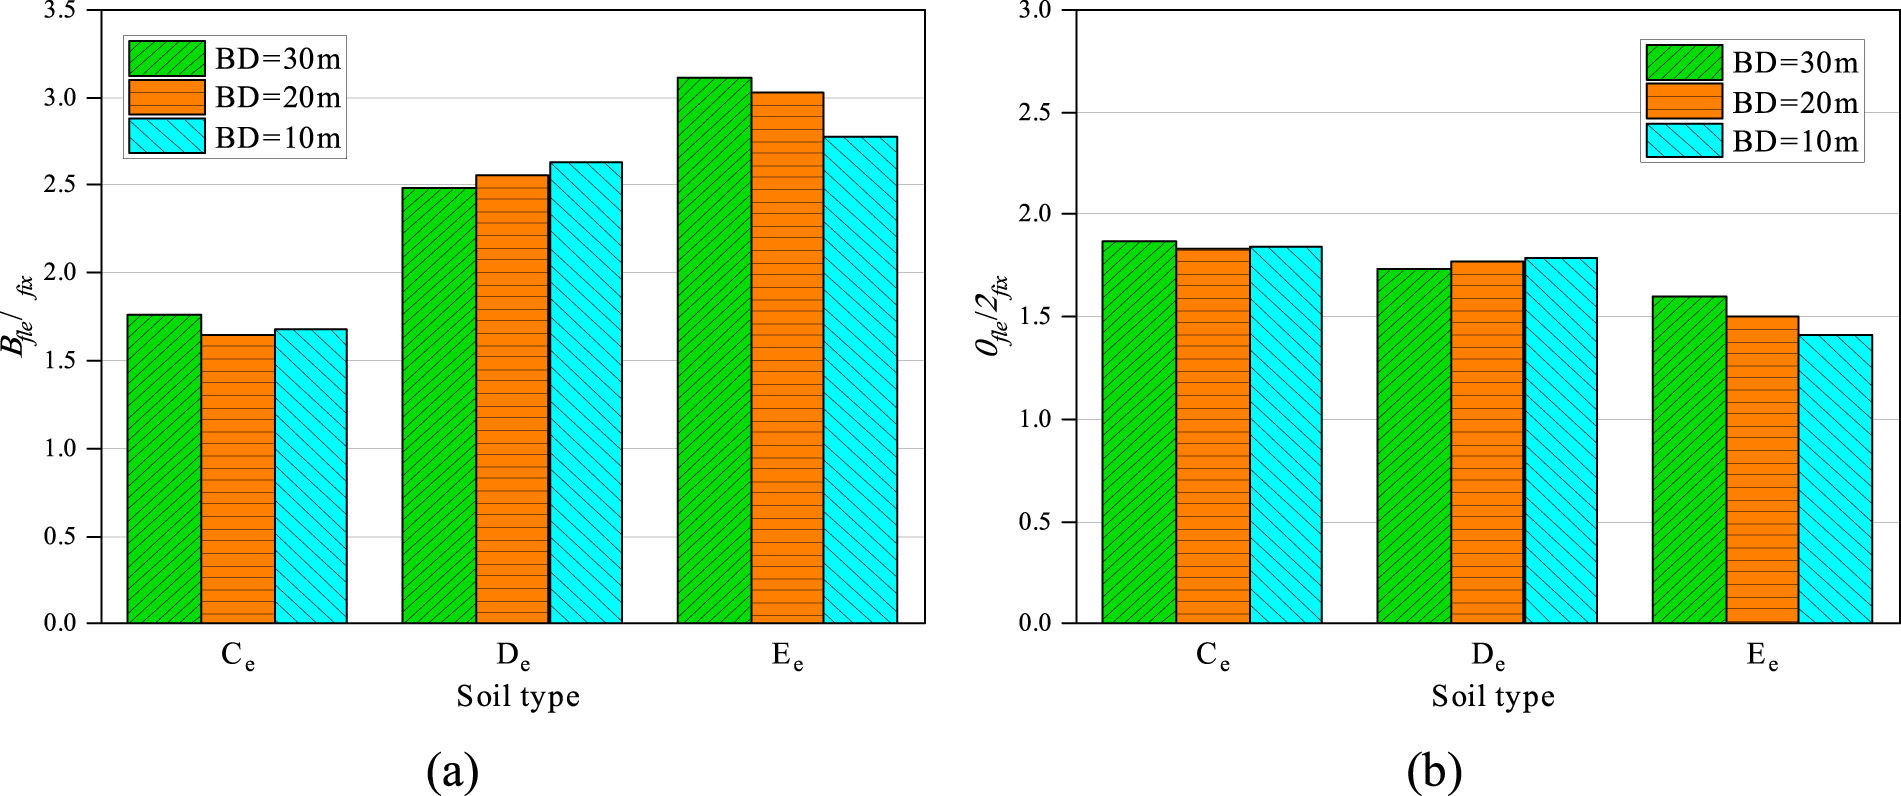
with different superstructure and substructure parameters are shown in Figures 14–19. It can be found that regardless of the foundation type, V
fle
/V
fix
increase significantly with the increase of the soil stiffness. The change of HWR and BD can also slightly change this ratio, but its influence is far less than that of the soil type. For the classical compensated foundation structures, the values of V
fle
/V
fix
of structures with the Ce soil are always greater than 1, indicating that the stiff soil can increase the V of frame-core tube structures when SSI is considered. In contrast, V
fle
/V
fix
of structures built on De and Ee soil types are both less than 1, indicating that the V can be reduced when structures are built on medium or soft soils. After meticulous consideration of soil and foundation effects, it becomes apparent that not only does the natural period of the structure undergo alteration, but also, due to soil amplification and the ramifications of kinematic and inertial interaction, the response spectrum of the foundation input motion undergoes modifications compared to free field motion. Consequently, the base shear experienced by a structure founded on stiff soil may exceed that of a fixed base structure, disregarding SSI effects. The value of V
fle
/V
fix
of 20-storey frame-core tube structures with different HWRs (a) classical compensated foundation structure (b) piled foundation structure. The value of V
fle
/V
fix
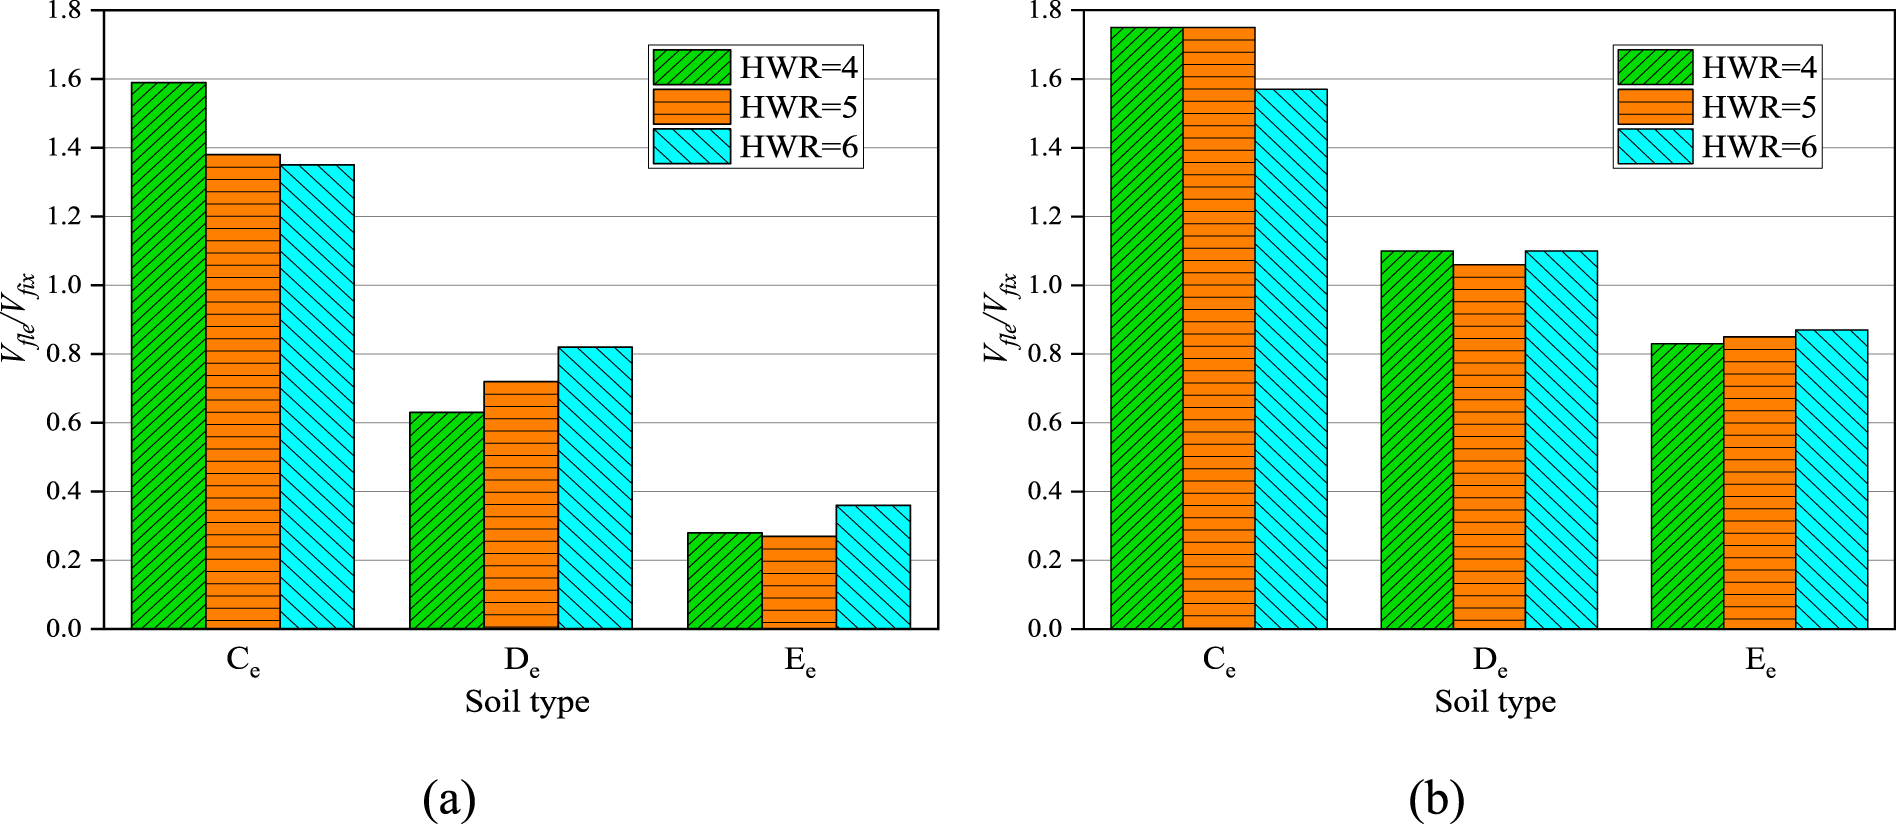
of 20-storey frame-core tube structures with different BDs (a) classical compensated foundation structure (b) piled foundation structure. The value of V
fle
/V
fix
of 30-storey frame-core tube structures with different HWRs (a) classical compensated foundation structure (b) piled foundation structure. The value of V
fle
/V
fix
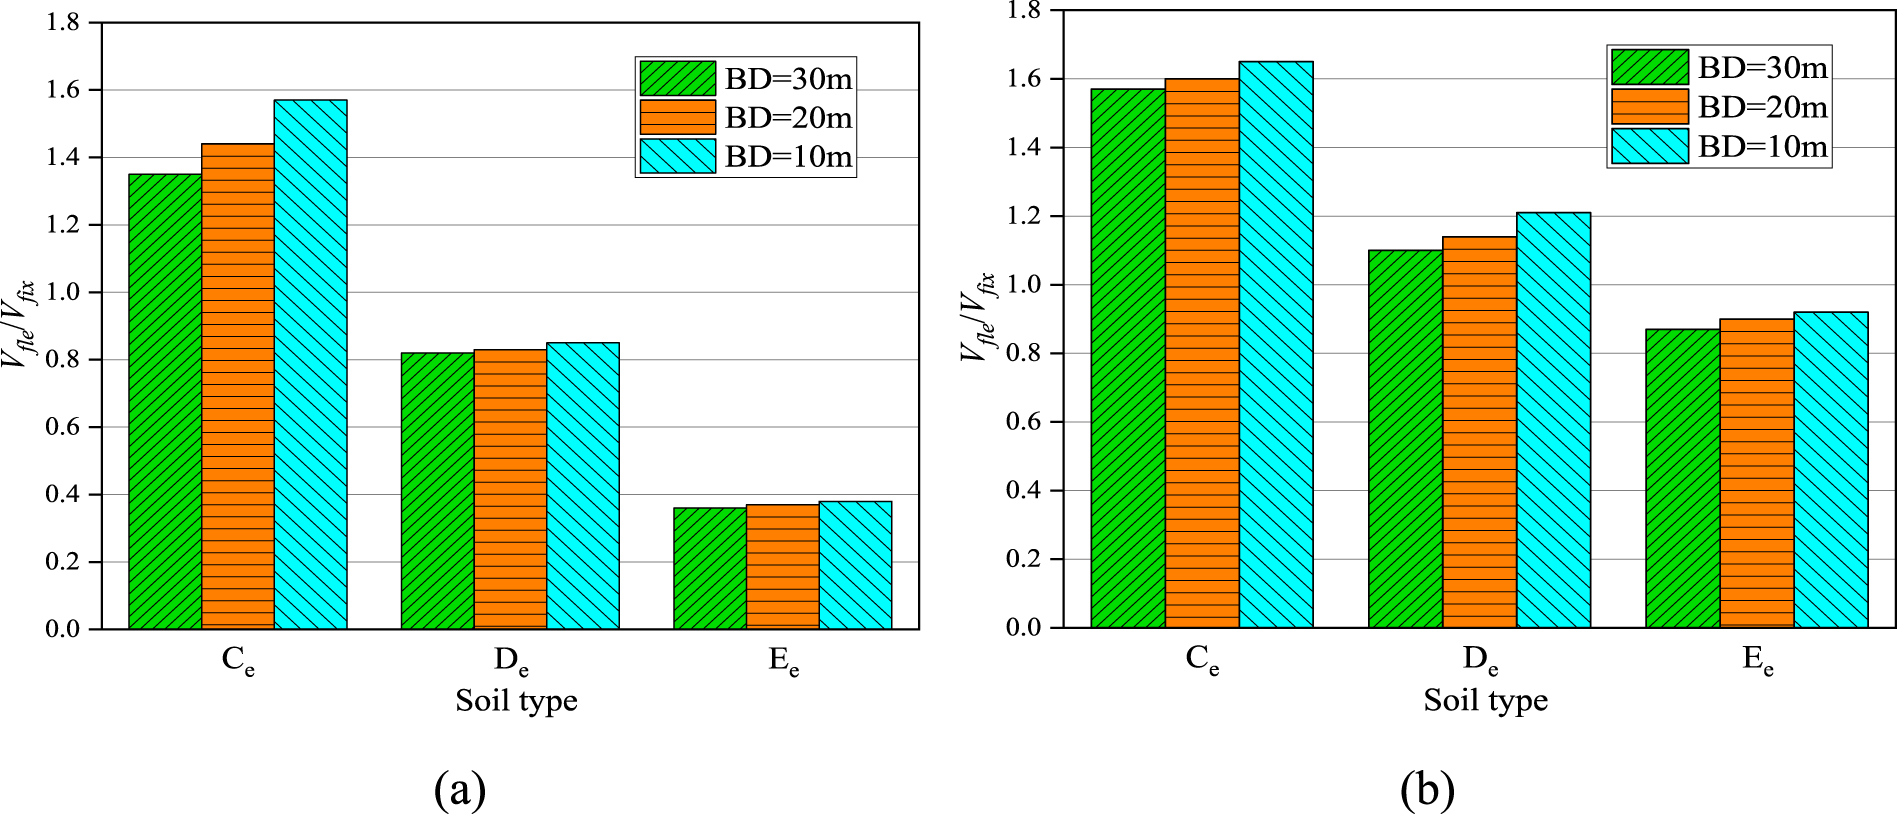
of 30-storey frame-core tube structures with different BDs (a) classical compensated foundation structure (b) piled foundation structure. The value of V
fle
/V
fix
of 40-storey frame-core tube structures with different HWRs (a) classical compensated foundation structure (b) piled foundation structure. The value of V
fle
/V
fix
of 40-storey frame-core tube structures with different BDs (a) classical compensated foundation structure (b) piled foundation structure.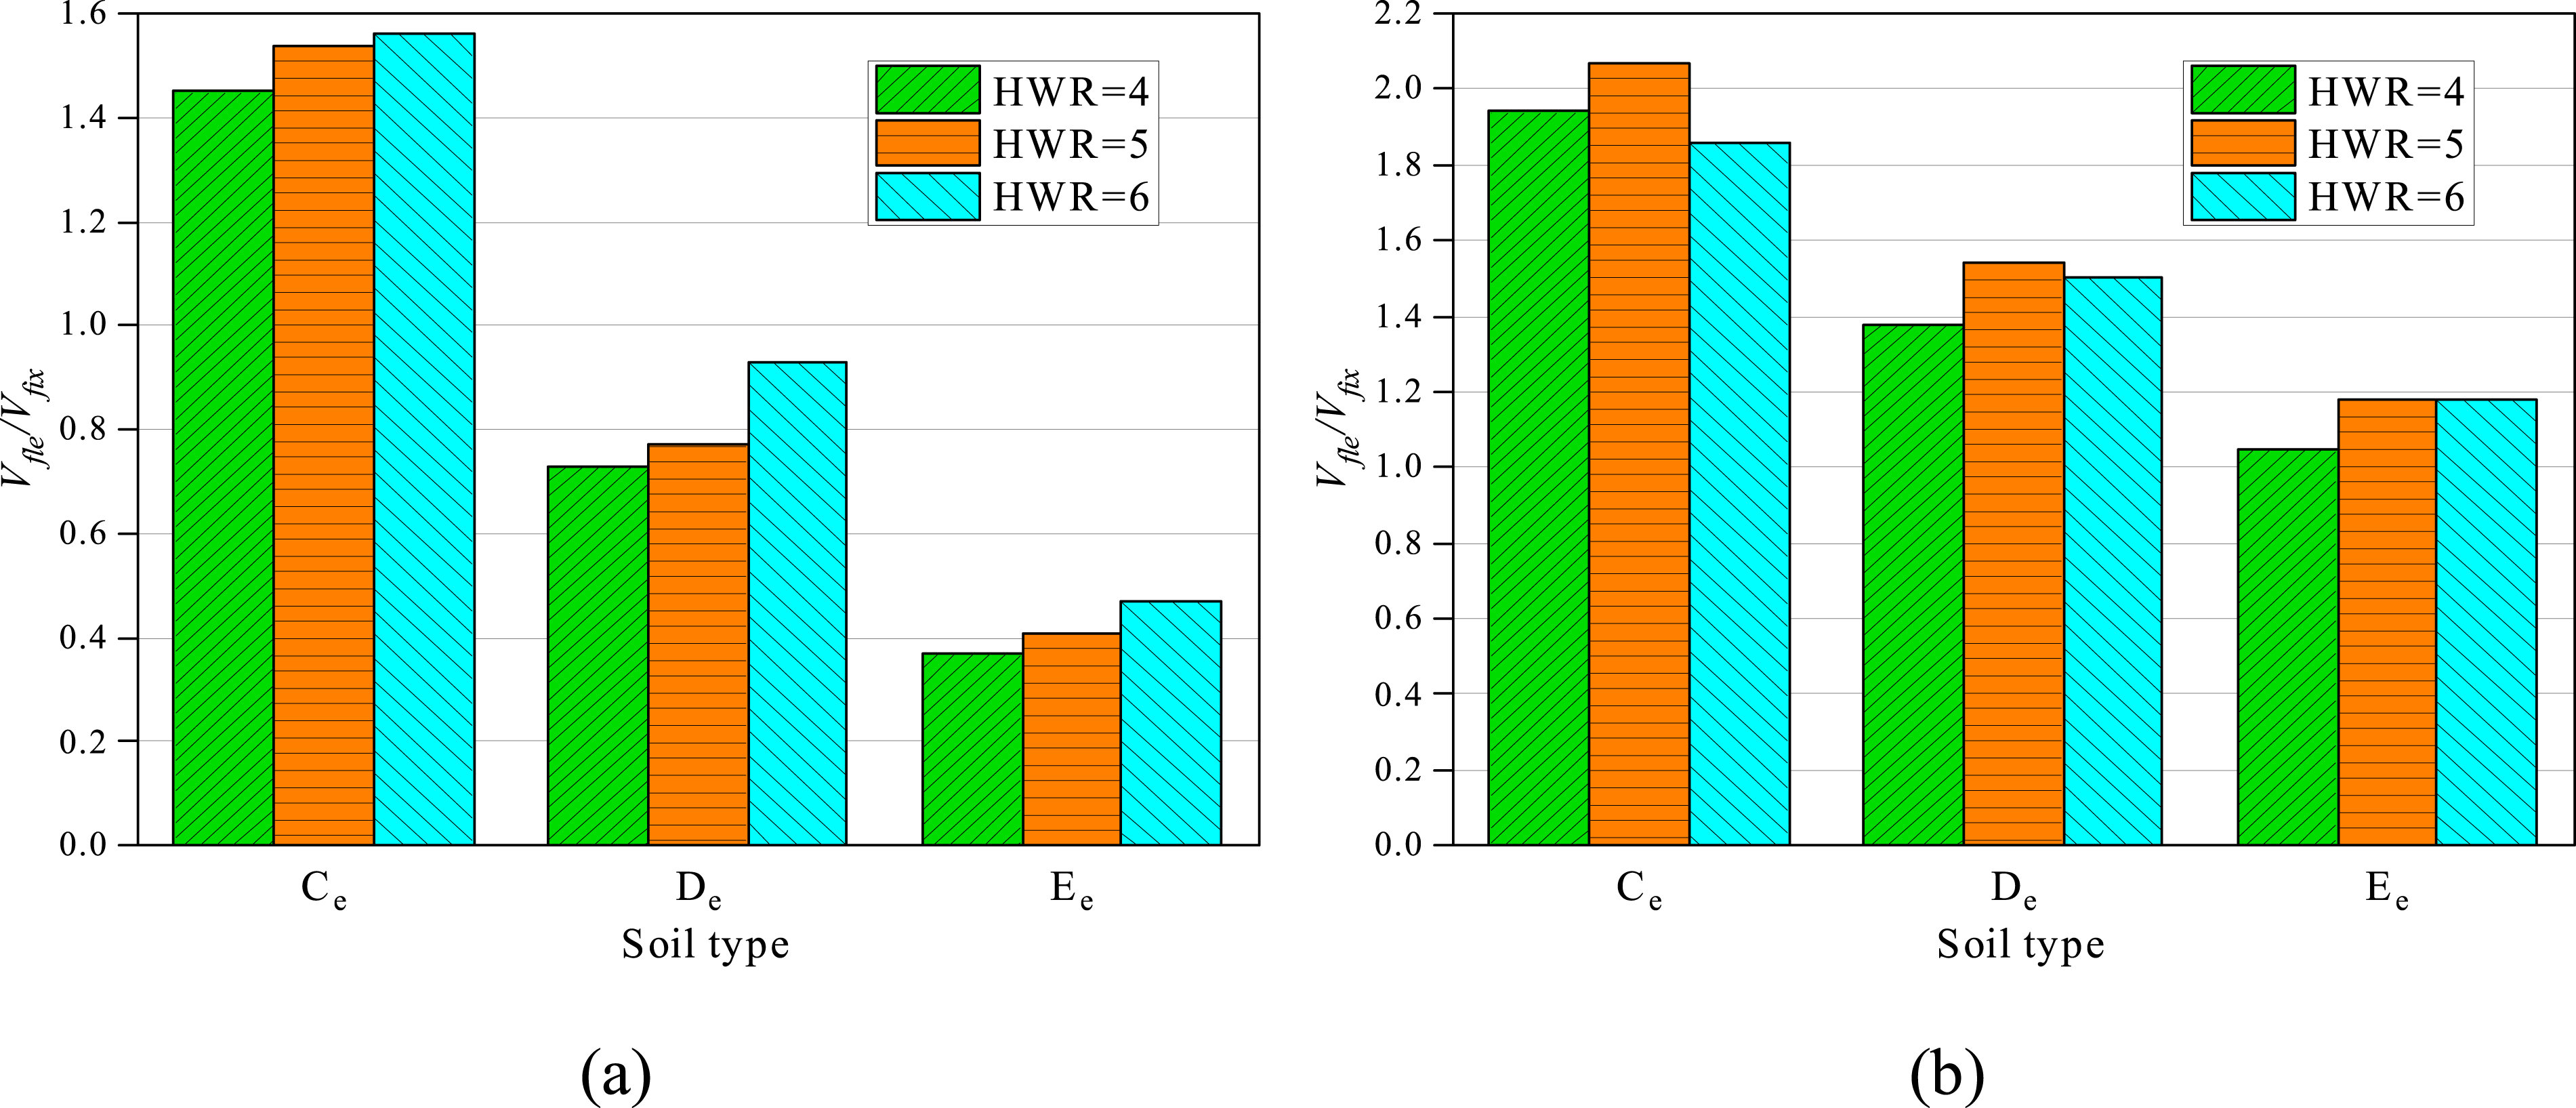
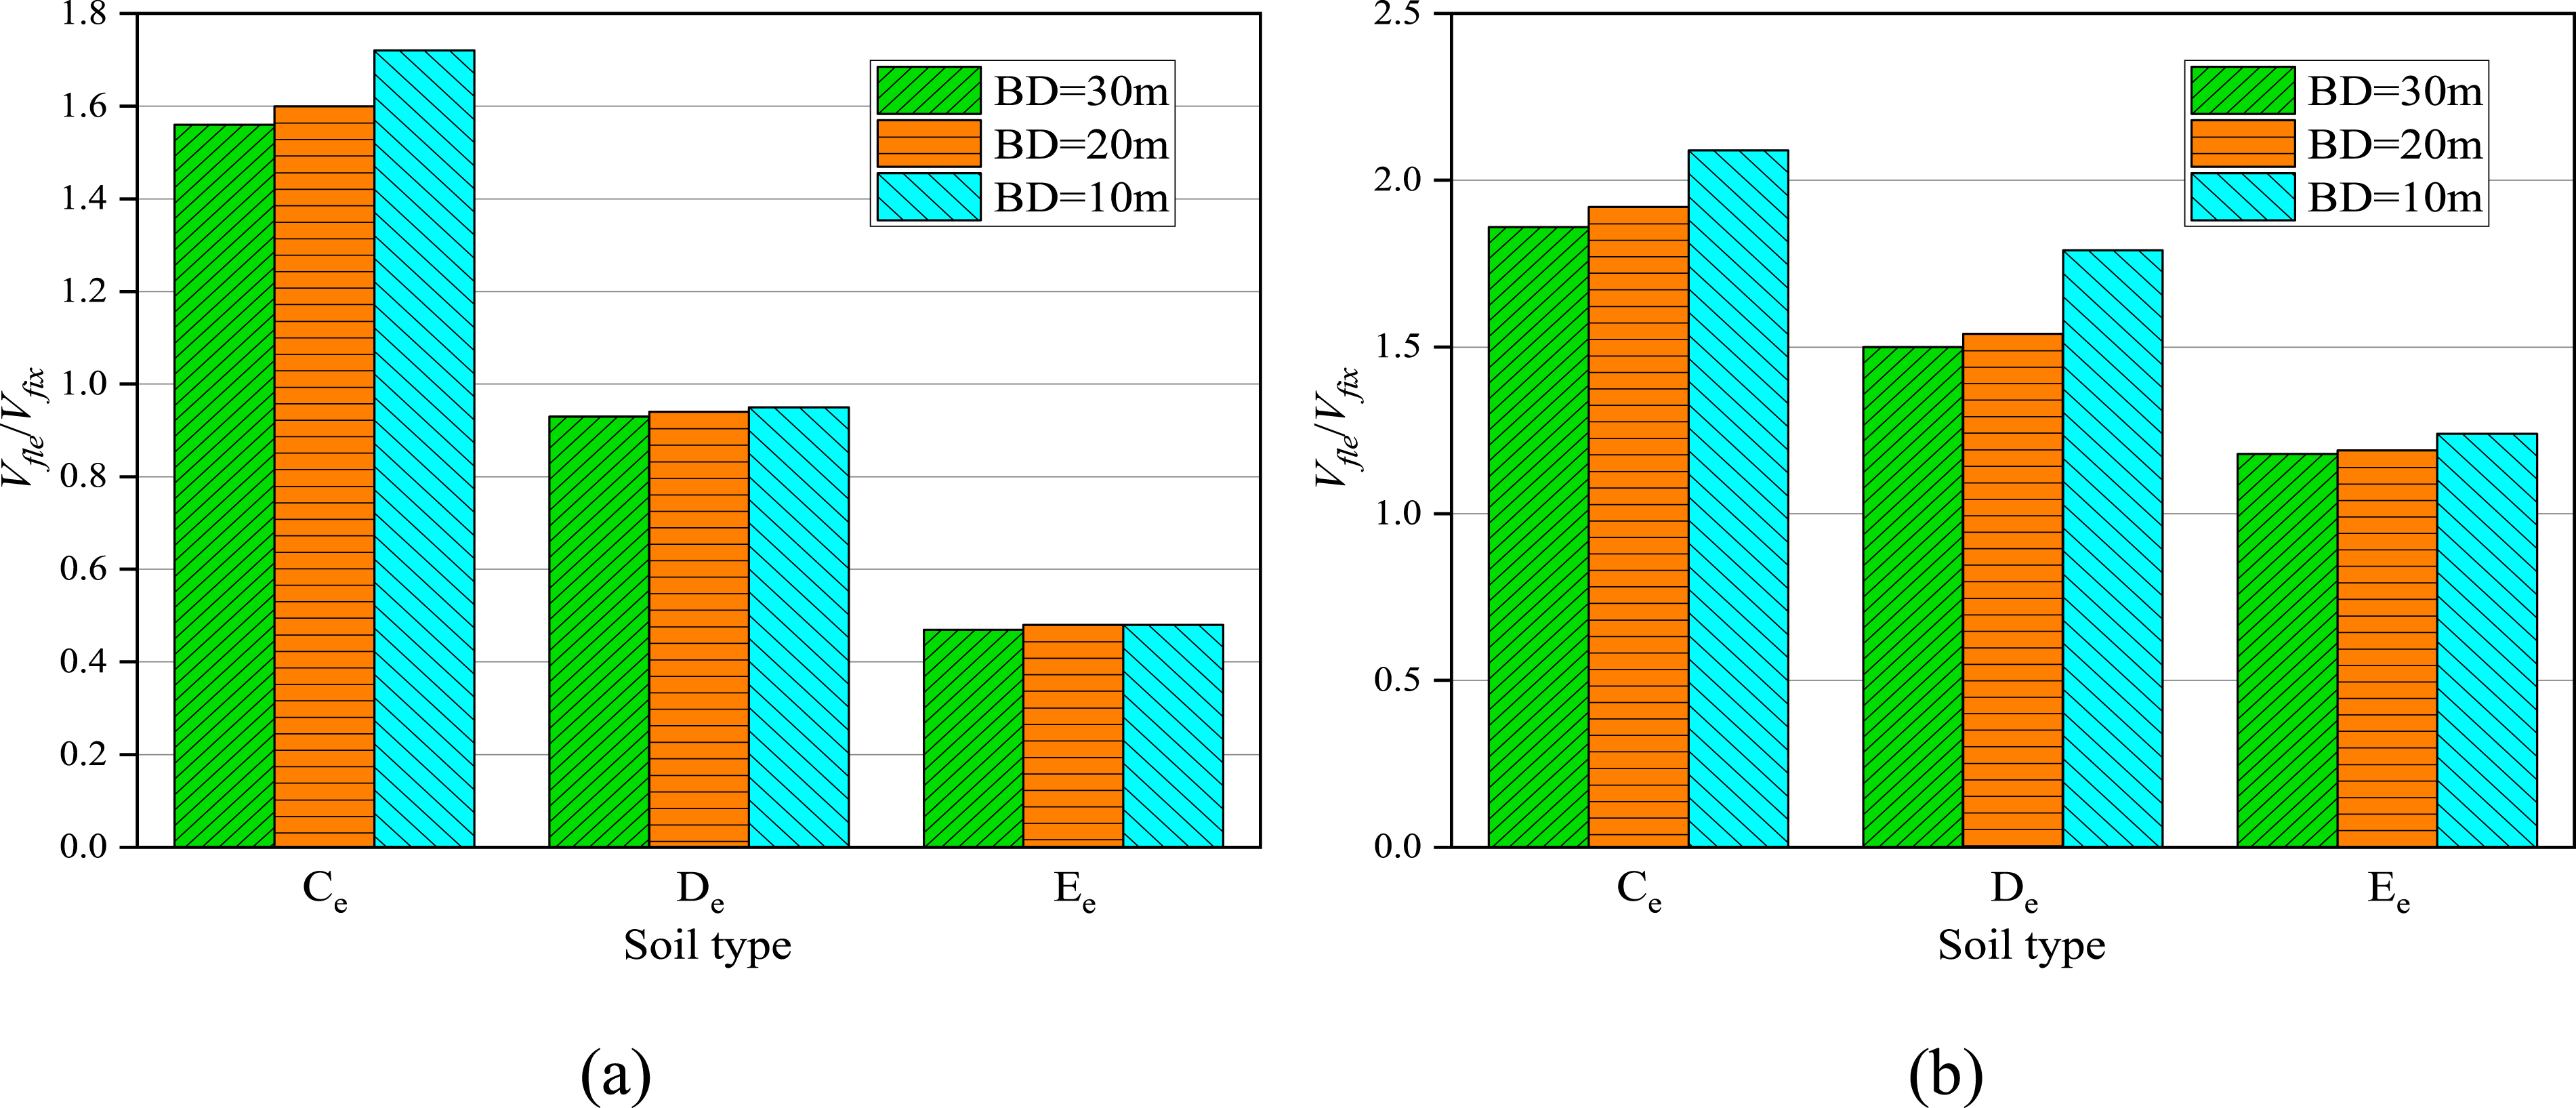
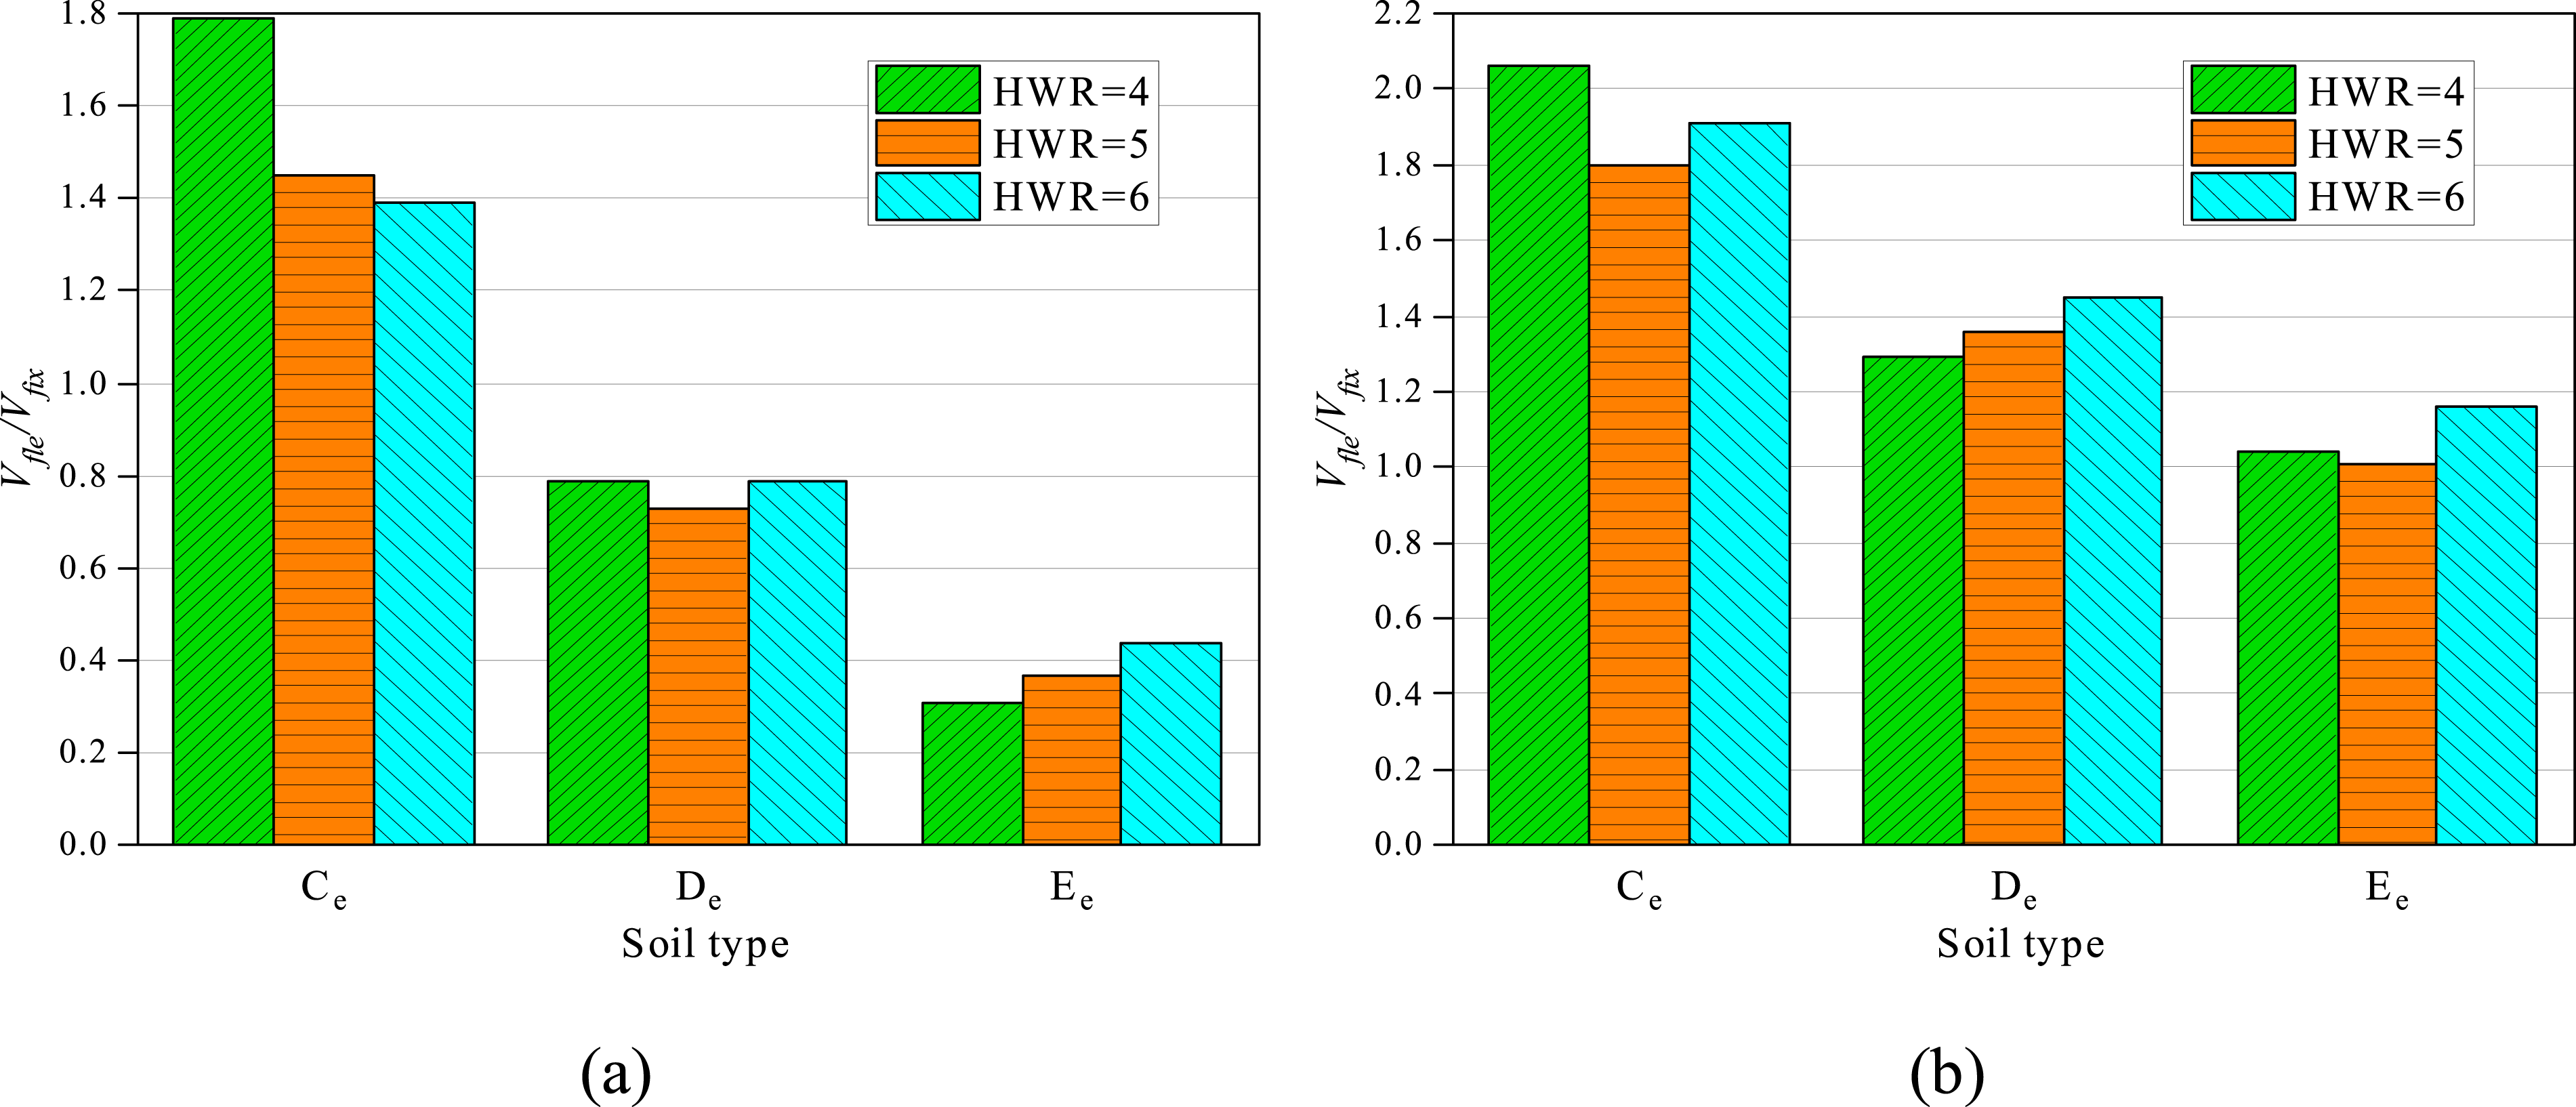
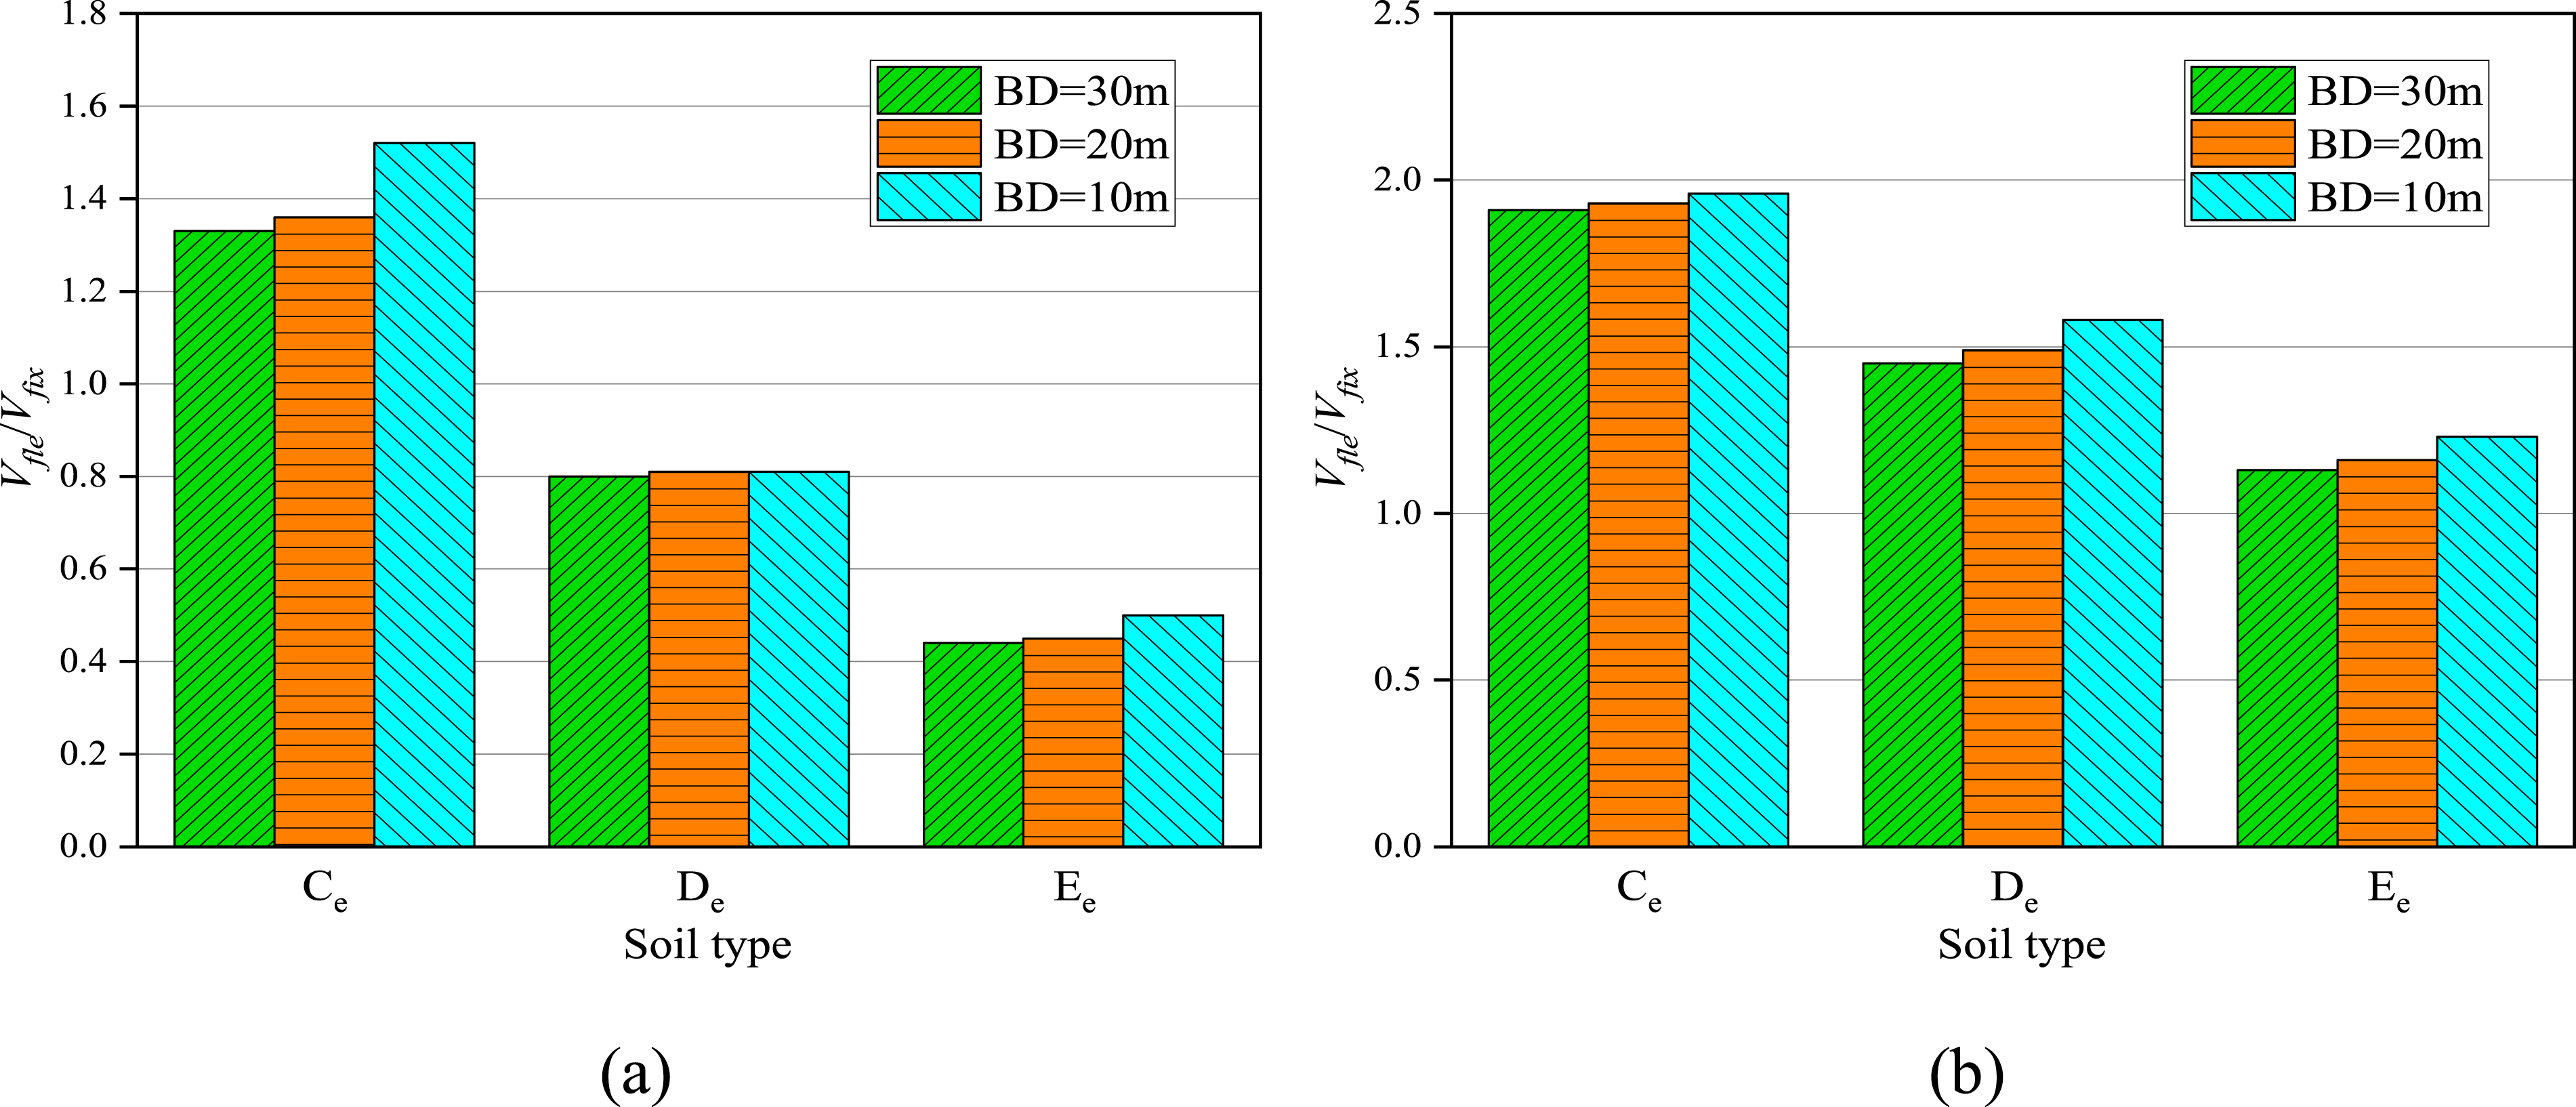
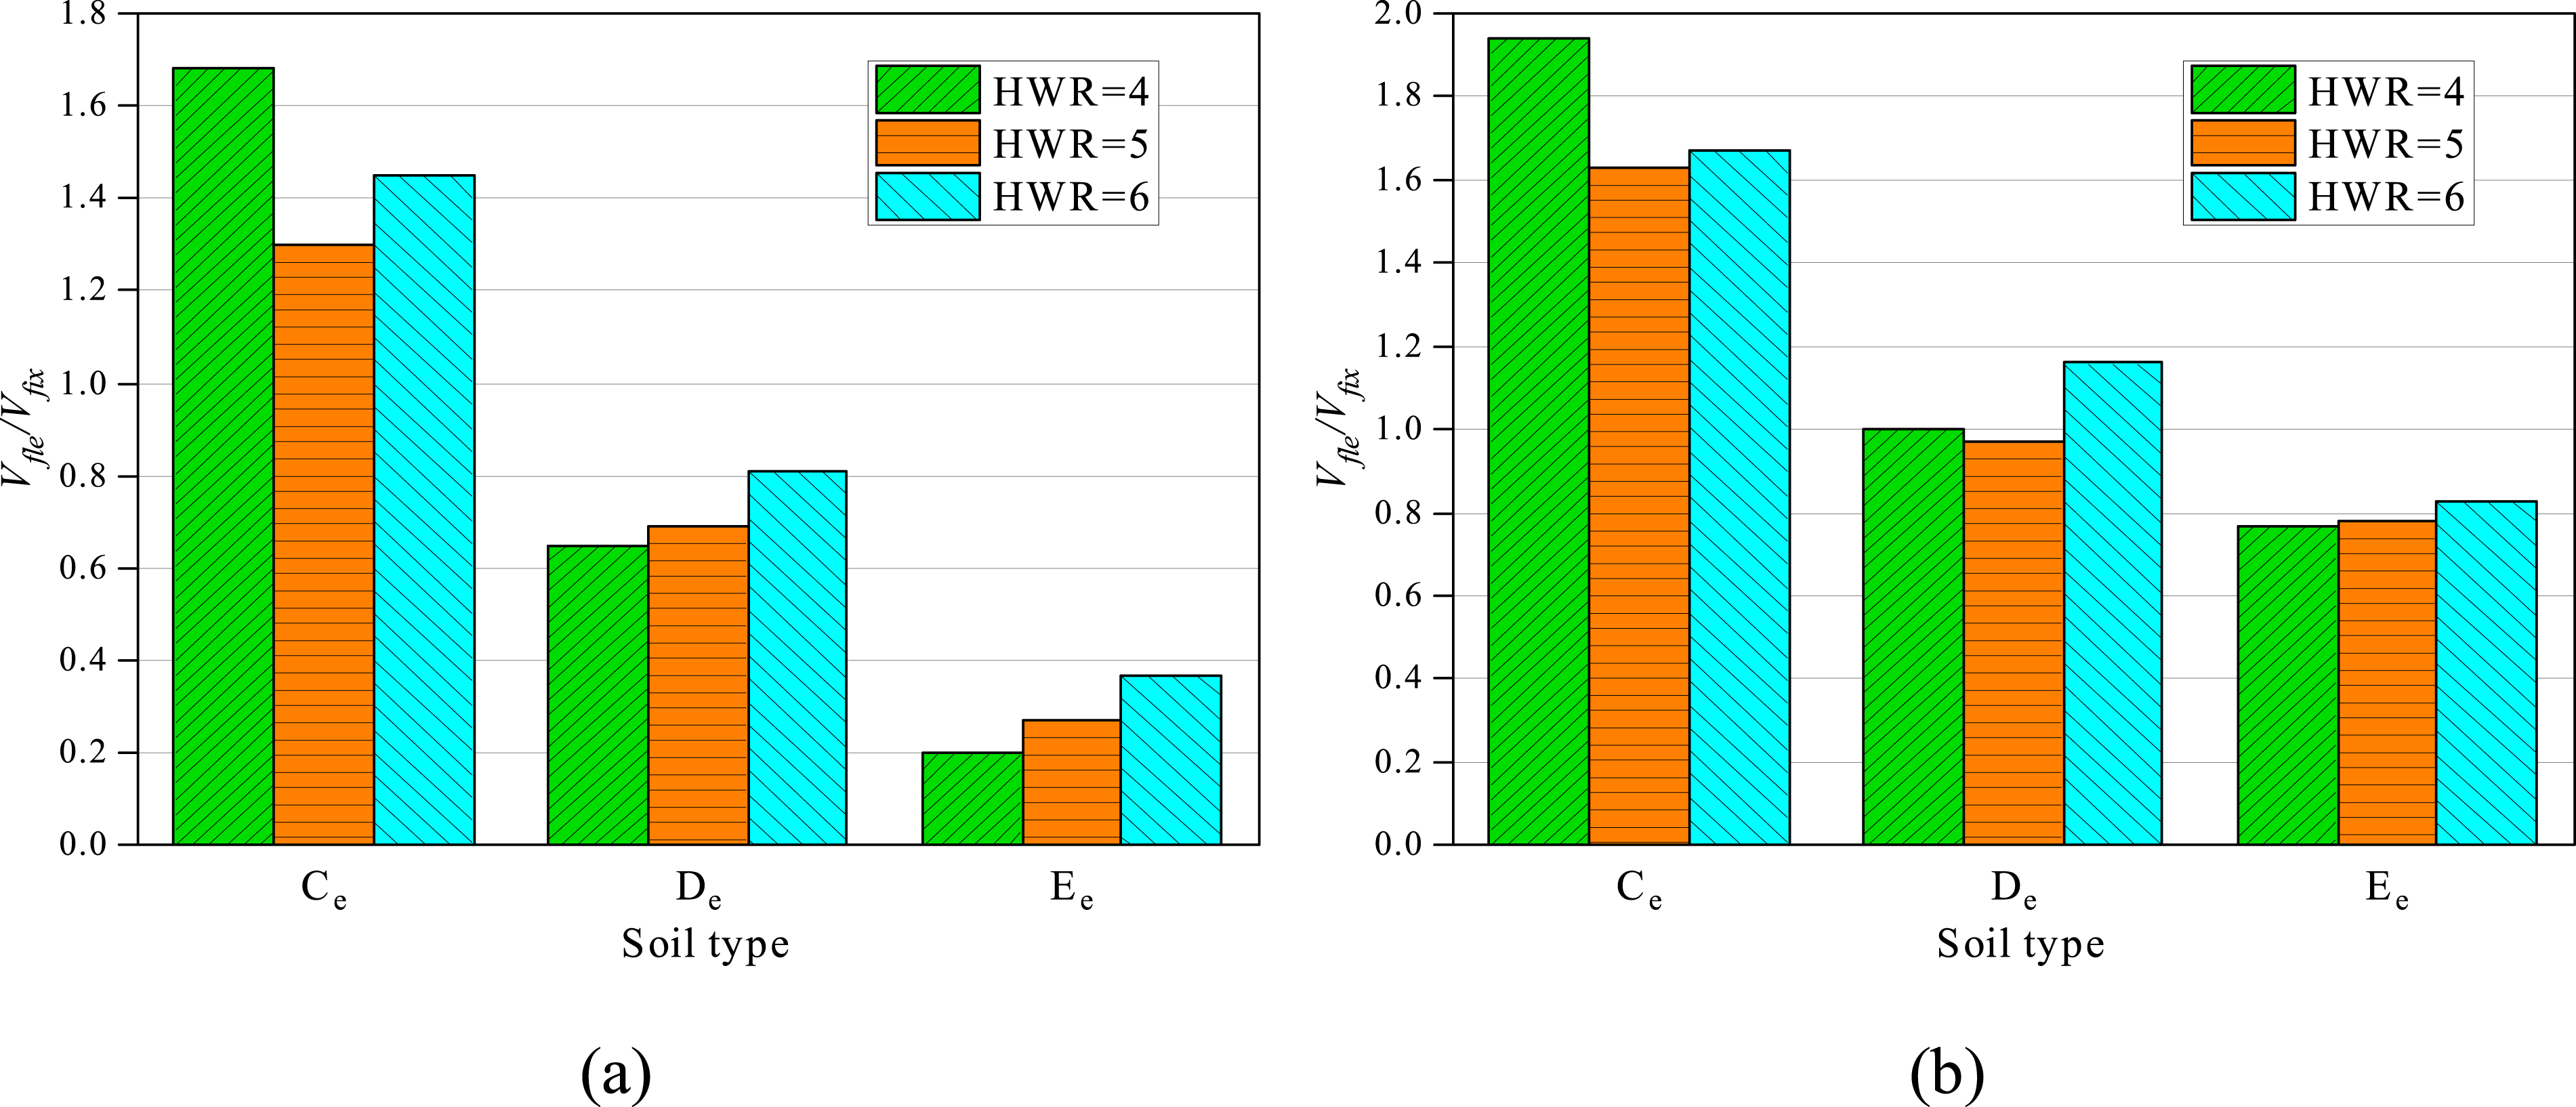
When it comes to piled foundation structures, more seismic energy can be absorbed during an earthquake event (Van Nguyen et al., 2017). This is because piled foundation structures are generally stiffer, and their natural periods are typically shorter than those of compensated foundation structure. Therefore, in the descending portion of the response spectrum, a shorter period implies higher seismic energy input. Moreover, due to soil amplification and the effects of kinematic and inertial interaction, the response spectrum of the foundation input motion also changes compared with free field motion. As a result, the values of V fle /V fix are greater than one in almost all piled foundation cases, which suggests that under the parameters considered here, the seismic demand of frame-core tube structures founded on the piled foundation is amplified after considering SSI. Therefore, for piled foundation structures, the effects of SSI are detrimental in terms of V.
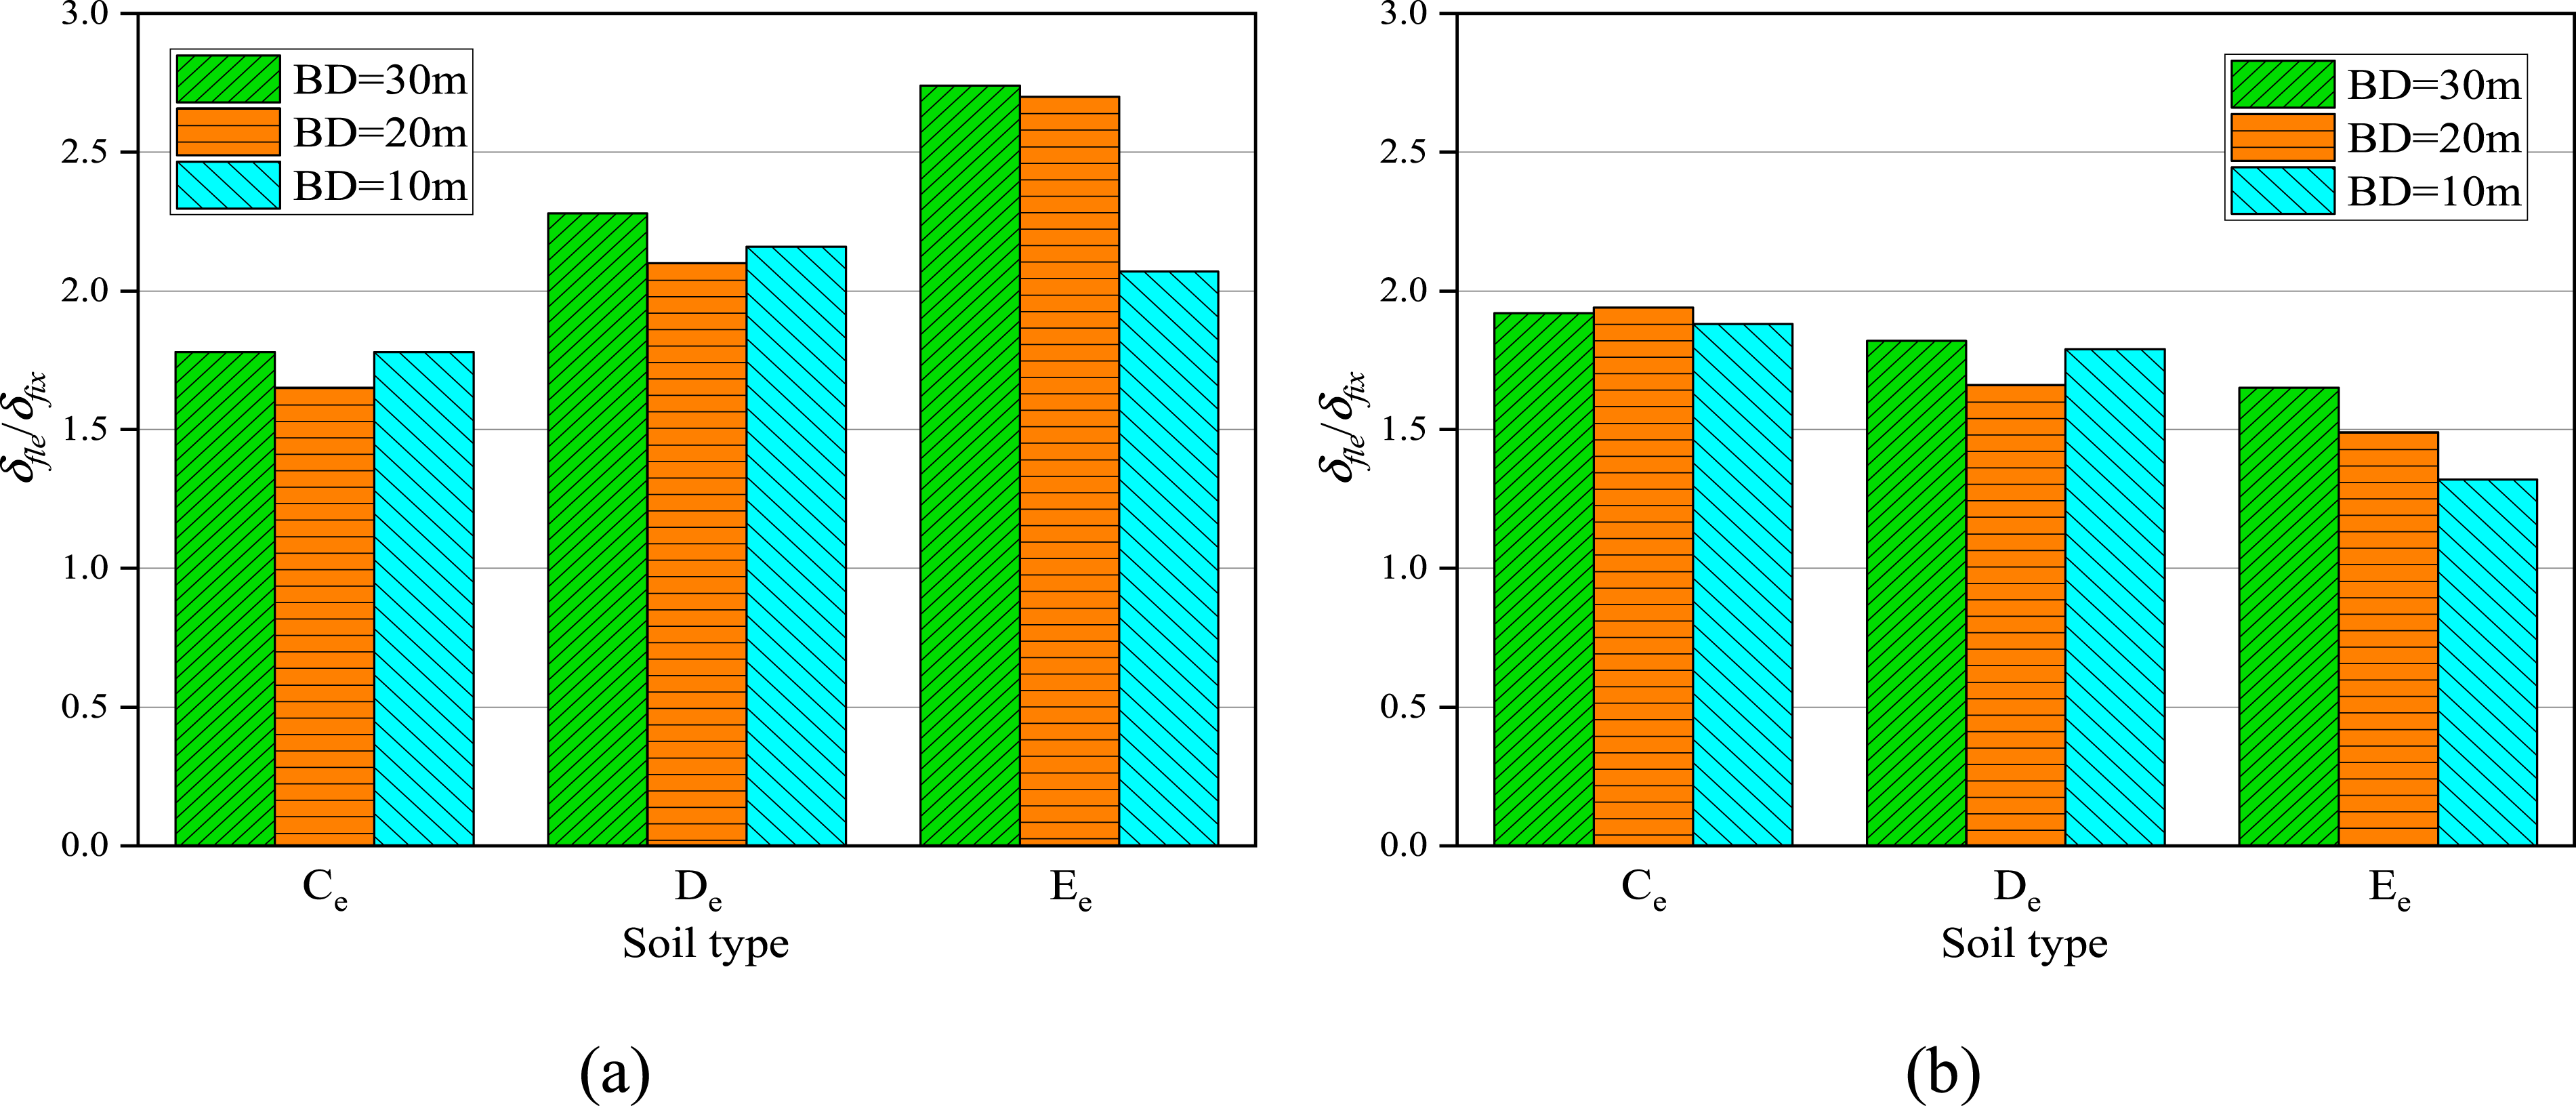
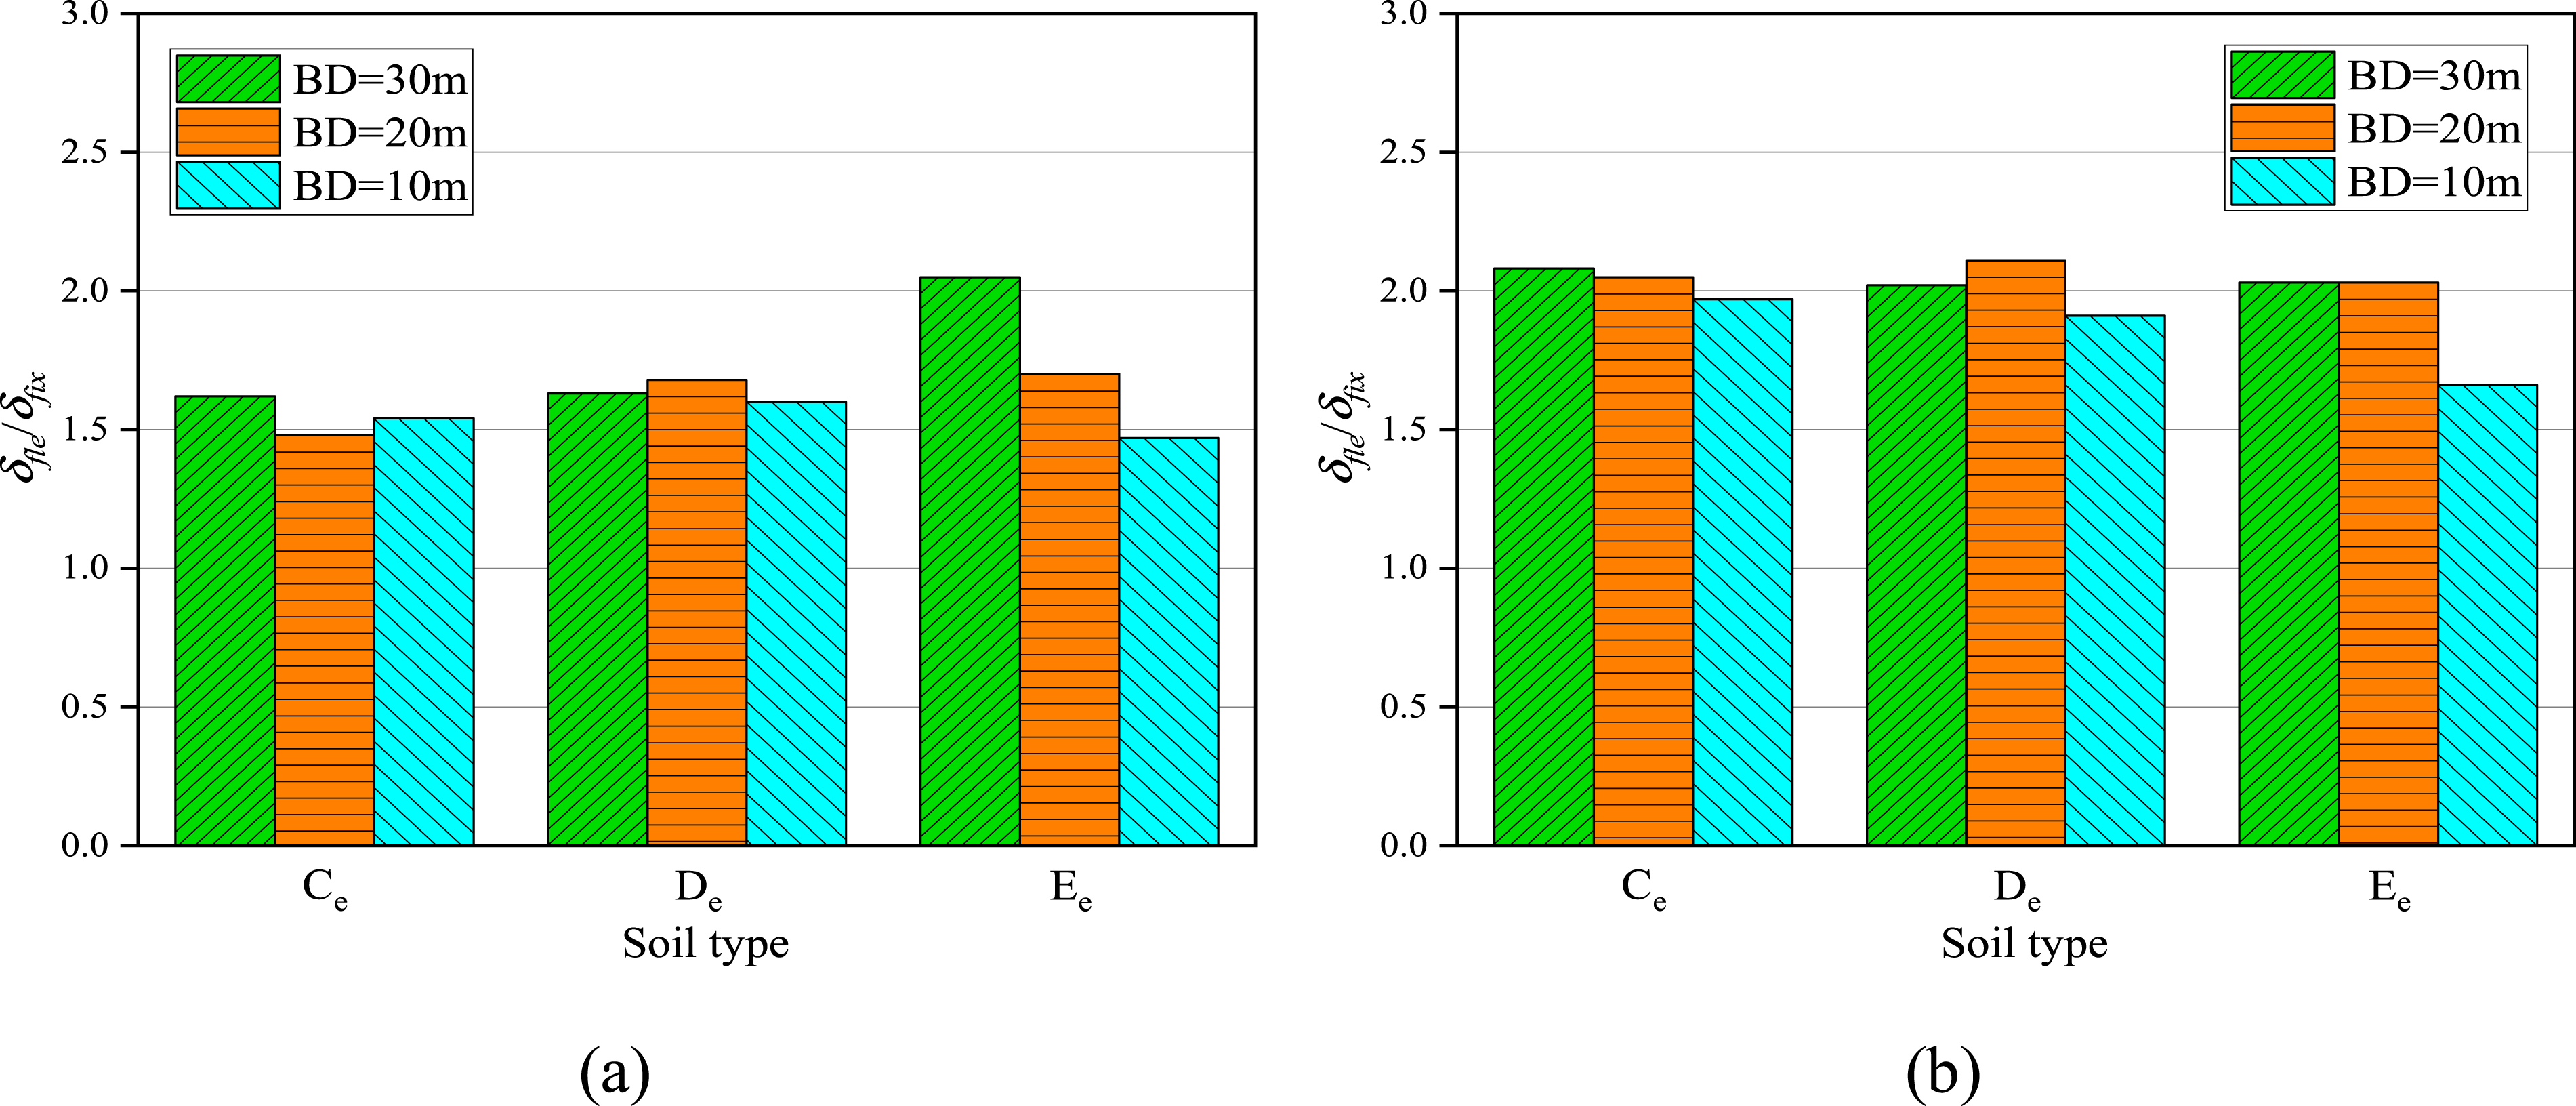
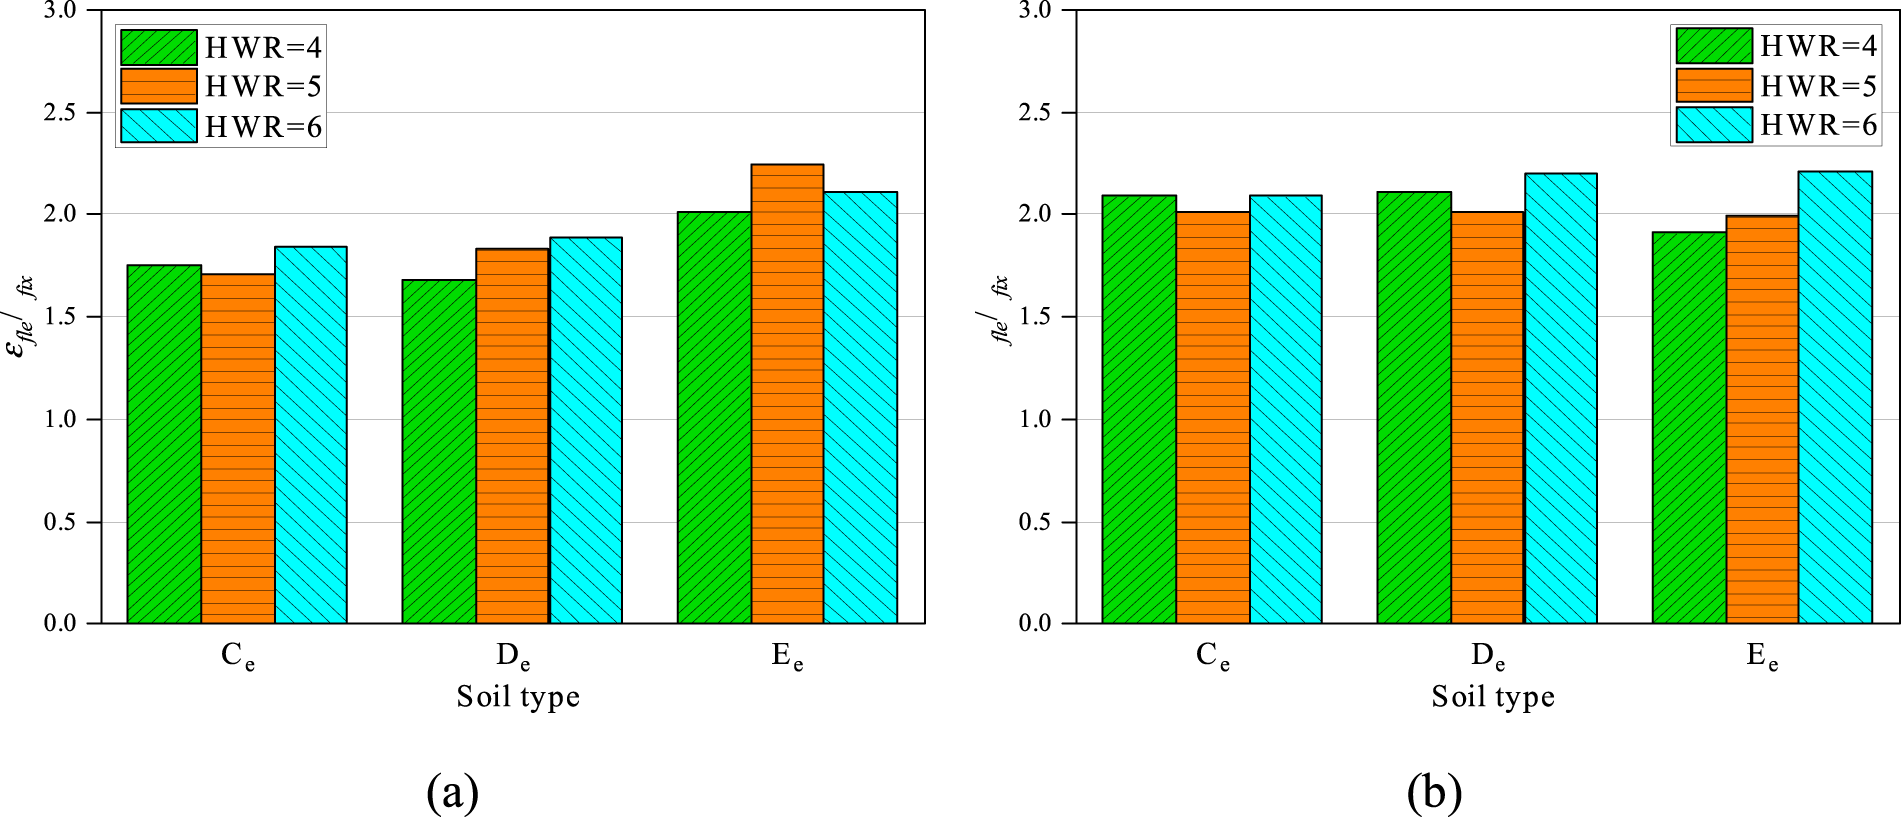
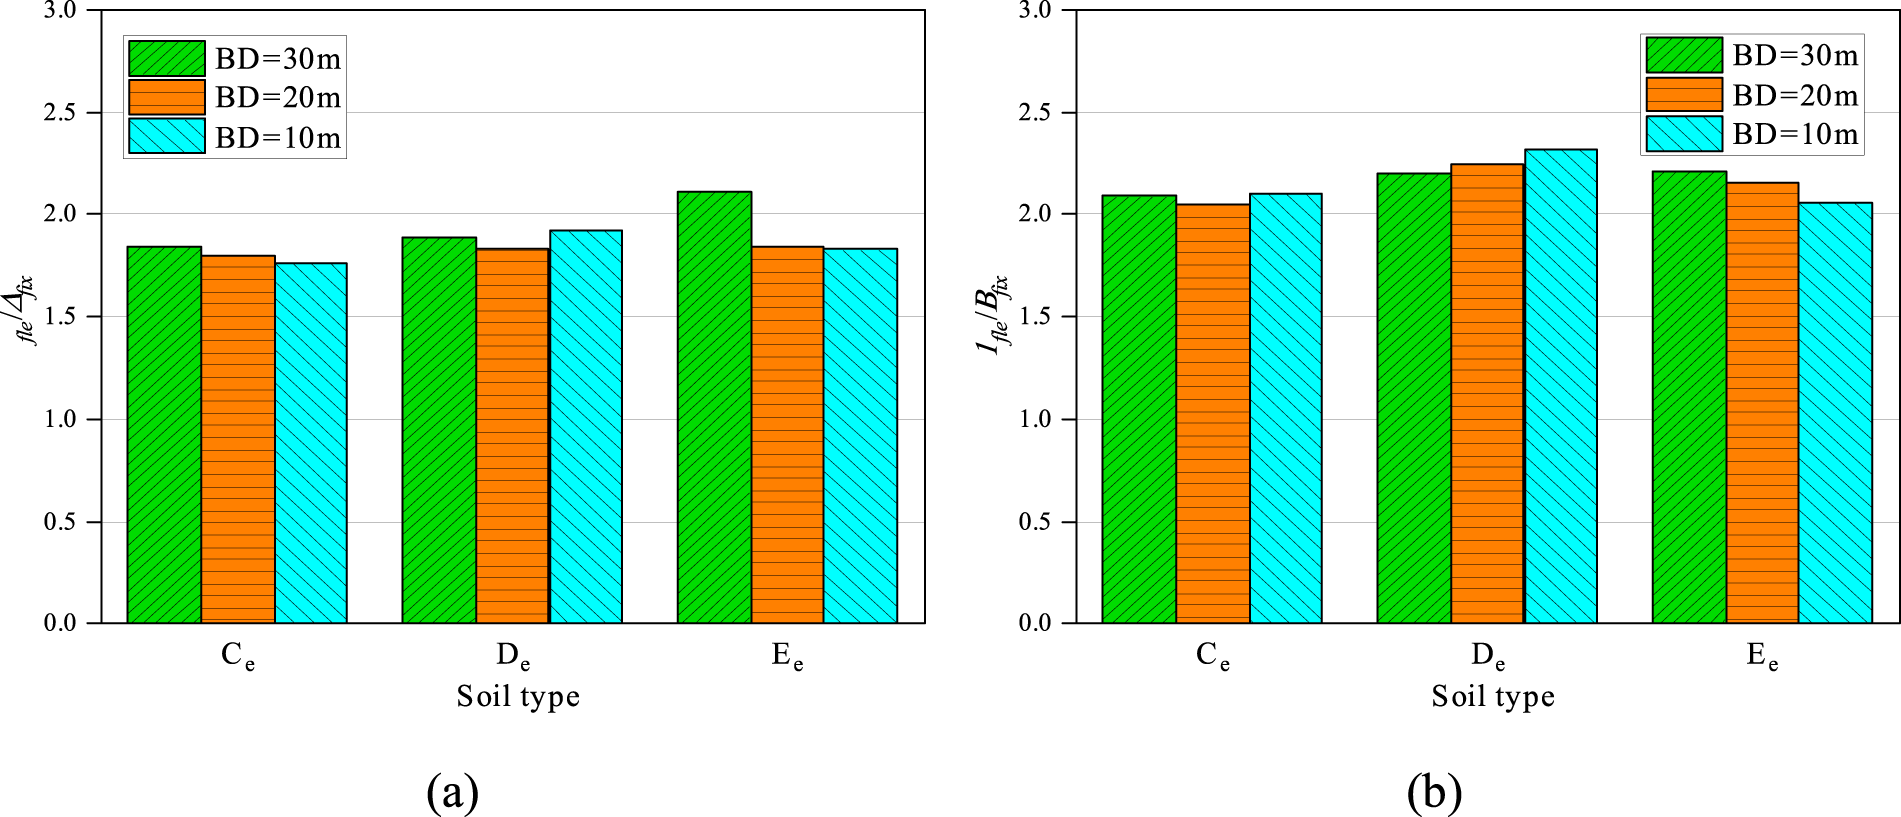
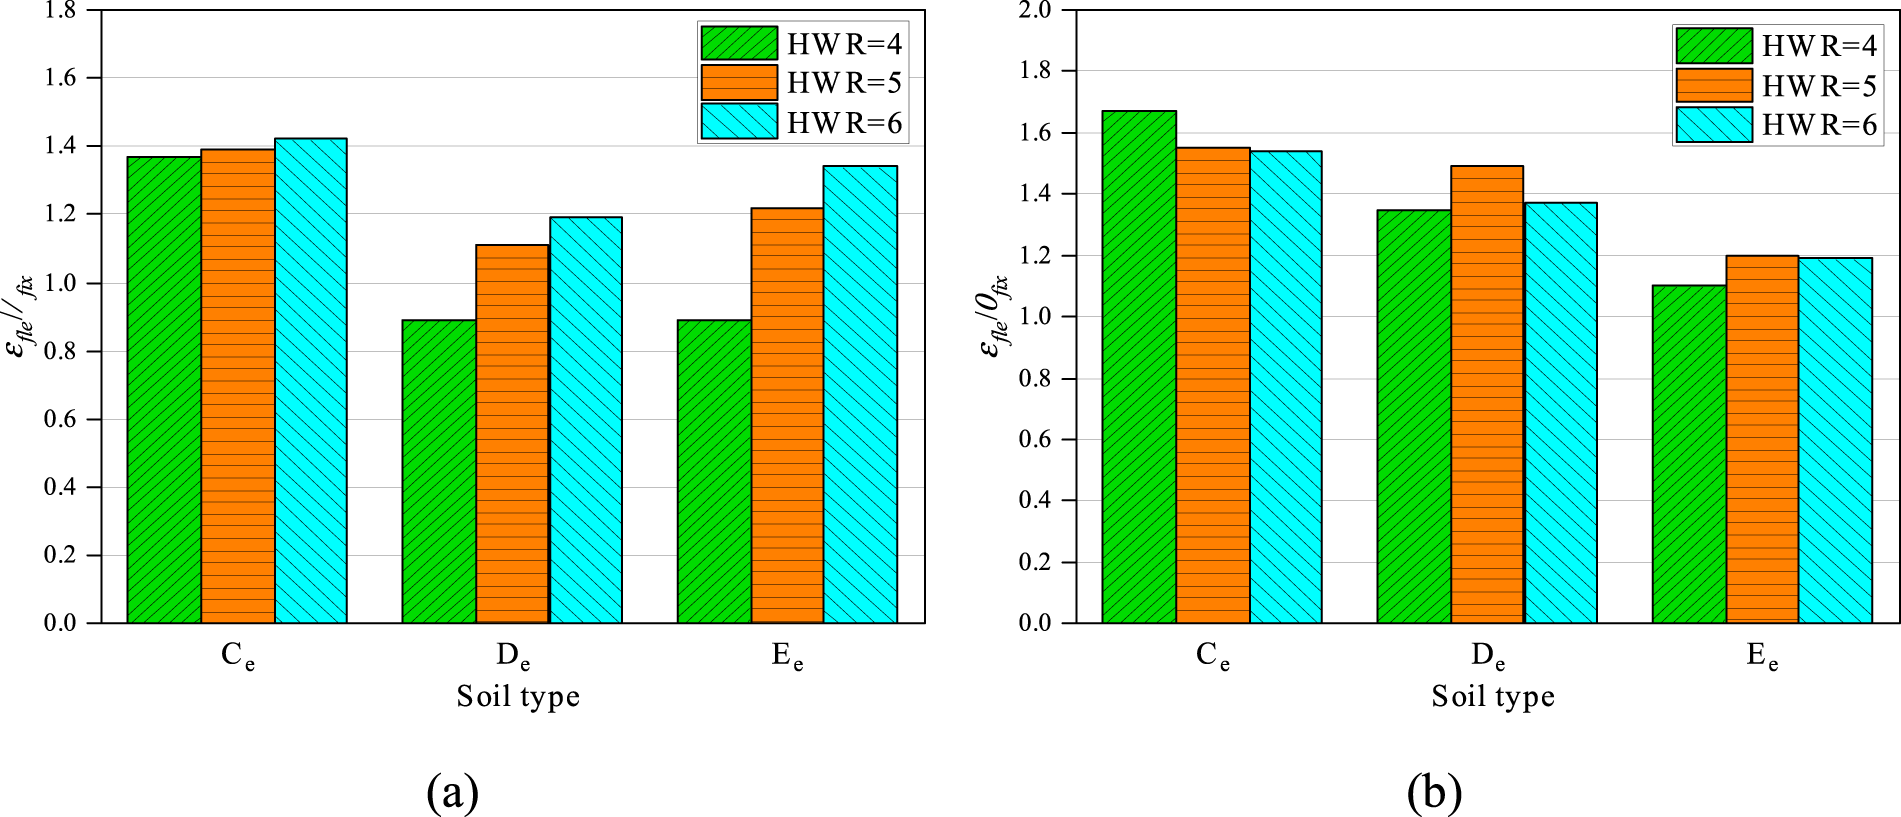
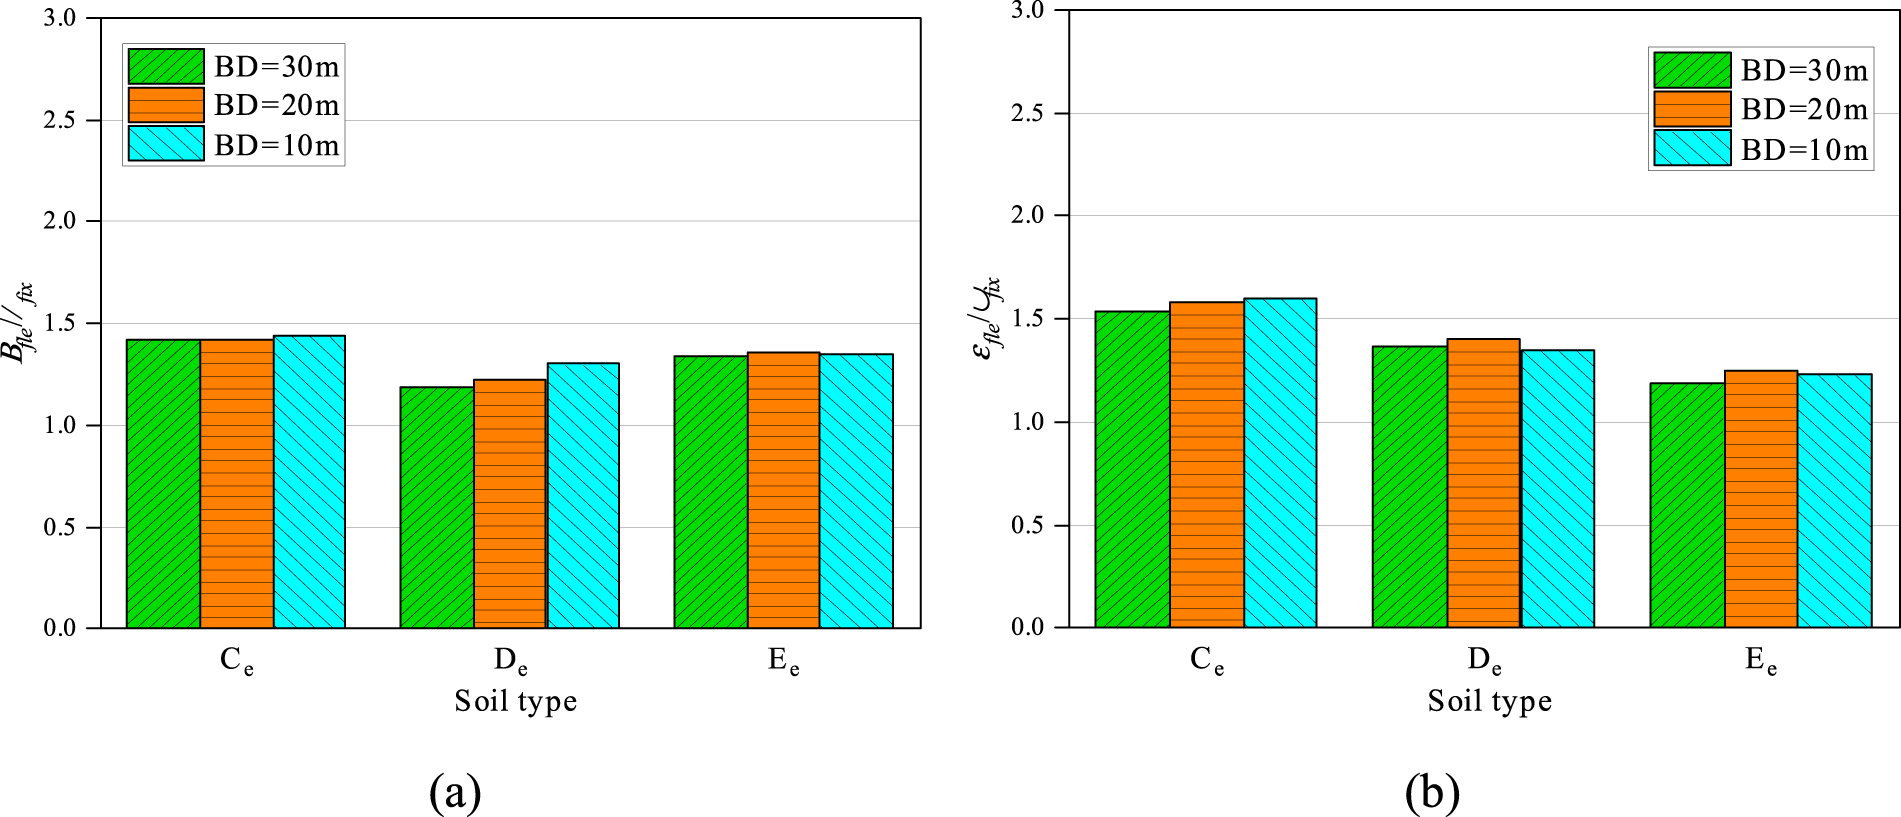
Figures 20–25 show SSI always increases the δ because δ
fle
/δ
fix
is greater than one in almost all cases. Therefore, SSI can alter the performance level of high-rise frame-core tube buildings. In addition, when superstructure and substructure parameters are changed, the influence of SSI on δ
fle
/δ
fix
shows different trends. This is because the stiffness of the substructure has a complex effect on the deformation of the superstructure. On the one hand, as mentioned above, the increased stiffness of the substructure system can attract more seismic energy to deform the superstructure; on the other hand, stiffer ground soil can limit the foundation rocking, thereby reducing the deformation of the superstructure. Thus, the V, δ and foundation rocking should be considered comprehensively. The value of δ
fle
/δ
fix
of 20-storey frame-core tube structures with different HWRs (a) classical compensated foundation structure (b) piled foundation structure. The value of δ
fle
/δ
fix
of 20-storey frame-core tube structures with different BDs (a) classical compensated foundation structure (b) piled foundation structure. The value of δ
fle
/δ
fix
of 30-storey frame-core tube structures with different HWRs (a) classical compensated foundation structure (b) piled foundation structure. The value of δ
fle
/δ
fix
of 30-storey frame-core tube structures with different BDs (a) classical compensated foundation structure (b) piled foundation structure. The value of δ
fle
/δ
fix
of 40-storey frame-core tube structures with different HWRs (a) classical compensated foundation structure (b) piled foundation structure. The value of δ
fle
/δ
fix
of 40-storey frame-core tube structures with different BDs (a) classical compensated foundation structure (b) piled foundation structure.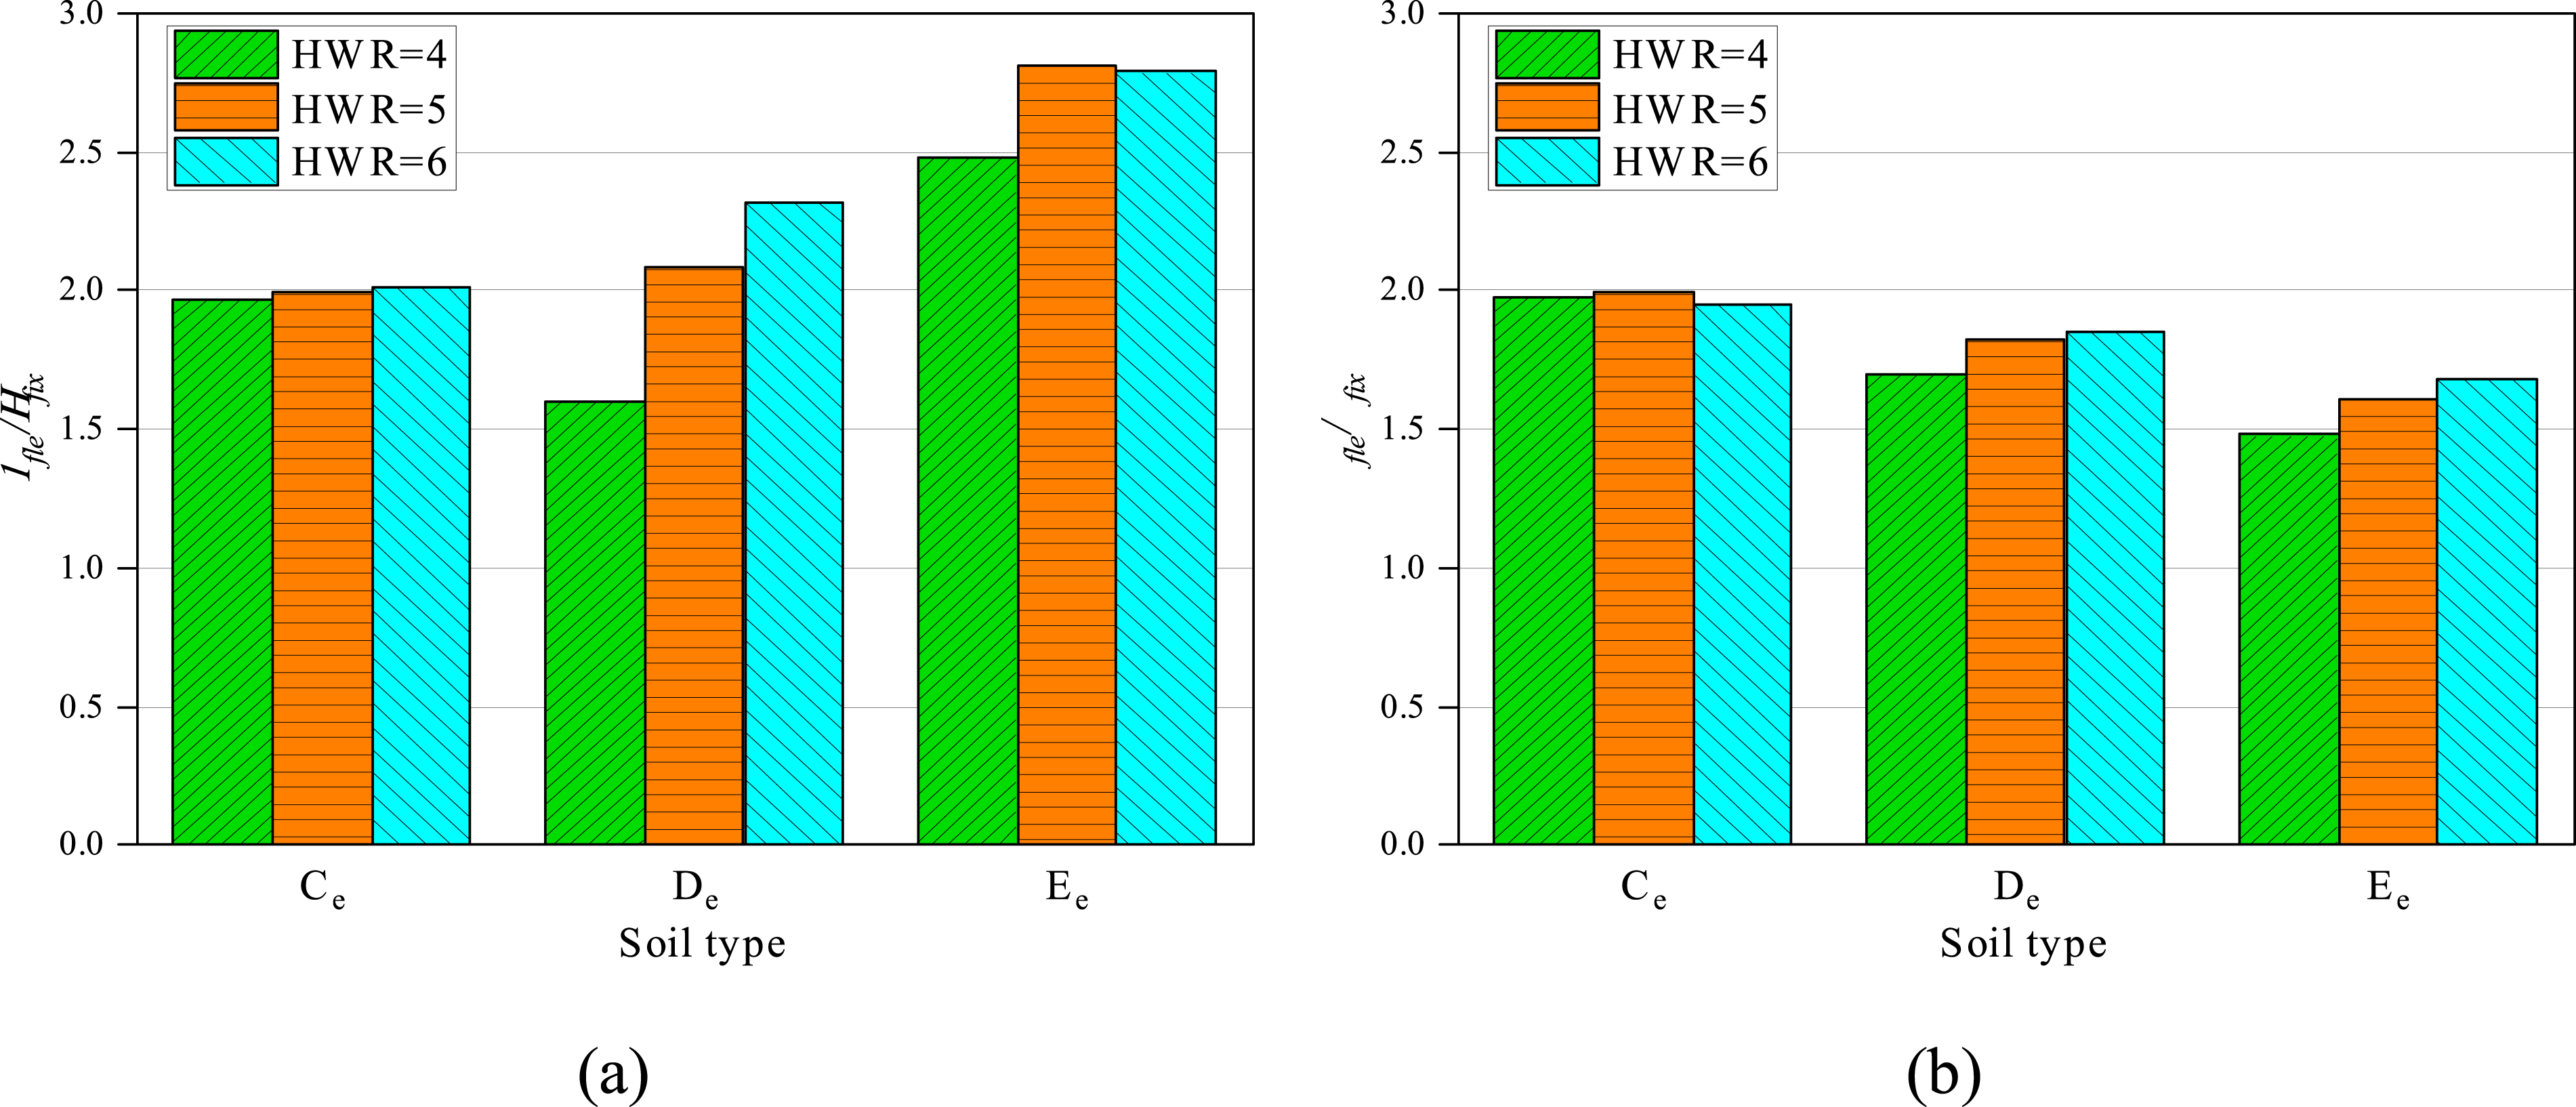
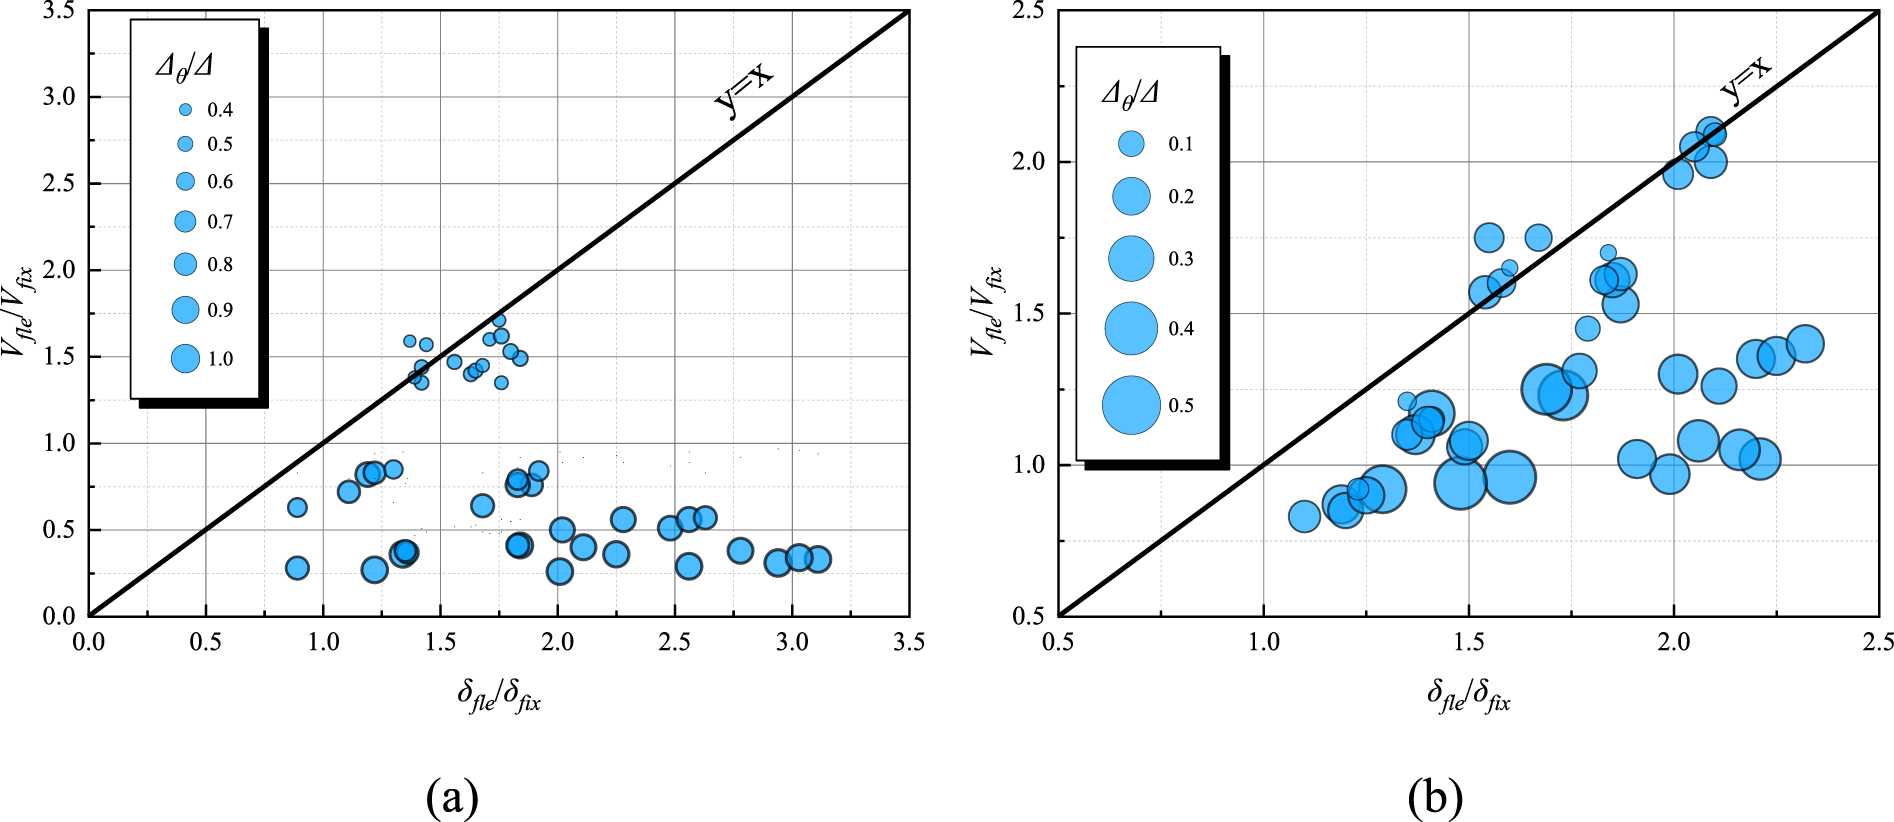
According to Wolf (1985) and Kramer (1996), Δ consists of rocking (Δ θ ) and distortion components (Δ d ). In this study, proportions of lateral deflection caused by foundation rocking (Δ θ /Δ) are adopted to reflect the significance of the foundation rocking under seismic events. In order to obtain this value under different parameters, firstly, the moment when the Δ occurred is recorded (Hokmabadi et al., 2012). After that, the Δ θ is calculated by multiplying the height of the structure by the foundation rocking angle at this moment. Finally, the ratio Δ θ /Δ can be calculated.
Figure 26 illustrates the relationship between δ
fle
/δ
fix
, V
fle
/V
fix
and Δ
θ
/Δ of models with different superstructure and substructure parameters. When the subsoil is stiff enough and the values of Δ
θ
/Δ are small (less than 0.5 for classical compensated foundation structures and less than 0.15 for piled foundation structures), the data points are basically distributed around the y=x line. It indicates that the amplification coefficient for the V is almost equal to the amplification coefficient for the δ after considering SSI. Nevertheless, as soil stiffness decreases and the values of Δ
θ
/Δ become larger, the data points begin to deviate from the y=x line and shift downward to the right, indicating that the increase of the value of Δ
θ
/Δ tends to amplify the δ and reduce the V of frame-core tube structures. The relationship between δ
fle
/δ
fix
, V
fle
/V
fix
and Δ
θ
/Δ of frame-core tube structures (a) classical compensated foundation structure (b) piled foundation structure.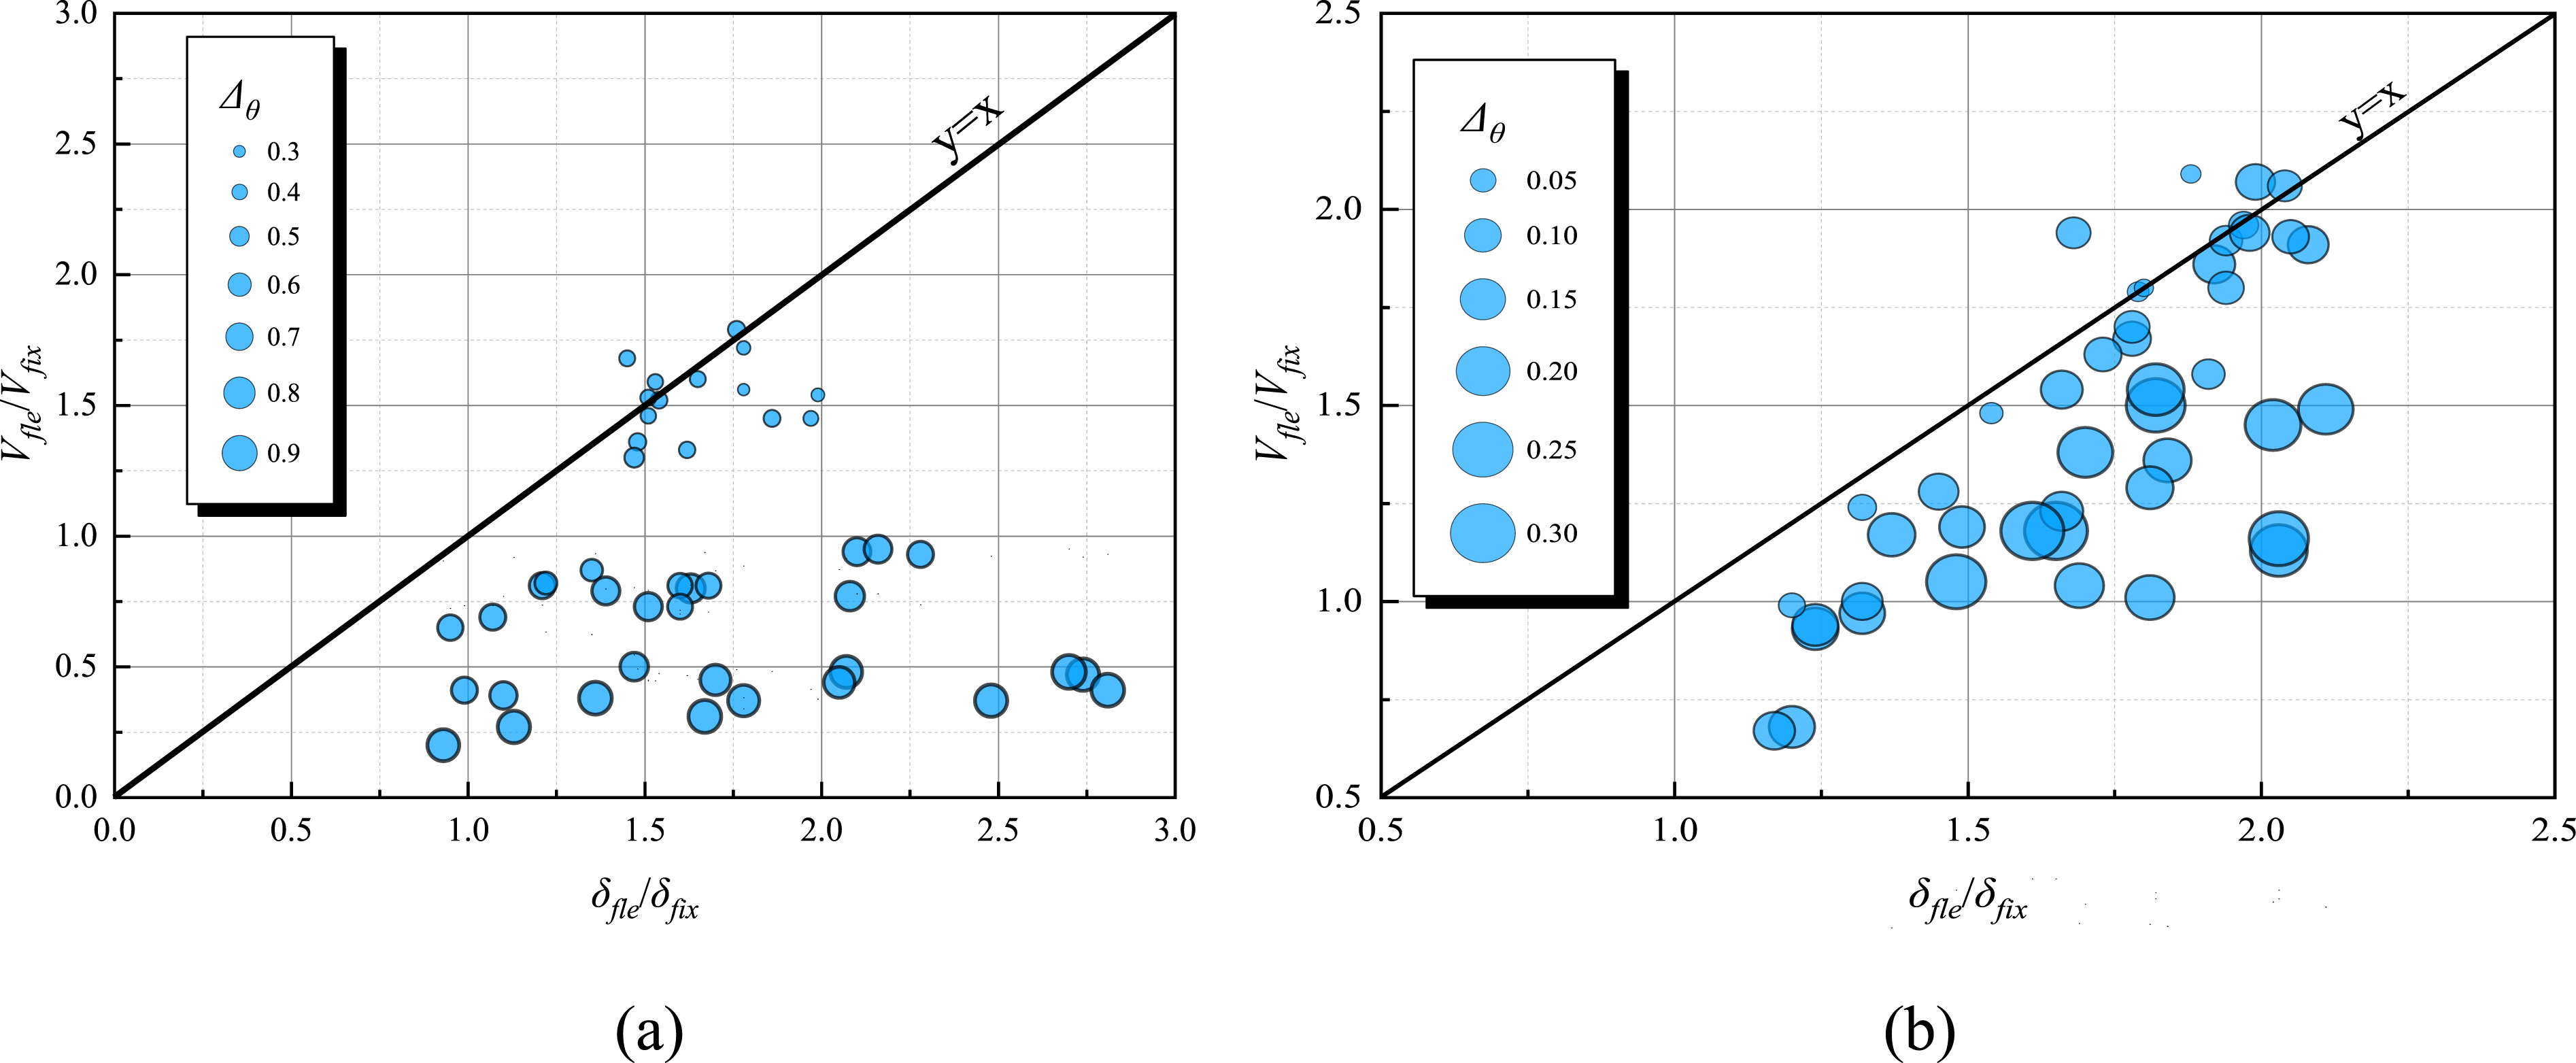
In addition, Figure 26 also reveals that almost all data points of the pile foundation model lie in the range of δ fle /δ fix > 1, V fle /V fix >1, indicating that no matter how the model parameters change, the SSI has detrimental effects; however, for the classical compensated foundation model, structures with De and Ee soil types are below the V fle /V fix =1 line, indicating that the SSI has a beneficial effect, it can reduce the V of the superstructure, even if the δ are still amplified.
From the above analysis, SSI has detrimental effects on δ, and its effect on V is determined by foundation type and subsoil stiffness. However, as mentioned in the introduction section, previous studies are mainly focusing on the amplification of δ and neglecting the impact of SSI on the V, because most previous papers concluded SSI can reduce the V of the superstructure. For example, Tabatabaiefar et al. (2014b) developed an empirical formula to predict the value of δ fle /δ fix and assess the performance level of buildings. Similarly, this study will summarise the effects of SSI on the V and develop a simple and accurate procedure to estimate the value of V fle /V fix .
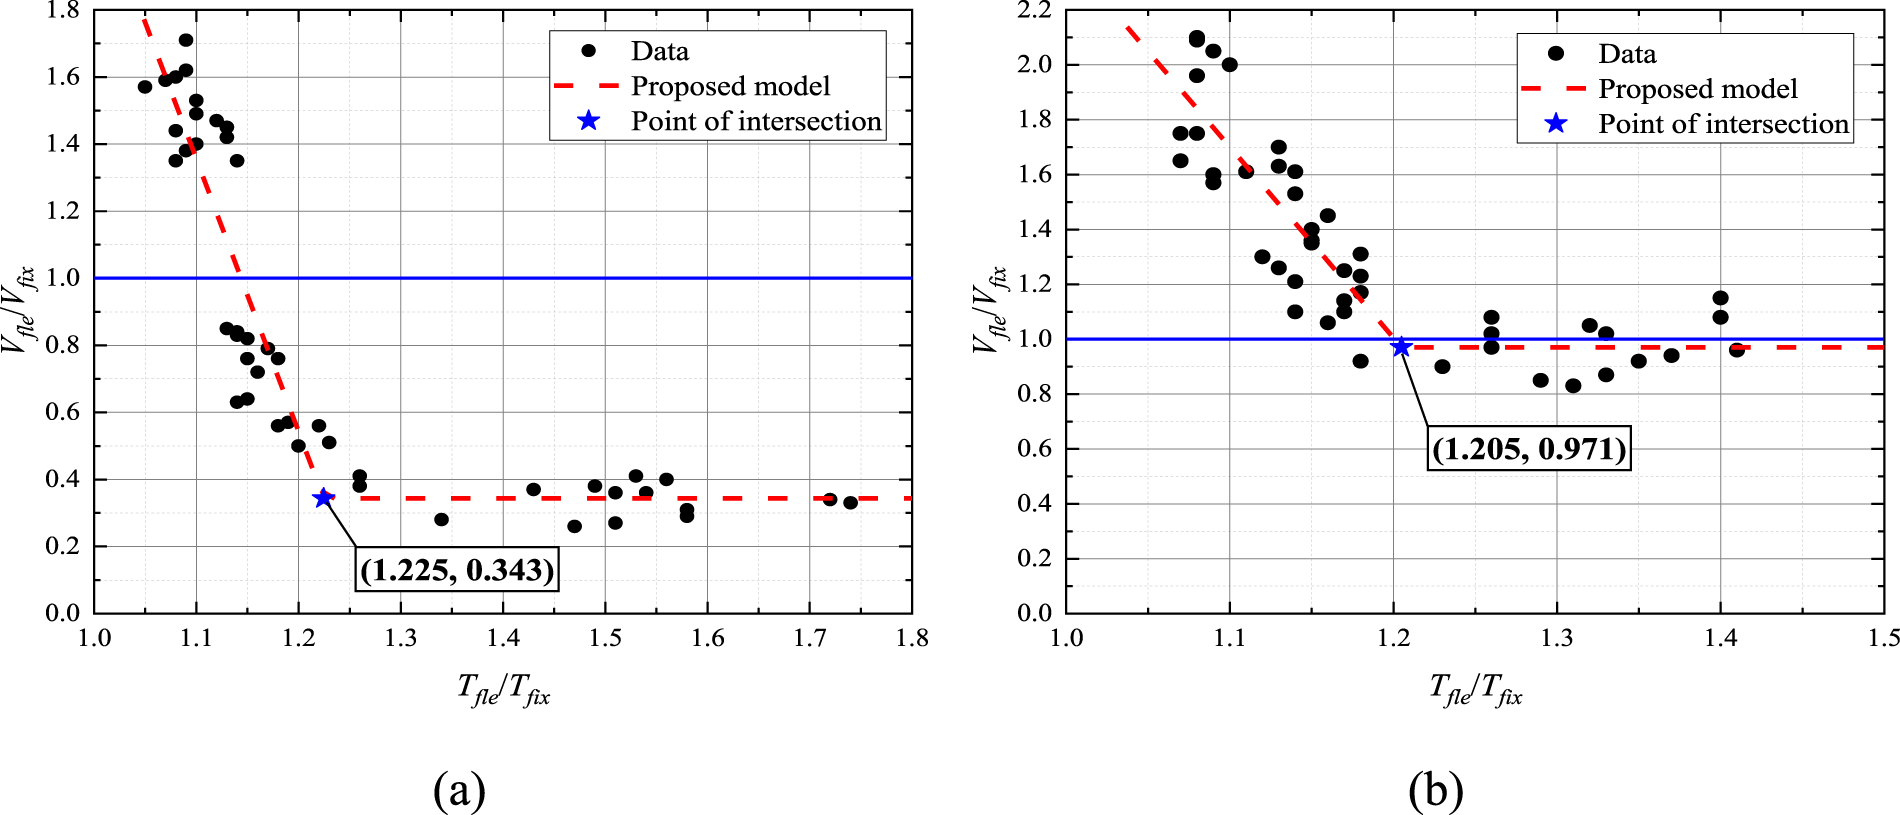
Figure 27 shows the relationship between T
fle
/T
fix
and V
fle
/V
fix
. T is the natural period of vibration of the system. With the substructure stiffness decreasing and the T
fle
/T
fix
increasing, V
fle
/V
fix
decreases linearly. But after reaching a certain level, the value of V
fle
/V
fix
remains stable and no longer decreases. For the classical compensated foundation structure, the value of V
fle
/V
fix
does not decrease after reaching 0.395, while for the piled foundation structure, this value is 1.046. Therefore, current seismic codes may determine whether the V should be reduced and specify different minimum values of reduced shear force depending on the type of foundation. The relationship between T
fle
/T
fix
and V
fle
/V
fix
of frame-core tube structures (a) classical compensated foundation structure (b) piled foundation structure.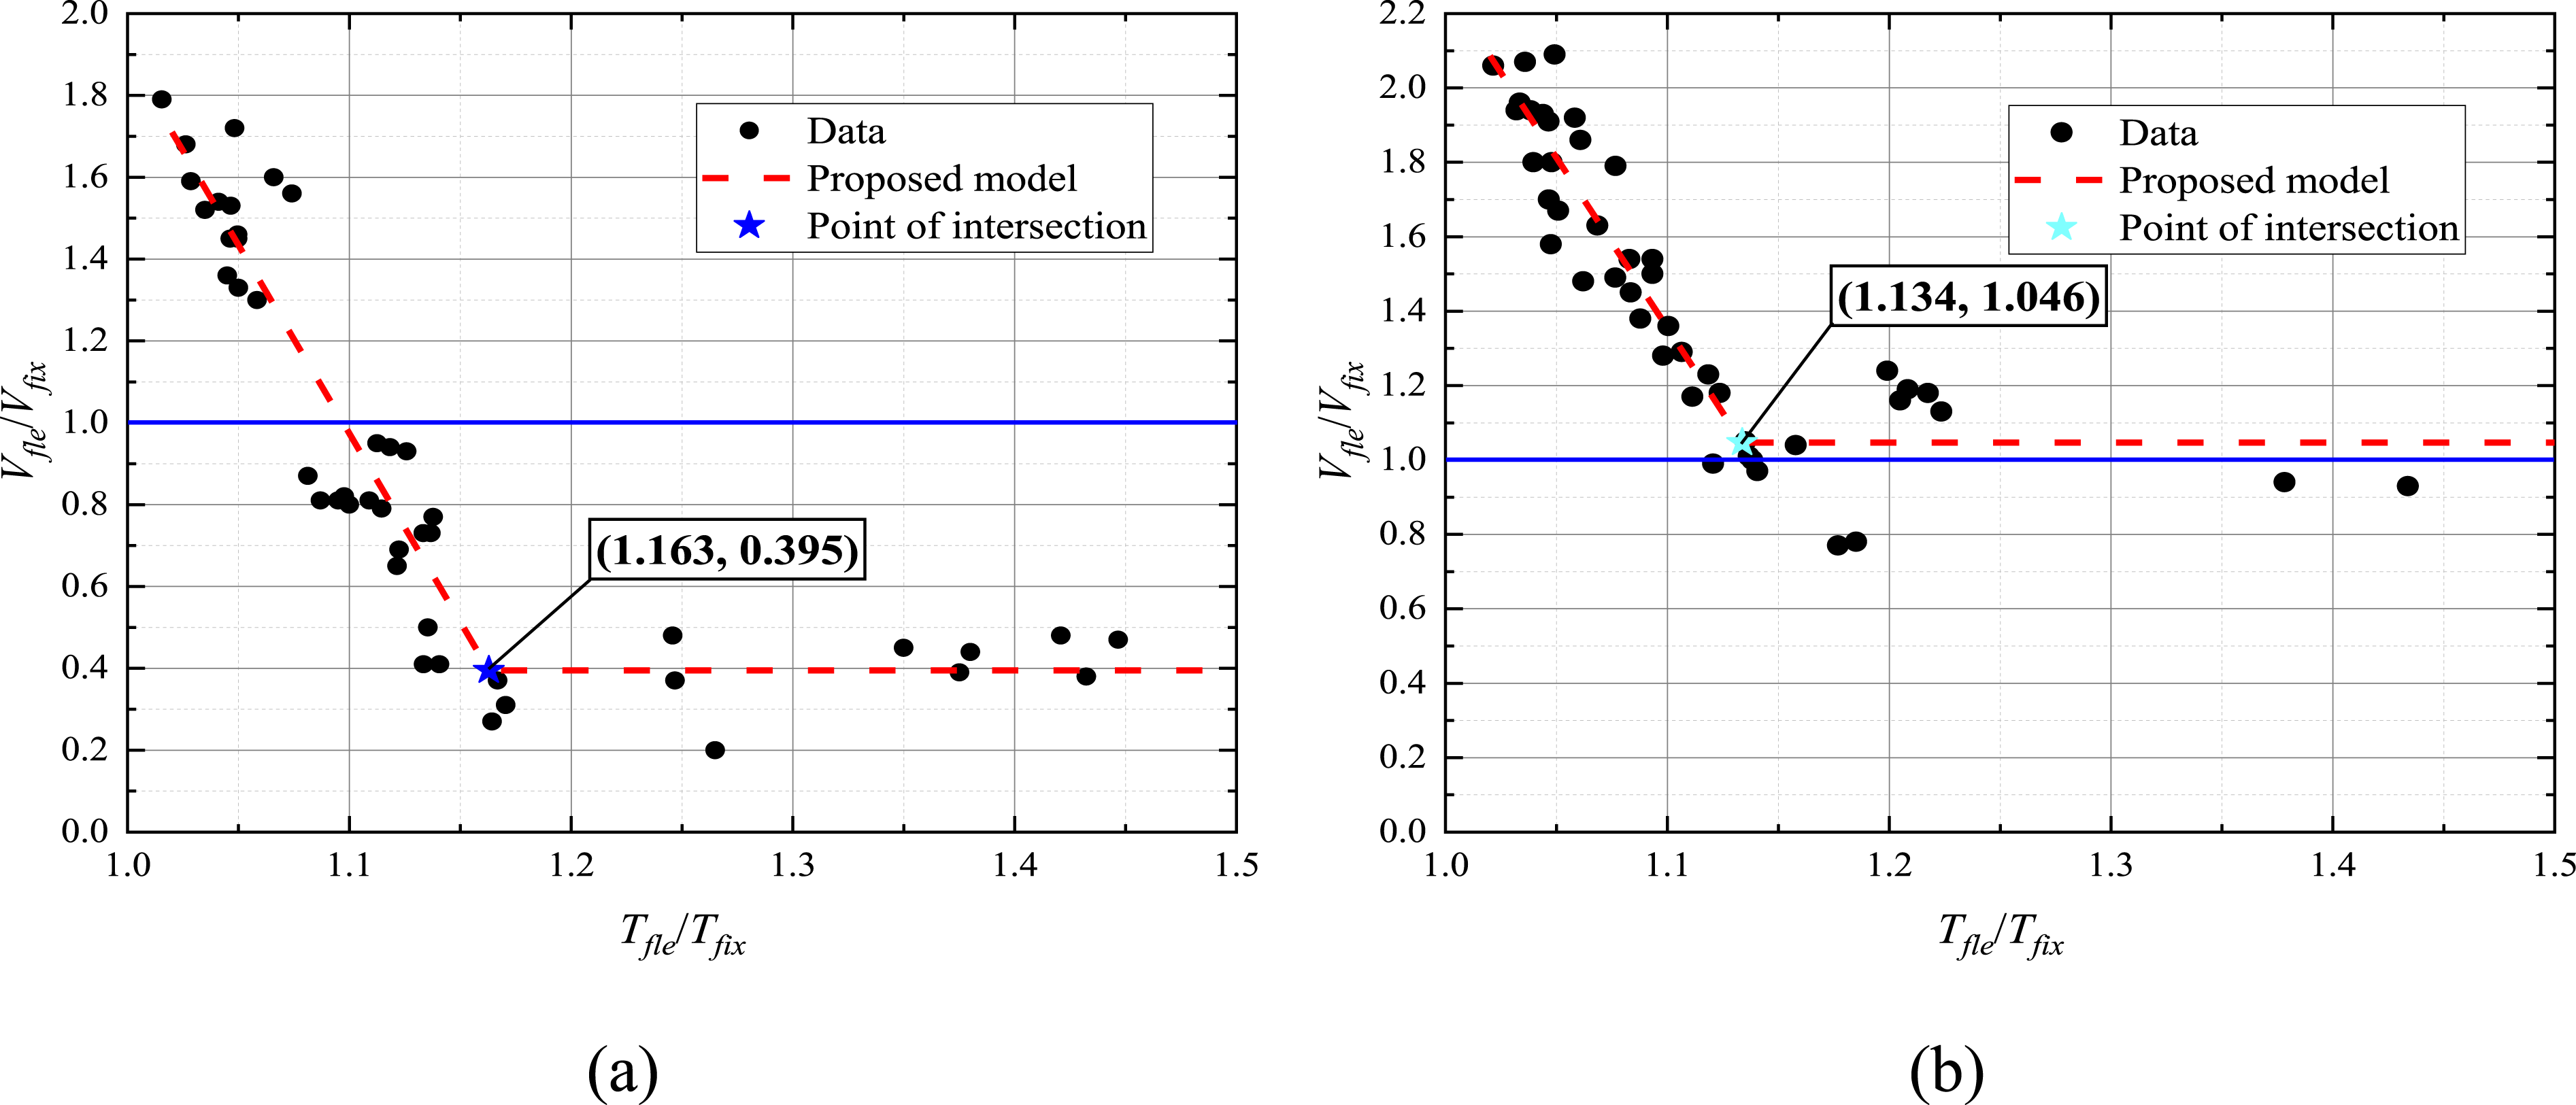
Moreover, straight line fittings were also performed on the descending sections in Figure 27. The fitting results of the classical compensated foundation structure (Equation (4)) and piled foundation structure (Equation (5)) are as follows, respectively:

The linear correlation coefficients r = −0.9111 and −0.8811 respectively, indicating the two variables are highly negatively correlated. Therefore, in the structural design process, the designer can easily obtain the value of V fle of frame-core tube structures by calculating the V fix and T fle /T fix , without carrying out time-consuming numerical calculations. In addition, many previous studies have proposed empirical formulas to calculate T fle , which can be found in Balkaya et al. (2012) and Renzi et al. (2013).
Effects of parameters on frame-shear wall structures
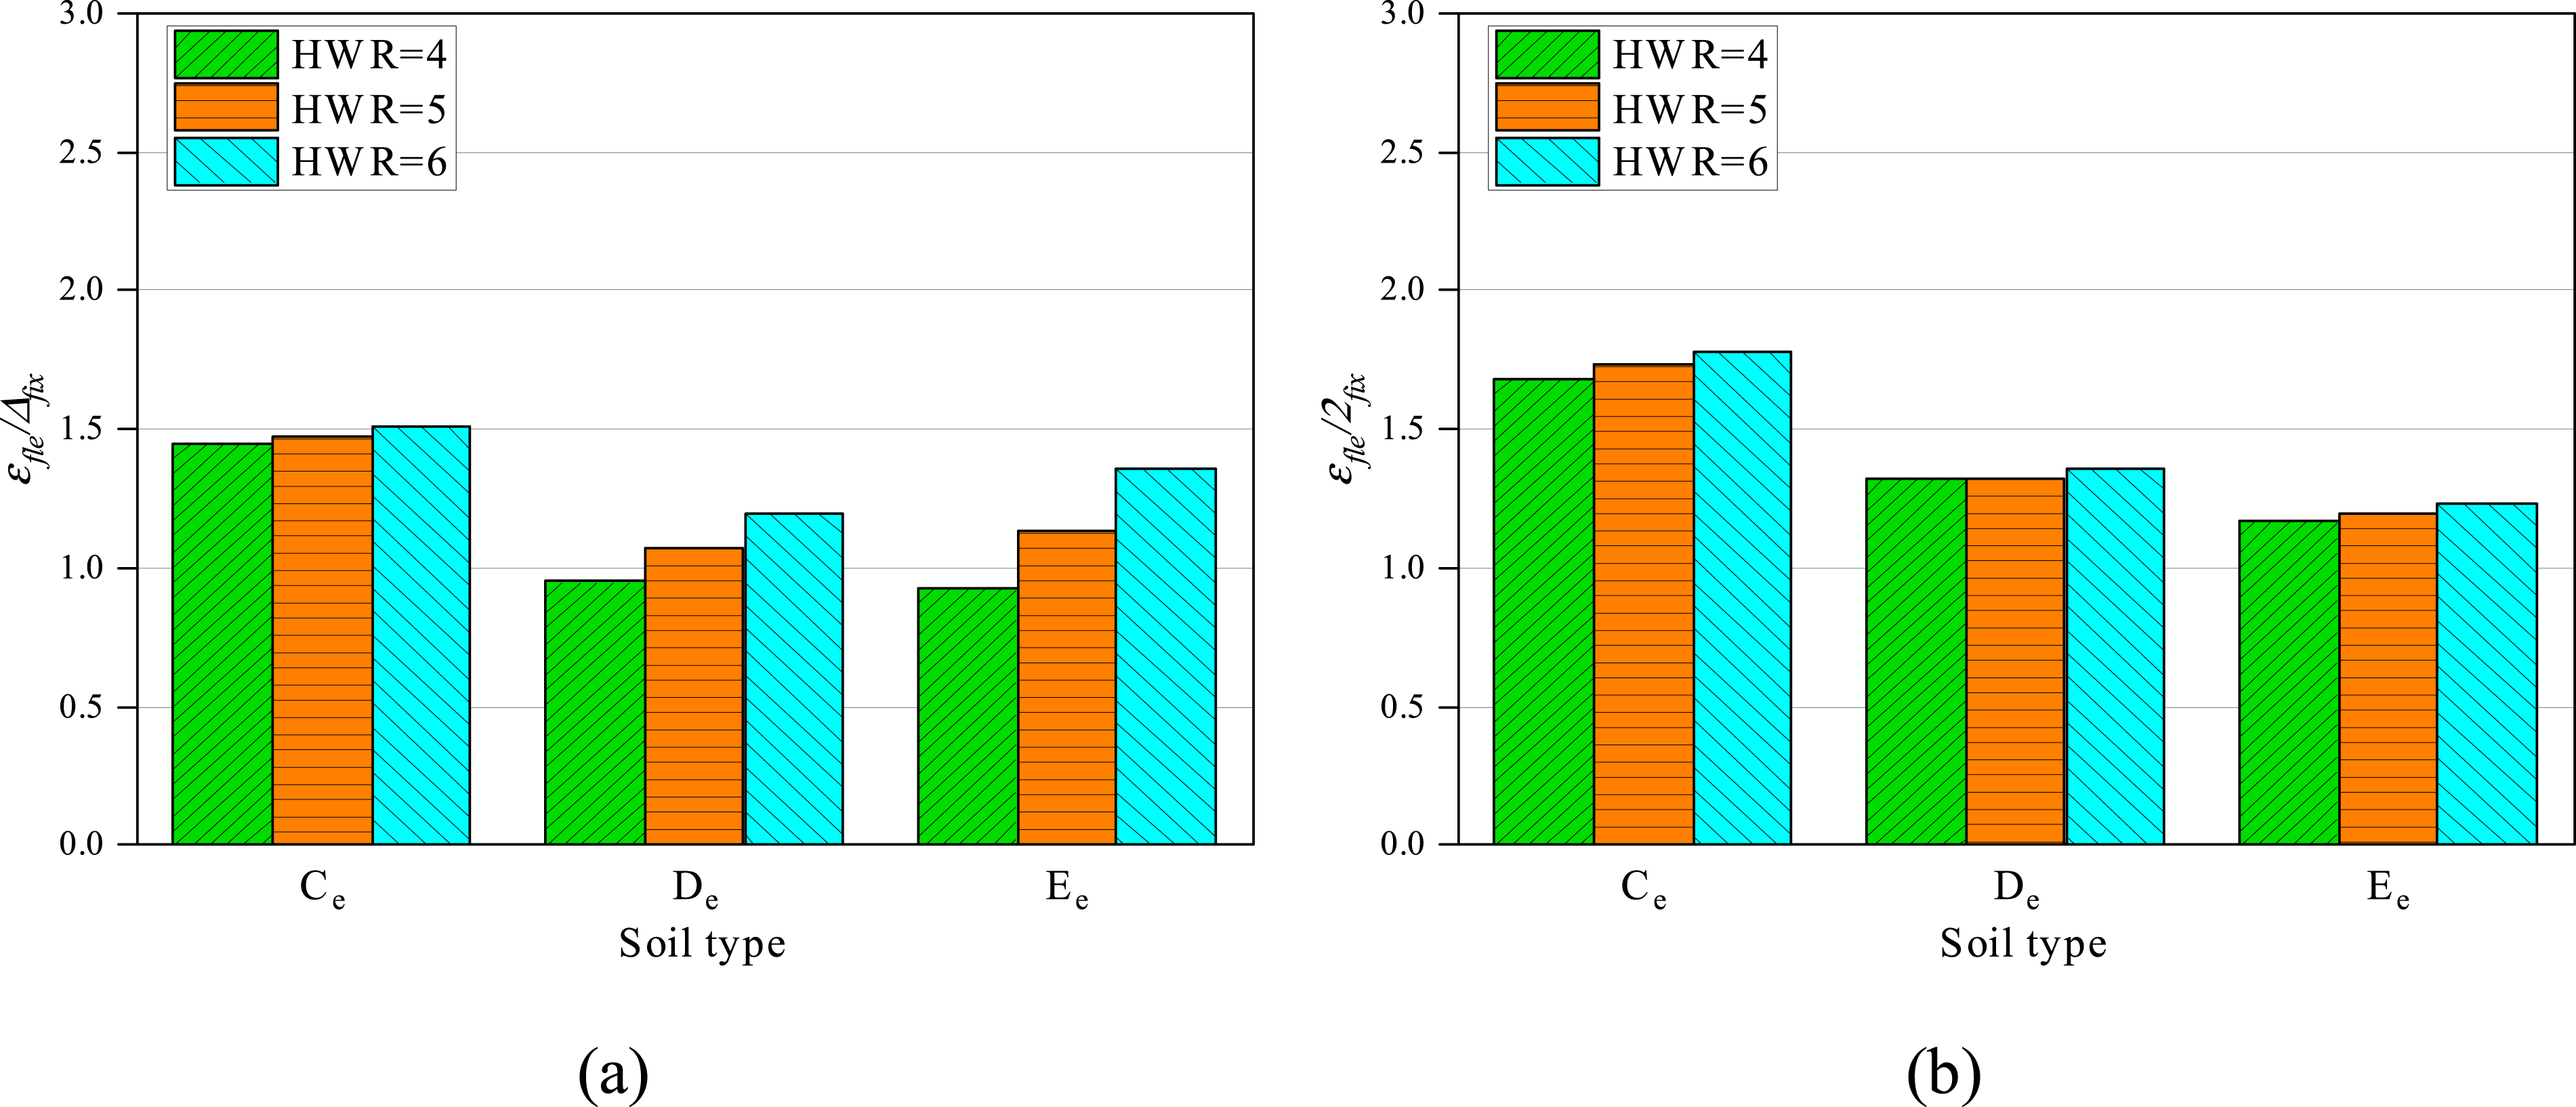
The value of V
fle
/V
fix
of frame-shear wall structures with different superstructure and substructure parameters are shown in Figures 28–33. Similar to the frame-core tube structure, the values of V
fle
/V
fix
increase dramatically with the increase of soil stiffness, and the effects of HWR and BD are much smaller. Moreover, under the conditions of the same foundation and subsoil types, the impact of SSI on the frame-shear wall structures is almost the same as the frame-core tube structure. The value of V
fle
/V
fix
of 20-storey frame-shear wall structures with different HWRs (a) classical compensated foundation structure (b) piled foundation structure. The value of V
fle
/V
fix
of 20-storey frame-shear wall structures with different BDs (a) classical compensated foundation structure (b) piled foundation structure. The value of V
fle
/V
fix
of 30-storey frame-shear wall structures with different HWRs (a) classical compensated foundation structure (b) piled foundation structure. The value of V
fle
/V
fix
of 30-storey frame-shear wall structures with different BDs (a) classical compensated foundation structure (b) piled foundation structure. The value of V
fle
/V
fix
of 40-storey frame-shear wall structures with different HWRs (a) classical compensated foundation structure (b) piled foundation structure. The value of V
fle
/V
fix
of 40-storey frame-shear wall structures with different BDs (a) classical compensated foundation structure (b) piled foundation structure.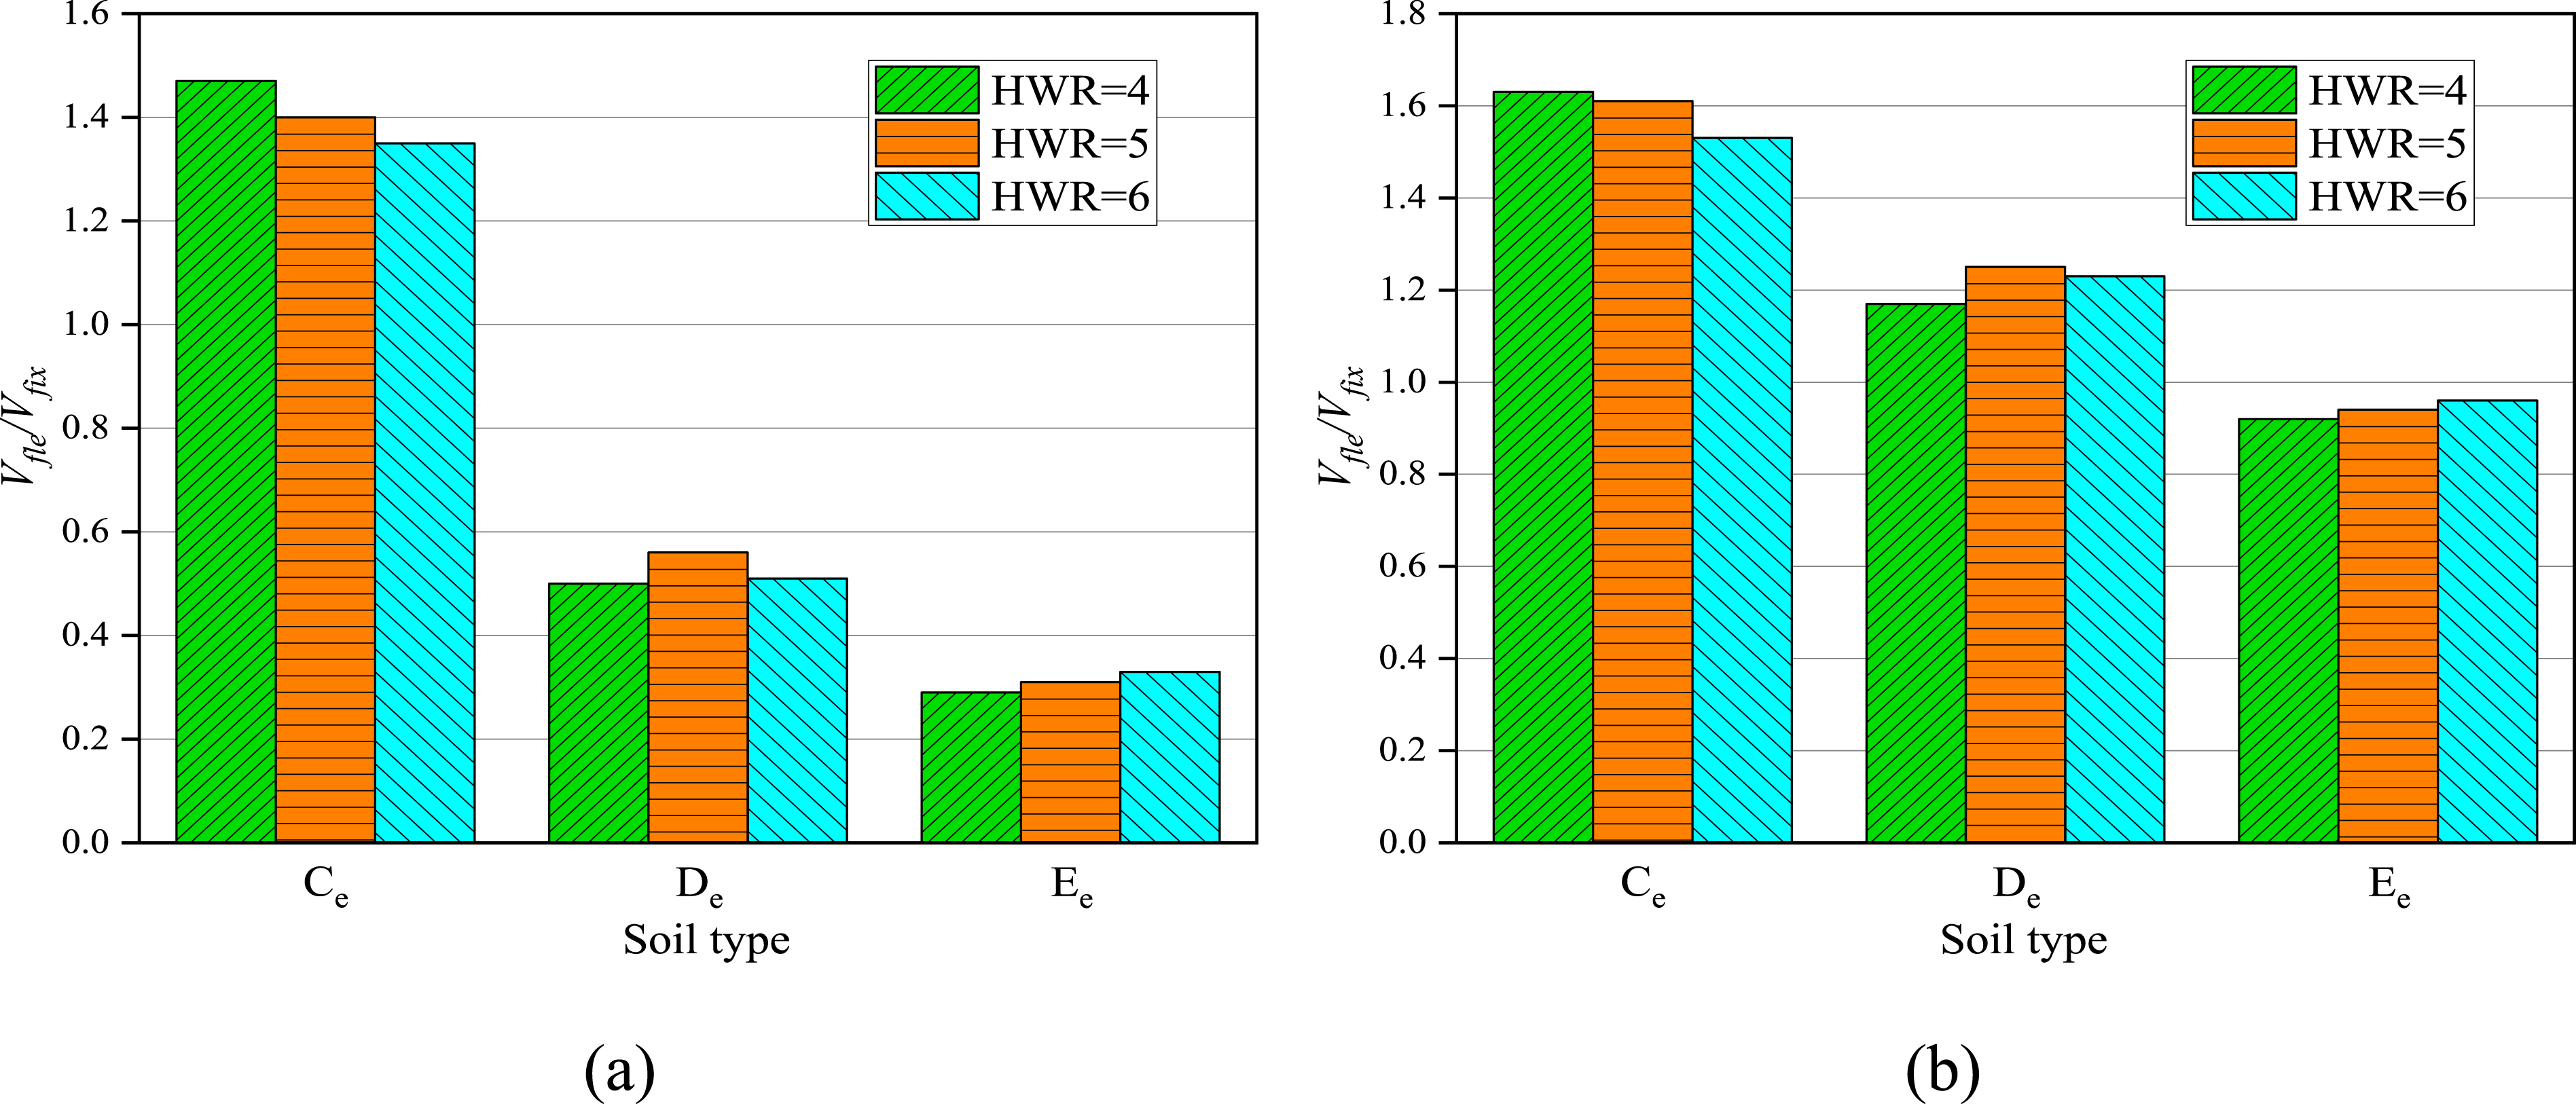
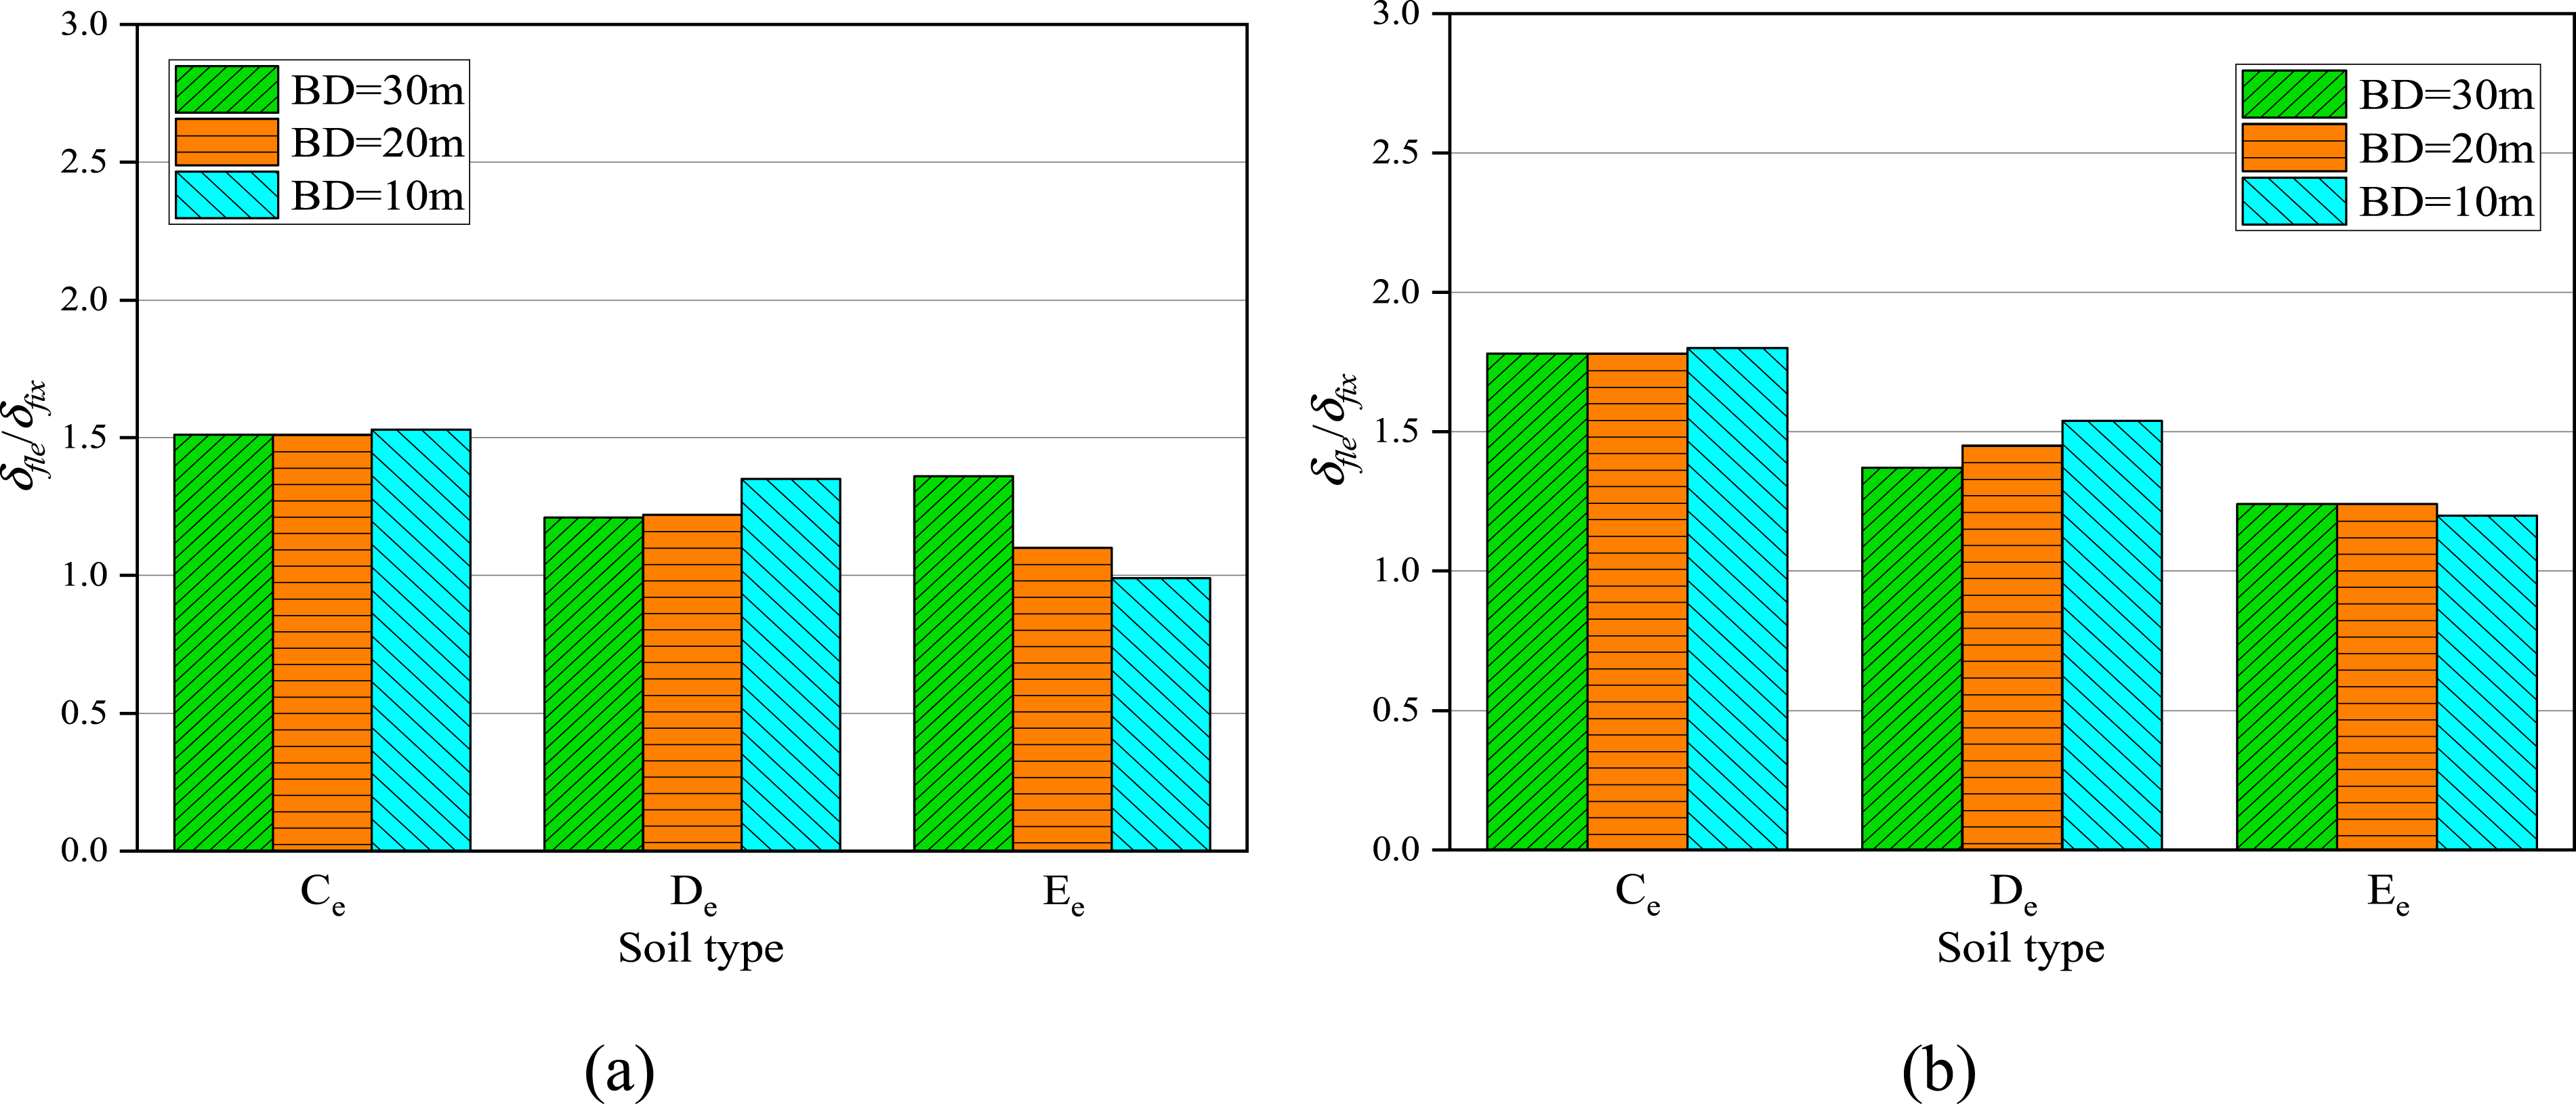
The values of δ
fle
/δ
fix
are shown in Figures 34–39. It also can be found that the value of δ
fle
/δ
fix
is greater than one in almost all cases. Figure 40 illustrates the relationship between δ
fle
/δ
fix
, V
fle
/V
fix
and Δ
θ
/Δ. When the values of Δ
θ
/Δ are small (less than 0.5 for classical compensated foundation structures and less than 0.15 for piled foundation structures), the data points are basically distributed around the y=x line. As soil stiffness decreases and the values of Δ
θ
/Δ become larger, the data points begin to deviate from the y=x line and shift downward to the right, indicating that the increase of the value of Δ
θ
/Δ tends to amplify the δ and reduce the V of frame-shear wall structures. The value of δ
fle
/δ
fix
of 20-storey frame-shear wall structures with different HWRs (a) classical compensated foundation structure (b) piled foundation structure. The value of δ
fle
/δ
fix
of 20-storey frame-shear wall structures with different BDs (a) classical compensated foundation structure (b) piled foundation structure. The value of δ
fle
/δ
fix
of 30-storey frame-shear wall structures with different HWRs (a) classical compensated foundation structure (b) piled foundation structure. The value of δ
fle
/δ
fix
of 30-storey frame-shear wall structures with different BDs (a) classical compensated foundation structure (b) piled foundation structure. The value of δ
fle
/δ
fix
of 40-storey frame-shear wall structures with different HWRs (a) classical compensated foundation structure (b) piled foundation structure. The value of δ
fle
/δ
fix
of 40-storey frame-shear wall structures with different BDs (a) classical compensated foundation structure (b) piled foundation structure. The relationship between δ
fle
/δ
fix
, V
fle
/V
fix
and Δ
θ
/Δ of frame-shear wall structures (a) classical compensated foundation structure (b) piled foundation structure.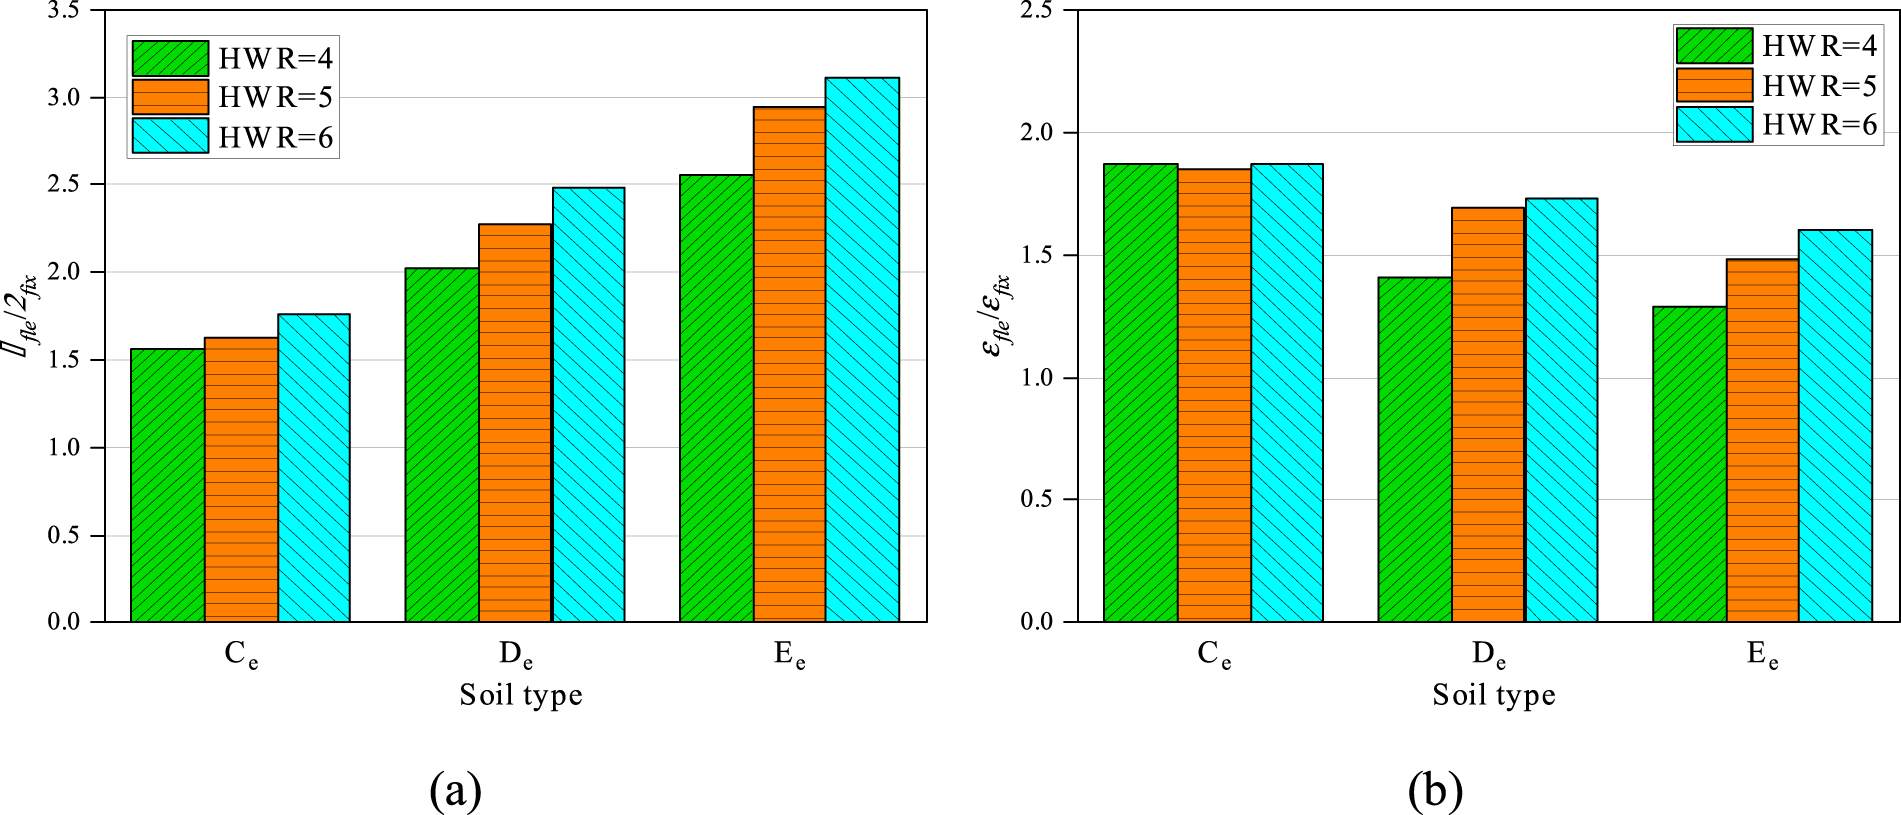
Moreover, similar to frame-core tube structures, almost all data points of the pile foundation model lie in the range of δ fle /δ fix > 1, V fle /V fix >1, indicating the SSI has detrimental effects; however, for the classical compensated foundation model, structures with De and Ee soil types are below the V fle /V fix =1 line, indicating that SSI has a favorable influence, it can reduce the V of the superstructure, even if the inter-storey drifts are still amplified.
Figure 41 shows the relationship between T
fle
/T
fix
and V
fle
/V
fix
. With the substructure stiffness decreasing and the T
fle
/T
fix
increasing, V
fle
/V
fix
decreases linearly. But after reaching a certain level, the value of V
fle
/V
fix
remains stable and no longer decreases. For the classical compensated foundation structure, the value of V
fle
/V
fix
does not decrease after reaching 0.343, while for the piled foundation structure, this value is 0.971. In addition, straight line fittings were also performed on the descending sections in Figure 41. The fitting results of the classical compensated foundation structure (Equation (6)) and piled foundation structure (Equation (7)) are as follows, respectively: The relationship between T
fle
/T
fix
and V
fle
/V
fix
of frame-shear wall structures (a) classical compensated foundation structure (b) piled foundation structure.

The linear correlation coefficients r = −0.8731 and −0.8380 respectively, indicating the two variables are highly negatively correlated. Therefore, in the structural design process, designers can easily obtain the value of V fle for frame-shear wall structures by calculating the V fix and T fle /T fix , without carrying out time-consuming numerical calculations.
Conclusions
The objective of this study was to introduce and discuss the effects of various superstructure and substructure parameters (HWR, foundation type, soil type and BD) on the seismic behaviour of tall buildings with different structural systems and heights considering SSI. The governing factors including V and δ of fixed-base and flexible-base structures are obtained and compared to identify the beneficial and detrimental effects of SSI. Based on the results of parametric study, the main conclusions can be obtained as follows. Regardless of the structural system and foundation type, the increase of the stiffness of subsoil can significantly increase the value of V
fle
/V
fix
of structures. In contrast, HWR and BD has little effect on this value. SSI amplifies the value of δ
fle
/δ
fix
of almost all the cases considered in this study. Therefore, the influence of SSI is detrimental to the δ of tall buildings. The influence of the investigated parameters on the value of δ
fle
/δ
fix
is very complex. In general, the increase of Δ
θ
/Δ can amplify the δ and reduce the V. SSI amplifies the value of V
fle
/V
fix
of piled foundation structures and Ce soil-supported classical compensated foundation structures. In terms of classical compensated foundation structures with De and Ee soil types, the impacts of SSI are beneficial because V
fle
/V
fix
is reduced. With the increase of the T
fle
/T
fix
, the value of V
fle
/V
fix
decreases linearly until it reaches a specific value. After that, the value of V
fle
/V
fix
remains constant. Therefore, current seismic codes may determine whether shear forces should be reduced and specify different minimum values of reduced shear force according to the type of structural system and foundation.
Footnotes
Declaration of conflicting interests
The author(s) declared no potential conflicts of interest with respect to the research, authorship, and/or publication of this article.
Funding
The author(s) received no financial support for the research, authorship, and/or publication of this article.