
Abstract
This paper carries out experimental and numerical investigations on the axial performance of circular Reinforced Concrete (RC) precast slender columns with an intermediate connection. A series of tests are carried out to study the effects of longitudinal reinforcement ratio (ρ), and embedded length of steel bars (Lb) of precast columns on their axial performance under concentric loading. Test results show that increasing the reinforcement ratio and the embedded length of the precast columns significantly improves the axial performance of the precast slender columns. Nonlinear finite element models (FEM) are developed to simulate the performance of the columns experimentally observed. The accuracy of the FEM is validated against the test results and found to reasonably predict the axial performance of tested columns.
Keywords
Introduction
Precast Concrete (PC) columns are increasingly being used in high-rise buildings and bridge constructions. PC columns are fabricated in a controlled environment thus ensuring the accepted quality as well reduction in the onsite activities related to casting concrete. However, PC columns with only a limited length can be delivered to the site due to the restriction on transportation length. To achieve the desired length of the columns, multiple PC columns can be connected. However, there is a lack of understanding of the effects of important column parameters on the axial performance of PC slender columns subjected to concentric loading.
Fischinger et al. (2008) studied the cyclic performance of RC columns where the shear span of the columns was 12.5. The tested columns exhibited high deformability and large deformation capacity. Kwak and Kim (2006, 2004) conducted nonlinear analyses using the layered section method to estimate the load-carrying capacity of RC slender columns. The accuracy of the developed model was verified against the test data and found to be reasonably accurate. Extensive parametric studies were conducted to study the effects of various column parameters on the mechanical performance of the RC columns. He et al., (2020) studied the seismic behavior of ultra-high-performance concrete (UHPC) slender columns reinforced with high-strength steel bars. The results demonstrated that UHPC led to a substantial reduction in transverse reinforcement steel bars. With high-strength steel fibers embedded into the UHPC, the seismic performance of the UHPC test specimens was enhanced. Hung and Hu (2018) performed tests on high-strength RC slender columns containing steel fibers. Test results showed that the inclusion of the steel fibers significantly improved the cracking pattern in the columns. However, the columns failed mainly due to the overall buckling associated with concrete crushing and buckling of steel bars. Kos et al. (2022) carried out tests on RC slender columns to study the failure modes and the residual strengths of the damaged columns. A calculation model was proposed to calculate the residual strength of the damaged columns and validated against the test results. Xiao et al. (2020) studied the effects of loading rate on the dynamic behavior of RC columns subjected to cyclic loading. Test results showed that the ultimate load of the columns increases with the increase of the loading rate. Lee and Chen (2022) performed the test on eight large-diameter RC columns under cyclic loading to examine the effectiveness of the single and double cross-lap sliced crossties to confine the columns. It was found that the circular ties provided the most effective confinement compared to single and double cross-lap sliced crossties.
Focusing on PC columns, Zeng et al. (2022) studied the seismic performance of PC columns with grouted sleeves. The influence of stirrups ratio, reinforcement ratio and axial compression ratio on the performance of the PC column were investigated. It was found that the failure of PC columns was similar to conventional in-situ casted RC columns. In addition, with the increase of the reinforcement ratio, the bearing capacity and the energy absorption capacity of the columns increased. Shim et al. (2008) tested circular PC columns with prestressed bars under seismic loading. The effects of prestressing bars, and prestressing force were examined. It was found that the columns with lower reinforcement bars showed poor seismic performance. It was reported that the effects of prestress on the self-centering capacity were insignificant when the plastic hinge region was damaged. The effects of the strength of concrete, axial load and layout of the rebars on the fire resistance of PC columns were investigated by Xu et al. (2023). Test results showed that columns with normal-strength concrete had better fire resistance than columns made of higher-strength concrete. In addition, increasing axial load reduced fire exposure time by 78%. The change in the rebar layout in core concrete had an insignificant effect on the fire resistance of the columns. Deyanova et al. (2023) carried out a nonlinear analysis of PC slender columns to predict the force-deformation responses of the columns under an earthquake scenario. Trilinear approximation of the inelastic behavior of the PC slender column was proposed. It was found that the column fails due to the buckling of the steel bar and the possibility of shear failure at the bottom of the columns is unlikely. Recently, Hamoda et al. (2023a) carried out tests on PC beams with intermediate connection under flexural loading. Normal Concrete (NC), Strain Hardening Cementitious Composite (SHCC), and Ultra-High-Performance-Concrete (UHPC) were used to cast intermediate connection. The test investigated the effects of the ratio of longitudinal reinforcement ratio and the length of steel bars embedded on their flexural performance. It was found that utilizing UHPC significantly improves the flexural performance of PC beams. The load-carrying capacity of PC beams with SHCC and UHPC connections was about 31% and 47%, respectively higher than that of the master NC beam. In addition, the absorbed energy of the PC beams with SHCC and UHPC connections was 94% and 85% higher than master NC beam, respectively. Finite element model was developed and validated against the test data and found to be accurate.
Considering there has been no research undertaken on PC slender columns with intermediate connection, this paper reports a series of tests carried out on PC slender columns with intermediate connection under concentrating load to fill this knowledge gap. The effects of longitudinal reinforcement ratio (ρ), and embedded length of steel bars (Lb) on the axial performance of PC columns under concentric loading are examined. The test results are presented and discussed. A finite element model is also developed and validated against the test results.
Test program
Details of the tested PC slender columns.
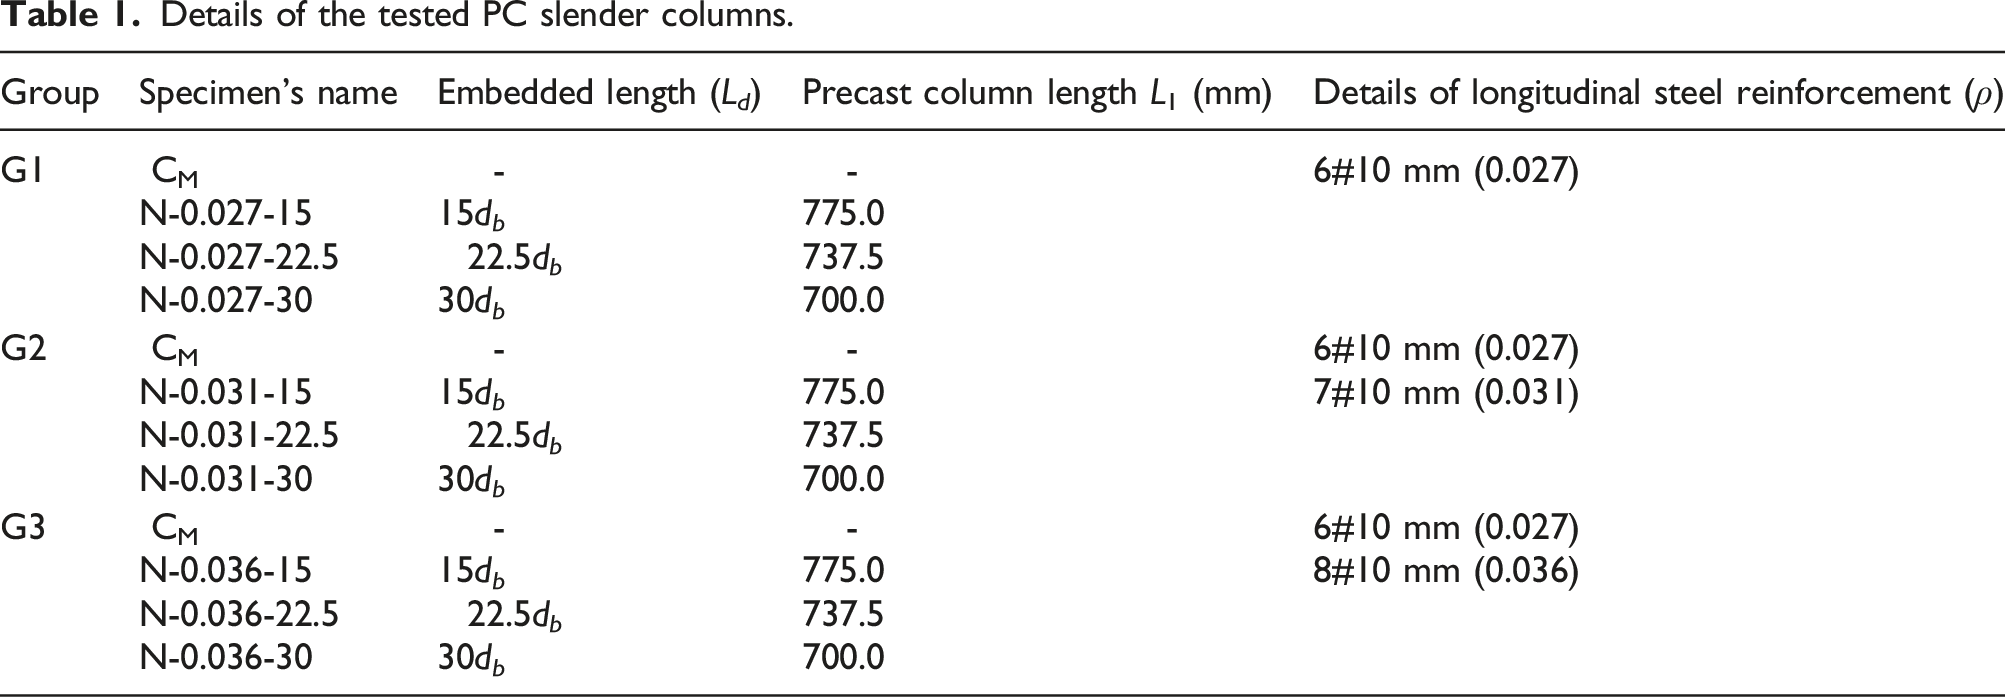
Details of the specimens
Nine PC slender columns were constructed and tested up to collapse. To evaluate the efficiency of PC columns, a solid slender RC column with the same geometric properties as PC columns was also constructed and taken as the control column for comparison purposes. All columns were designed with the same geometric properties having a diameter of 150 mm and a height of 1700 mm. The maximum reinforcement ratio in RC columns is specified as 4% according to Egyptian code ECP-203 (2007). Based on the preliminary studies in designing the columns within the reinforcement limits specified in the code while ensuring the ultimate load of the column does not exceed the maximum capacity of the testing machine, three different reinforcement ratios of 0.027, 0.031, and 0.036 were selected. The columns were grouped according to the different reinforcement ratios. For each group, columns with three different embedded lengths of 15d
b
, 22.50d
b,
and 30d
b
were tested, where d
b
is the bar diameter. The details of the columns are given in Table 1. In the naming of the column, the number (0.027/0.031/0.036) followed by ‘N’ refers to the reinforcement ratio. The corresponding number (15/22.5/30) refers to the embedded length. For example, specimen ‘N-0.027-15’ refers to the column with a reinforcement ratio of 0.027 and an embedded length of 15d
b
. Figure 1 shows the geometric and reinforcement details as well as the formation of the PC slender columns tested in this study. The diameter of the stirrups was 8 mm with a spacing of 185 mm for all columns. Forming of PC slender columns with intermediate connection.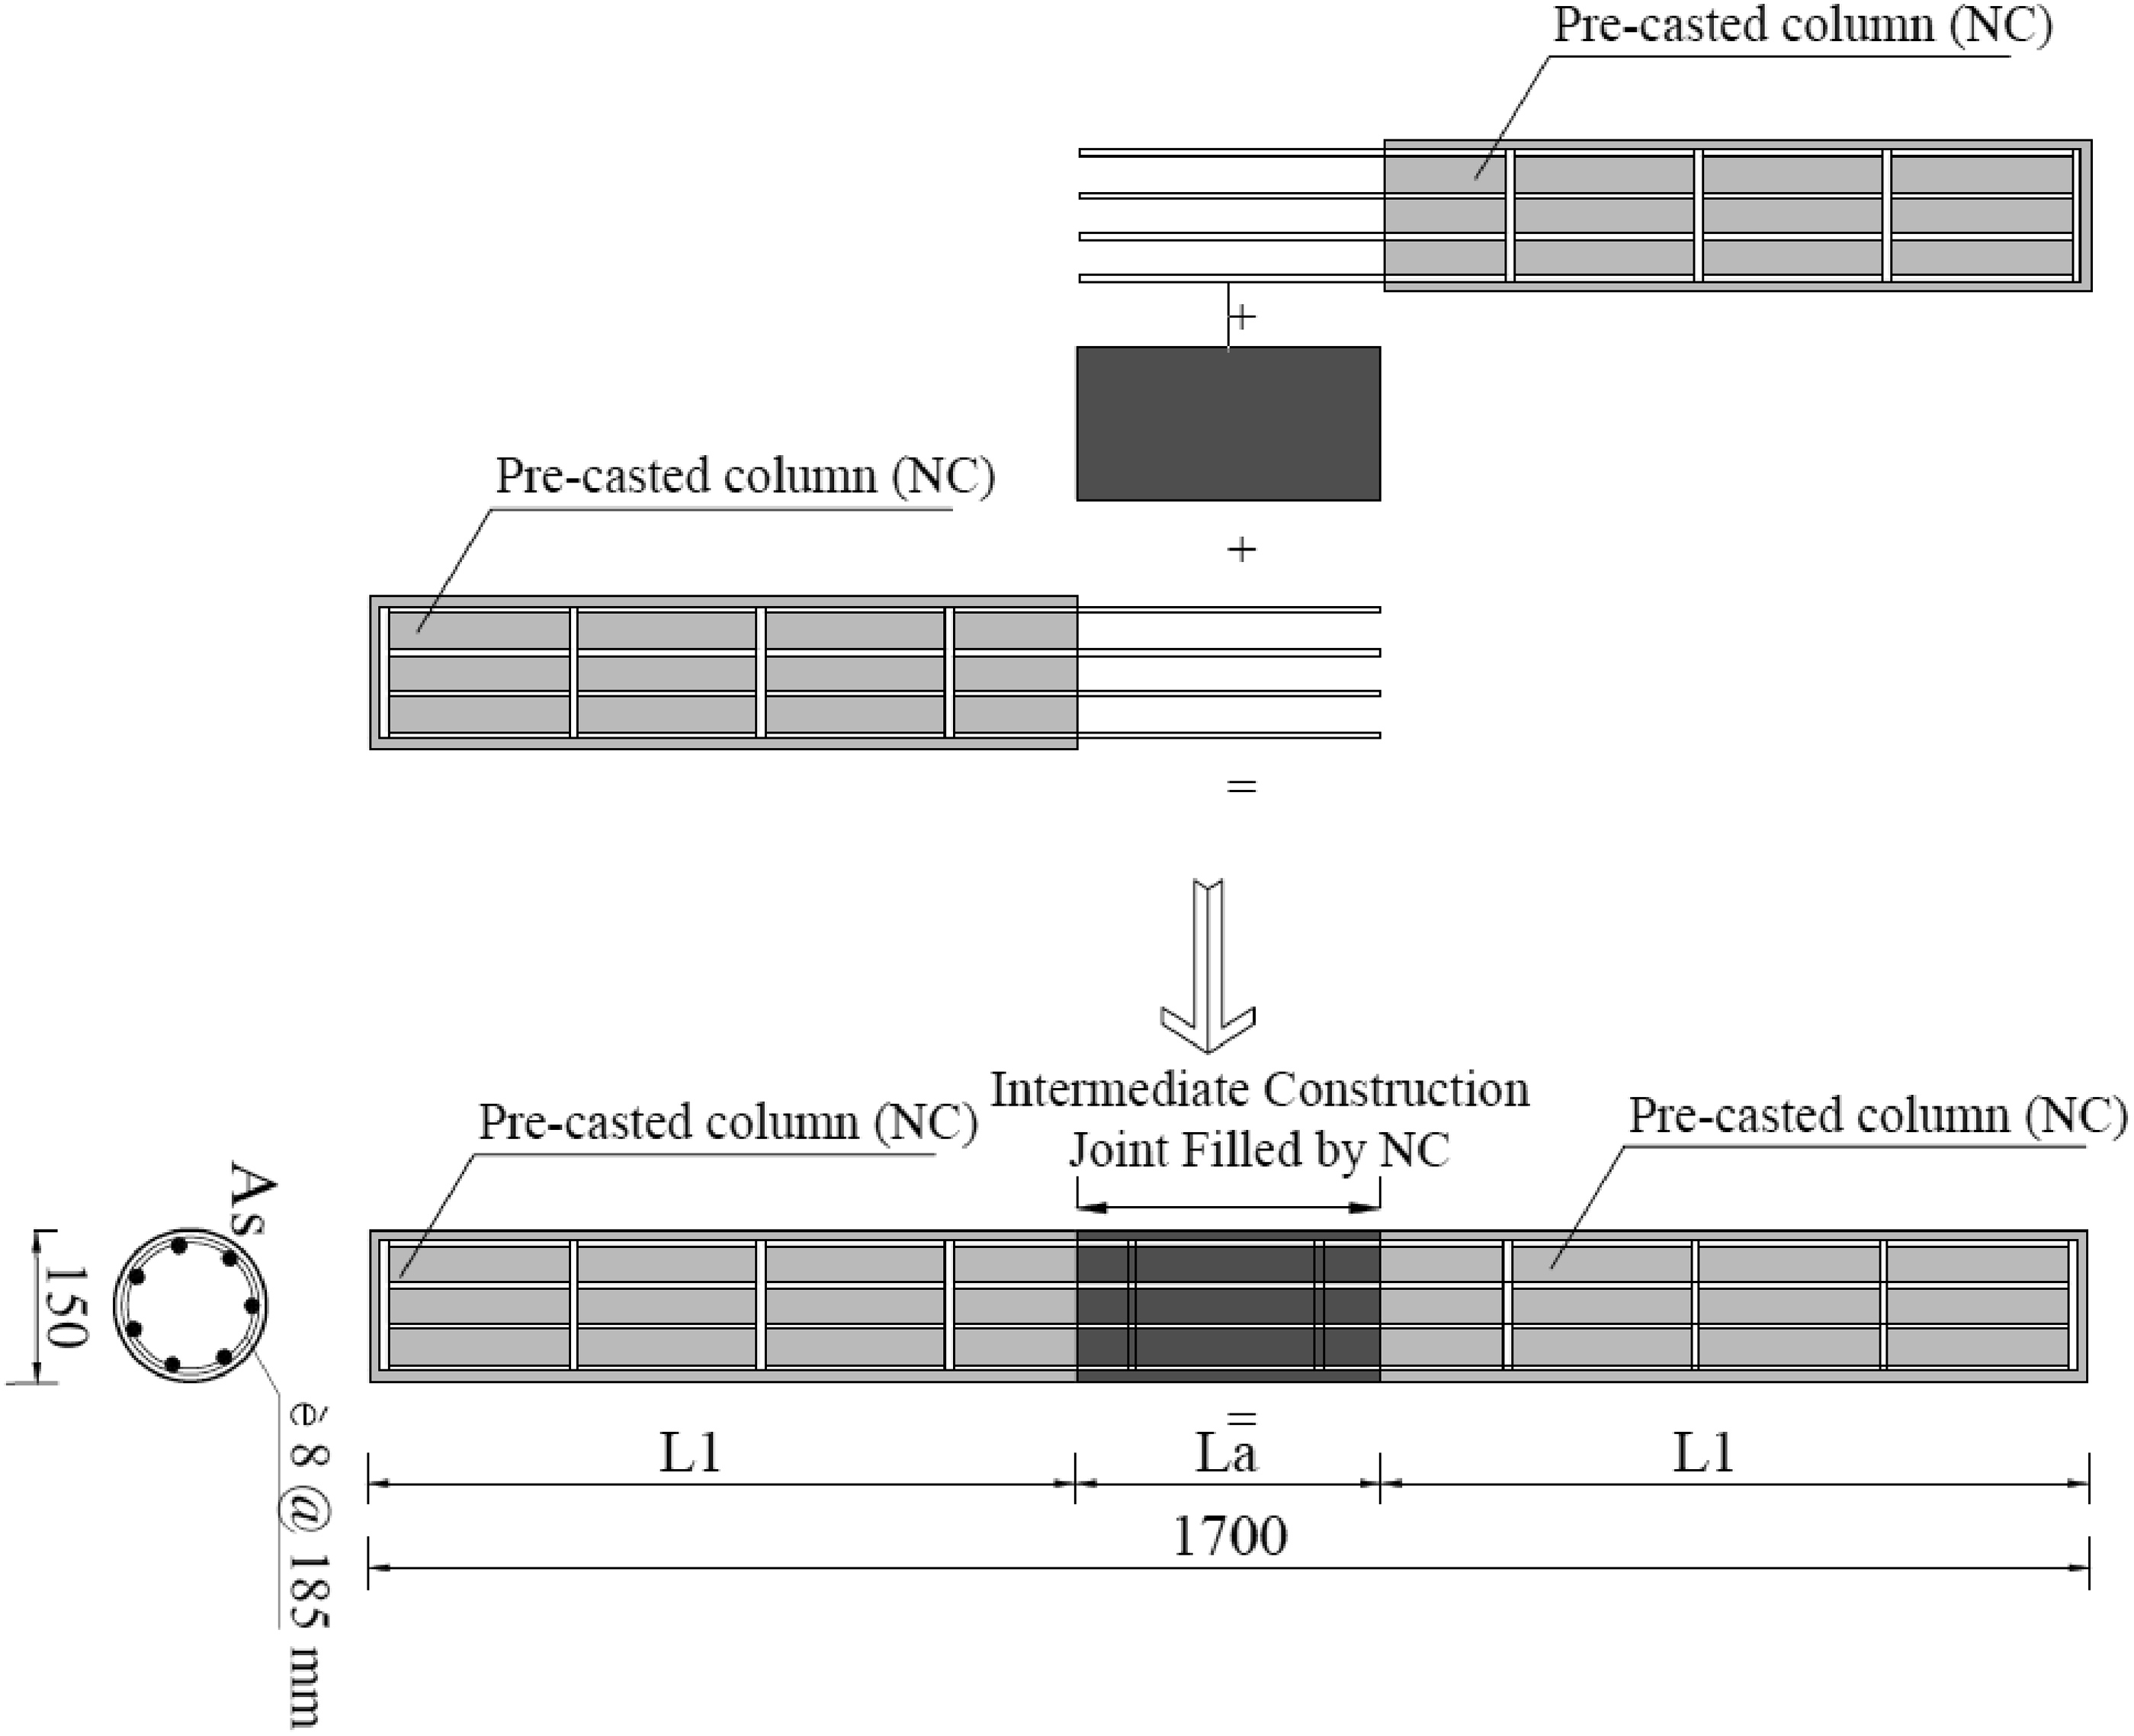
Formwork
Plastic cylinder formwork was used to cast the precast members as shown in Figure 2(a). Ready mix concrete was used to cast all the specimens. The height L1 of precast NC columns for each group was 775 mm, 737.50 mm, and 700 mm, as shown in Table 1. The embedded length of the connection La was selected as 15d
b
, 22.50d
b
and 30d
b
, respectively. To form a slender column, two precast NC columns with the same L1 were connected as shown in Figure 2(b). Then, NC with the same mix design was employed as an intermediate connection as shown in Figure 2(c). Except for the intermediate connection, the specimens were painted in white for better visualization of cracks under applied load. Preparation of the tested columns: (a) formwork, (b) connecting two precast panels and (c) intermediate connection.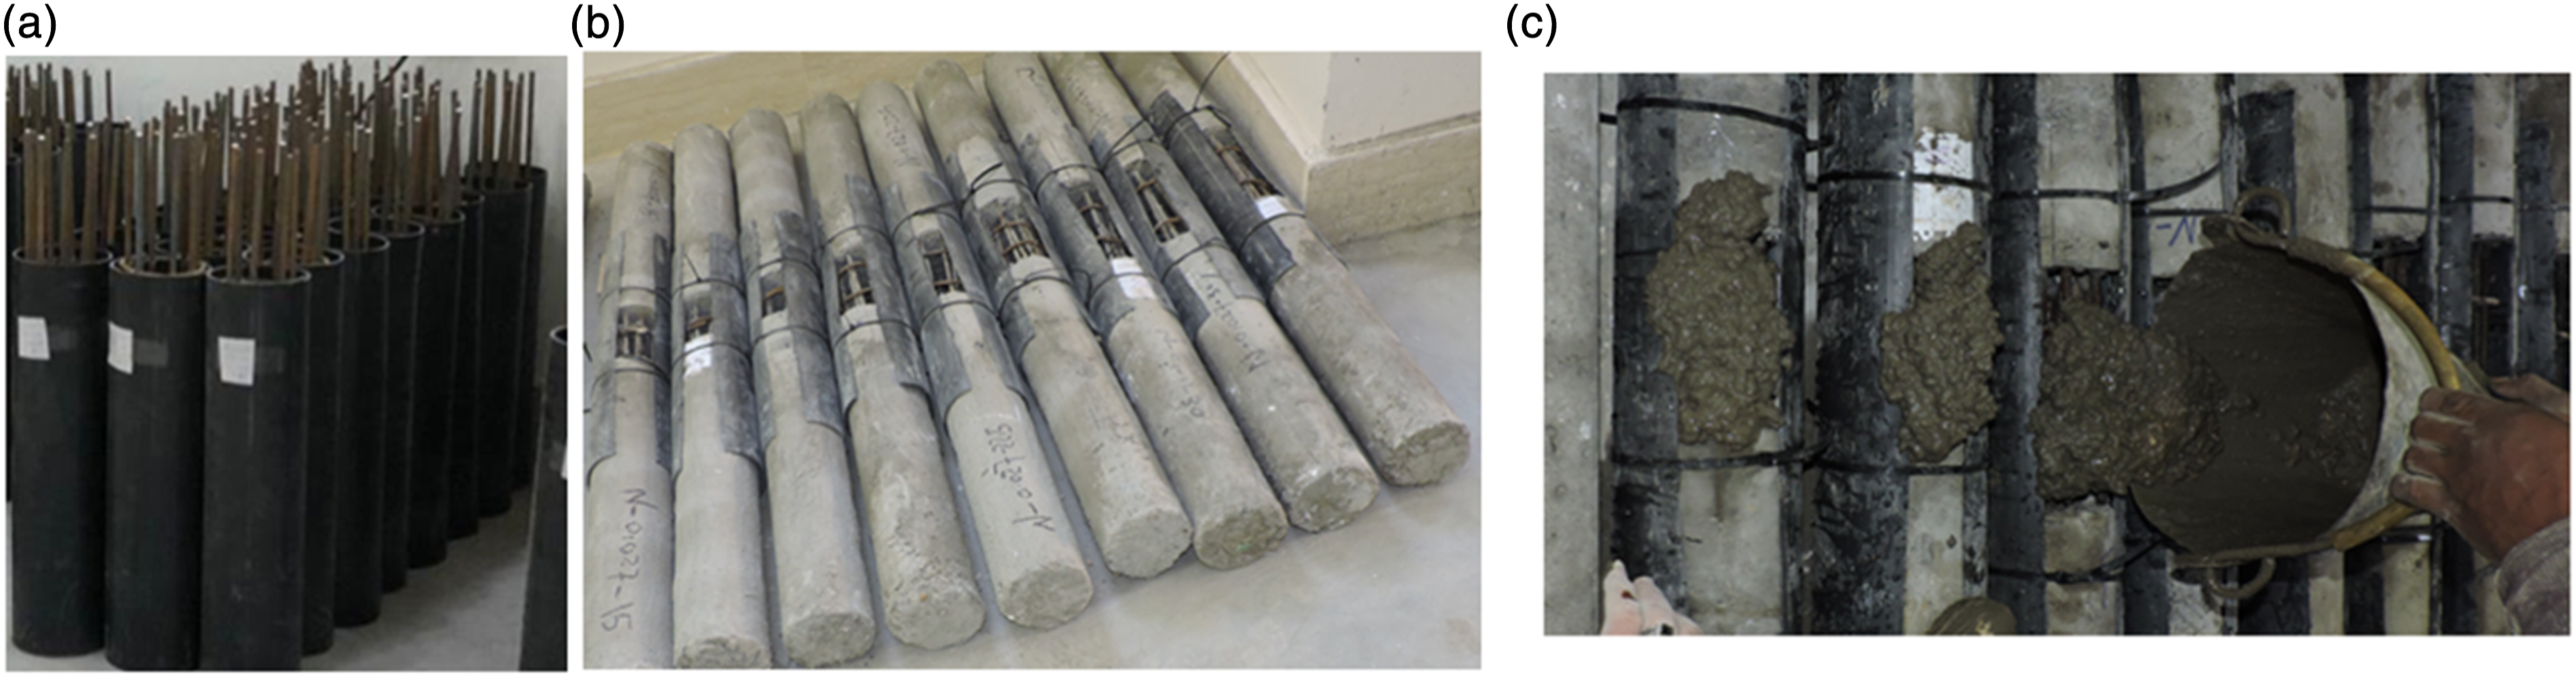
Material properties
The mix design of the concrete was: cement 450 kg/m3, fine aggregate 700 kg/m3, coarse aggregate 1150 kg/m3, water/binder ratio 0.43. The concrete compressive strengths were obtained from three standard cylinders (150 mm diameter and 300 mm height) tested on the same day of testing. The average value of compressive strength was measured as 25.10 MPa. Uniaxial tensile tests were also carried out on dog-bone-shaped specimens to measure the tensile properties of concrete according to the ACI recommendations ACI319-19 (2019). The concrete tensile strength was measured as 2.59 MPa. The uniaxial stress-strain laws for NC measured from the test are given in Figure 3. Stress-strain curves of concrete under compression and tension.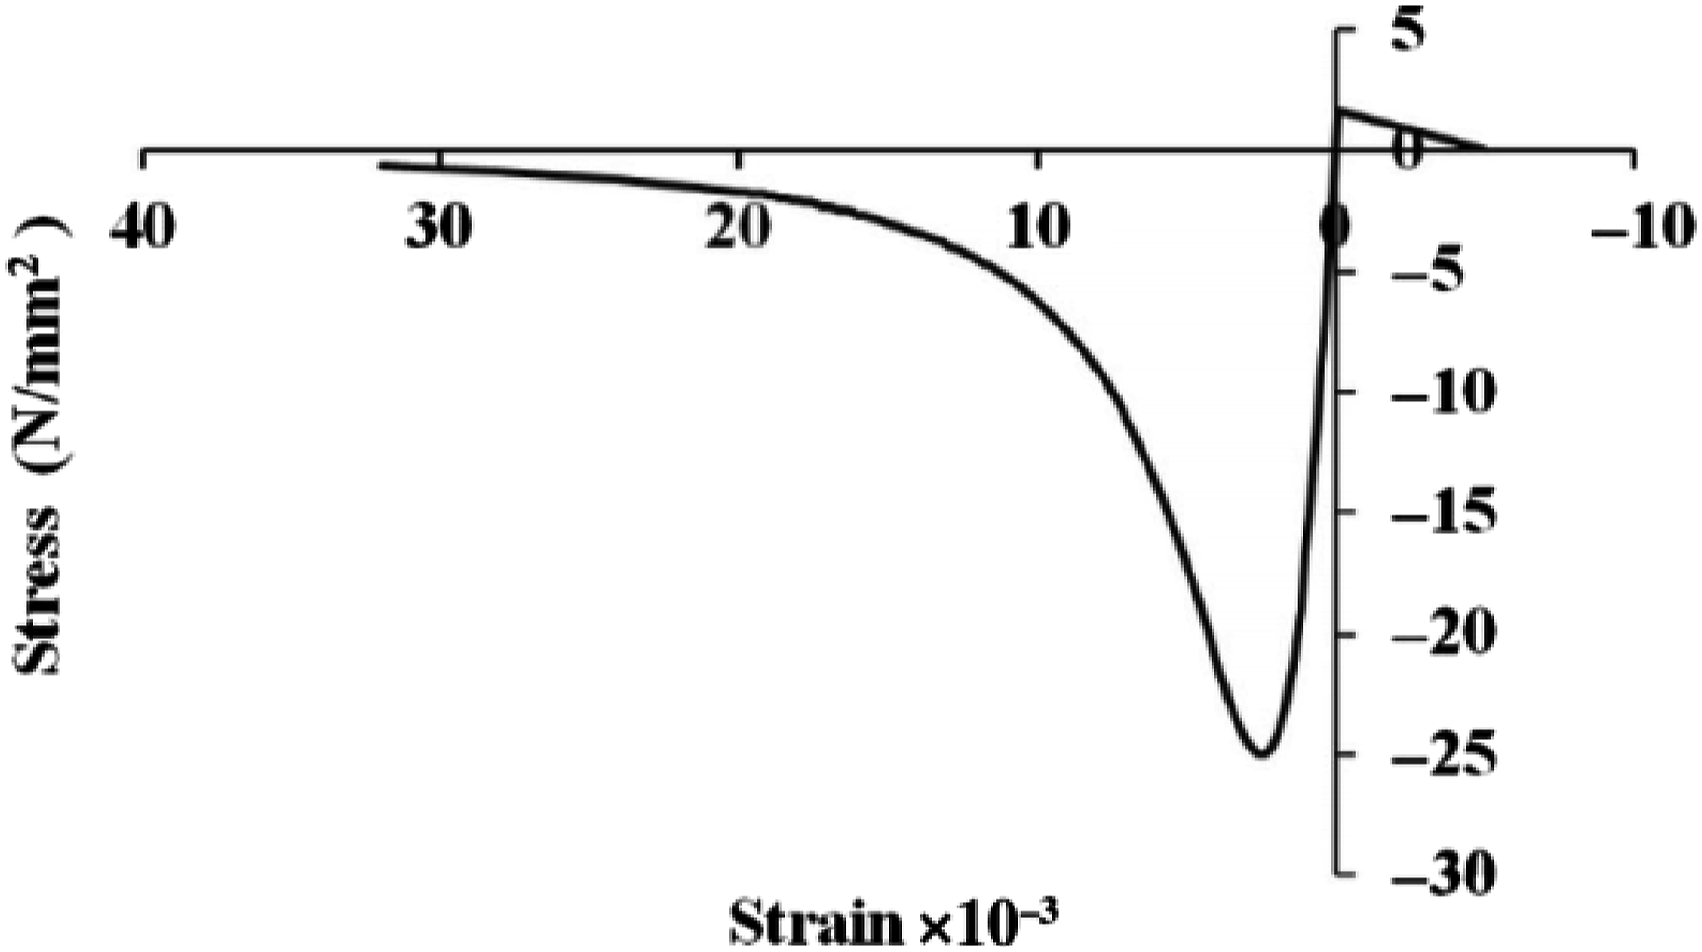
Uniaxial tensile coupon tests were performed to determine the mechanical properties of steel bars. The test stress-strain curves are shown in Figure 4. The yield and tensile strength of the 8 mm steel bars were 270 MPa and 513 MPa, respectively whereas the yield and tensile strength of the 10 mm steel bars were 397 MPa and 594 MPa, respectively. Stress-strain relationships of steel bars.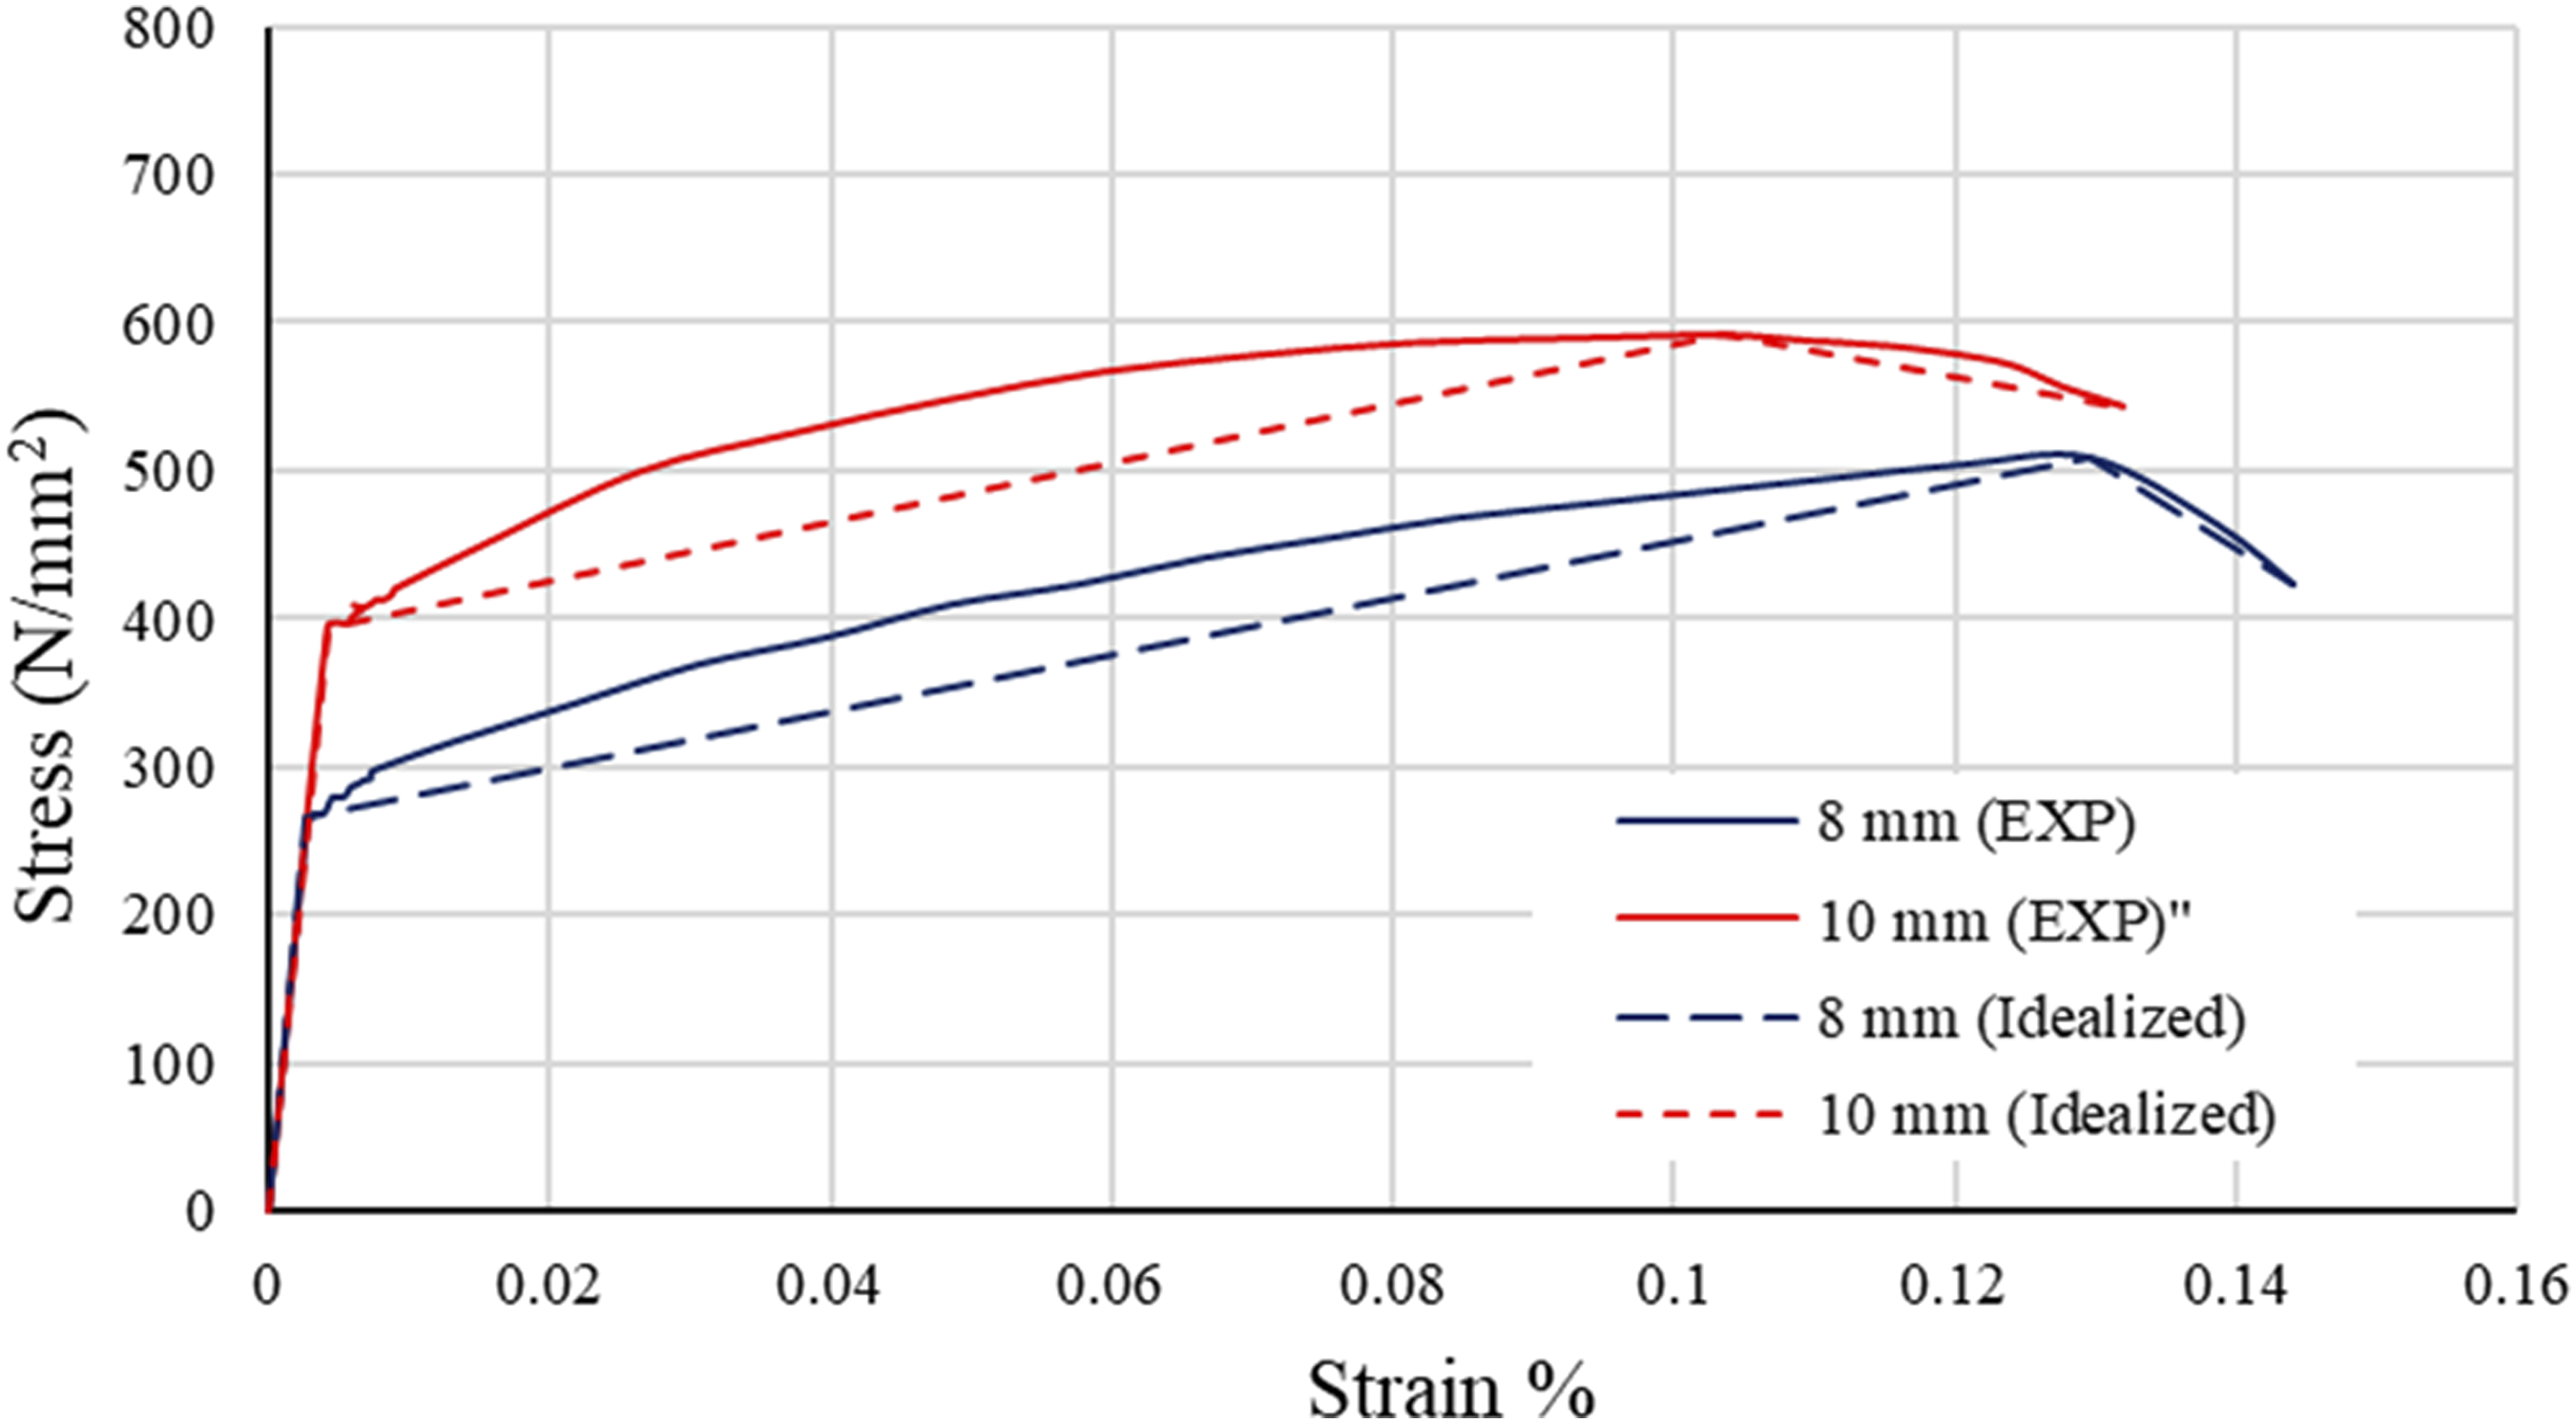
Test setup
The experimental test was carried out at Kafrelsheikh University, Egypt using a hydraulic jack with 1000 kN capacity fixed in the rigid steel frame. The tested columns were hinged at the column`s bottom surface whereas roller support was at the column`s top allowing only the vertical jack movement as shown in Figure 5. The columns were loaded under point load using two solid steel balls attached to the upper and lower joint as shown in Figure 5. To eliminate the premature failure at the column ends, thick circular steel tubes were used as a jacket at the column ends. Linear Variable Displacement Transducers (LVDT) were used to measure the deflection at the columns' mid-height. A data logger system was used to acquire data during the test. Experimental test set-up.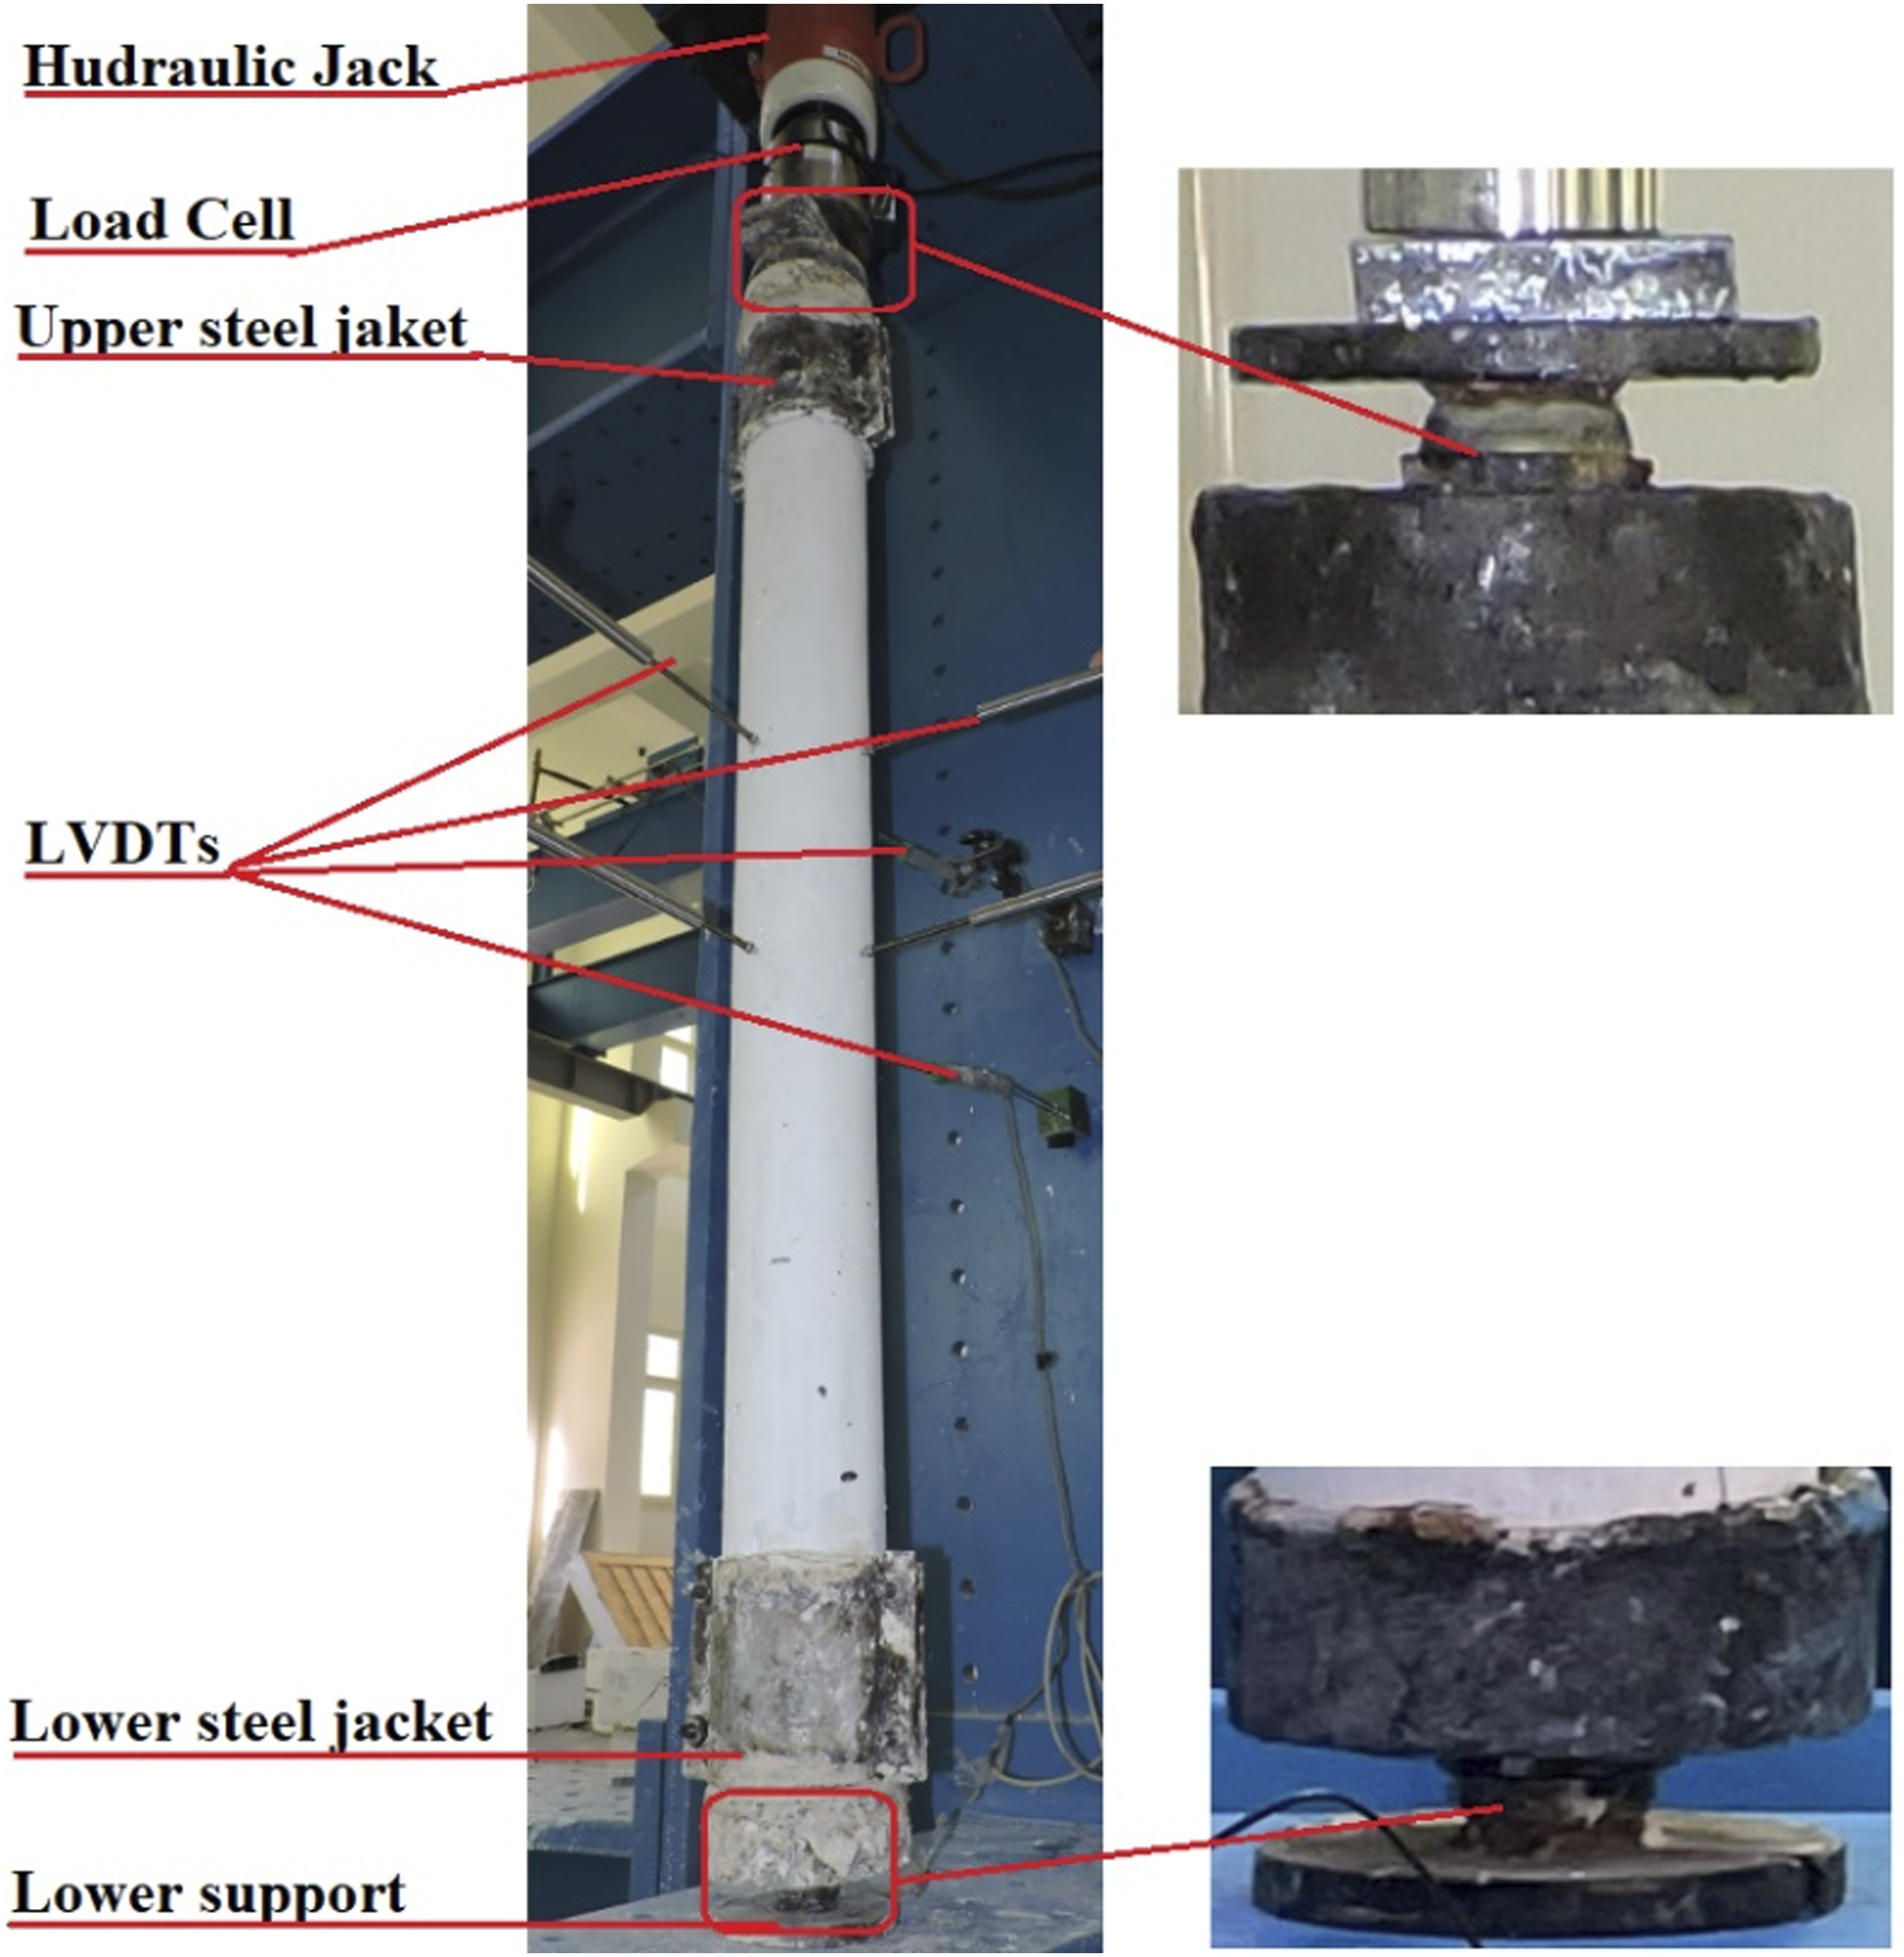
Results and discussions
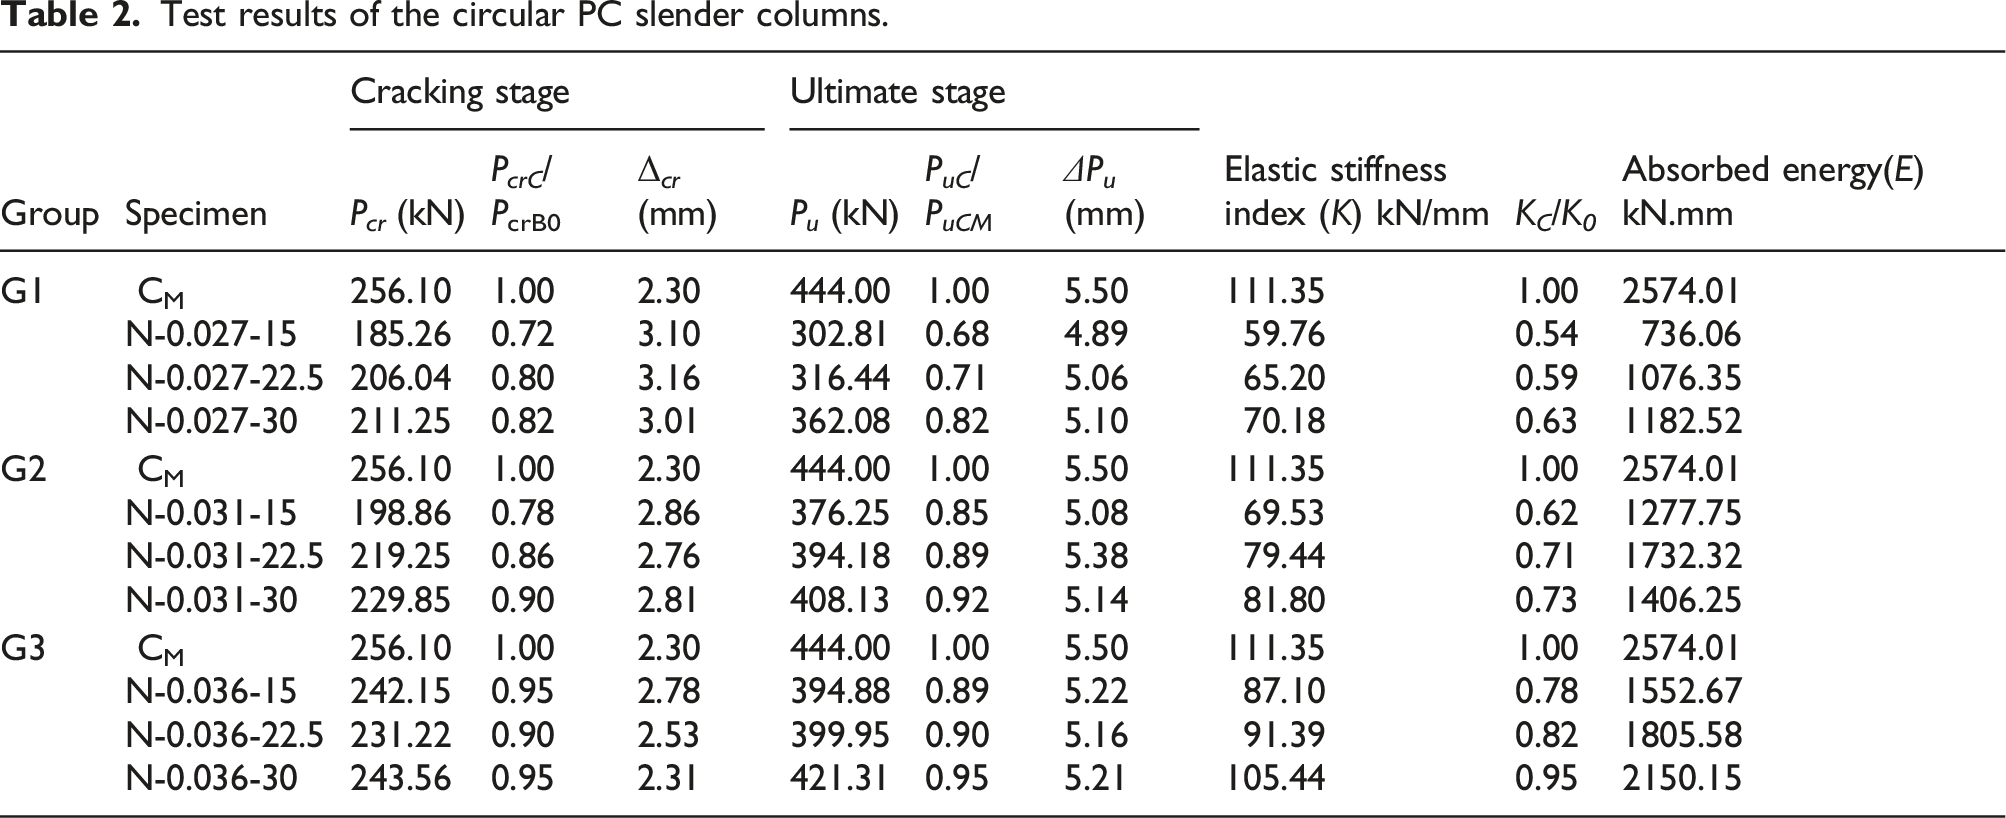
Test results of the circular PC slender columns.
Failure modes
Figure 6 presents the failure modes of master solid NC slender column CM whereas Figures 7–9 present the failure modes of the slender columns from Groups G1-G3. As can be seen from Figure 6, for column CM, concrete was crushed on the compression side of the column. Although it seems that the column has already buckled, the magnitude of buckling deformation appears to be small. Furthermore, the buckled region appears to be closer to the bottom fixed end of the column than toward the center. Failure pattern of column CM. Failure patterns of columns in Group G1: (a) column N-0.027-15, (b) column N-0.027-22.5, and (c) column N-0.027-30. Failure patterns of columns in Group G2: (a) column N-0.031-15, (b) column N-0.031-22.5, and (c) column N-0.031-30. Failure patterns of columns in Group G3: (a) column N-0.036-15, (b) column N-0.036-22.5, and (c) column N-0.036-30.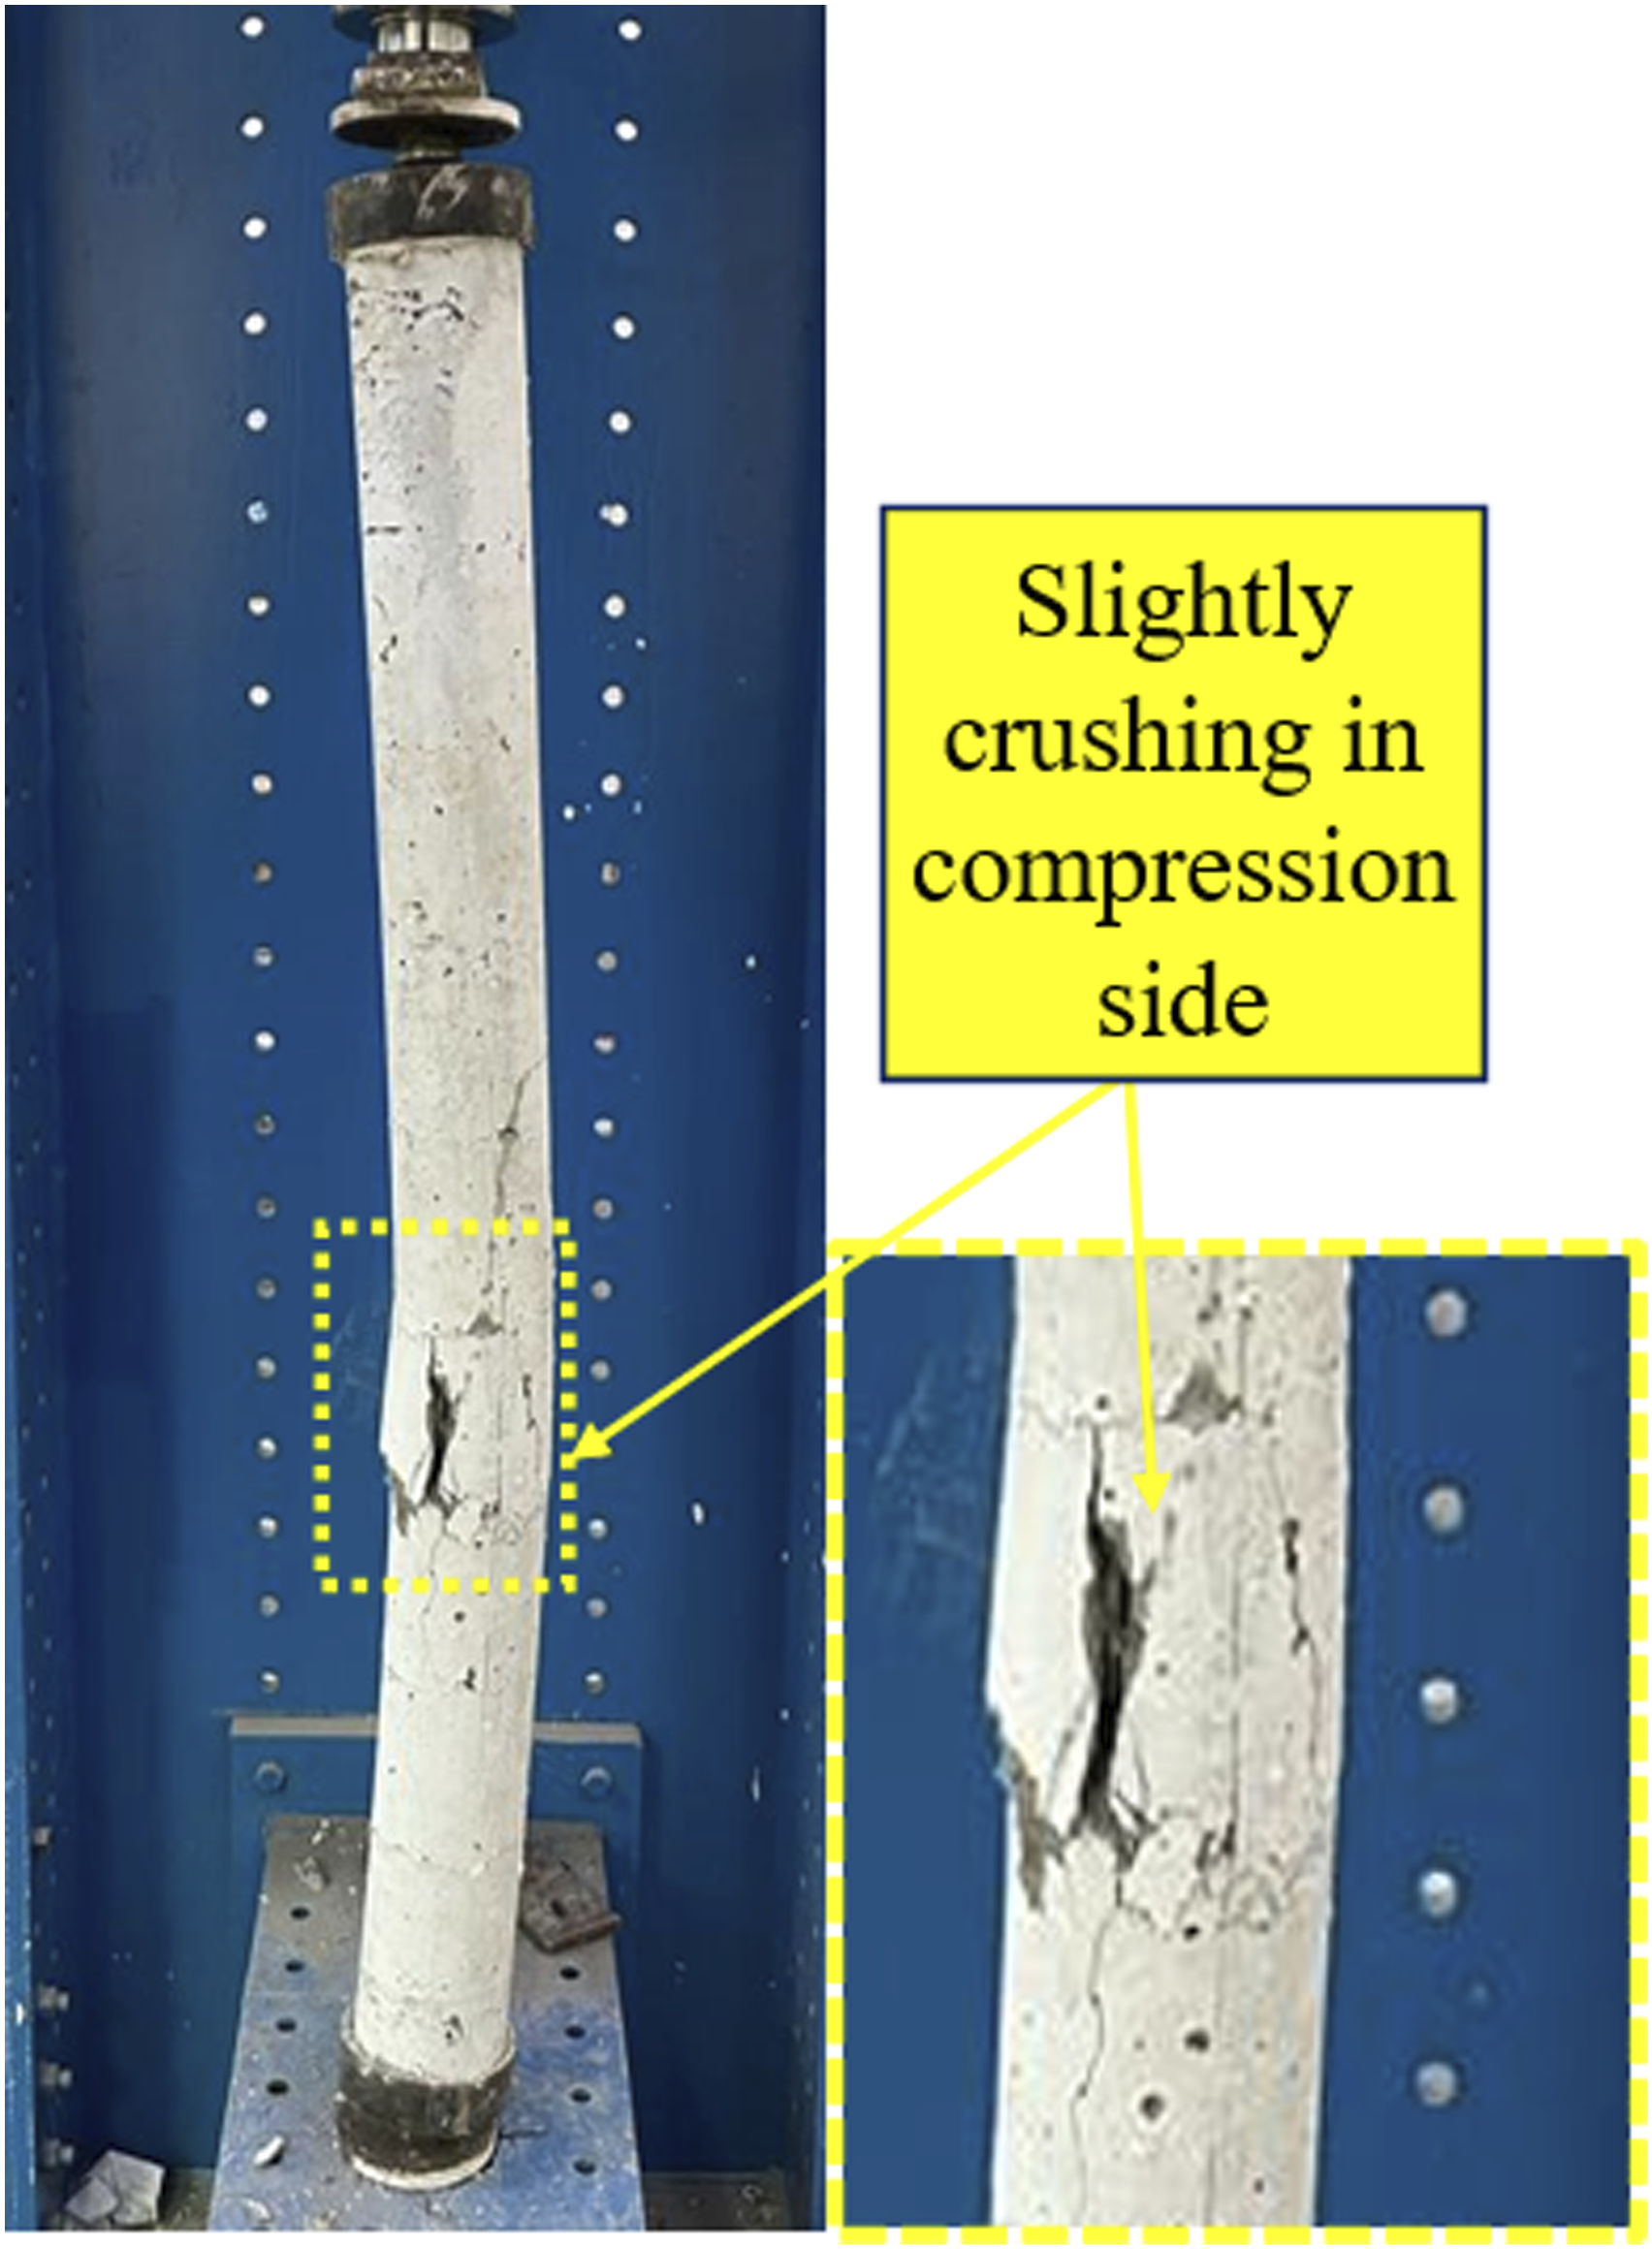
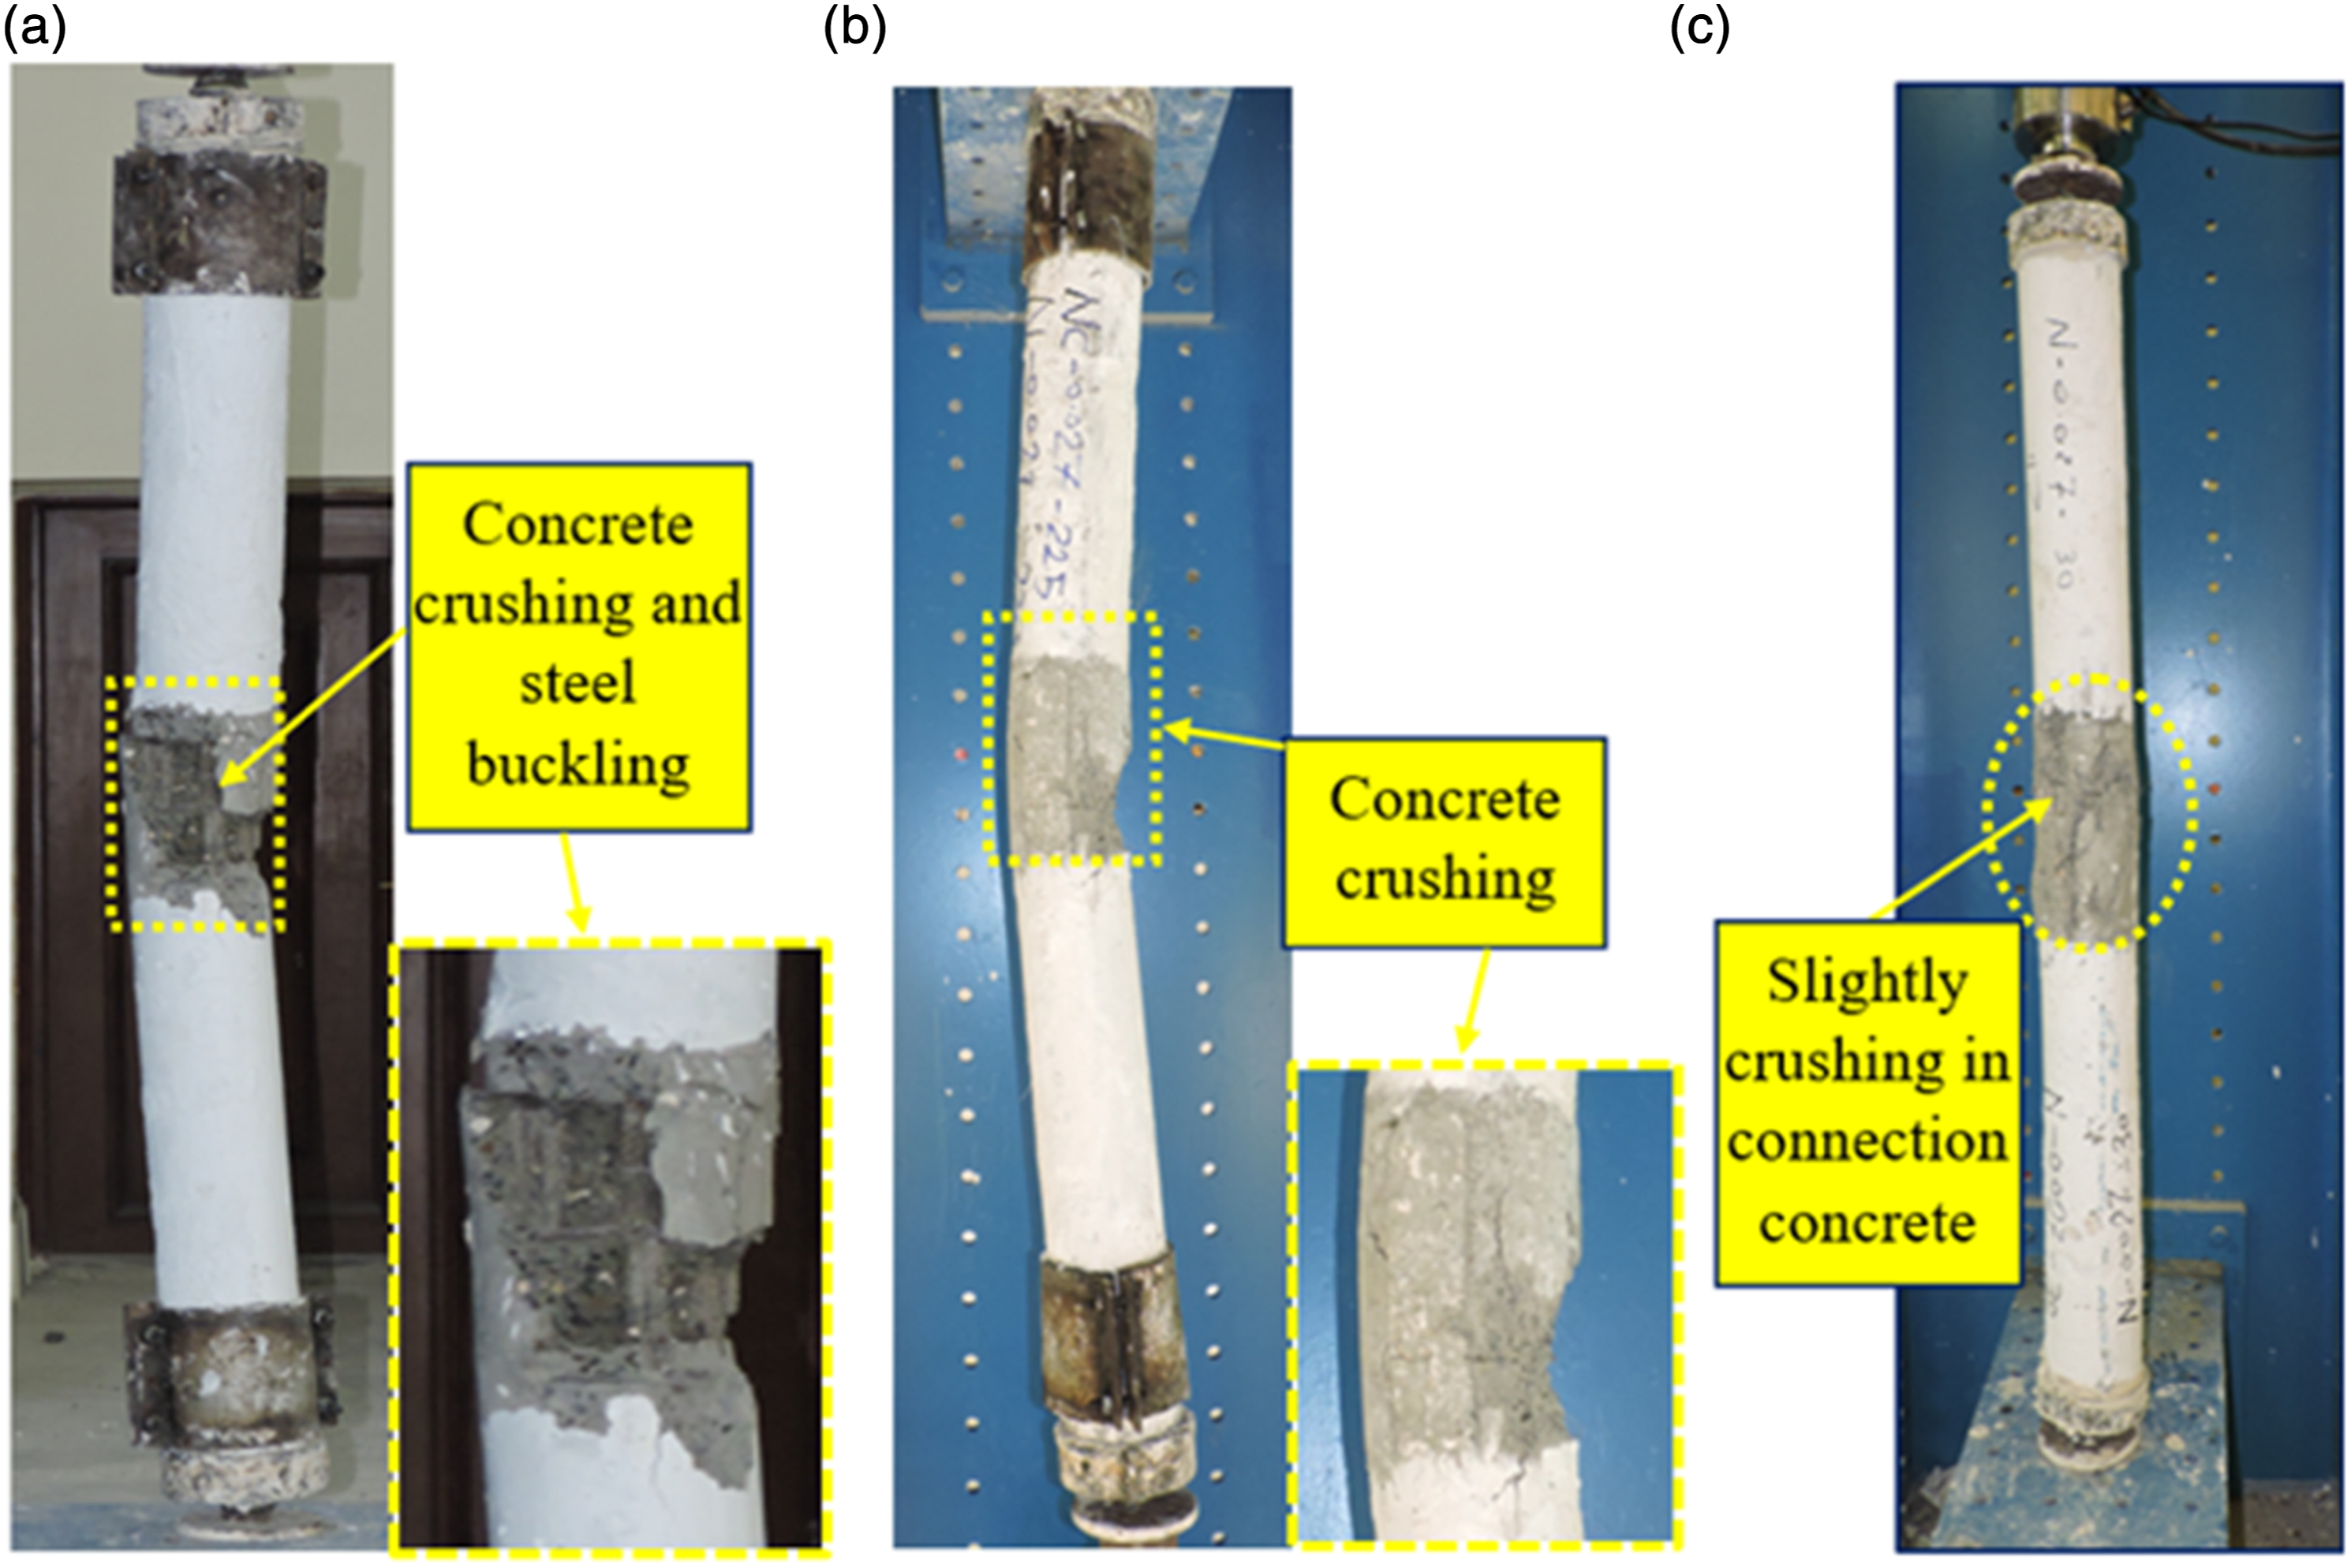
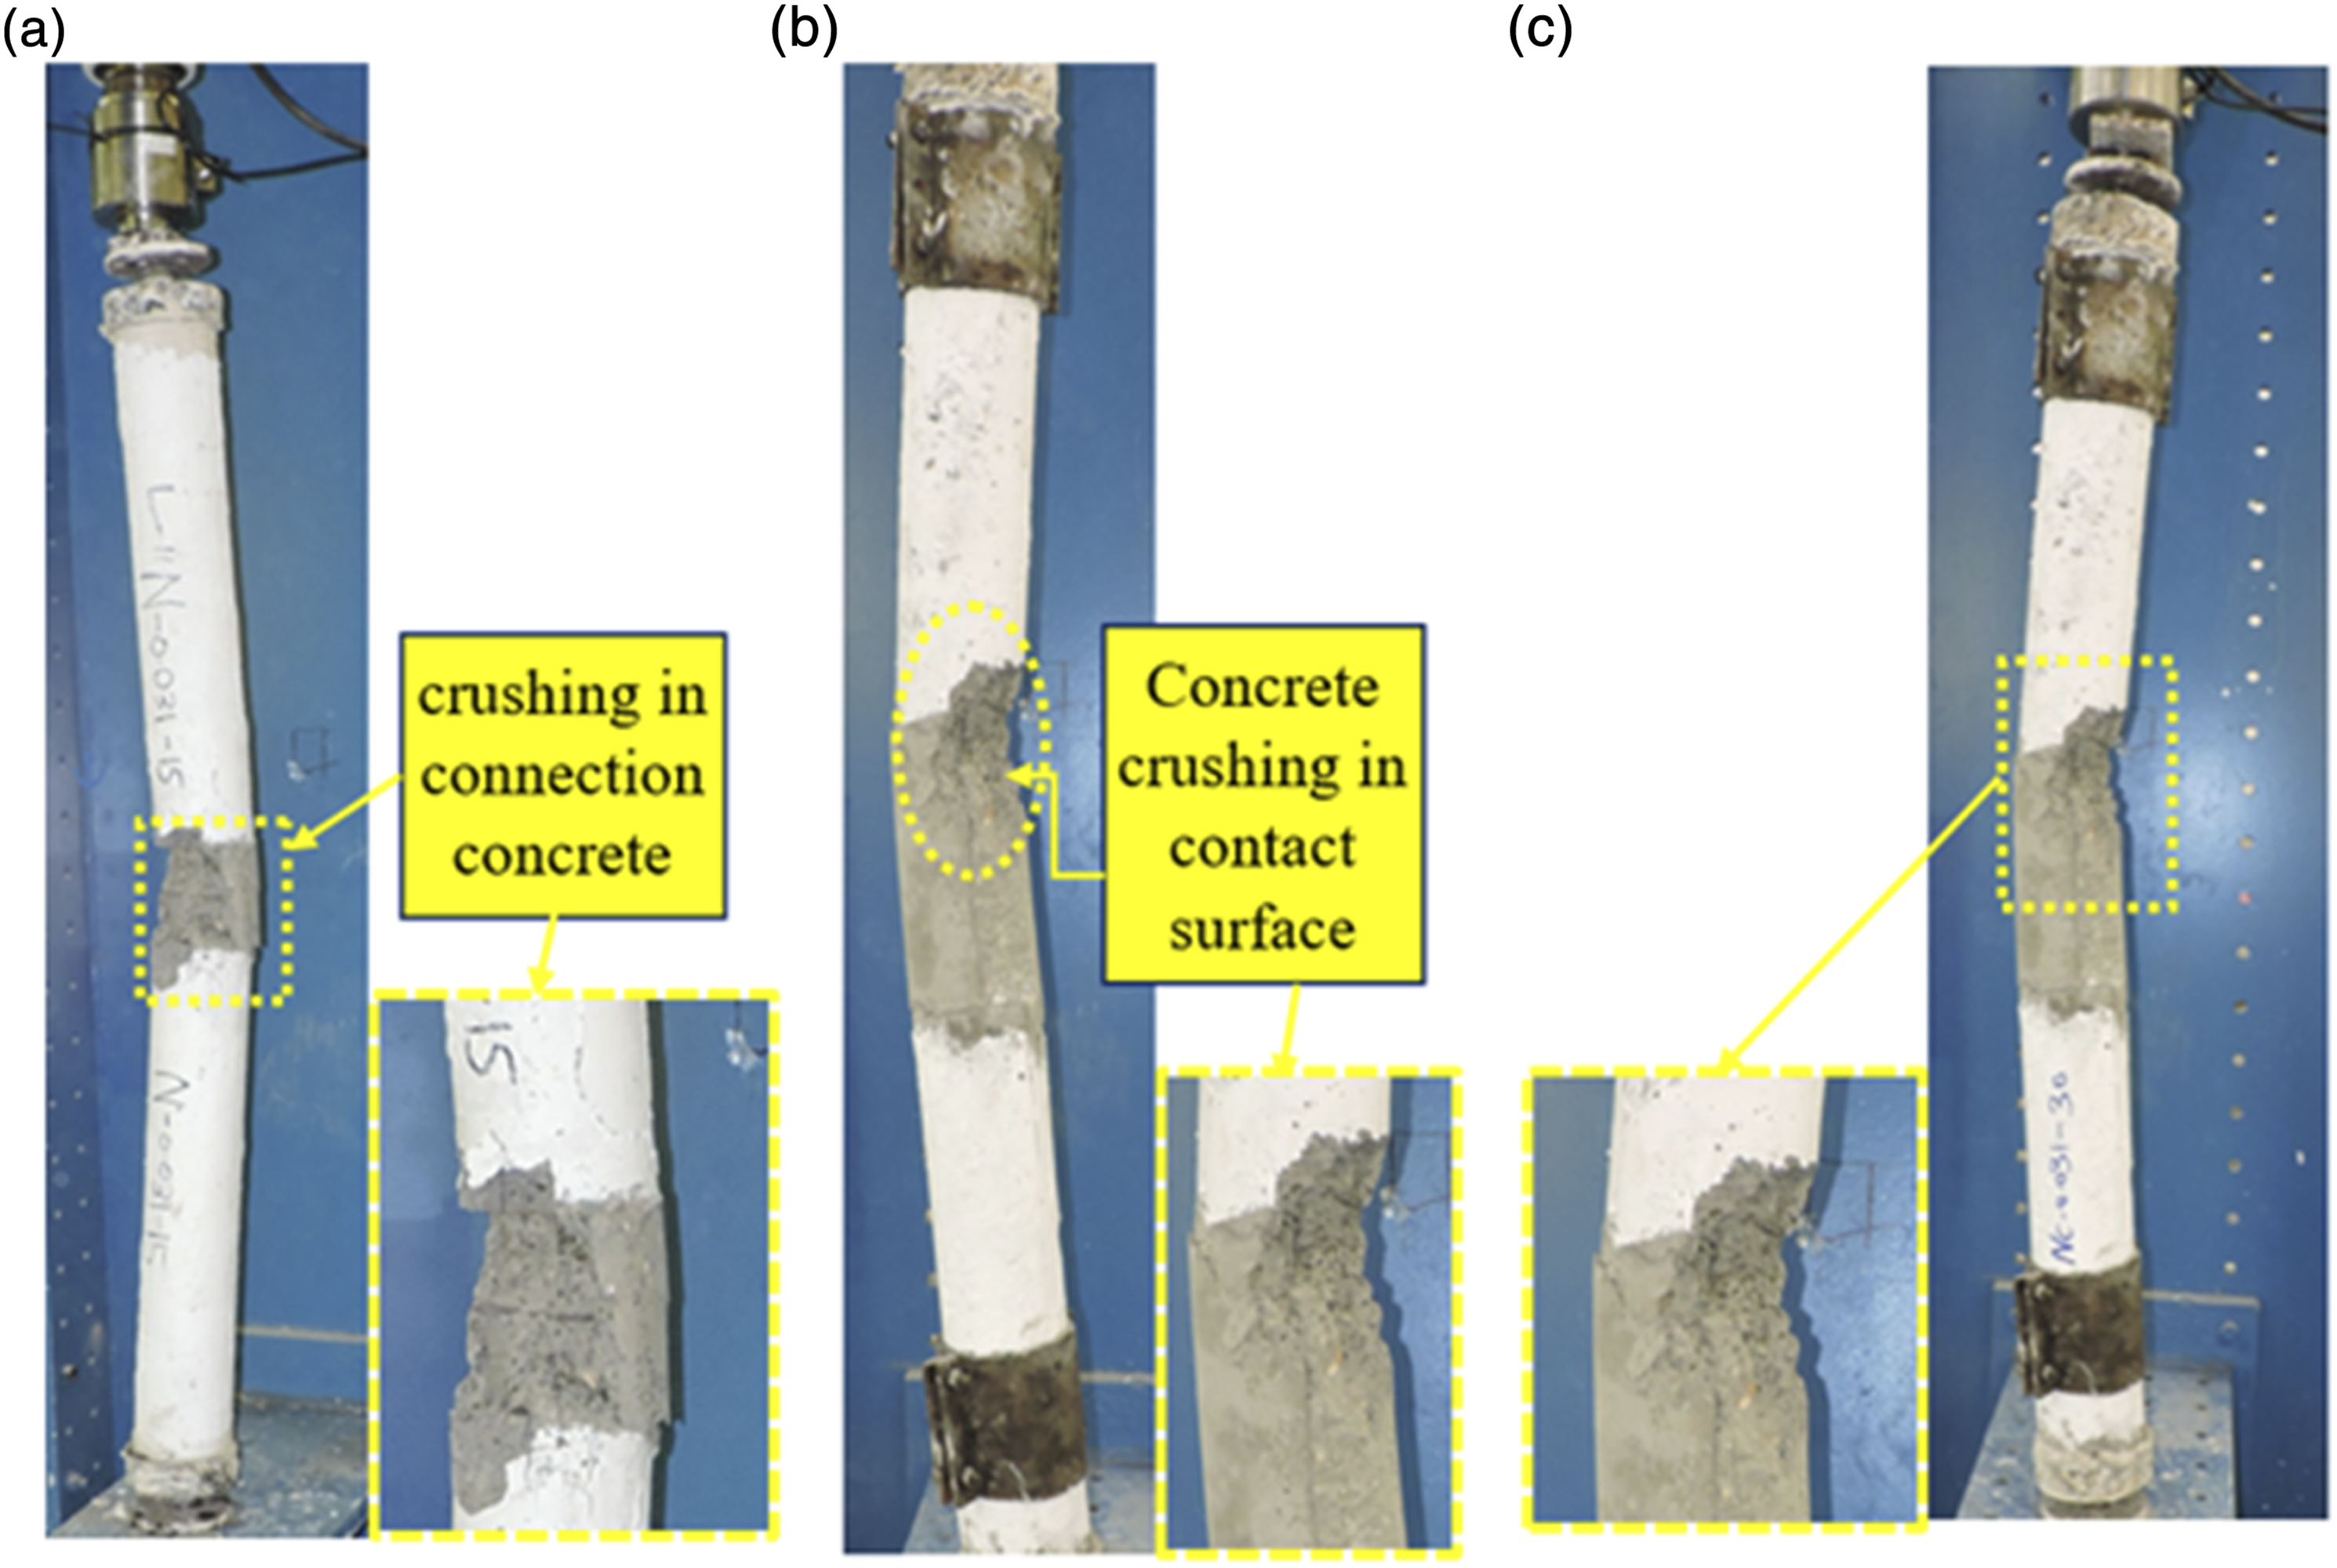
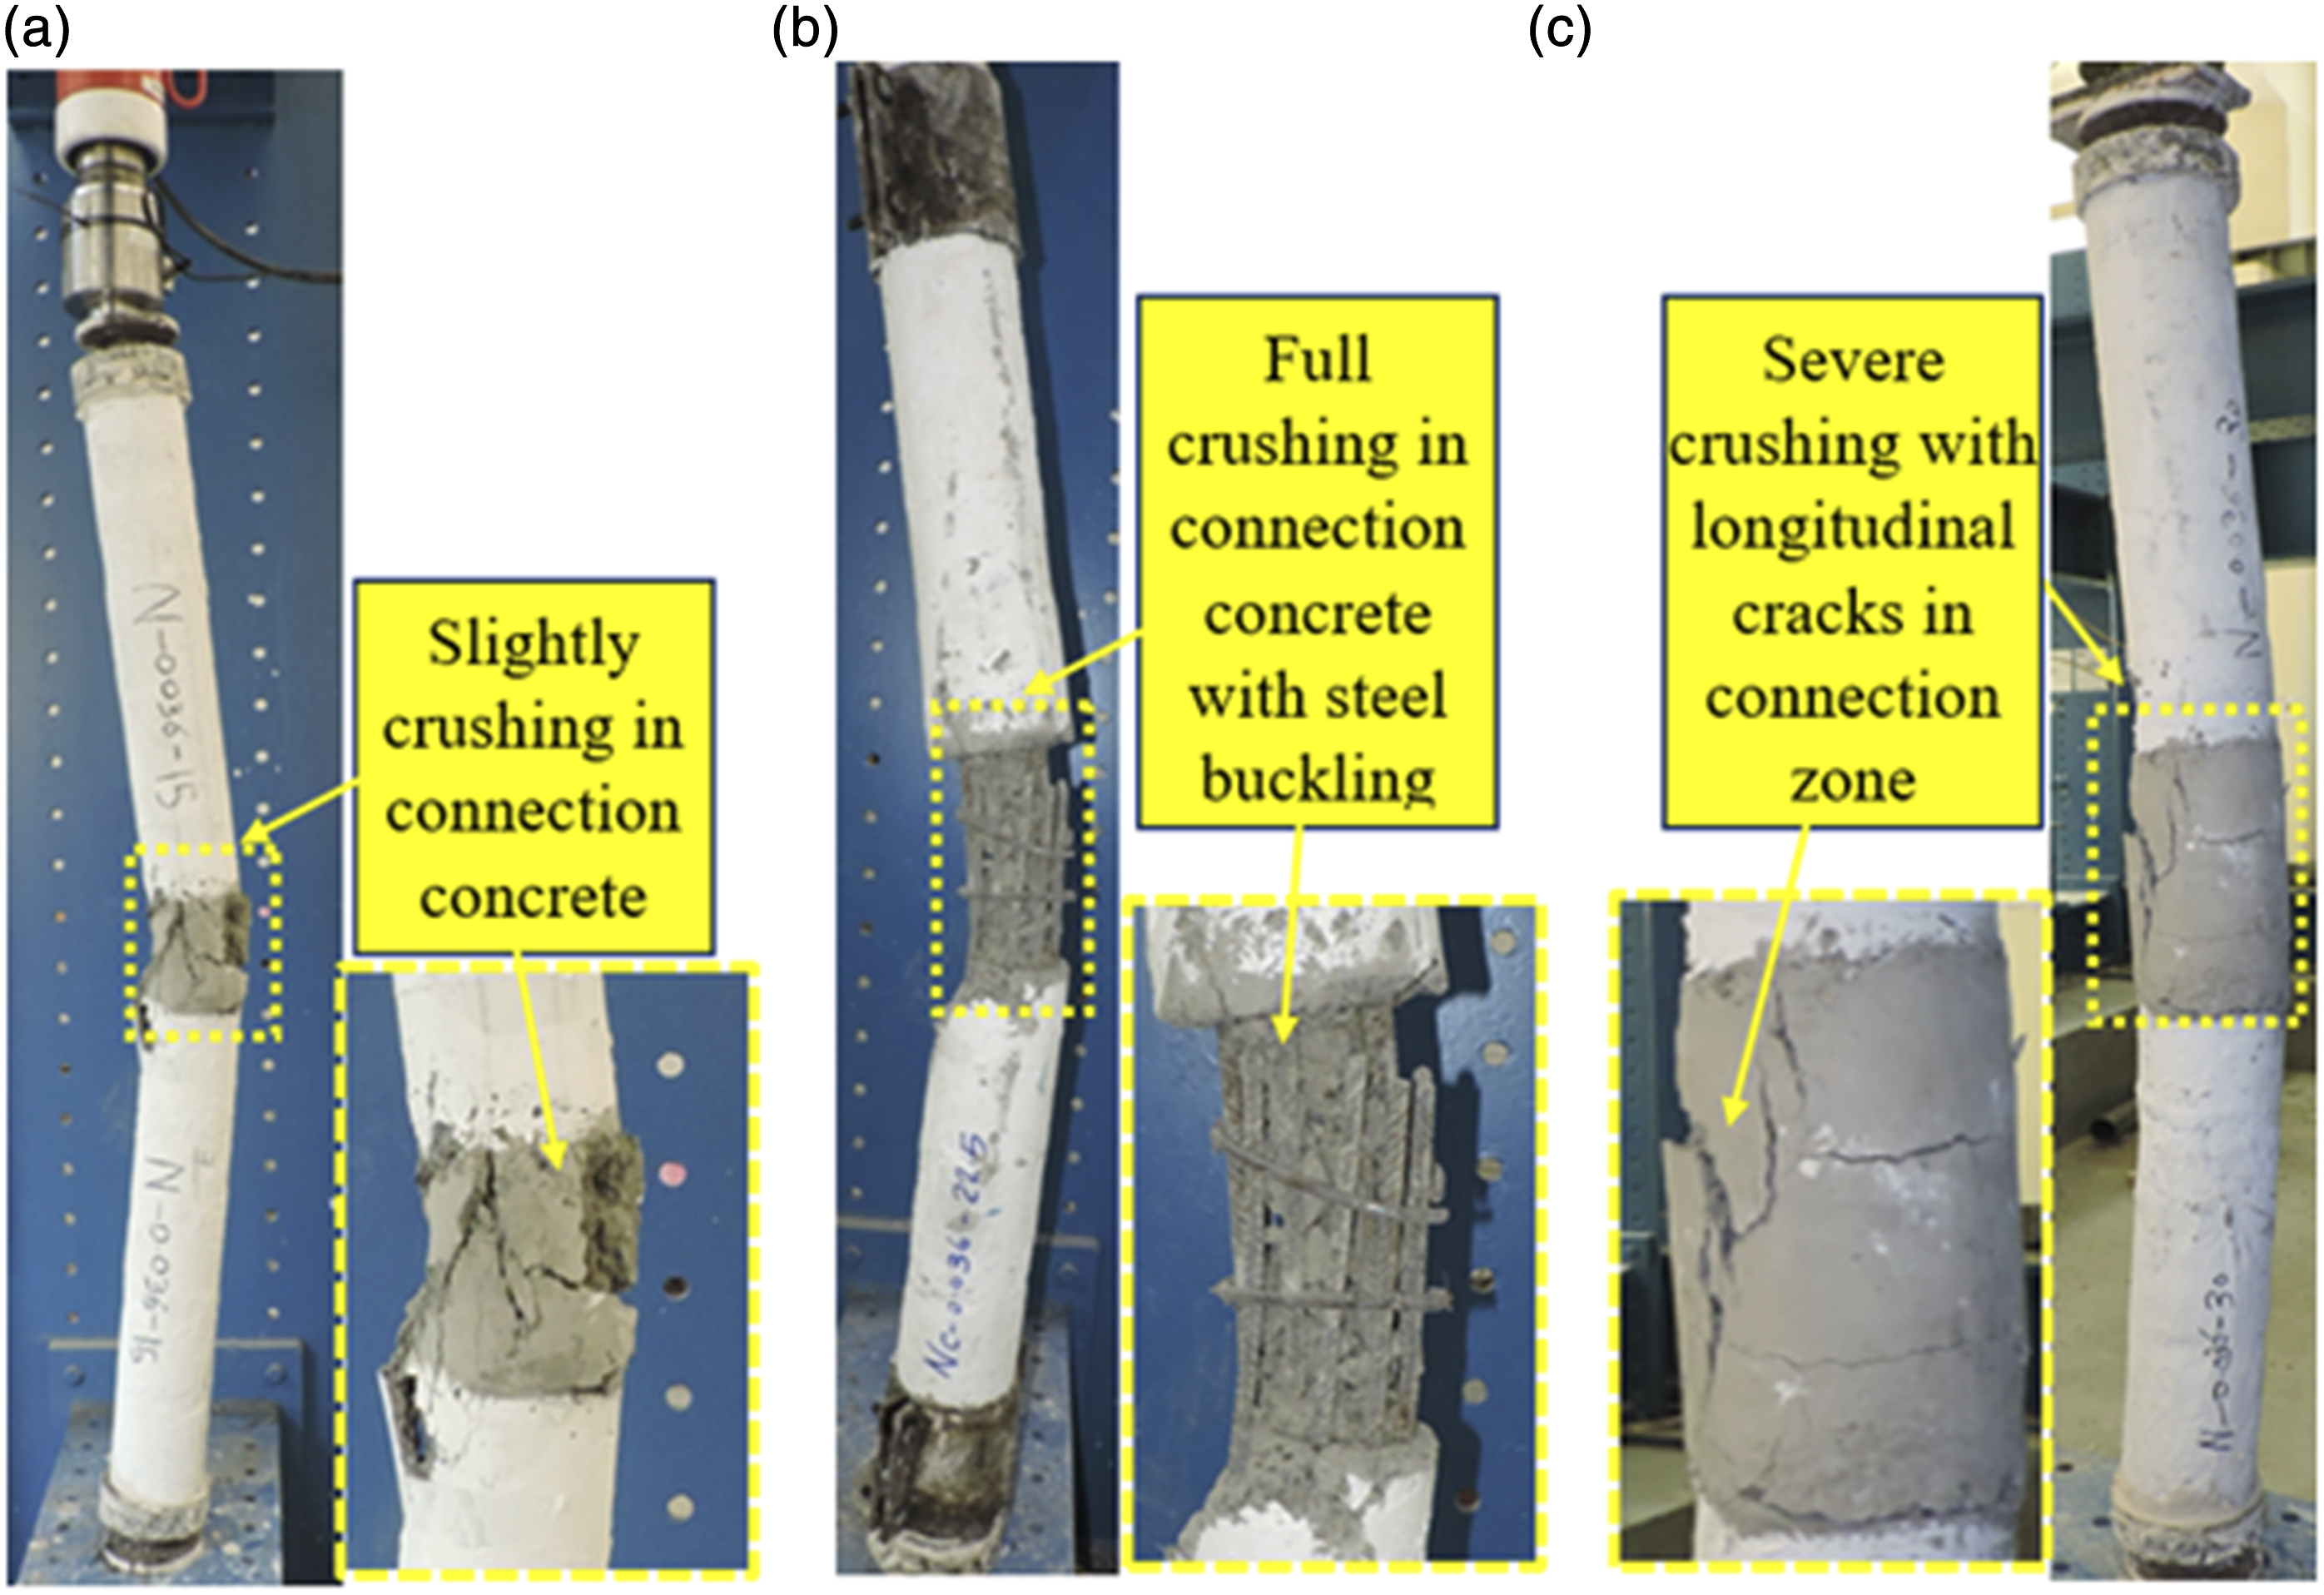
From Figures 7–9, it can be seen that the failure for columns in Groups G1 to G3 were very similar which included the global buckling of the columns associated with concrete crushing at the intermediate connection and buckling of the steel bars for some columns. For column N-0.027-15, the failure was due to the buckling of the steel bars in conjunction with concrete crushing whereas the failure modes seem to be more moderate in column N-0.027-22.5 as compared to column N-0.027-15. The column with the largest embedded length showed a more ductile failure in group G1. A similar trend was observed for columns in other groups. It can be concluded that columns with a higher embedded length will exhibit a more ductile failure compared to columns with smaller embedded lengths. The ductile failure mode results in the increase of the ultimate load of the column as can be seen from Table 2.
Load-lateral displacement curves
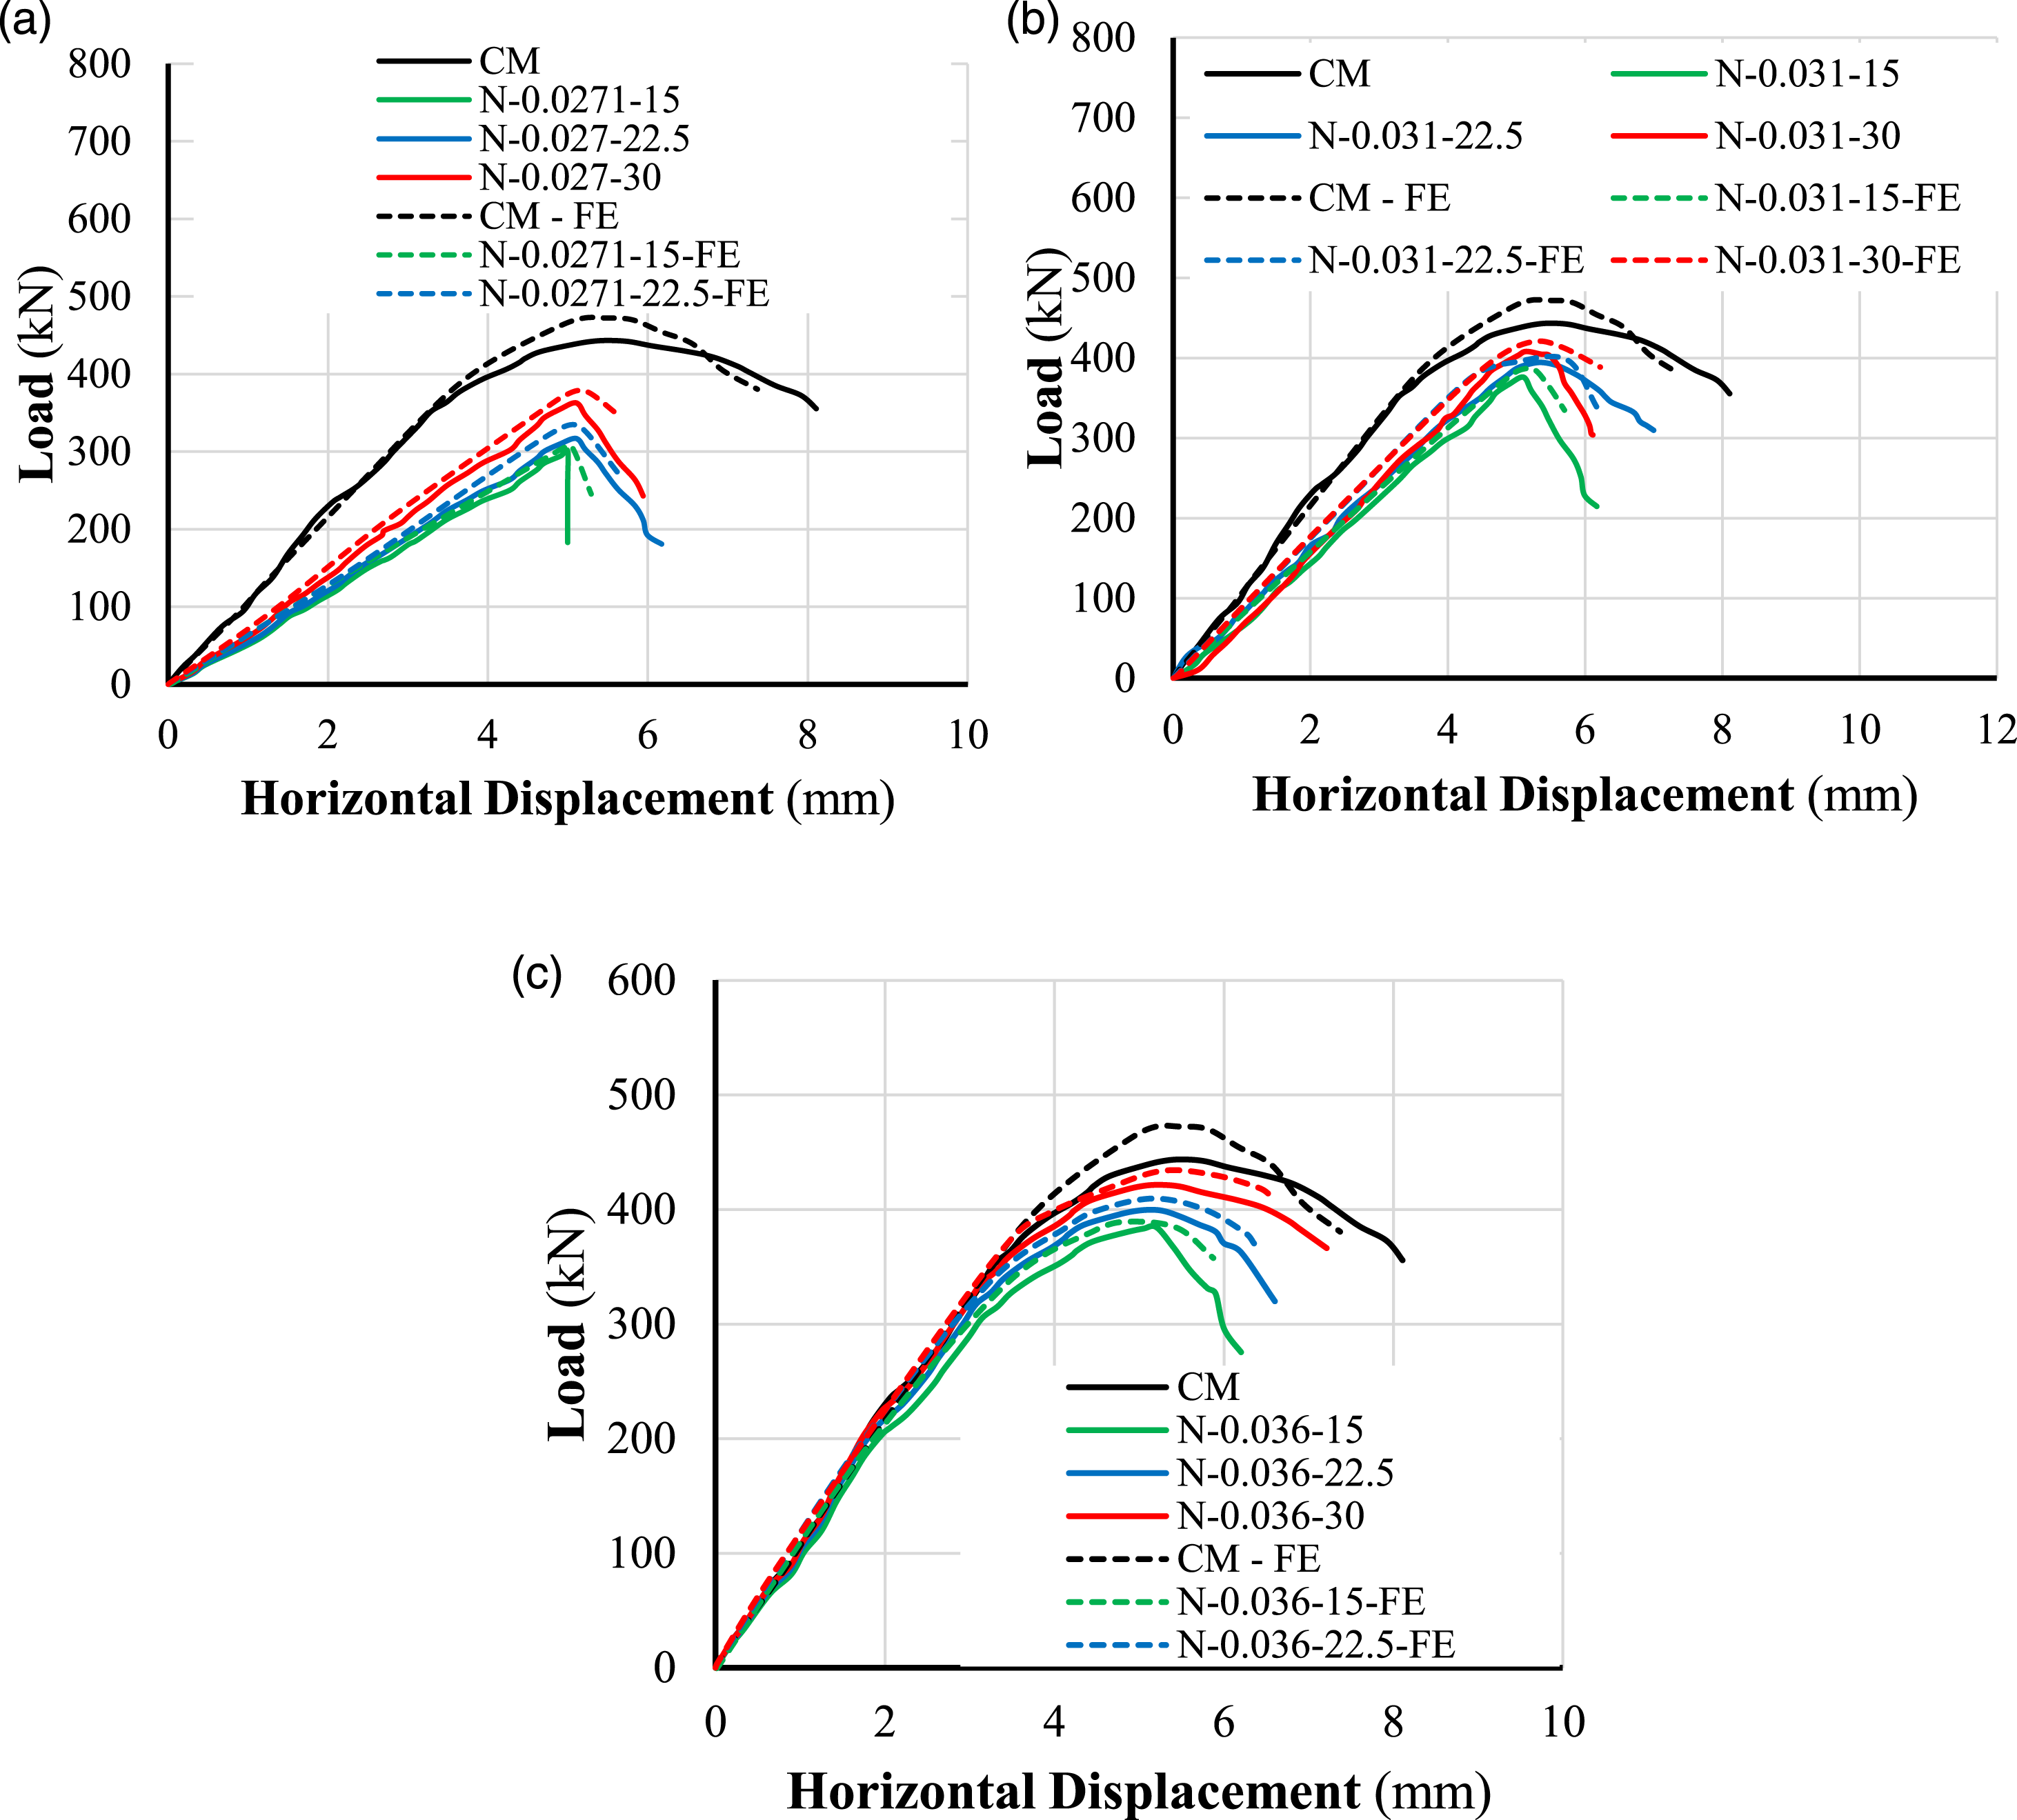
Figure 10 depicts the measured load-lateral displacement curves of the columns in Groups G1-G3. The experimental data demonstrate that increasing embedded length has a remarkable effect on the load-to-displacement curves of the columns. Columns with a lower reinforcement ratio exhibited poor ductility compared to the columns with a higher reinforcement ratio. However, for the same reinforcement ratio of the tested columns, the embedded length of the connection has moderate effects on the initial stiffness of the columns. As can be seen from Figure 10, the columns in Group G3 show the best ductility when compared with the columns with intermediate connections from other groups. The load-lateral displacement plots for the tested columns: (a) Group G1, (b) Group G2, and (c) Group G3.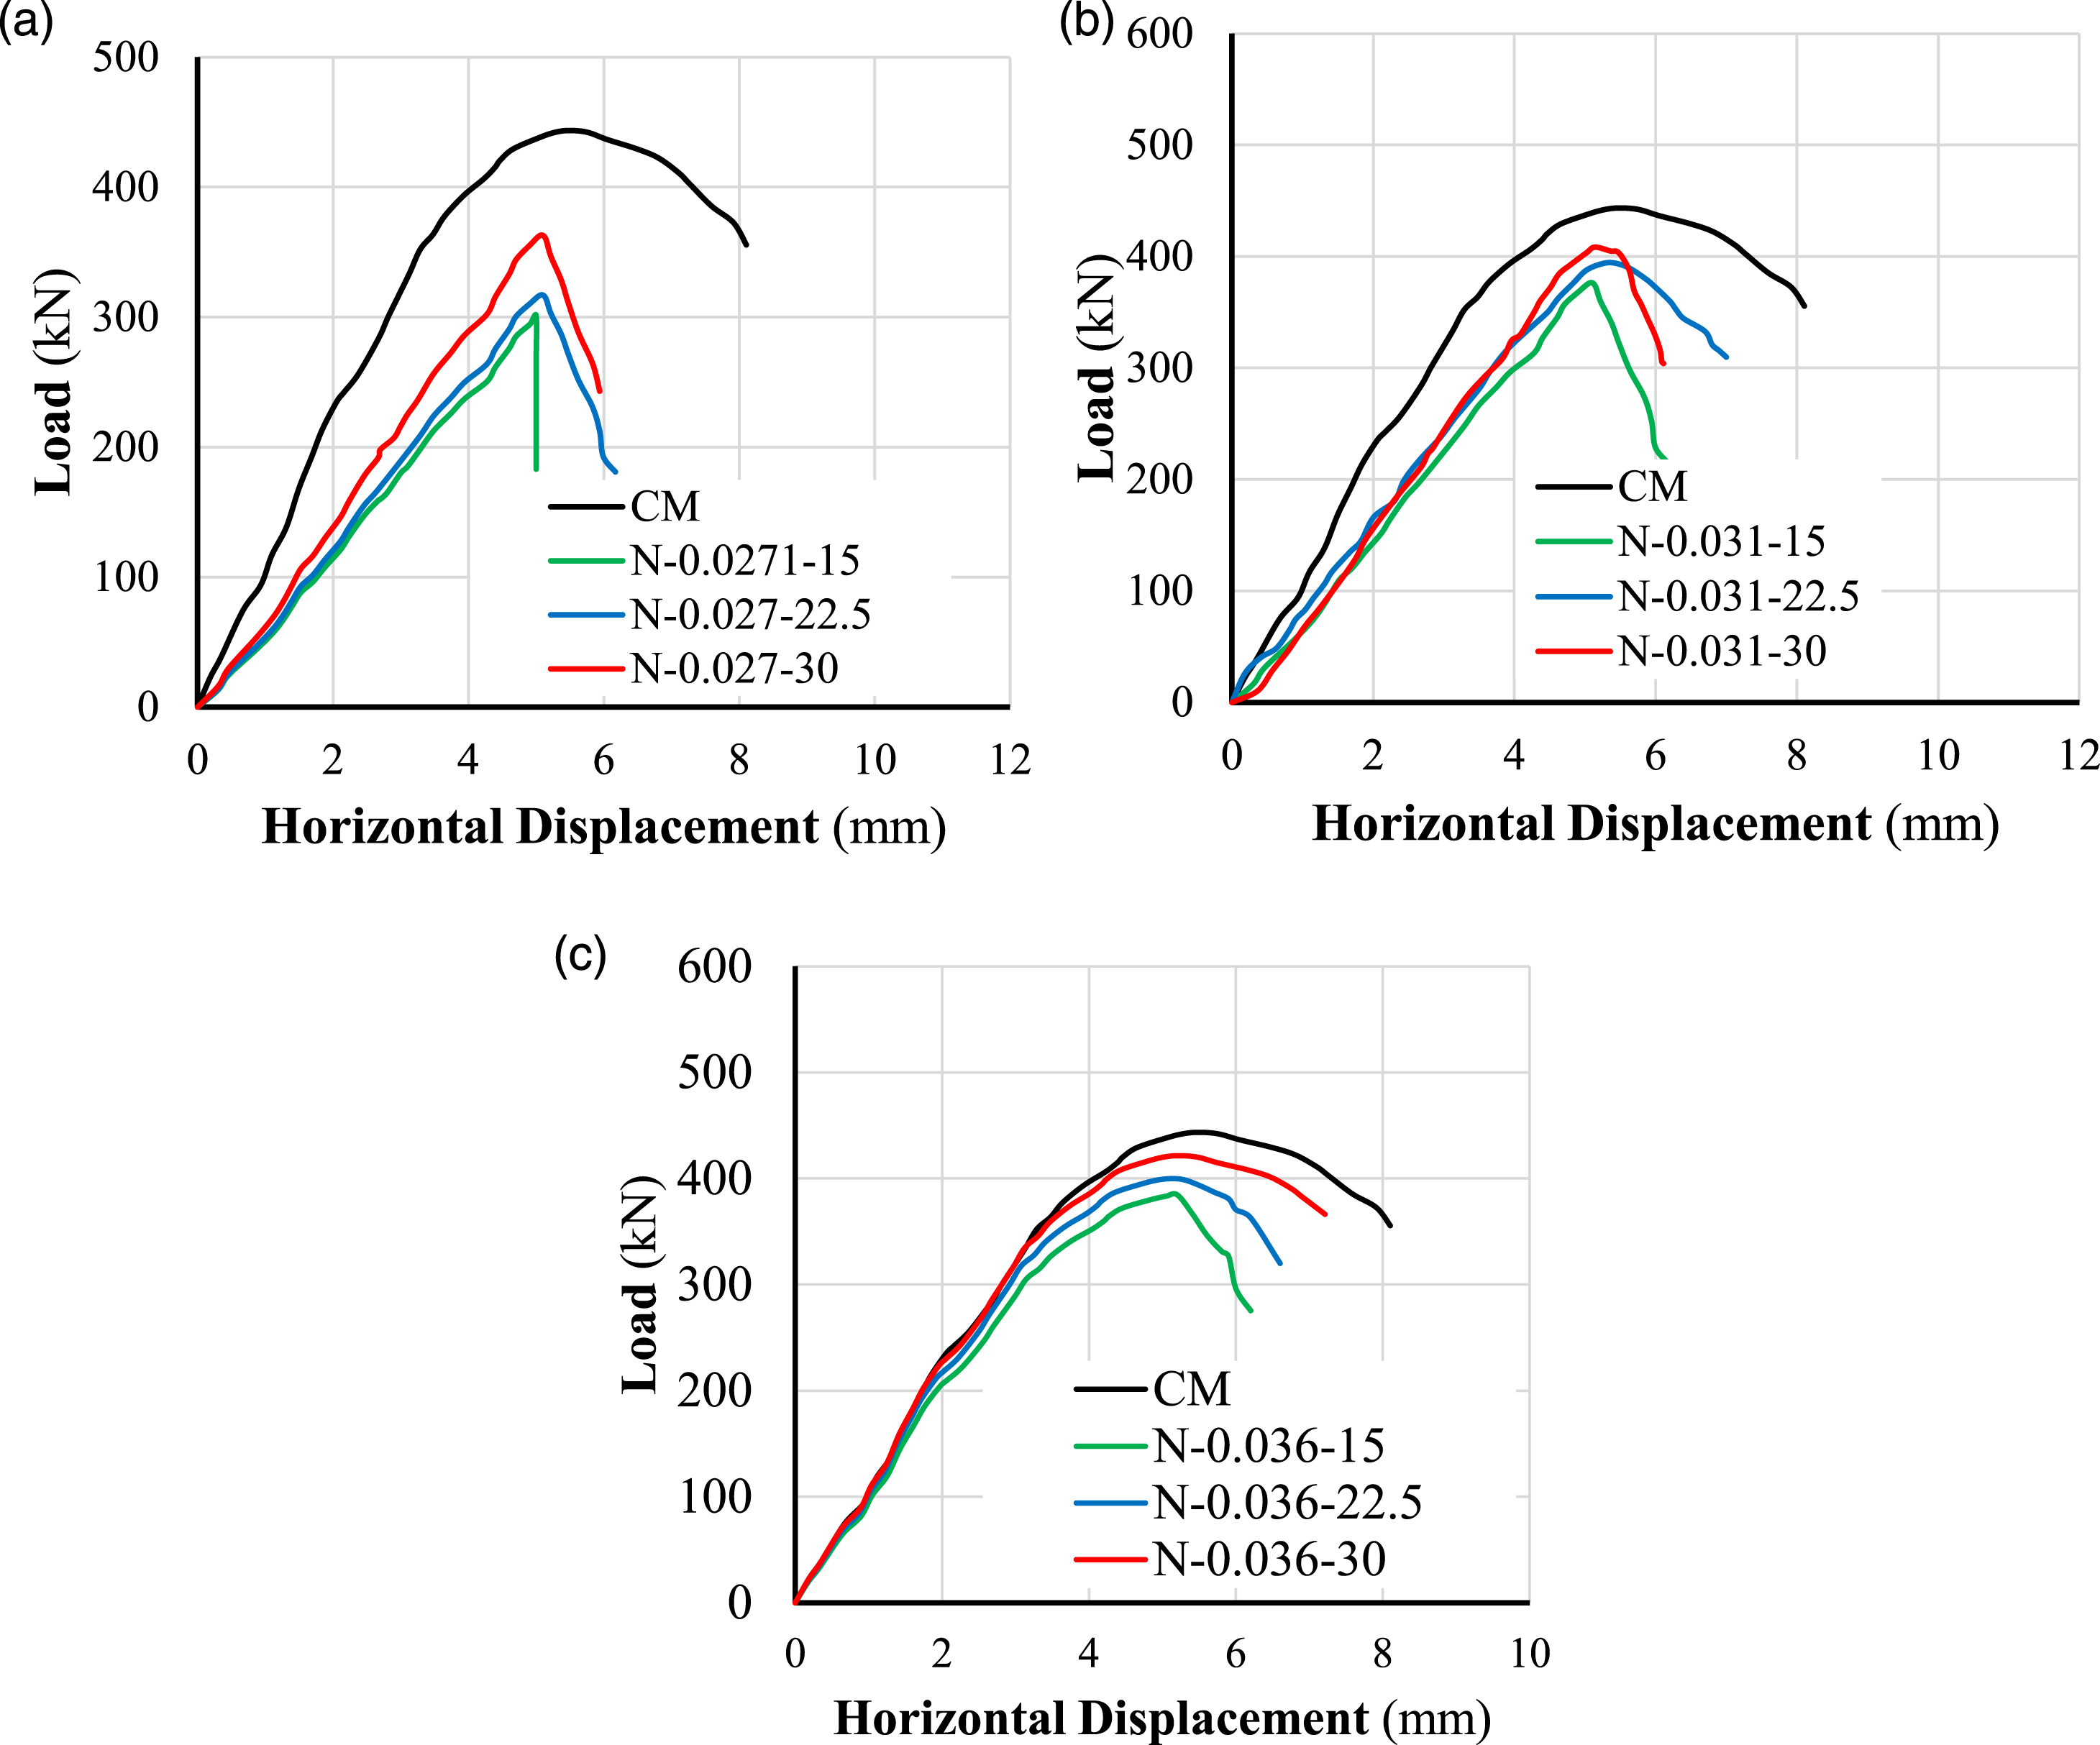
Cracking and ultimate loads
According to the experimental data, column CM had a higher cracking and ultimate load than any other columns tested. Among all tested columns with an intermediate connection, columns in Group G1 had the smallest cracking and ultimate load when compared to columns in Groups G2 and G3. For the same embedded length, the cracking and ultimate load of N-0.031-15 was 7% and 20% higher than column N-0.027-15, respectively. Similarly, the cracking and ultimate load of N-0.036-15 was 23% and 23% higher than column N-0.027-15. The higher load can be attributed to the increase in the reinforcement ratio of the columns. On the other hand, for the same reinforcement ratio, increasing the embedded length increased the cracking and ultimate load of the tested columns. For example, the cracking of columns N-0.027-22.5 and N-0.027-30 are 11% and 14% higher than the column N-0.027-15, respectively. Similarly, the ultimate load of columns N-0.027-22.5 and N-0.027-30 are 5% and 14% higher than the column N-0.027-15, respectively.
Elastic stiffness and energy absorption capacity
The elastic stiffness and absorbed energy of the tested columns were calculated for comparison purposes. The elastic stiffness (K) was calculated as the initial slope of the elastic part of the load-deflection curves of the tested columns. The absorbed energy (E) of the tested columns was calculated as the total area under the load-lateral displacement curves. According to the experimental data given in Table 2, the control specimen CM had the highest stiffness index and aborted energy compared to all the precast tested columns. However, for columns with an intermediate connection, columns in Group G3 exhibited the highest stiffness index and aborted energy compared to the columns in Groups G1 and G2. It is evident that increasing the reinforcement ratio and the embedded length of the column increases the stiffness index and aborted energy of the precast columns.
Finite element modeling
In this section, a numerical model using a non-linear three-dimensional (3D) Finite Element Method (FEM) was developed, The numerical results were compared with the experimental ones to confirm the accuracy of the FEM results. FEM software ABAQUS was utilized for the numerical simulation.
The Concrete Damage Plasticity (CDP) model was utilized to model the concrete portion of each column. The CDP model requires the user to provide several parameters for analysis purposes (Hamoda et al., 2022, 2023b). After several trials, the parameters related to CDP models namely dilation angle (ψ), flow potential eccentricity (e), the ratio of biaxial to uniaxial compressive stresses (f
bo
/f
co
), the ratio of the second stress invariant on the tensile to compressive meridian (K
c
), and viscosity relaxation parameter (μ) were chosen as 28°, 0.1, 1.16, 0.66 and 0, respectively. In the meshing, a continuum 3D eight-node linear hexahedral solid element reduced integration element (C3D8R) was selected to mesh NC and rigid supporting/loading steel plates. For meshing the steel bars, a two-node and linear truss element (T3D2) was selected (see Figure 11). Through mesh convergence/sensitivity analysis, the mesh size of 25 mm provided optimum results with minimum computational time. The uniaxial stress-strain laws for NC were calibrated and adapted based on experimental tests in order to be employed for numerical modeling as shown in Figure 3. Finite element modeling of concrete columns with and without an intermediate connection: (a) Solid NC, (b) precast column with intermediate connection, (c) assembled model.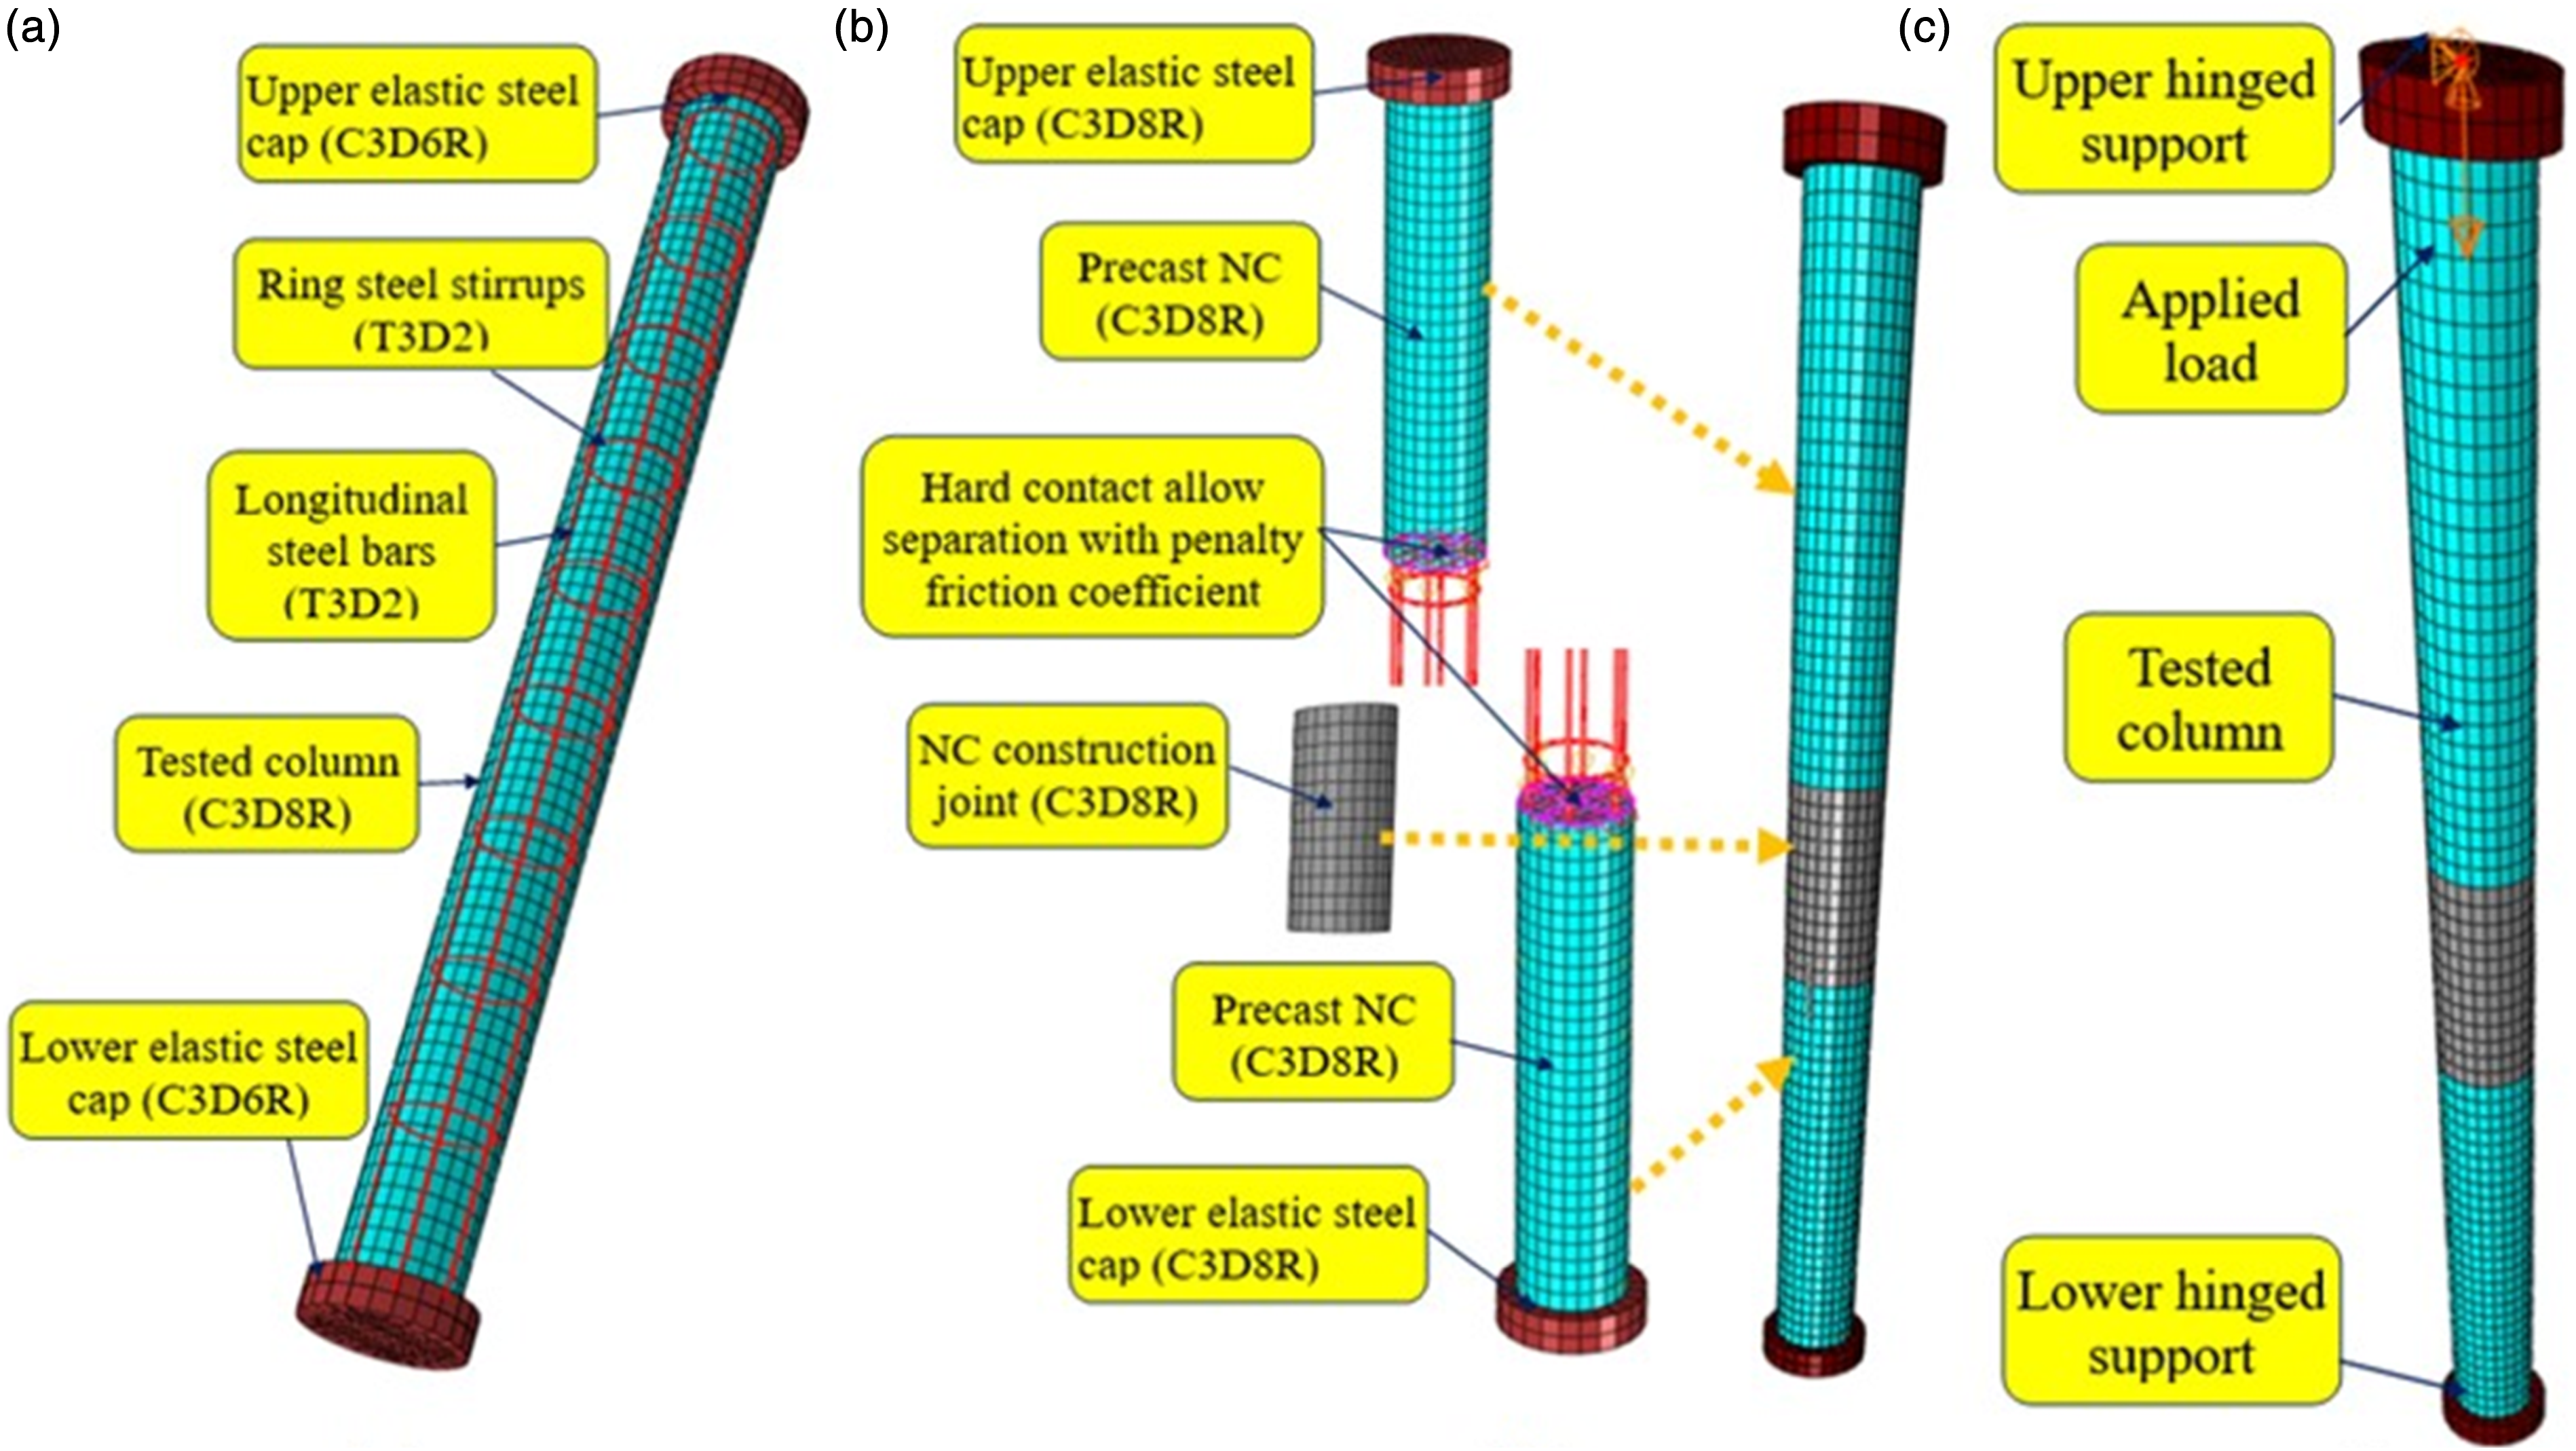
In simulating RC slender columns, initial imperfections should be considered (Aristizabal-Ochoa, 2013; Harvey Jr. and Cain, 2020; Mahmoud, 2022; Tomski and Podgórska-Brzdękiewicz, 2011). A number of trials with several initial imperfections including L/1000, L/900, L/800, L/700 L/600, L/500, and L/400 at the mid-height were conducted. It was found that the initial imperfection of L/400 provides acceptable results therefore accepted for analyzing all tested columns.
The bond between the steel bars and the two NC parts was assumed to be perfect. The interaction between the steel bars and the two NC parts was modeled as Embedded interaction. The concrete column was modeled as the host zone while the bar truss elements were modeled as the embedded elements. Rigid circular caps were modeled as the support and load was applied through the caps as shown in Figure 11. The supports at the two ends were defined as roller support at the top surface allowing vertical movement, while the lower one was modeled as a hinged one.
The interaction between reinforcing steel bars embedded in NC connection was modeled using the Eligehausen technique (Eligehausen et al., 1982). Tie surface-to-surface constraint was assumed between the NC intermediate connection and the two precast NC panels. The outer circular surfaces of the NC connection were defined as the slave whereas the other opposite circular NC surfaces were defined as the master surface. A penalty friction coefficient of 0.06 was defined to allow separation. The tested stress-strain relationships of steel bars were idealized as shown in Figure 4 and adopted in numerical modeling.
Model validation
The validation of the FEM is performed by comparing the experimental and numerical results. The predicted crack patterns and failures for the columns CM, N-0.036-15, and N-0.031-30 are compared with the actual test observation as shown in Figure 12. It can be seen that the predicted results using FEM are in good agreement with the test results. For instance, FEM can reasonably predict the failure zone of the control column CM as can be seen in Figure 12. When it comes to columns N-0.036-15, and N-0.031-30, the predicted failure pattern is very similar to what was observed during the test. Furthermore, Figure 13 depicts the comparisons of the predicted load-lateral deformation responses of the tested columns with the measured ones. The predicted load-lateral deformation curves show good agreement with the measured ones. Crack pattern and plastic stress distribution: (a) for NC master column CM, (b) Column N-0.036-15, and (c) Column N-0.031-30. Comparing the load-displacement responses: (a) Group G1, (b) Group G2, and (c) Group G3.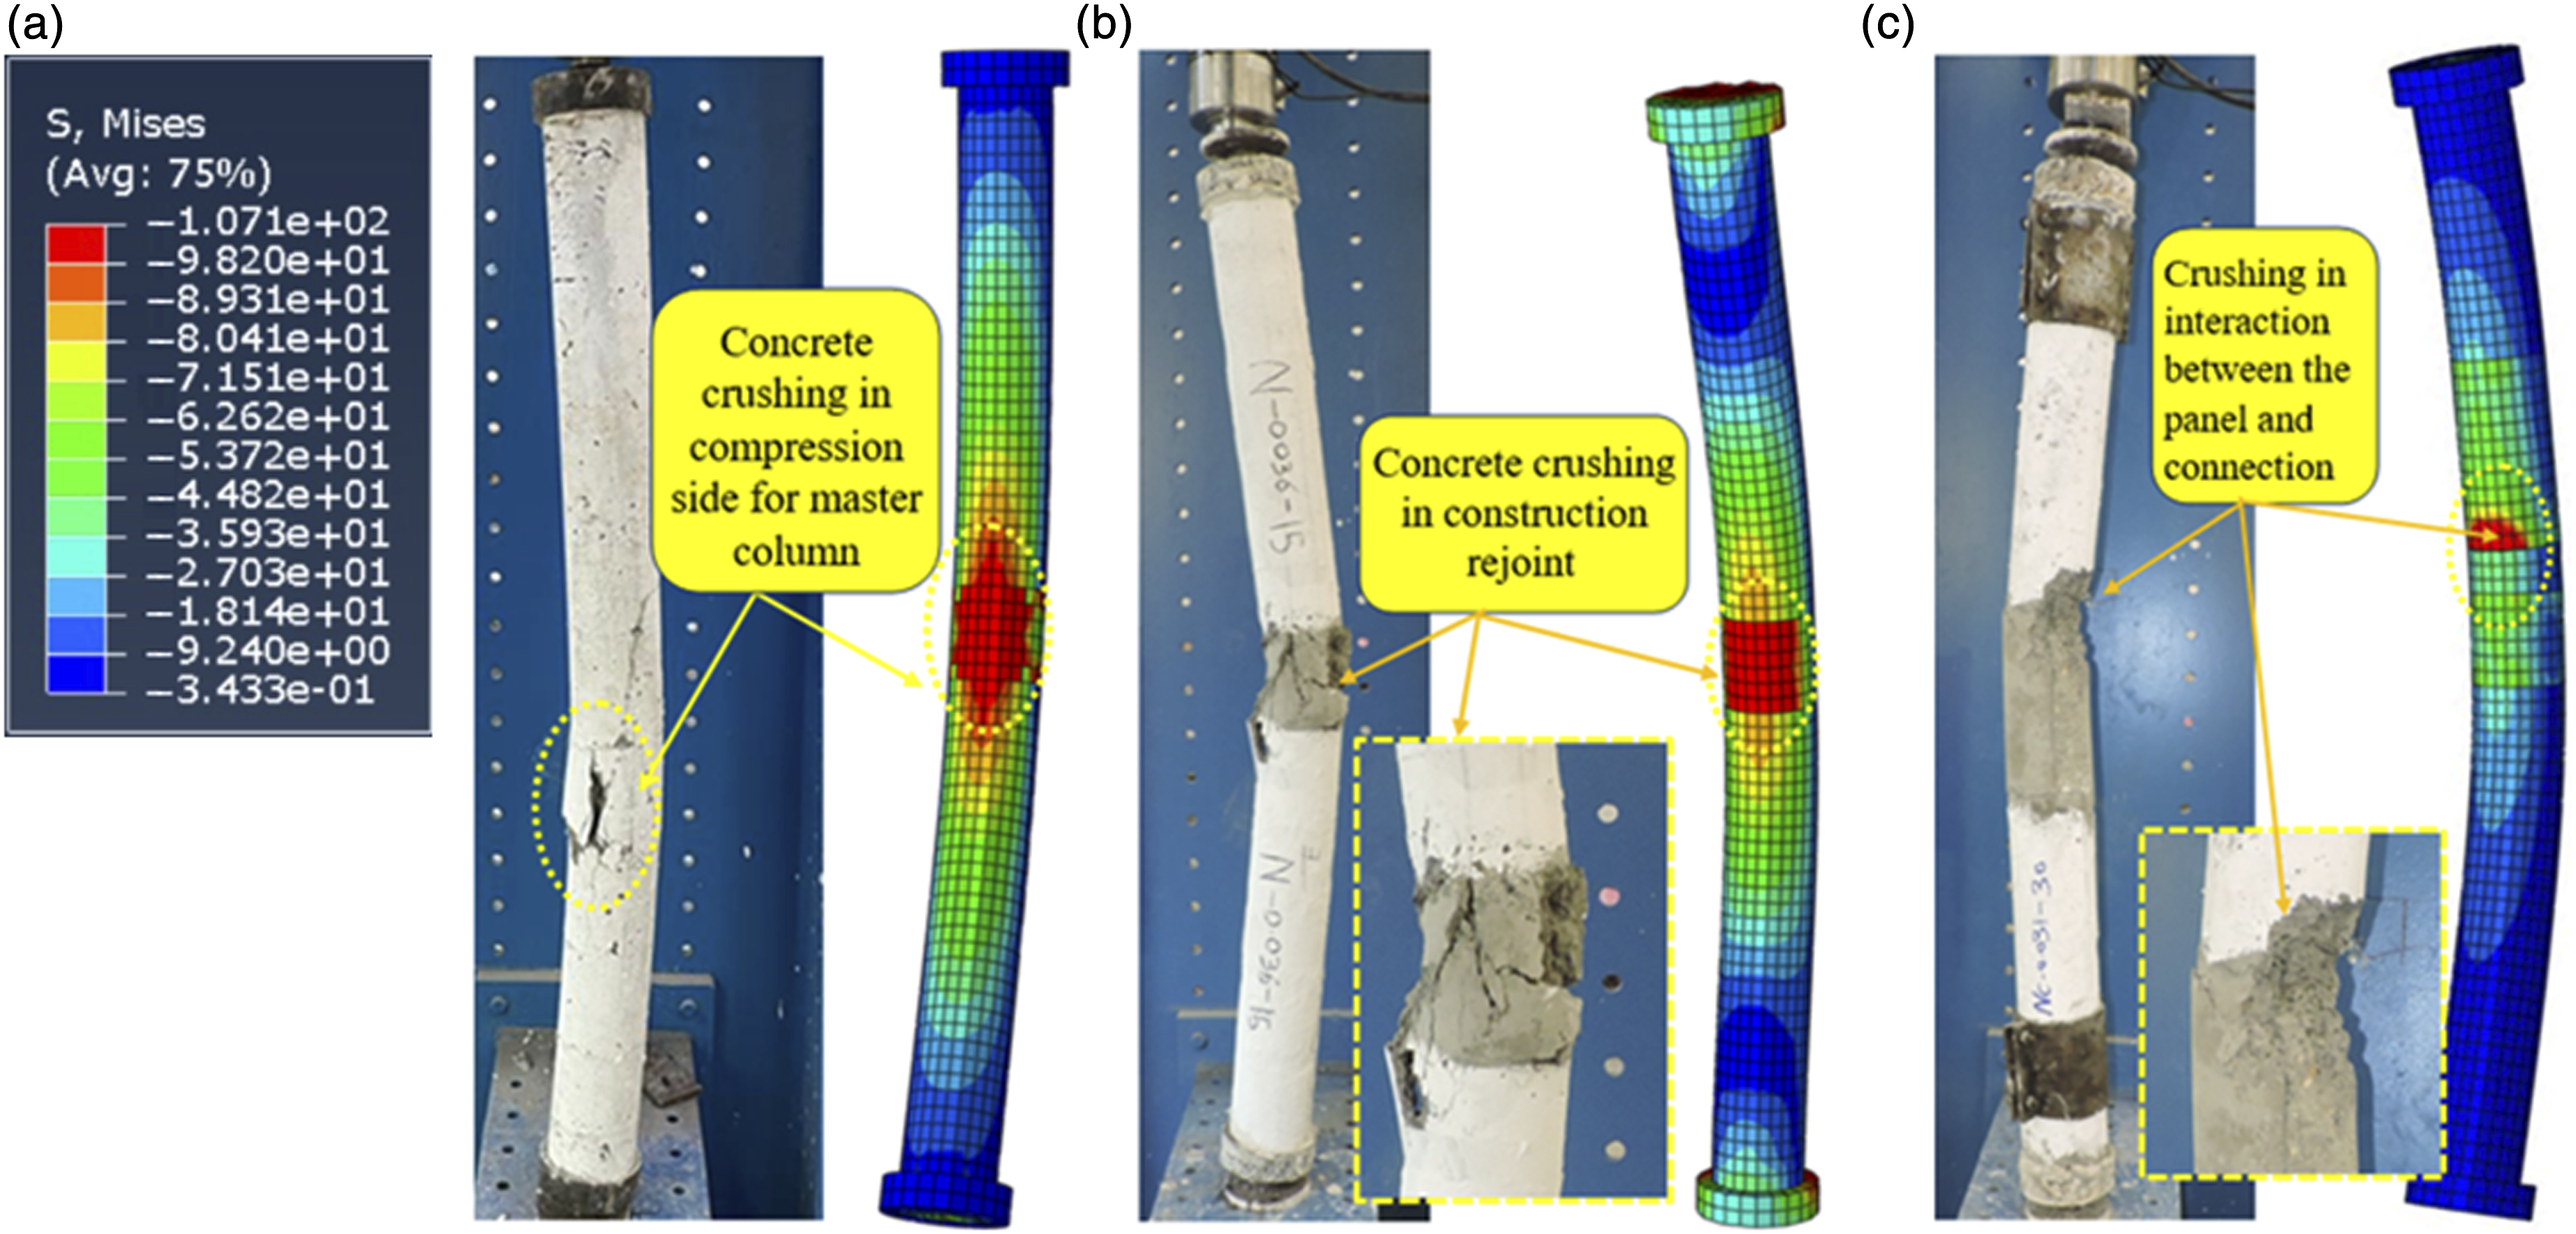
Validation of the FEM by comparing with the experimental results.
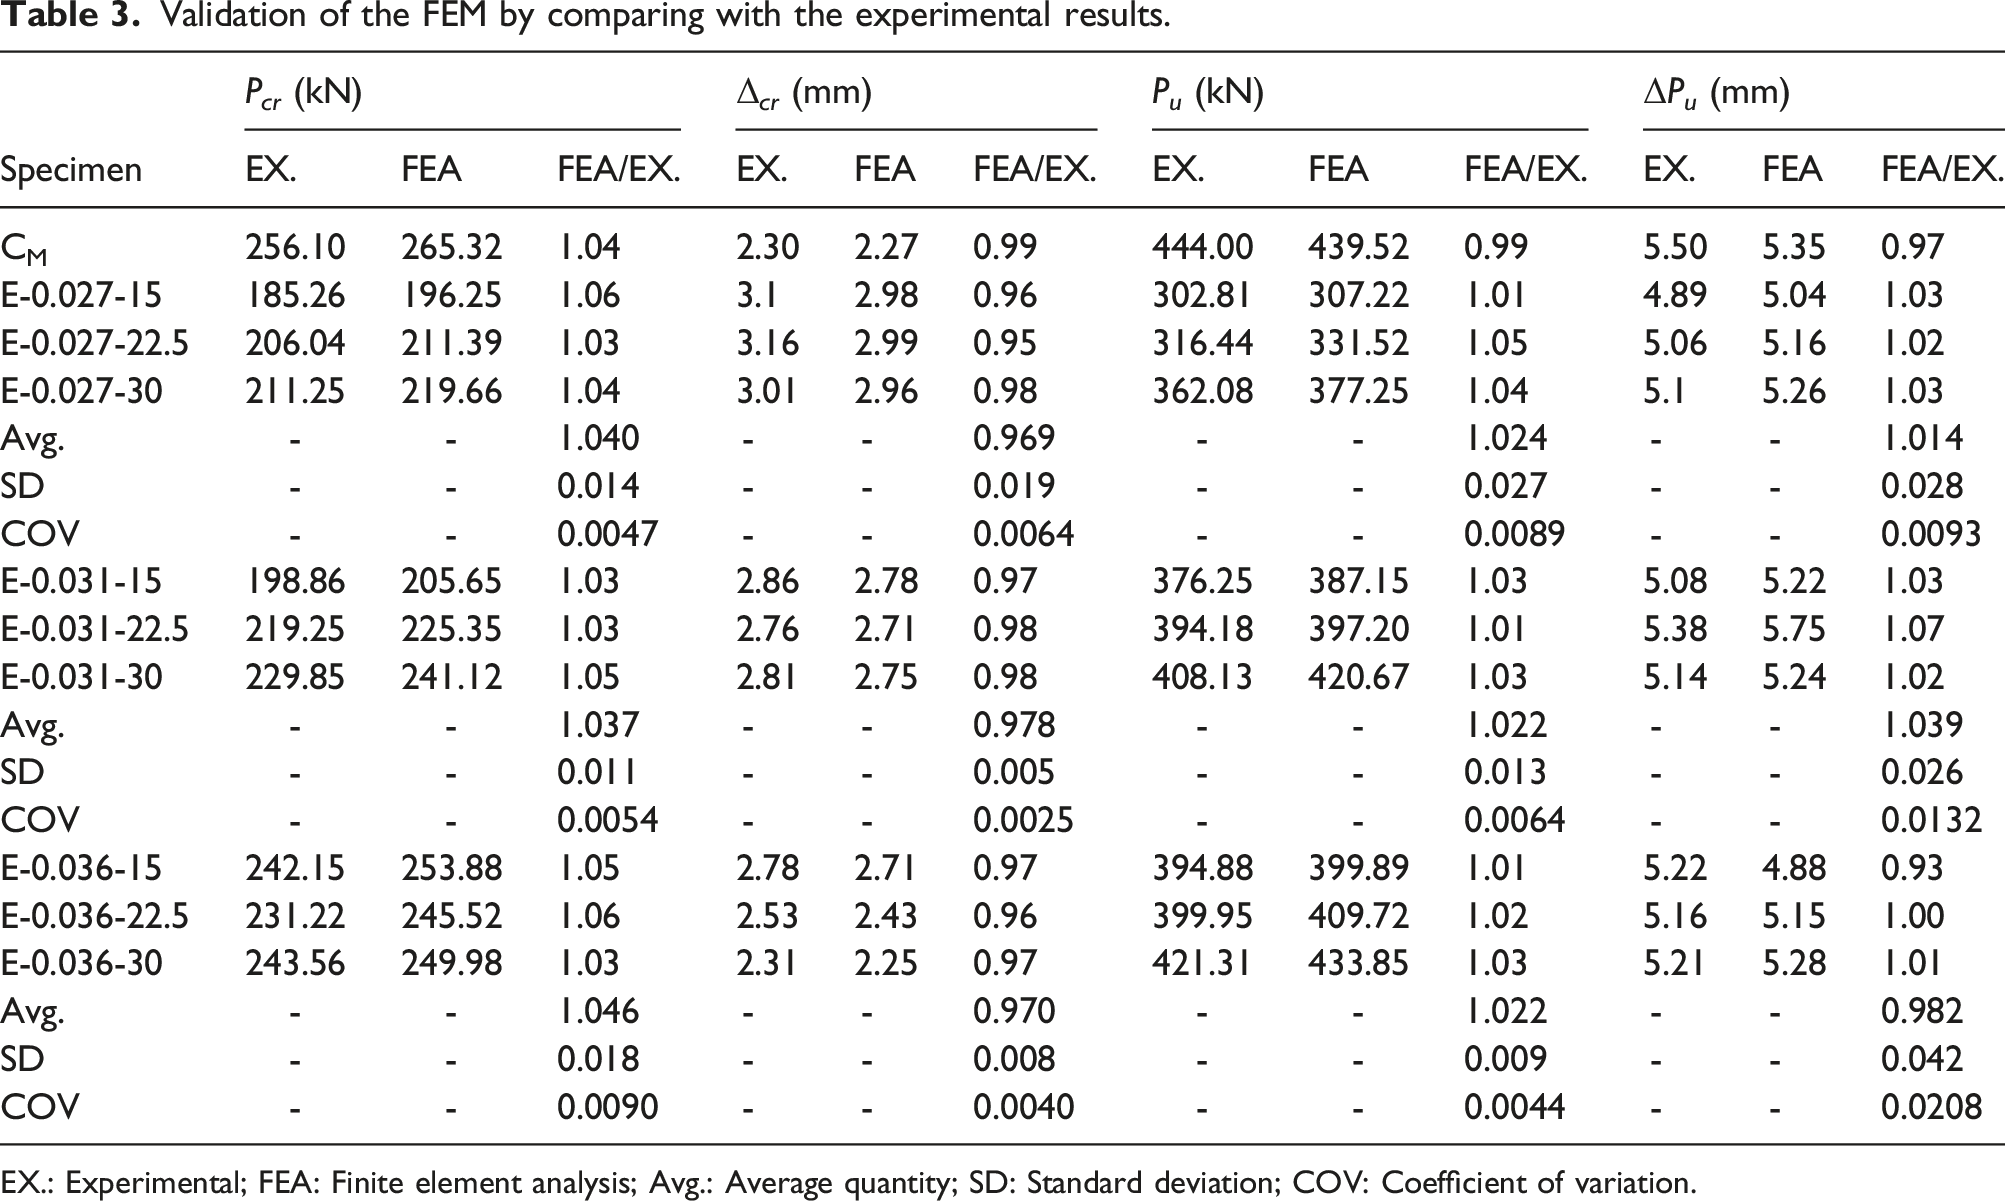
EX.: Experimental; FEA: Finite element analysis; Avg.: Average quantity; SD: Standard deviation; COV: Coefficient of variation.
Conclusions
In this paper, the axial performance of PC slender columns with intermediate connection is investigated. Tests on nine PC columns and one solid RC column are carried out subjected to axial compression to study the effects of longitudinal reinforcement ratio (ρ), and embedded length of steel bars (Lb). A finite element model using ABAQUS is also developed to simulate the performance of precast columns experimentally observed.
Test results show that the axial performance of PC slender columns is influenced by their reinforcement ratio and the embedded length of the intermediate connection. Although all the columns had a lower cracking load and ultimate load than the control solid RC column, columns in Group G3 with a reinforcement ratio of 0.036 achieved a cracking and ultimate load which is close to the control column. It is found that increasing the reinforcement ratio and the embedded length increases the cracking load, ultimate load, stiffness index, and energy absorption capacity of the PC columns with an intermediate connection. The developed FEM is validated against the test results by comparing the predicted failure modes, load-lateral displacement curves, cracking, and ultimate loads with the ones obtained from the test results. It is found that the proposed FEM can reasonably simulate the axial performance of PC slender columns with an intermediate connection experimentally observed.
Footnotes
Acknowledgements
The authors would like to acknowledge the first author for personally funding this research project and are extremely grateful to the lab technicians at Kafrelsheikh University for their help during the tests. The authors would also like to express their thanks to the researchers of King Saud University in Riyadh, Saudi Arabia for their invaluable support under project number RSP2023R343.
Declaration of Conflicting Interests
The author(s) declared no potential conflicts of interest with respect to the research, authorship, and/or publication of this article.
Funding
The author(s) disclosed receipt of the following financial support for the research, authorship, and/or publication of this article: The authors would like to acknowledge the first author for personally funding this research project and are extremely grateful to the lab technicians at Kafrelsheikh University for their help during the tests. The authors would also like to express their thanks to the researchers of King Saud University in Riyadh, Saudi Arabia for their invaluable support under project number RSP2024R343.