
Abstract
The pre-wall system can be used in the construction of buildings, with multiple advantages in terms of production time and environmental impact. This type of walls is formed by two thin precast concrete panels, linked with steel trusses to create a hollow precast wall module, which are assembled at construction site, adding reinforcement in critical regions, namely, in connections, and casting concrete into the core. Recently, the durability and sustainability of this wall system were enhanced, using a high-durability concrete only in the cover and for the core was used a concrete that combines low cement dosage with lightweight aggregates. This paper presents a study, with both experimental and numerical components, developed to characterize the behaviour of corner connections between two perpendicular pre-walls. The connections between perpendicular pre-walls are must more complex than traditional connections made in situ because the space to define the reinforcement detailing is very limited, making difficult to assure a proper transmission of the internal stresses between the two walls. Different amounts of reinforcement, concretes mixtures and reinforcement detailing were tested. Nine numerical simulations were also performed to further enrich the results discussion. Cracks pattern, deformation, strength and stiffness were analysed. Conclusions are drawn and guidelines are proposed to design this type of connections between pre-walls.
Introduction
Precast concrete is widely used in construction, due to its multiple advantages in terms of production time and quality, environmental impact and economic costs. These benefits are a consequence of production being in controlled environments, with specialized workmanship, automated equipment and with high-quality control. In addition, the prefabrication eliminates a substantial part of the work from construction sites, which nowadays is very important due to lack of manpower in construction. The precast concrete solutions can be adopted for both residential and industrial buildings, as well as for other types of structures.
Prefabricated walls are widely used in construction, both as non-structural and structural elements, the latter designed to resist both vertical and lateral loads (Brunesi and Nascimbene 2017; Seifi et al. 2019; Del Lago et al. 2017). The walls can be assembled with different layouts, respecting the architectural requirements, providing a high degree of prefabrication, up to 60% (Gallo et al. 2021). The prefabricated walls can be used for exterior envelope on a building, for retaining walls or for space division, and can have small or large openings produced at the factory (for electric and hydraulic installations and for doors and windows, respectively), reducing the work at construction site (Yu et al. 2019). Most precast walls are monolithic, made with one type of concrete and are used to support the slabs and walls placed above, i.e., loads applied in its plan. The precast walls have limited dimensions due to practical reasons, mainly related with transportation and handling, and frequently require high-load equipment. So, it is necessary to create connections between walls, a discontinuity that does not exist in concrete solutions made in situ.
This study is focused on the pre-wall system, which consists in two thin precast concrete panels, linked together and spaced with steel trusses, creating this way a hollow precast wall module (Figure 1(a)). These hollow walls have a substantial weight reduction, comparatively to monolithic walls, allowing to reduce both transport and craning costs. The pre-walls are assembled at the construction site, placing reinforcement in critical regions and casting concrete into the core (Figure 1(b)) (EN 14992 2007, CTSTB 2015). Besides its reduced weight, this system holds several other advantages compared to walls produced in situ: it is faster and cleaner to build, and it reduces drastically the need for formwork at construction site, since the pre-walls are used as collaborative formwork. Pre-wall system: (a) pre-wall made with UHDC; (b) casting the concrete core; (c) corner connection between pre-walls.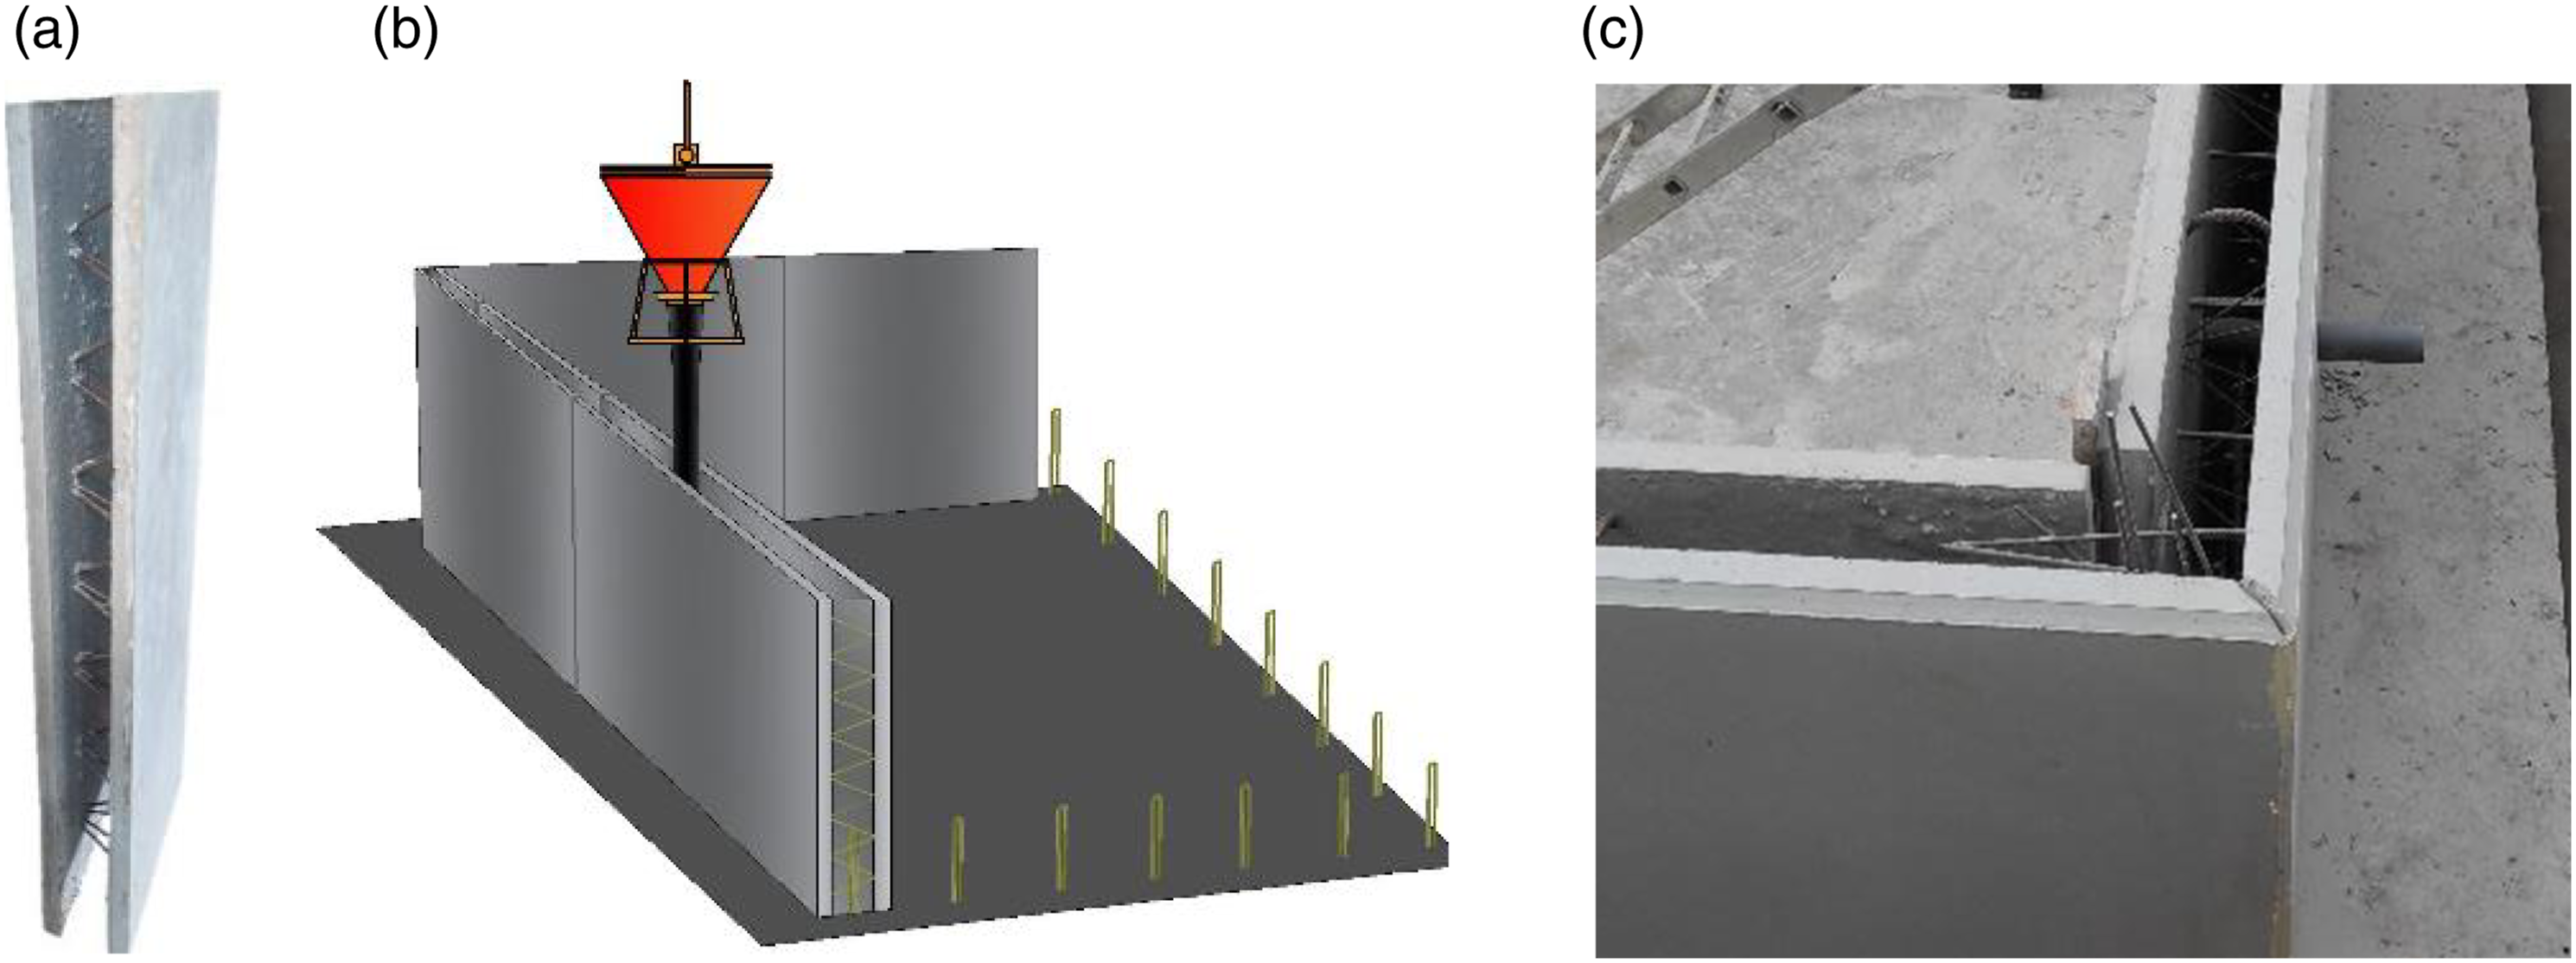
In the scope of the MC-Pool research project, the durability and the sustainability of the pre-wall system were enhanced, applying the superskin concept (Ghafari et al. 2015, 2016). In this case, the superskin corresponds to the two thin precast panels produced with an ultra-high durability concrete (UHDC). The core of the walls is casted with a low cement concrete (LCC), combining normal density and lightweight aggregates. More details about the MC-Pool project can be found in (Martins et al. 2021a; Antunes et al. 2020). This hybrid solution has the advantage of increasing the durability and simultaneously reducing the environmental impact of the final product, because the UHDC is used only in the outer layer, where is most needed to protect the steel rebars (Martins et al., 2020a; b). According to Robalo et al. (2019), the use of superskin concept on beams increase the ratio between the strength capacity and the corresponding GWP (Global Warming Potential) by circa 40%, comparatively to the traditional solutions. This more rational distribution of cement throughout the cross section also reduces the costs and the footprint associated to cement consumption.
In this research another innovative aspect was explored, this precast system was not used for its traditional use, residential and industrial buildings, but for building tanks and swimming pools, i.e., structures where walls are subjected mainly to flexural behaviour, due to the action of loads applied perpendicularly to the walls plan (Martins et al. 2021b). This solution is quite competitive compared to current products that are available in the market (concrete blocks, fiberglass monoblock or reinforced concrete walls manufactured in situ) since it combines the advantages associated with the reinforced concrete structures, such as higher strength, durability, and reliability, with the advantages of prefabrication, namely faster and cleaner construction.
The pre-wall system is made by two different concretes cast at different ages, UHDC in the outer layers and LCC in the core, therefore the shear strength between the two concretes is an important issue that must be taken into consideration, because it is necessary to ensure that the composite wall has a monolithic behavior (Saldanha et al. 2013; Costa et al. 2018; Santos et al. 2007). Based on previous studies by the authors (Martins et al. 2021a; Robalo et al. 2021), it has been concluded that the interface must be treated to increase its roughness and consequently to ensure the wanted bond between both concrete layers. A proper shear strength at interface can be obtained using a superficial hardening inhibitor followed by light washing, providing a strength that is approximately the double of the case with smooth surface (Martins et al. 2021b; Robalo et al. 2021).
Finally, to ensure the structural integrity of this precast concrete modular system, the connections between the pre-walls must transfer forces and restrain relative movements (Karthikeyan and Santhi 2019). Connections design and detailing is therefore one of the most important issues in precast structures. In addition, a rigorous cracking control is necessary, particularly if the pre-walls are used to build a tank or a swimming pool. There are some studies that show how important and weak the connections between precast walls can be (Brunesi et al., 2019a; 2019b). Martins et al. (2021a) already carried out several tests to evaluate the structural behavior of the pre-wall system, including the connections, namely, the lateral or horizontal connection between two pre-walls and the connection between the foundation and the pre-walls. In order to have this pre-wall system comprehensively characterized, also the corner connections between the pre-walls need to be addressed. So, a new series of tests were defined and the results are herein presented.
Research significance
The corner connection between two perpendicular precast concrete elements have been identified in several studies as a key-issue, due to complexity of design and execution (Tajiri et al. 2006, Kim et al., 2009; Shen et al. 2020). The high number of rebars, the high and alternated stresses due to change of load directions, and the difficulty of casting due to the smaller section dimensions, are some of the reasons to qualify the corner connection as a critical region. The change of wall direction creates a geometric discontinuity, called D-region according to Schlaich et al. (1987), where the Bernoulli and Timoshenko hypothesis of plain strain distributions is not valid, and the stress trajectories are “turbulent”. The use of pre-walls on corners increases the problem of how the internal stresses are properly transmitted between the two perpendicular walls and the behavior for positive and negative moments is quite different. The thickness of the core is usually lower than a current reinforced concrete wall, limiting the arm between the internal forces, and consequently the stiffness and strength capacity. The strut-and-tie model can be a good tool to study the regions with discontinuities and to define the reinforcement detailing. Knowledge about the path of tension and compression stresses helps to better understand the localized structural behavior, leading to a better structural design (see Figure 2). Corner cracks pattern – tension and compression stresses.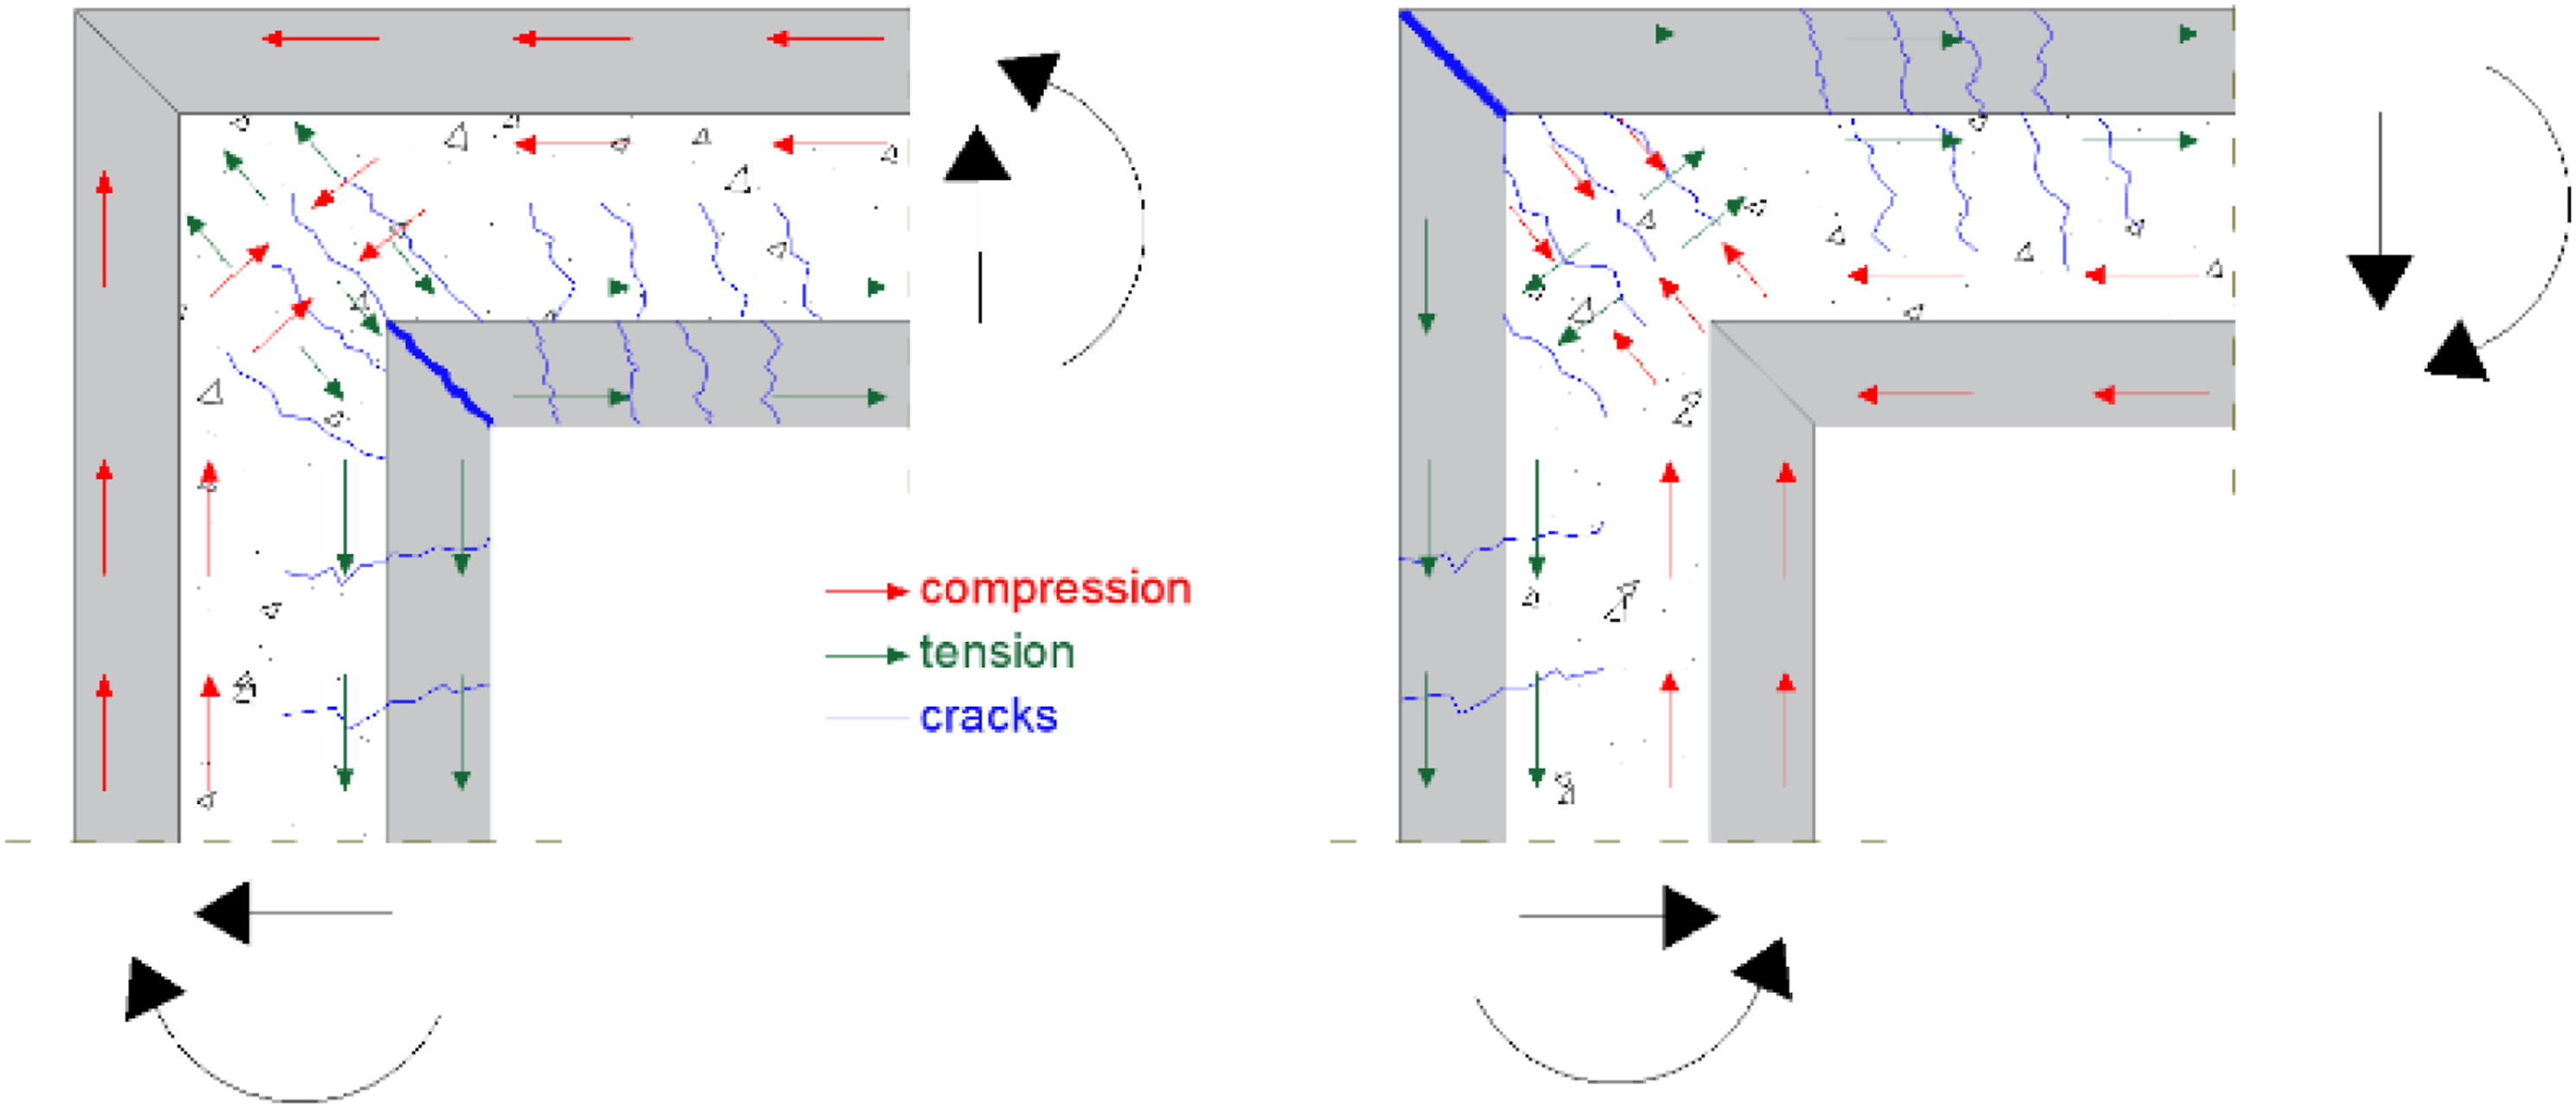
The main goal of the research herein described is study the behavior of corner connections between perpendicular pre-walls, particularly identify the key factors that influence the strength and the crack pattern, as well as define the proper reinforcement detailing. To accomplish this goal, several specimens with different characteristics were produced and tested. Monitoring was conducted using current instruments as well as computer vision. Additionally, to further understand the behavior of these connections, finite element models were built, first to simulate the experimental tests, and this way calibrate and validate the numerical models, and then to explore and evaluate new solutions.
Experimental program
High durability concrete and low-cement concrete
Estimated service life and minimum cover, cmin,dur, for current structures (Martins et al. 2021a; Antunes et al. 2020).
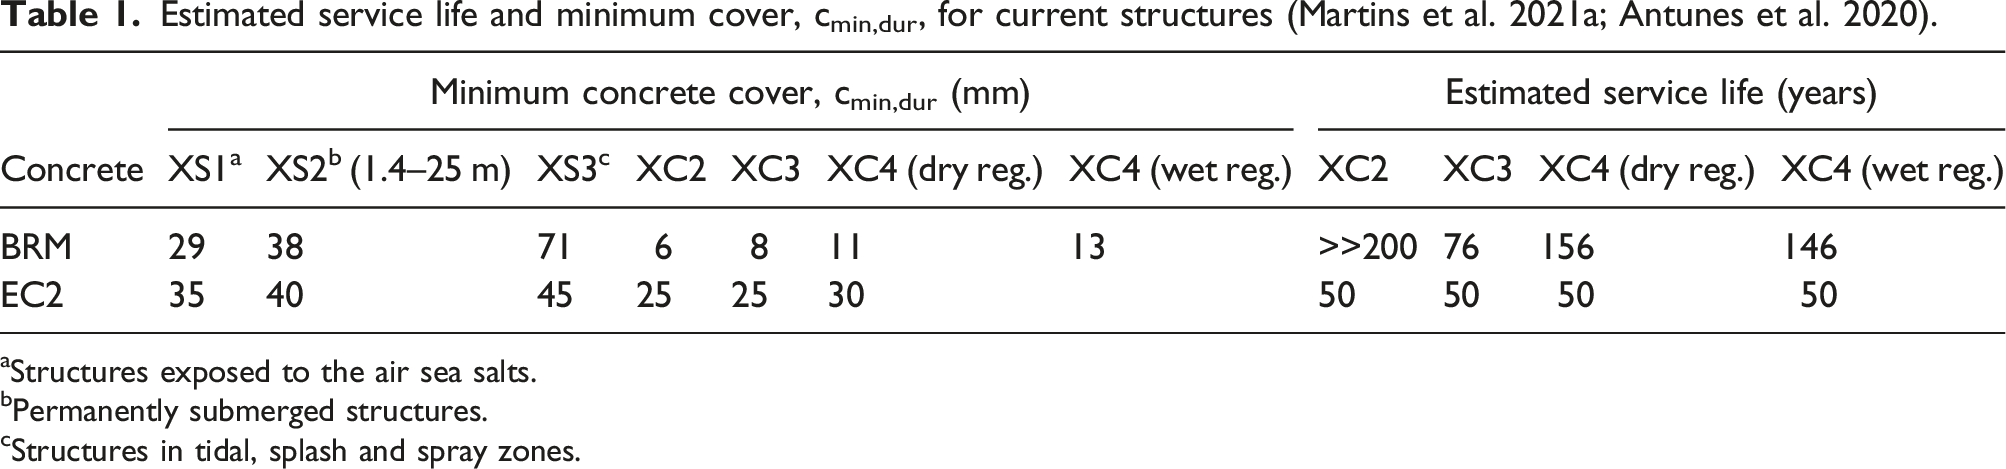
aStructures exposed to the air sea salts.
bPermanently submerged structures.
cStructures in tidal, splash and spray zones.
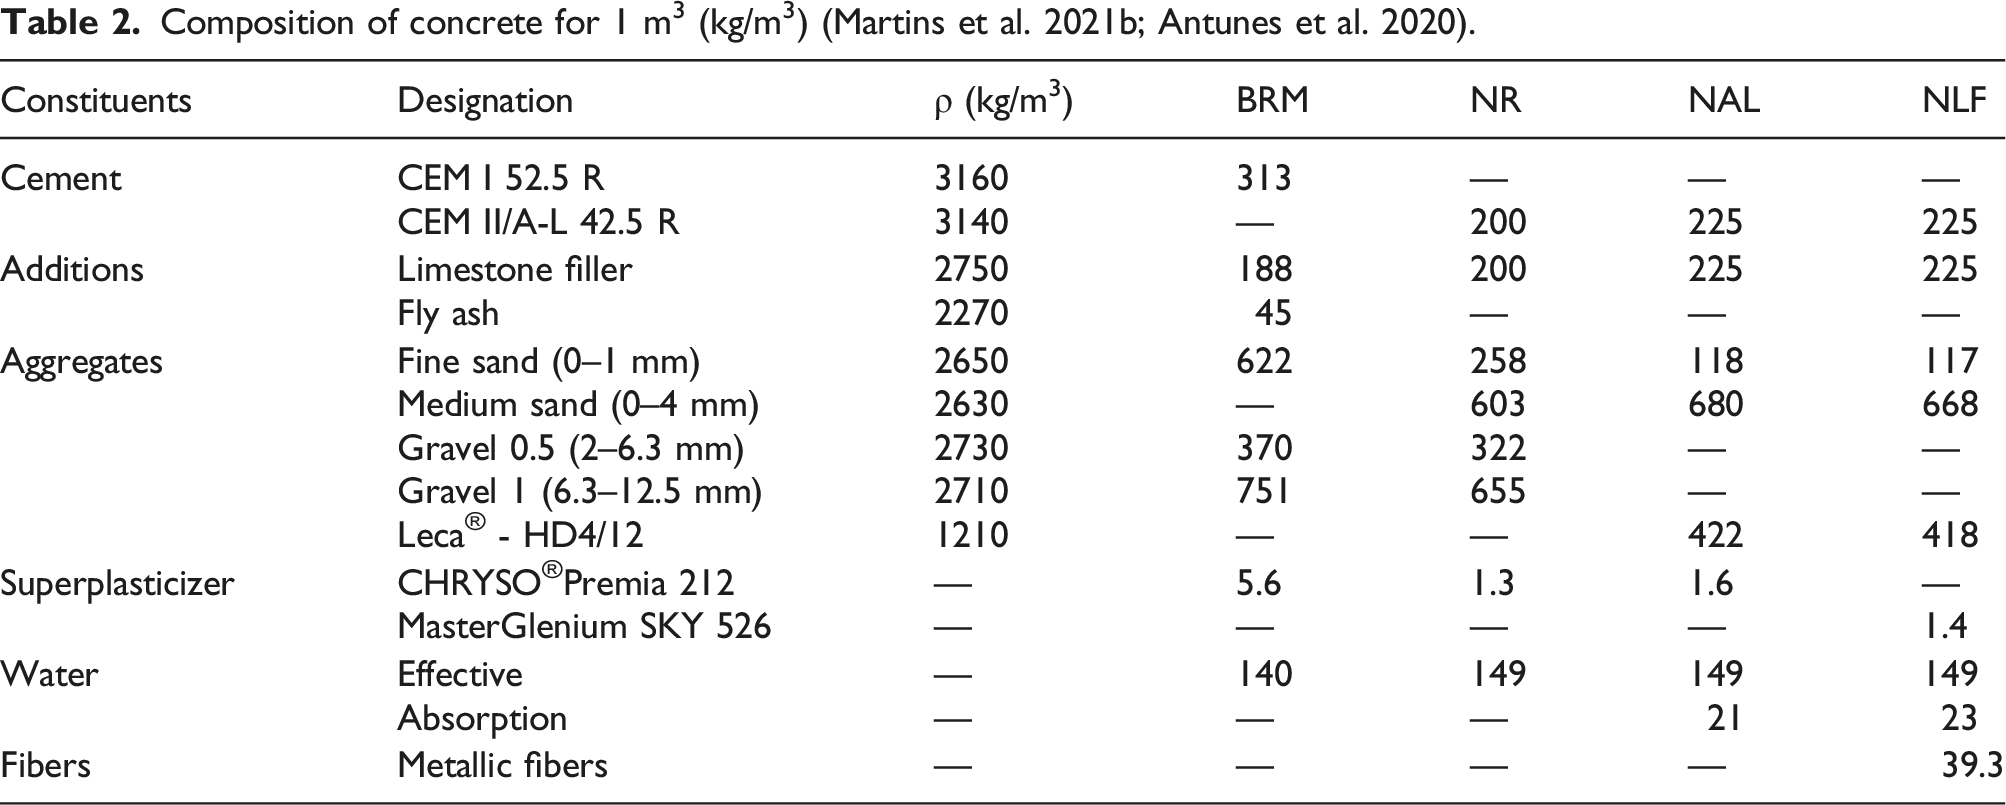
Composition of concrete for 1 m3 (kg/m3) (Martins et al. 2021b; Antunes et al. 2020).
The performance of concrete durability on uncracked state was also studied, but only for the concrete used in the pre-walls, the external layer, for the reasons above mentioned. Based on the results obtained from the carbonation resistance tests and from the chlorides migration tests, the minimum concrete cover required, cmin,dur, to provide the proper resistance against steel corrosion was determined (Antunes et al. 2020). Also based on the experimental results, related with durability, the service life of the walls was estimated, assuming a concrete cover equal to 20 mm (Table 1). This value is usually adopted in pre-walls with 50 mm thickness panels. The BRM concrete provides a very good steel protection for the XC exposure classes, since the predicted service life for current structures is higher than 75 years and in certain conditions, e.g. XC2, it is significantly higher. The minimum concrete cover required is lower than the values recommended in Eurocode 2 (2004) almost in all conditions, except XS3, meaning that this concrete behaves as a superskin, as initially intended. The XS3 class corresponds to tidal and splash zones, and this type of walls is very unlikely to be used in such conditions.
Production of the specimens – corner connections
Specimens labeling and characteristics.
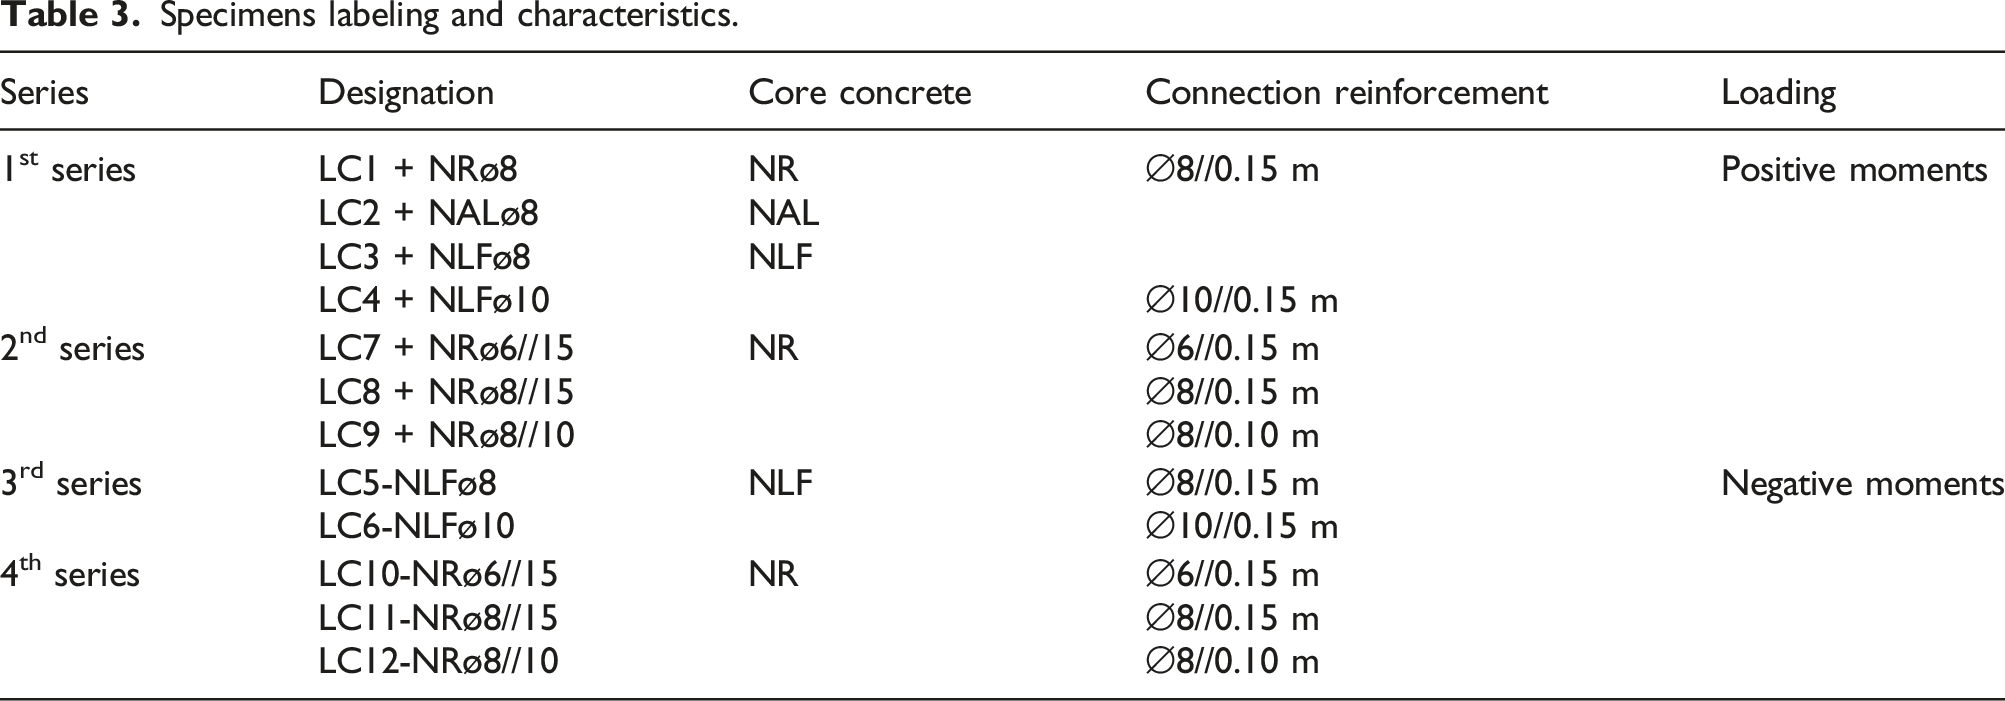
The first series includes four specimens, loaded in compression to create positive moments, for the core three different concretes were used (NR, NAL or NLF), and the reinforcement was ∅8 mm spaced 150 mm or ∅10 mm spaced 150 mm, with the detailing defined in Figure 3(a). The rebars used in all specimens were ribbed and S500 steel grade, with a nominal yield stress of 500 MPa. The second series was produced as an alternative solution to the previous one, in terms of reinforcement detailing and regarding bonding between the top of pre-walls (Figure 3(b)). To improve the latter, an epoxy resin was applied on the faces that are in contact between the perpendicular panels. The rebars were also placed 20 mm inside the panel during production to analyse if this solution provides a better anchorage capacity and consequently a better connection. One side of the reinforcement was shorter to allow the corner assemblage. The shorter and longer anchorage length were 200 and 350 mm, respectively. This series is constituted by three specimens, also subjected to positive moments, the core was produced using NR concrete and the reinforcement adopted was: ∅6 mm spaced 150 mm, ∅8 mm spaced 150 mm or ∅8 mm spaced 100 mm. Reinforcement detailing: (a) 1st and 3rd specimens; (b) 2nd and 4th specimens.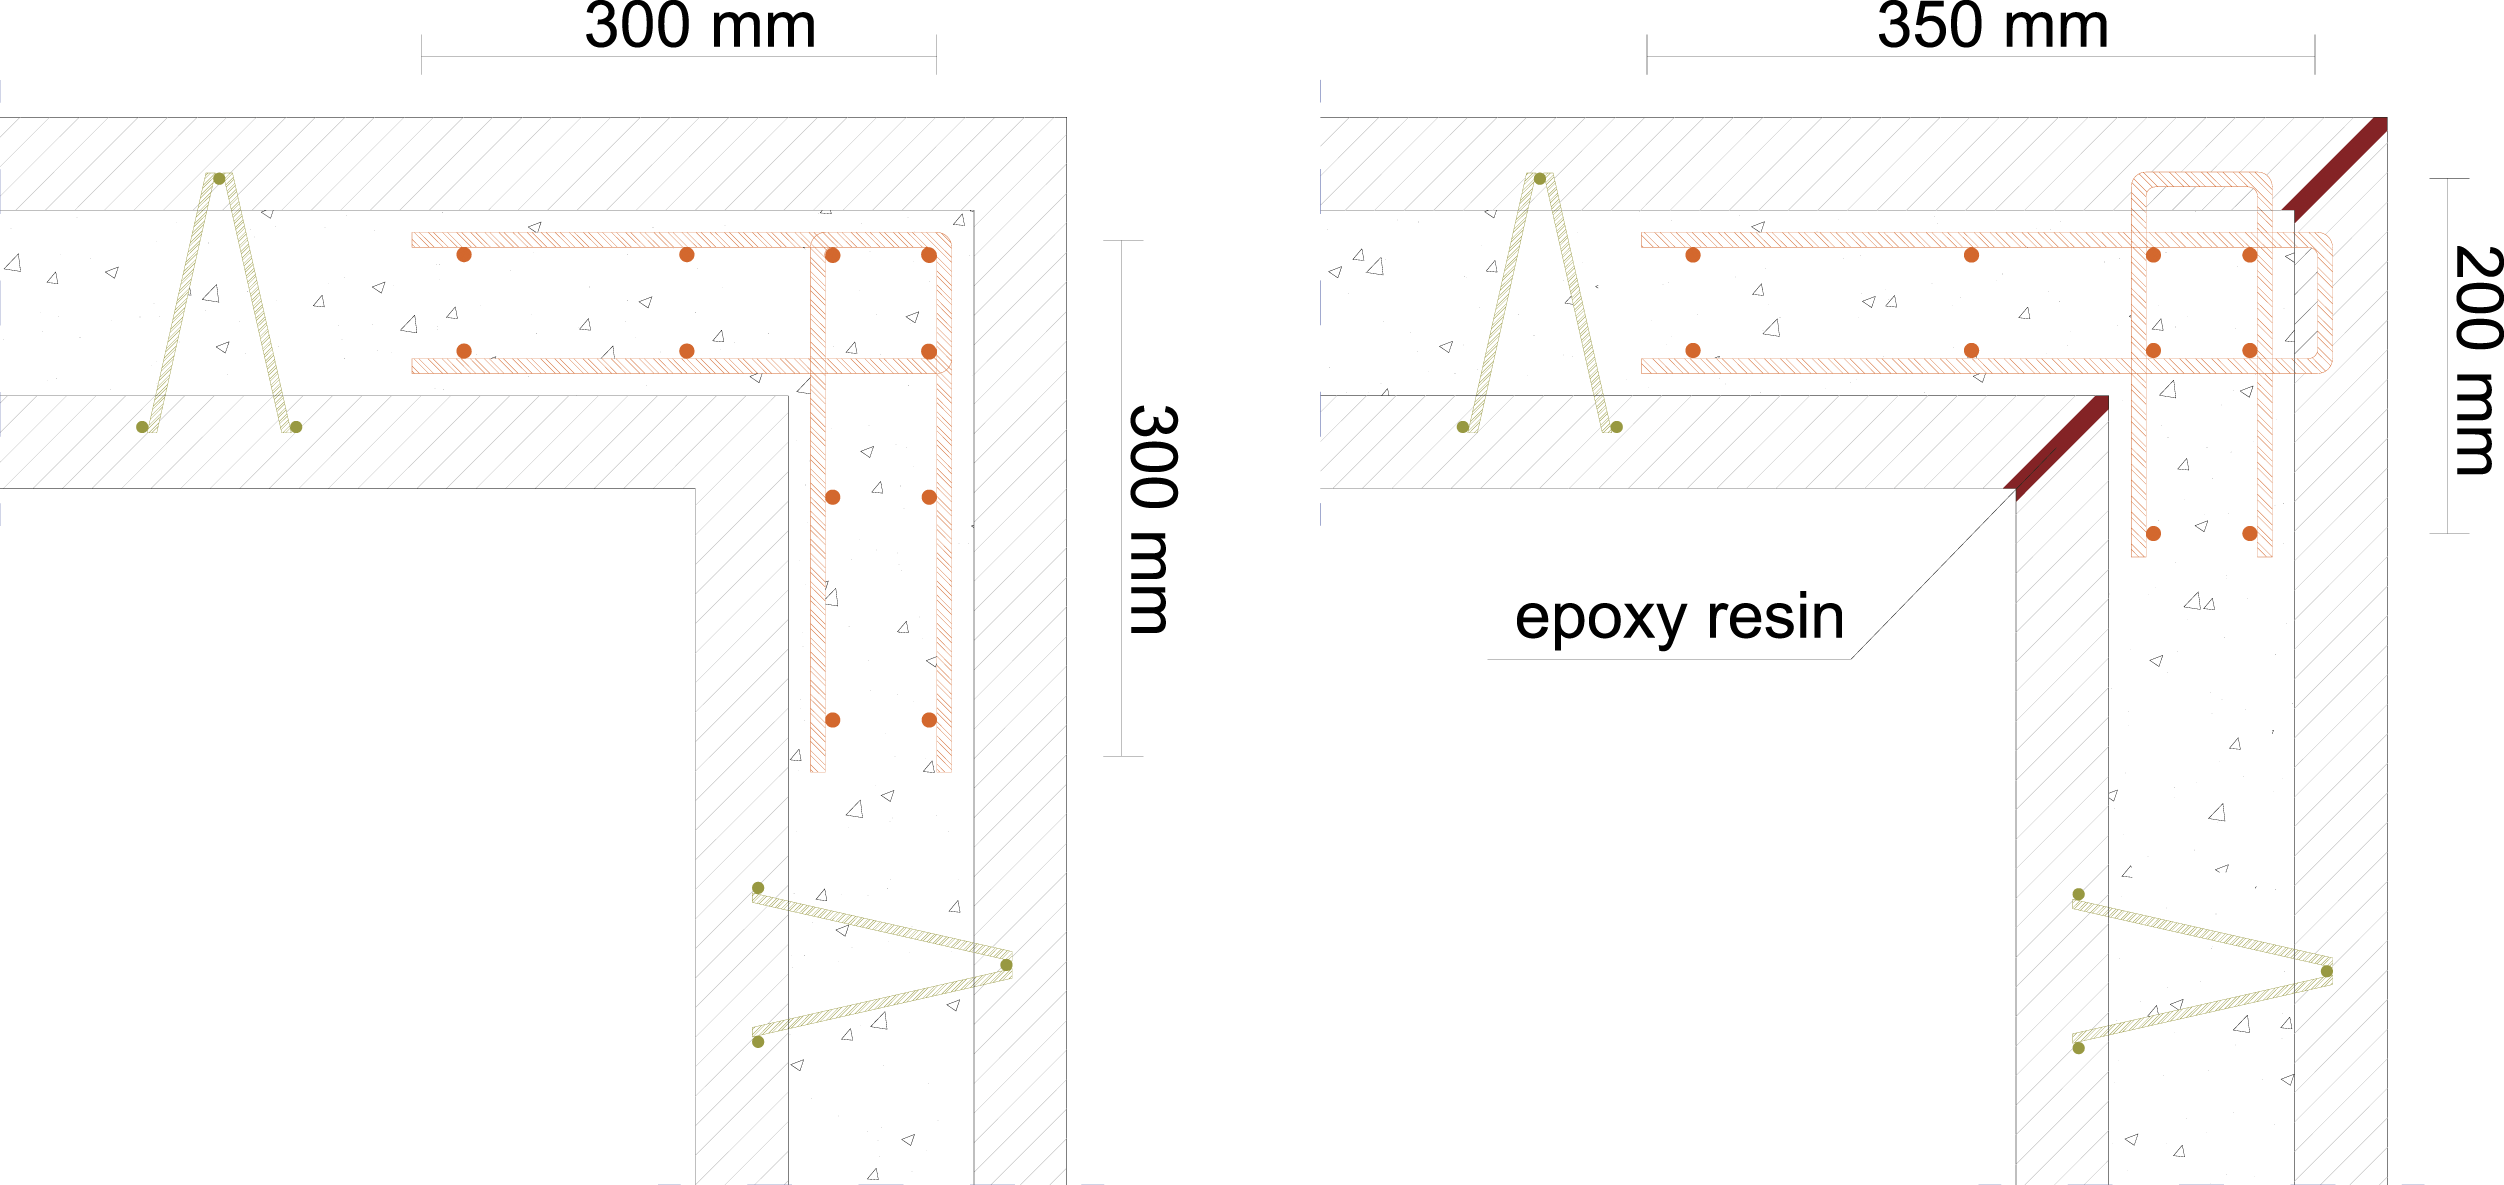
The third series is constituted by two specimens, the reinforcement detailing and the respective ratio are similar to the specimens of first series, but in this case the specimens were loaded in tension to create negative moments (Table 3). Finally, the fourth series is constituted by three specimens, in order to analyse the behaviour of the specimens with an alternative solution in terms of reinforcement detailing and bonding between the pre-walls, like the second series solution, but subjected to negative moments, instead.
The specimens were identified according to the following rules: the number of the specimen; the sign (+ or –) to identify the positive or negative moments, respectively; the type of concrete used in the core (NR, NAL or NLF); and, finally, the diameter and spacing of rebars used in the connection (Table 3). Epoxy resin was used to bond the faces of the pre-walls, only on specimens LC9 e LC12, during the assembly stage, to improve the transfer of the tension stresses and consequently to increase strength capacity.
The specimens were produced in two stages. The first stage is the prefabrication of the pre-walls, that also has several steps. It starts with the production of one panel, then the steel trusses were positioned on top of it while concrete was fresh, as well as the connection reinforcement, for second and fourth series. After concrete hardening, the panel was rotated, and the second panel was casted. Second stage corresponds to the assembly of the pre-walls to form a corner. For first and third series, the reinforcement was placed in the critical region, and for the second and fourth series, the epoxy was applied on the top of the panels, as already mentioned. Finally, the concrete defined for each specimen was casted into the core (Figure 4). Production of the specimens: (a) pre-walls; (b) casting the core; (c) corner connection and (d) final specimen.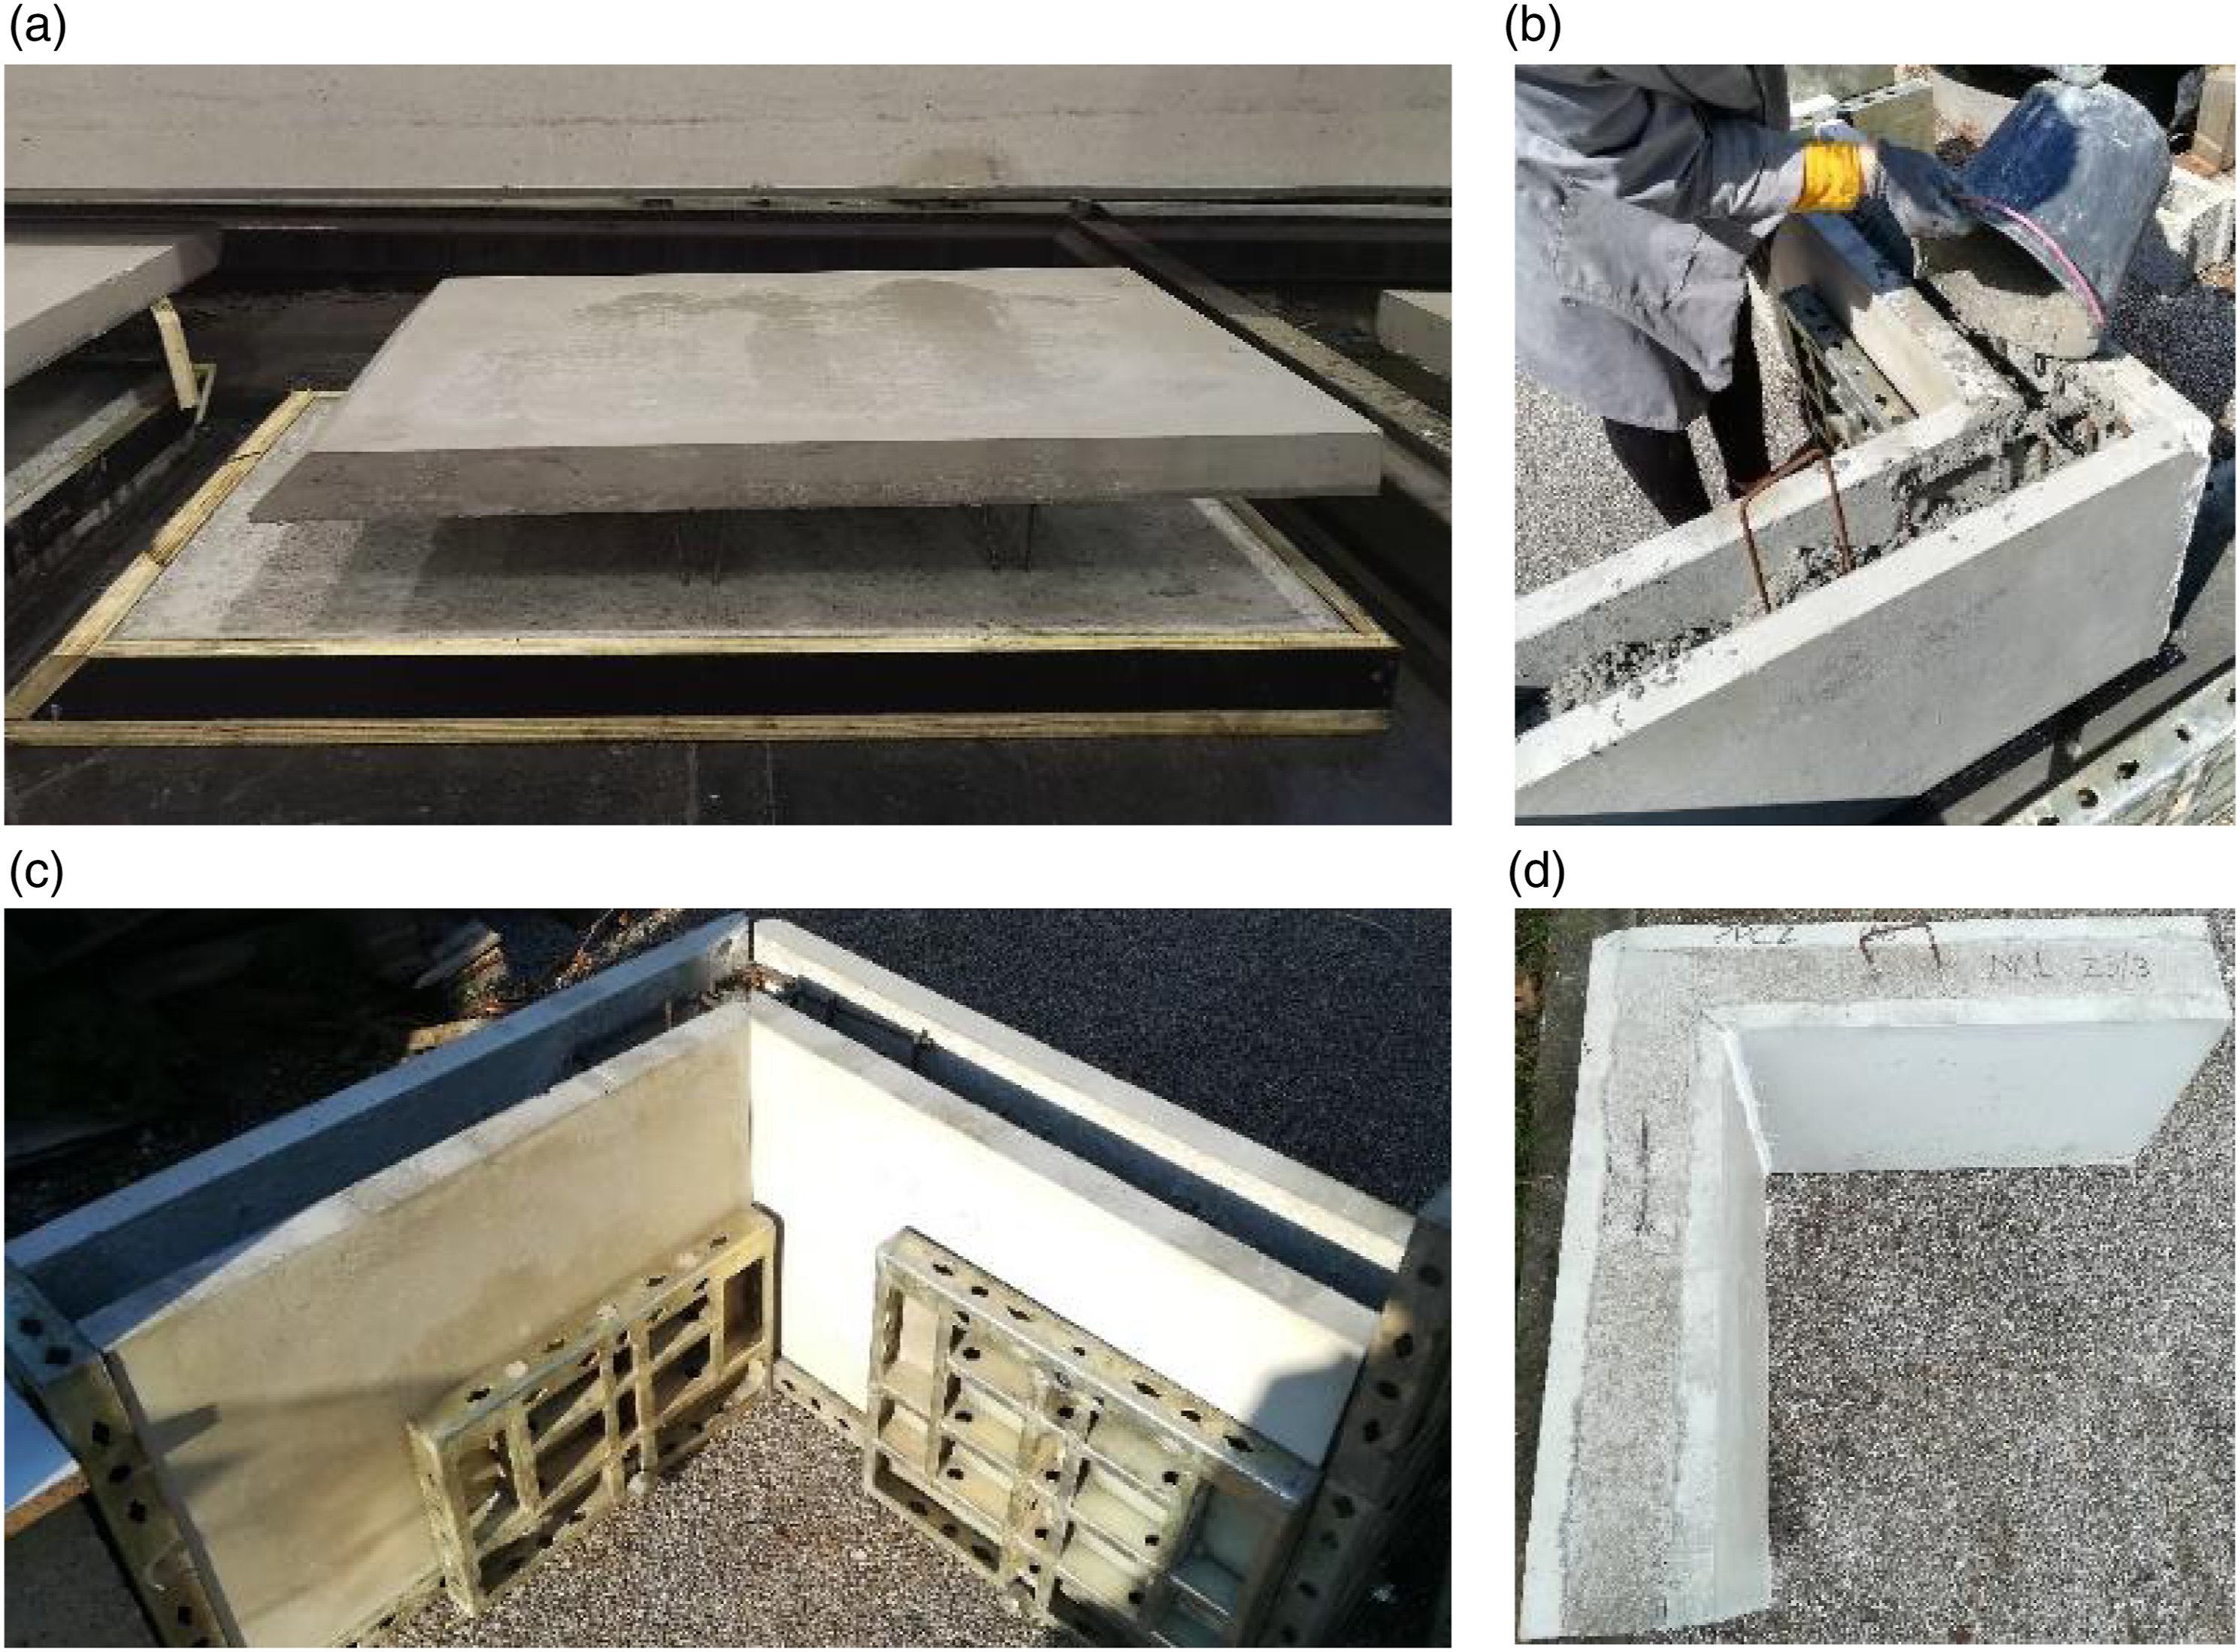
Tests set-up
The specimens were attached to a steel frame and positioned over supports with free rotation, to perform the tests. The load was vertically applied, in compression or in tension, using a hydraulic servo-actuator, at 100 mm from the edge of the specimen, creating a free span of 750 mm, from the loading point to the axis of the perpendicular wall. A semi-cylindrical support was placed on the actuator, to allow rotation at the loading point. The test set up is illustrated in Figure 5. Five LVDTs were used to measure the displacements at different cross-sections, and these were fixed to a metallic profile that was connected to the specimens on the sections with supports. Two load cells under the vertical support were used to measure the reaction (Figure 6). Test set-up for the negative moments. Set up test: (a) traditional instrumentation; (b) image acquisition for compute vision.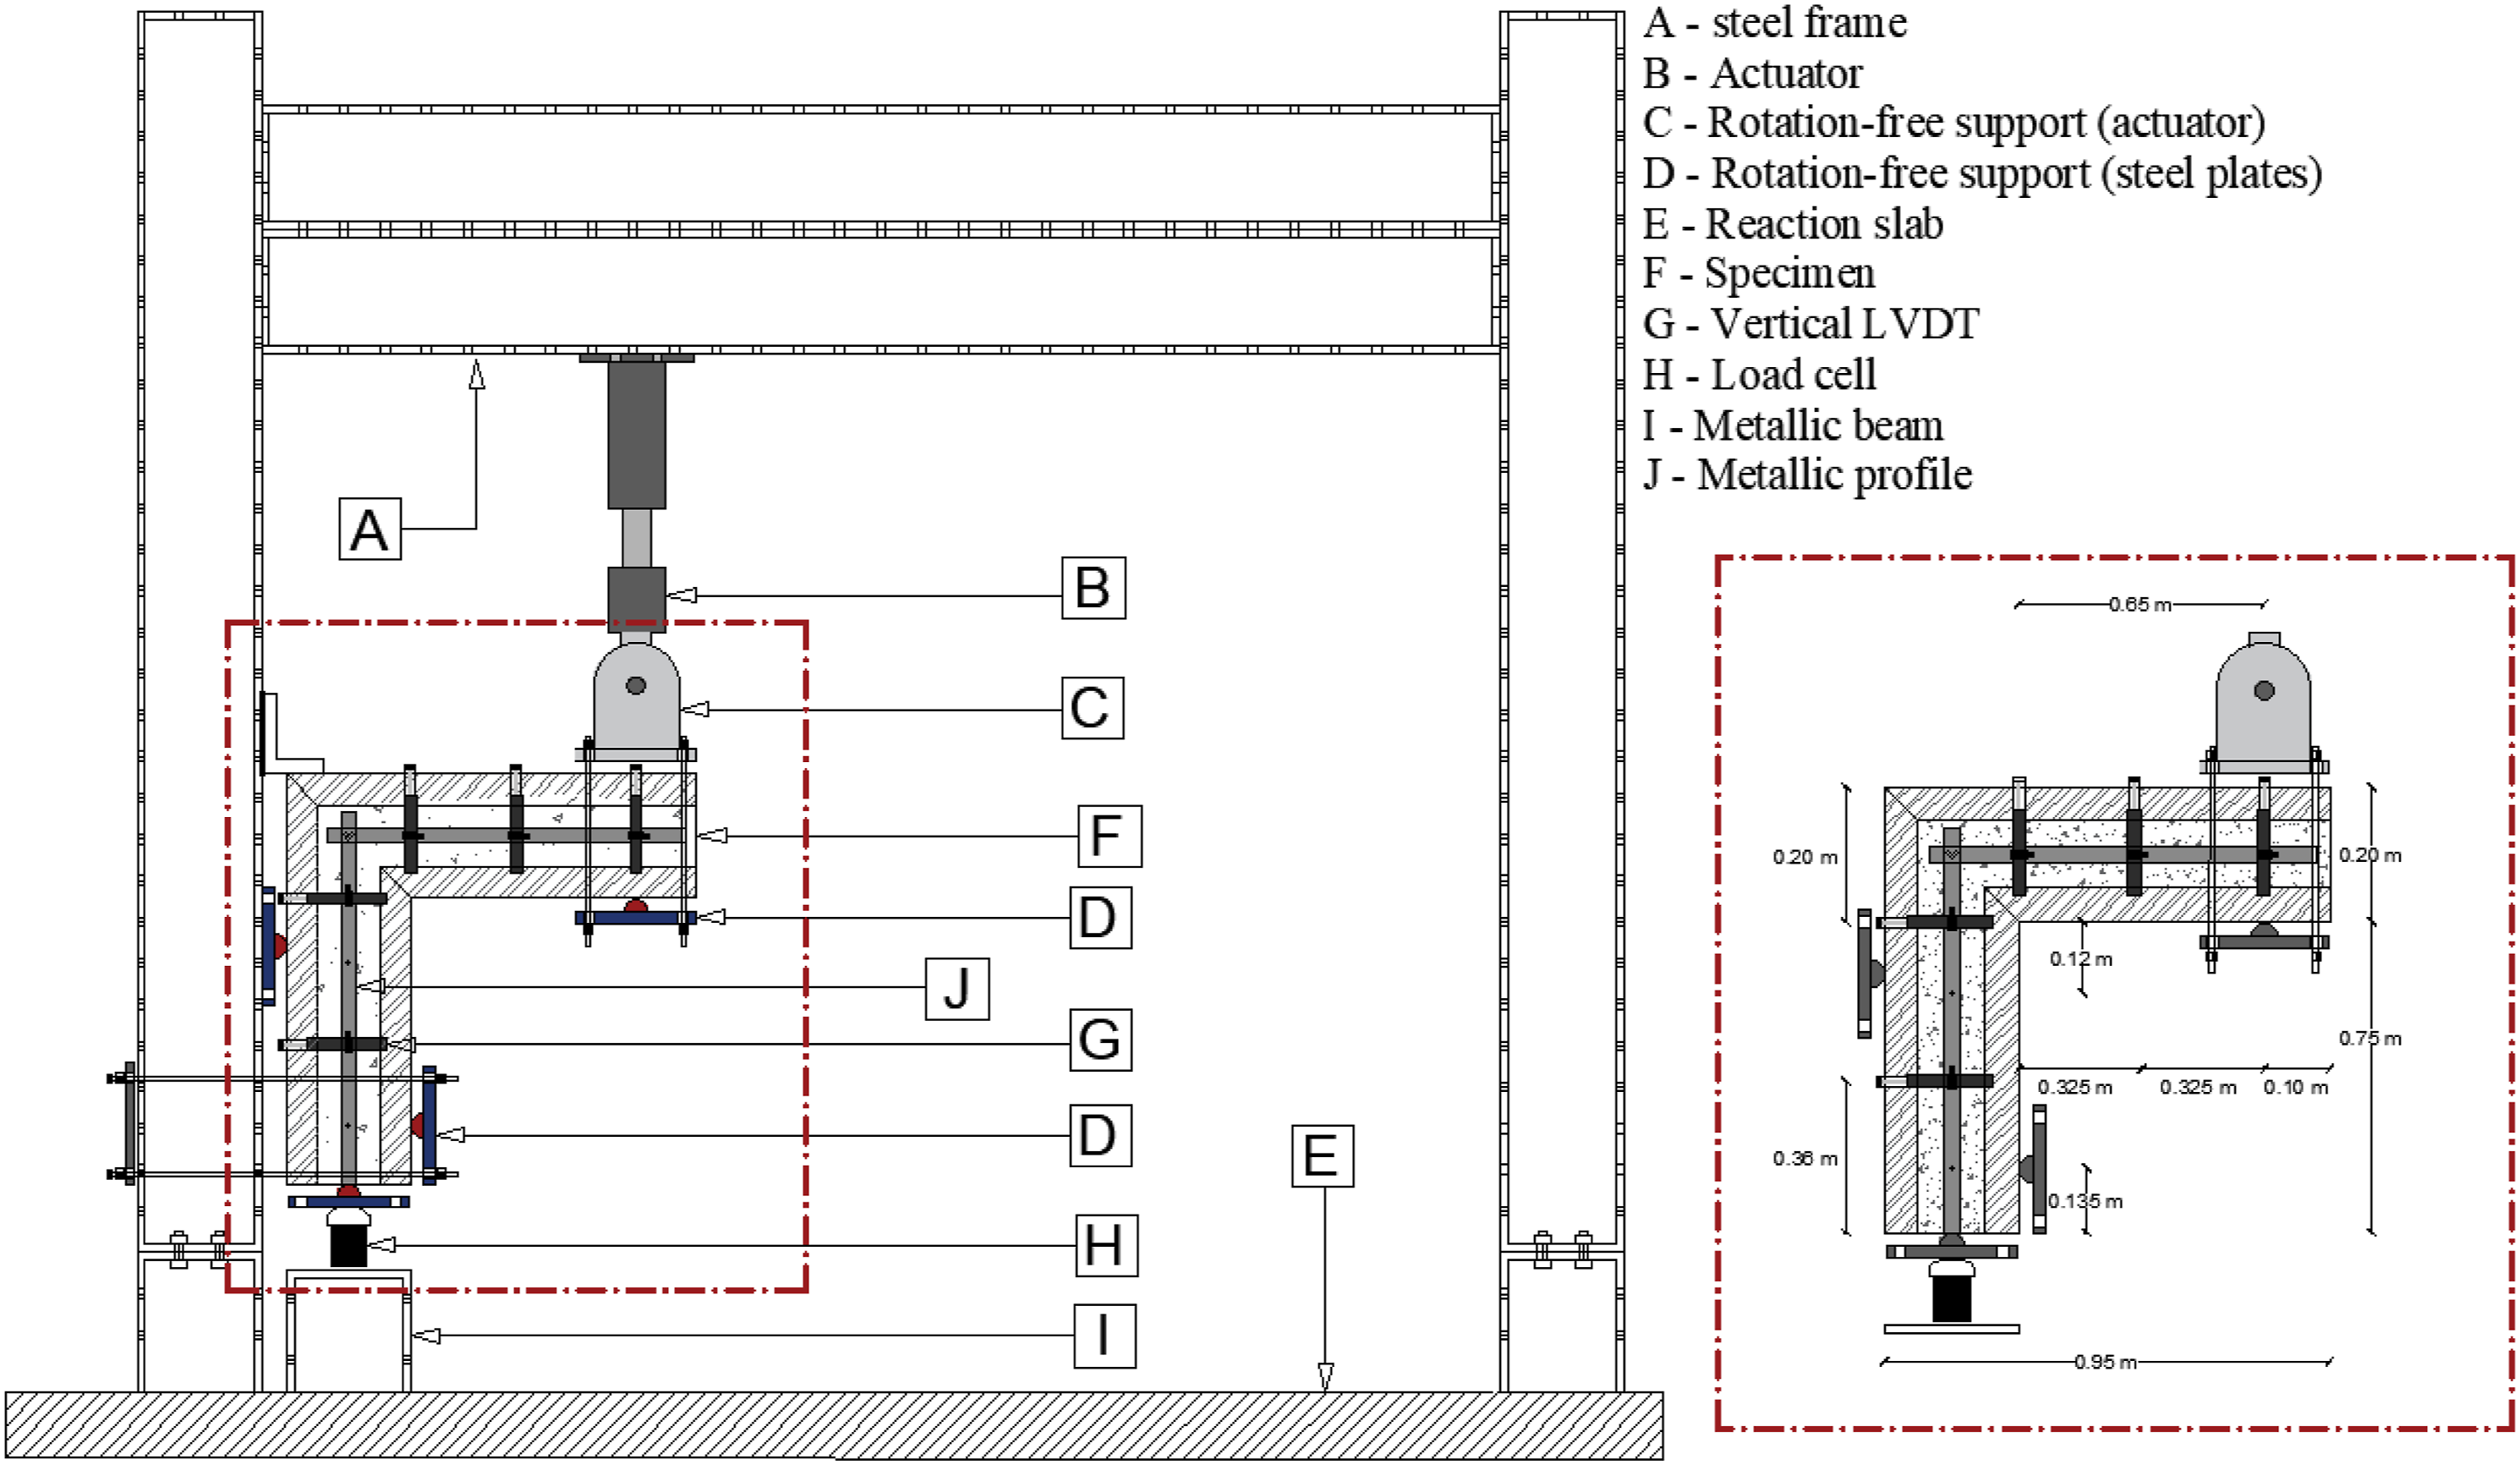
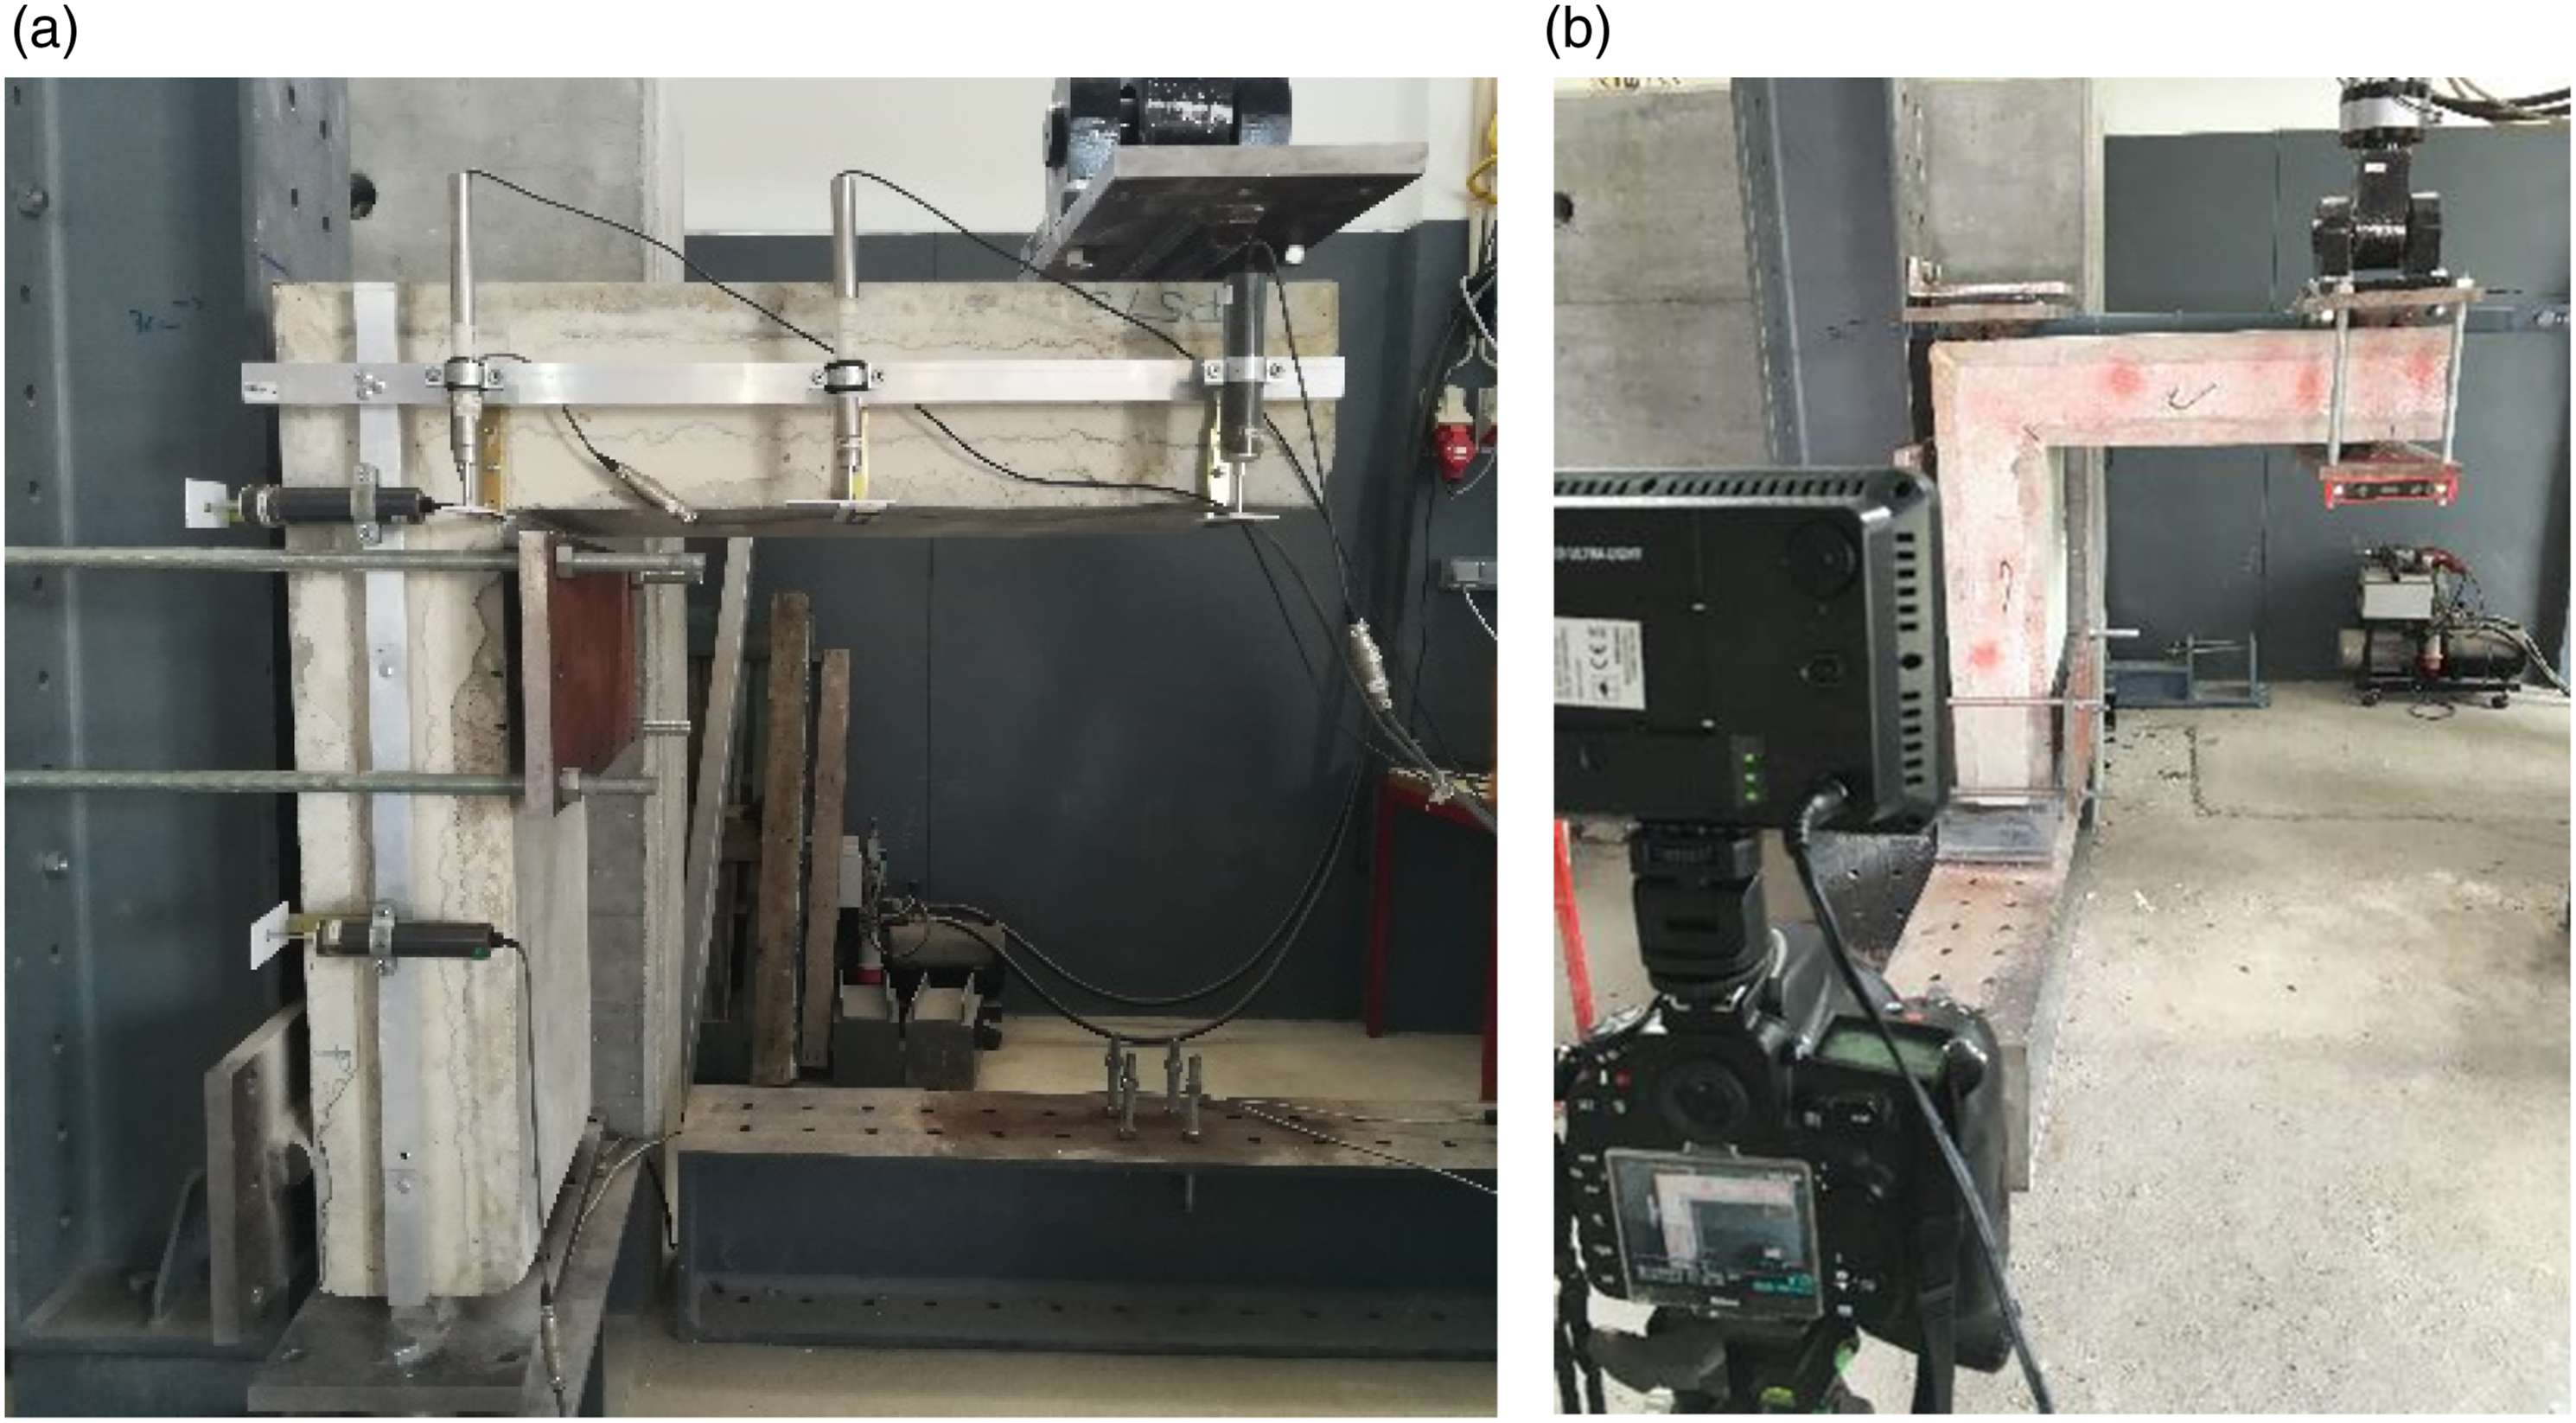
In addition, six tests (second and fourth series) were also monitored using computer vision to provide a more comprehensive evaluation of the specimens’ behavior. A camera was placed in front-parallel position, and images with 7360 × 4912 size-pixels were acquired with a temporal resolution of two frames per second. Artificial light was set to achieve a uniform and homogeneous lighting of the specimen surfaces (Figure 6(b)). The computer vision algorithms used aims at monitoring: (i) the deformed shape of the specimens; and (ii) the crack pattern and the opening of the corner. The deformed shape was computed for all specimens and at different stages, allowing to determine the displacement evolution at any cross sections, as exemplified in Figure 7(a). The detection of cracks and the opening of the corner were used to better understand the structural behavior in each case (Figure 7(b)). In both cases, the approach is based on comparing images acquired during the tests with a reference image, acquired immediately before the beginning of the tests. To characterize the crack pattern, including the detachment and the opening at interface between the two concretes was used a virtual image as reference. To define this reference image was required to perform some computation to considerer the corresponding deformation of the specimen at analyzed instant (Dias-da-Costa et al., 2017). This allows to obtain an accurate map of cracking in each instant and the cracks evolution, length and opening, during the test. Examples of application of computer vision: (a) deformed shape (in red); (b) crack pattern (in red).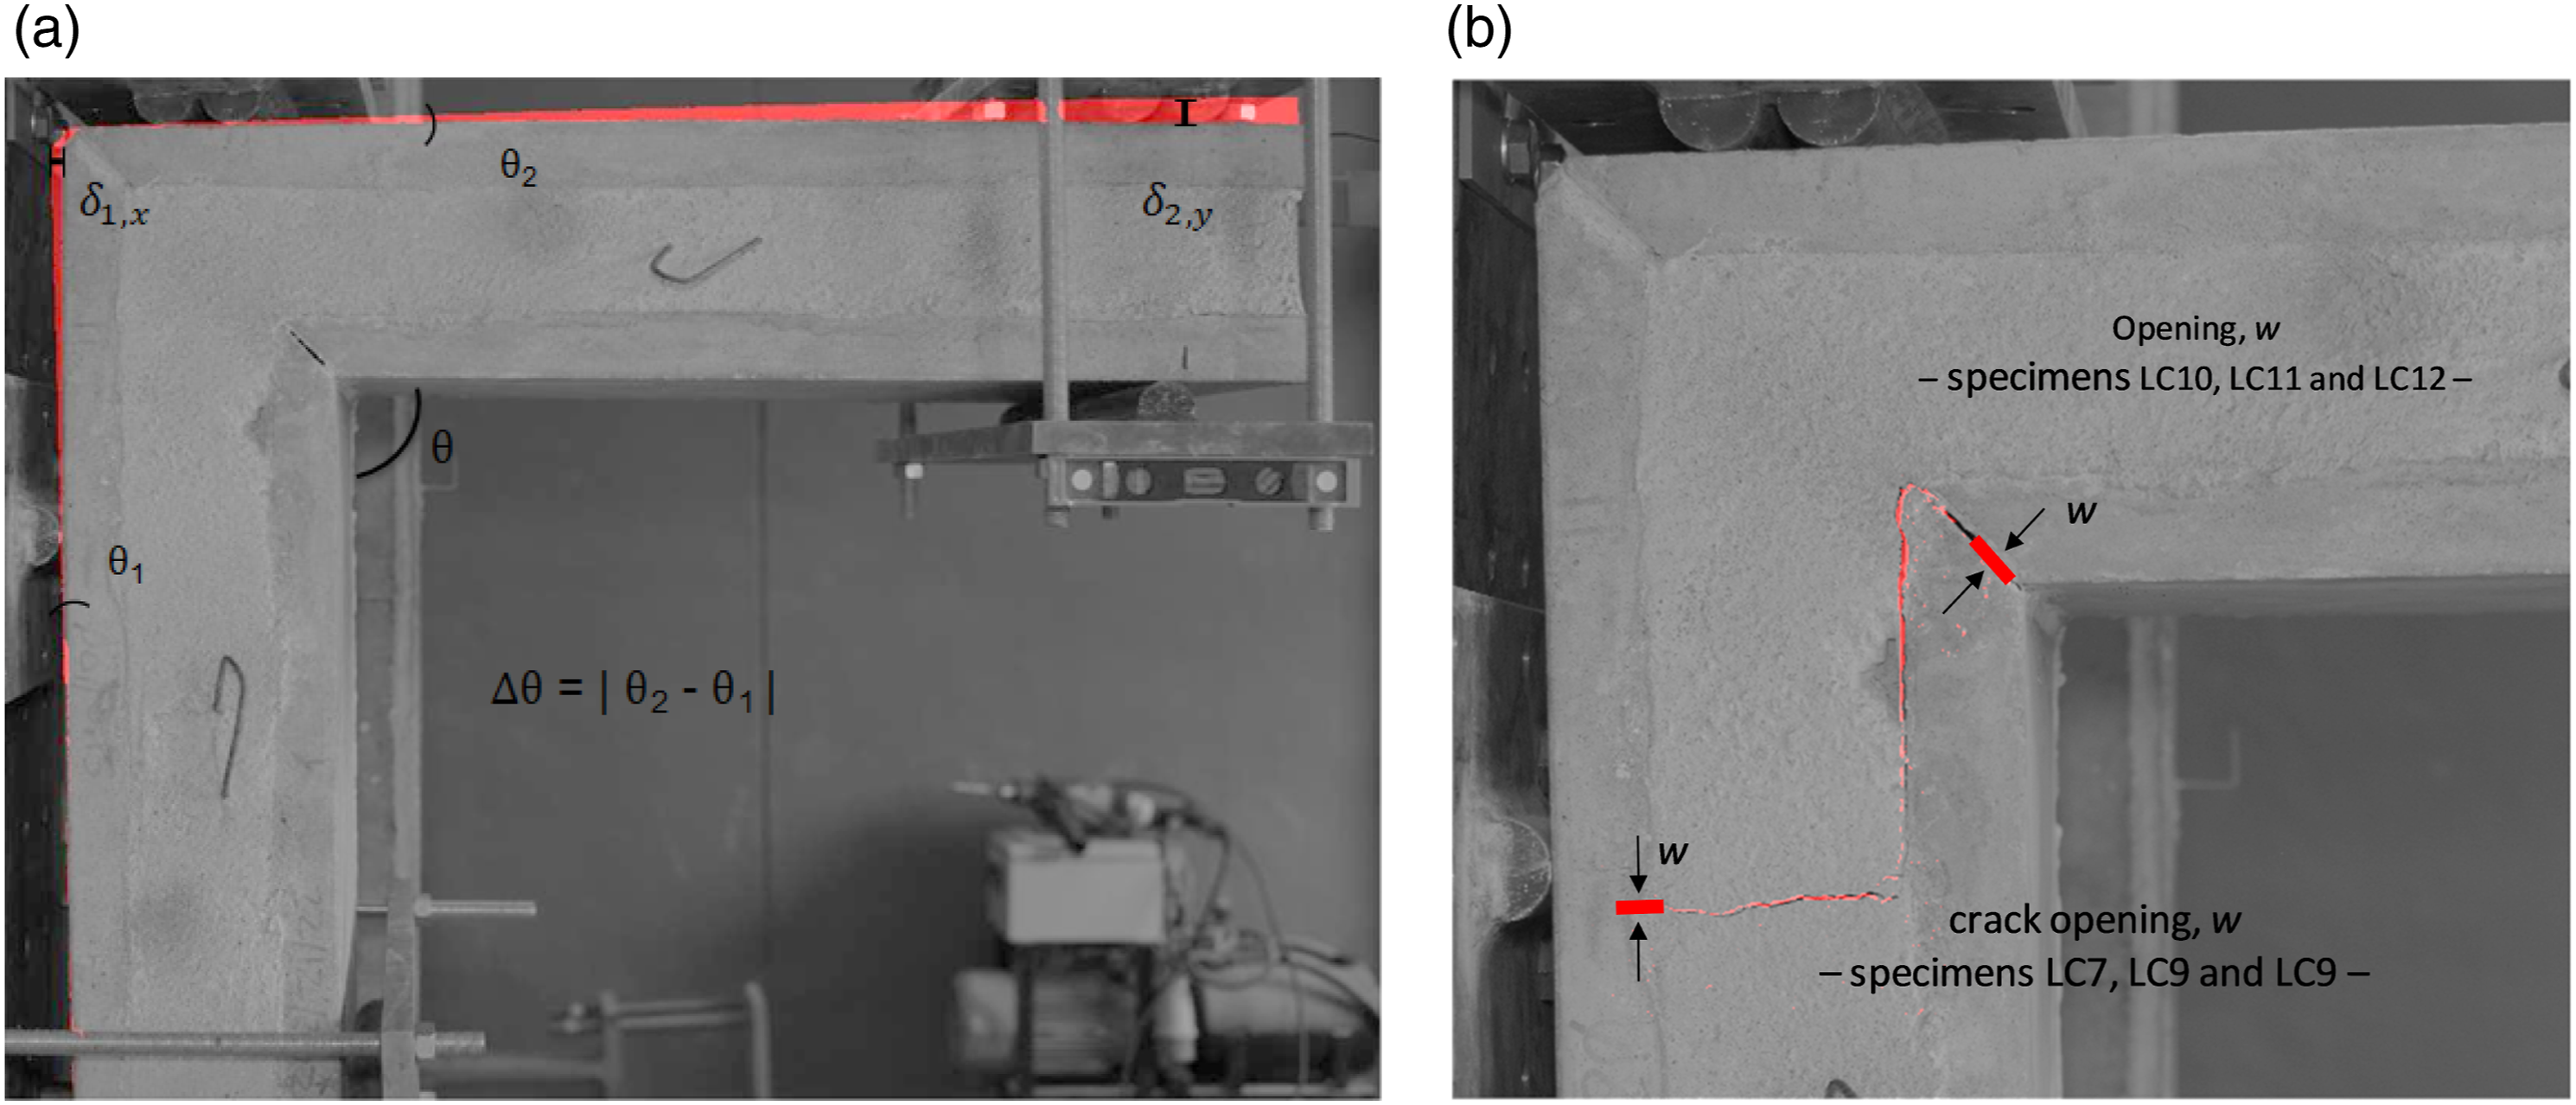
The load was applied with displacement control, to analyze the post peak behavior, at a rate of 0.02 mm/s and the data was recorded with a frequency of 1 Hz. The diagrams of positive and negative moments are shown in Figure 8. Bending moments diagrams: (a) Load in compression (positive moments); (b) load in tension (negative moments).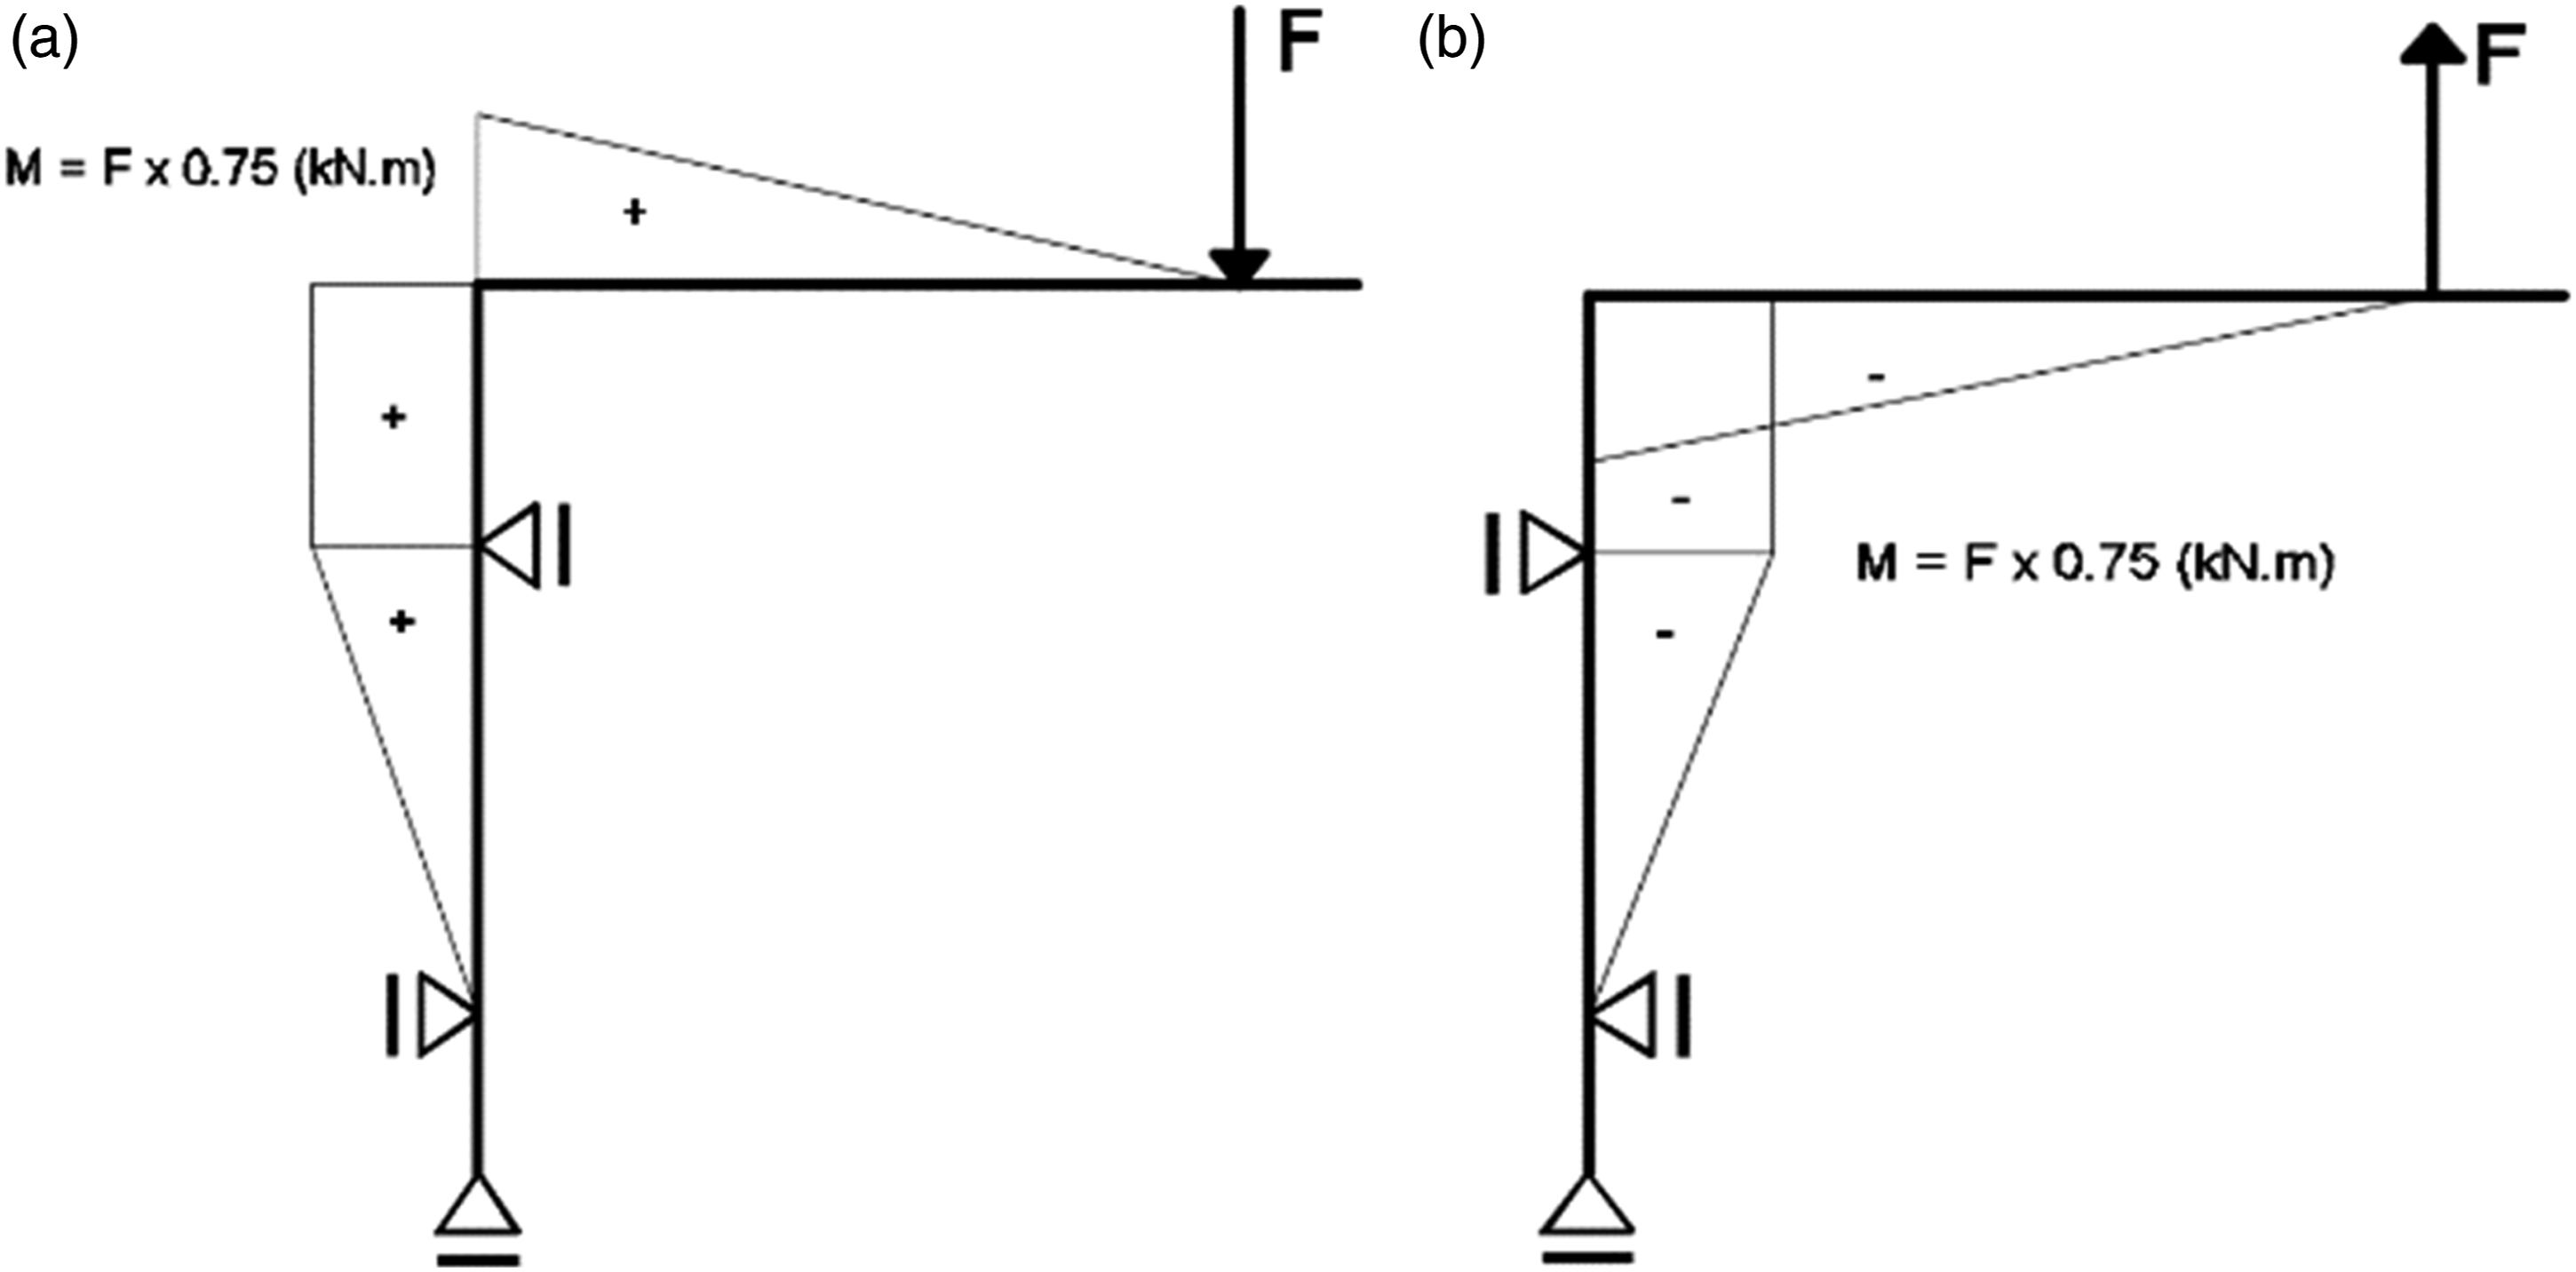
Numerical model
This section describes the 3D finite element model (FEM) that was developed using the commercial software ABAQUS Standard (2018). In the following sub-sections, the elements, the materials and the boundary conditions are described.
Elements and materials
Mechanical properties of concretes (Martins et al. 2021a; Antunes et al. 2020).
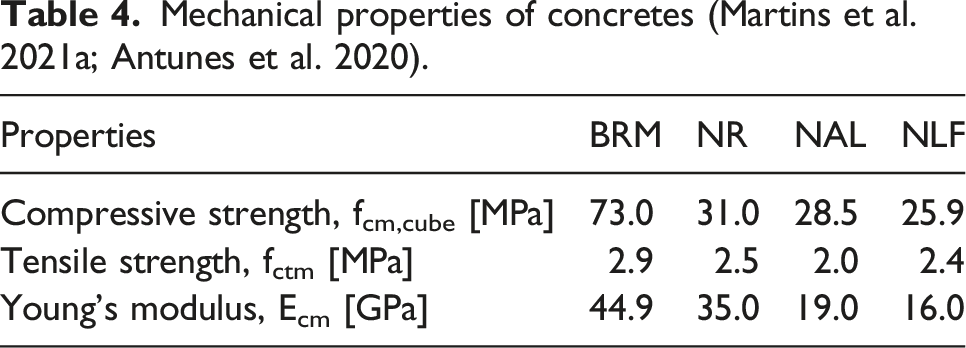
The rebars were modelled with beam elements, using different elements for steel truss and steel meshes, since they have different diameters. For these elements a perfect elastoplastic material was considered, with a Young’s modulus of 200 GPa, a Poisson’s coefficient of 0.2, and an average yield stress of 500 MPa.
Elements and materials
To reduce computational time and calculation, only half of the structure was modelled. For this purpose, the cross section was divided in half, and a symmetry condition was adopted on the transversal axis, in which all the orthogonal displacements and the rotations parallel to this plane were constrained to zero, as depicted in Figure 9(a). According to the experimental setup, three pined supports were inserted, one of them in the lower edge of the vertical wall, and the other two in the lateral faces of the vertical wall. Model adopted for the numerical simulation: (a) Geometrical symmetry; (b) Mesh.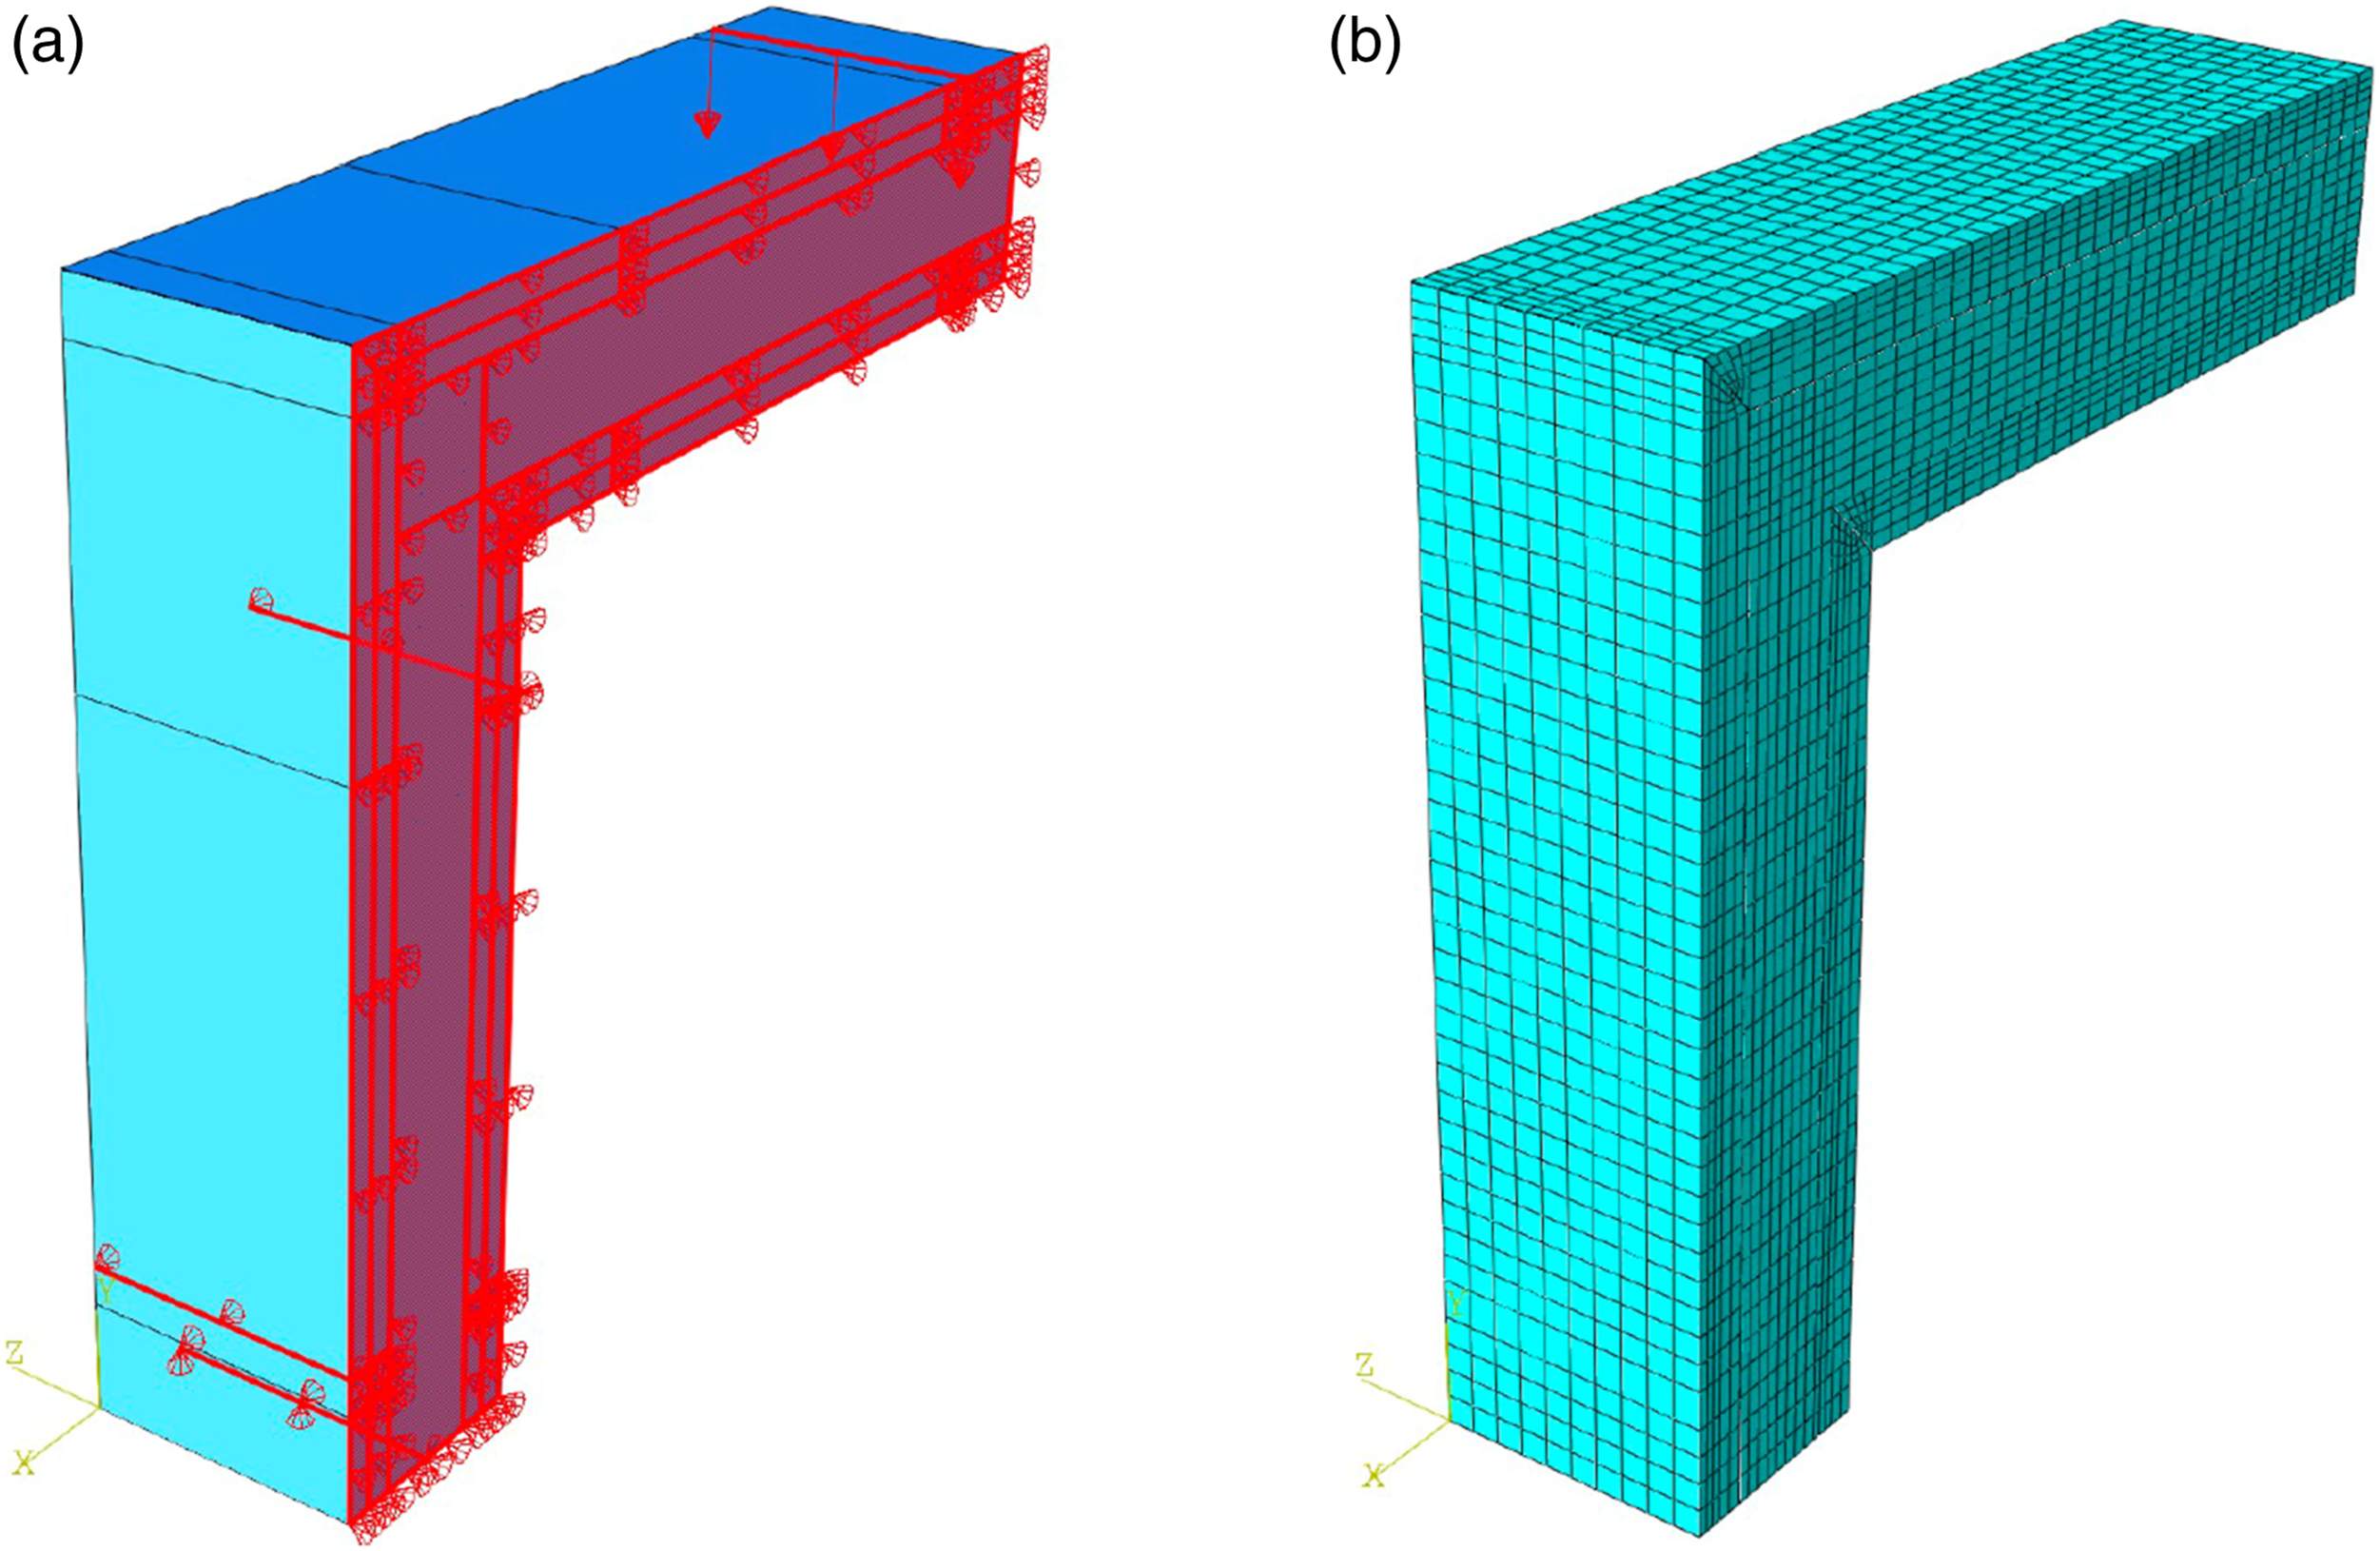
To simulate the load and to control the softening branch of the structural response, a prescribed vertical displacement was applied at the point defined in the experimental tests. A rigid steel plate was perfectly attached to the specimen to reduce the impact of the stress concentration at the loading point.
Two types of contact surfaces were used, both have displacement compatibility enforcement for solid elements, which is useful to avoid the creation of nodes that are not properly connected. This contact type has been successfully used in other works performed to study load transfer along interface surfaces (Achillopoulou, 2017; Achillopoulou and Karabinis, 2013). The surfaces characteristics were defined according to fib Model Code (FIB, 2010). The first surface is related with the contact between the perpendicular pre-walls (top of external panels), and only a friction interface with smooth behaviour was admitted. A friction coefficient of 0.4 and a maximum shear of 3.5 MPa were used. For the specimens where the epoxy was used to glue the perpendicular pre-walls, an extra cohesive model was considered, with a maximum tensile stress of 3 MPa, according to the material supplier. The second interface is concerning to the contact between the core and the pre-wall, in this case a friction plus cohesive interface was considered, using the following parameters: cohesive coefficient of 0.5 MPa, shear stiffness of 5000 N/mm3, friction coefficient of 0.4 and maximum shear of 3.5 MPa. These values were defined taking into consideration the experimental tests, previously performed to characterize the shear strength at the interface between the core and the pre-walls (Martins et al. 2021a).
Adopted mesh and type of analysis
Three-dimensional (3D) elements, C3D8R type, with reduced integration and hourglass control were used to simulate the concrete. For the longitudinal and transversal steel rebars, two node beam elements, B33 type, with cubic formulation were used. Steel rebars and concrete elements were connected considering a perfect bond, i.e., with no slip. For all elements, a structured mesh was used in both transversal and longitudinal directions, as depicted in Figure 9. Although the use of energy regularization may prevent some mesh dependency for softening tension behaviour (Bazant 1976; Bazant and Oh 1983), an extra care was taken to reduce the mesh dependency for softening compression behaviour, using a viscosity parameter
A non-linear analysis was considered, along with a classical Newton-Rapshon method. Since the level of prescribed displacement is negligible when compared to the connection geometry, a geometrically linear analysis was used.
Results and discussion
Strength under positive moment (1st and 2nd series)
The maximum bending moment applied per meter, M, was determined considering the load applied and the width of the specimens, and it was related with the vertical displacement at the loading section, δ. For specimens of 1st and 2nd series, the corresponding M-δ curves are shown in Figures 10(a) and 10(b), respectively. As already mentioned, these two series were defined to test specimens under positive moments. M-δ curves: (a) 1st series; (b) 2nd series.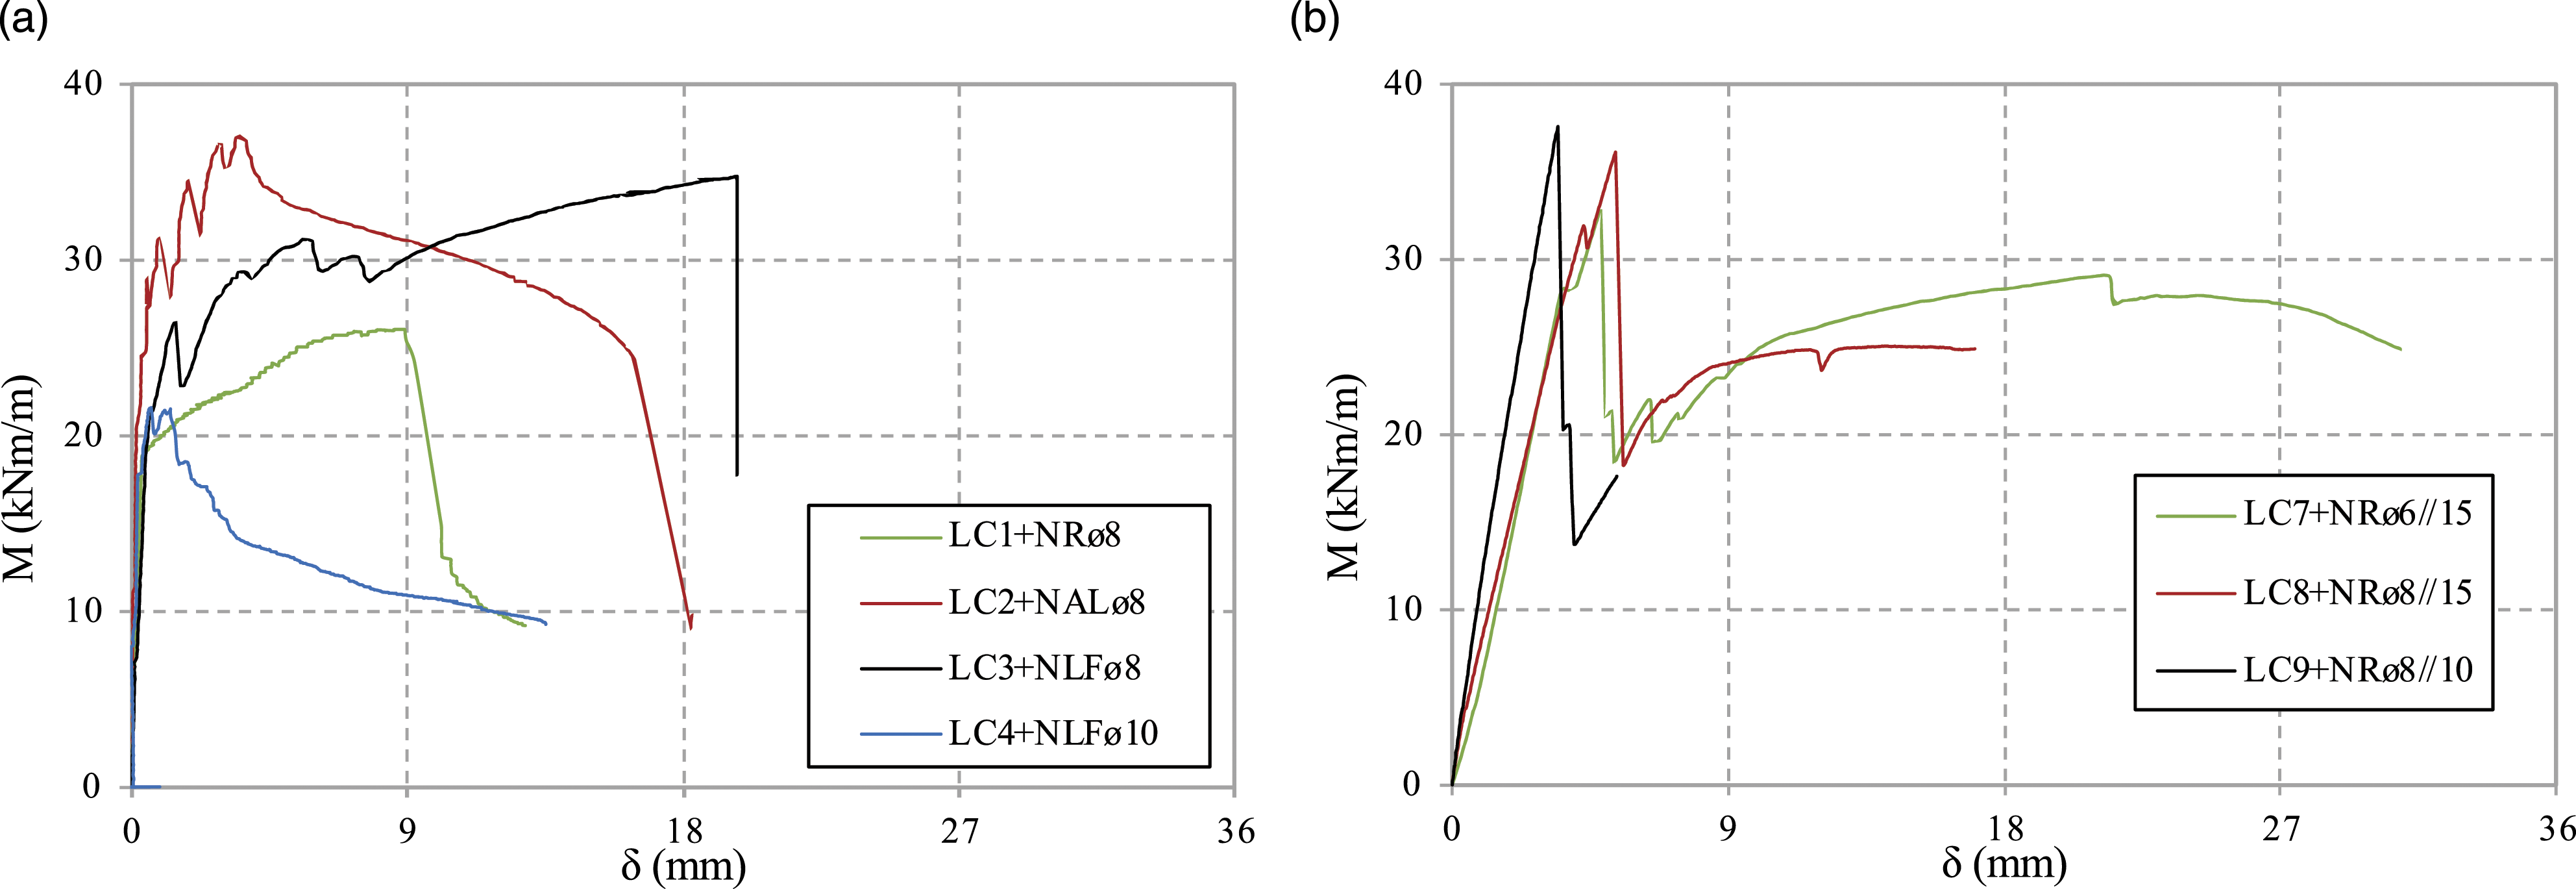
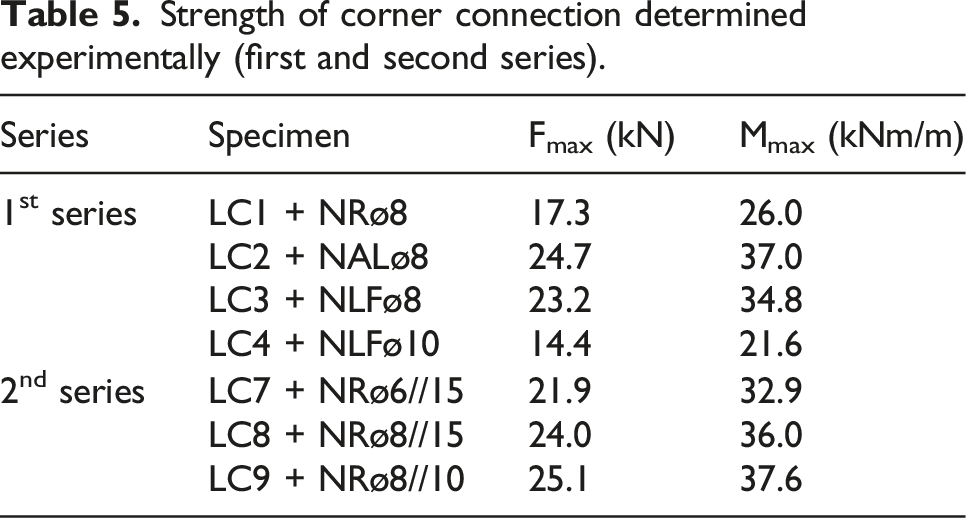
Strength of corner connection determined experimentally (first and second series).
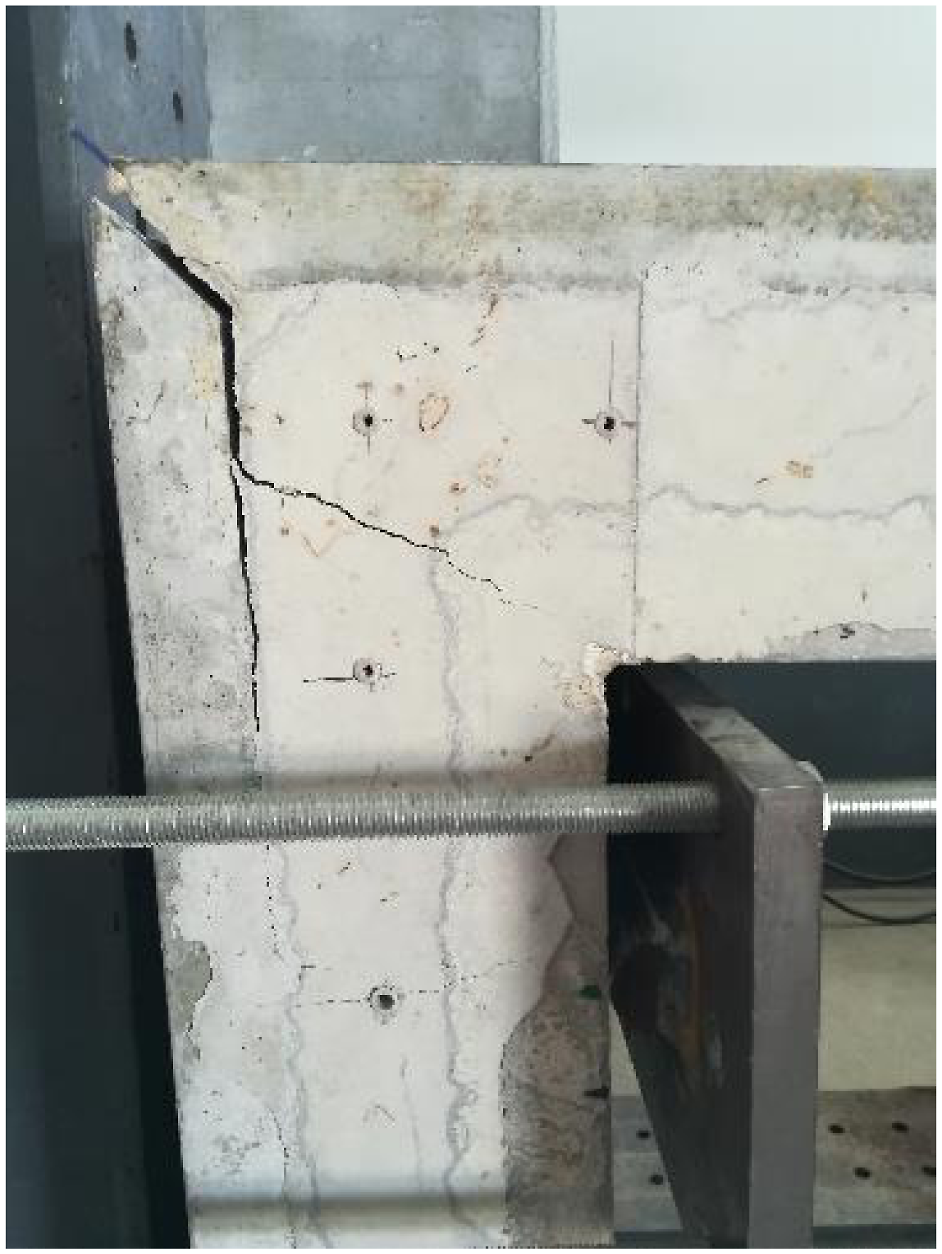
Cracking and delamination of LC3 + NLFø8 (1st series).
In the second series, the panels were glued using an epoxy resin and a better anchorage of the reinforcement was defined. The strength capacity increased with the reinforcement ratio, as expected, 38% relatively to the similar specimen of 1st series. In this series, the cracks in the critical region were not so visible, because the tensile stresses were better supported by the rebars, and it is also a sign of a better transfer of forces between the two orthogonal walls. The reinforcement anchorage in the external panel allows a better use of the steel capacity, significantly limiting the cracks opening. The failure in the second series, identified using computer vision, was identical in the three tests, although less evident in the specimen LC8 (Figure 13). The failure is characterized by a detachment between the concrete core and the panels, and by a main transversal crack that crossed the entire section in the vertical part of the specimen. That main crack appeared at the end of reinforcement used in the core, proving that the anchorage length is insufficient. It must be pointed out that this length is conditioned by the position of the trusses, adopted to create the gap between the prefabricated panels.
Strength under negative moment (3rd and 4th series)
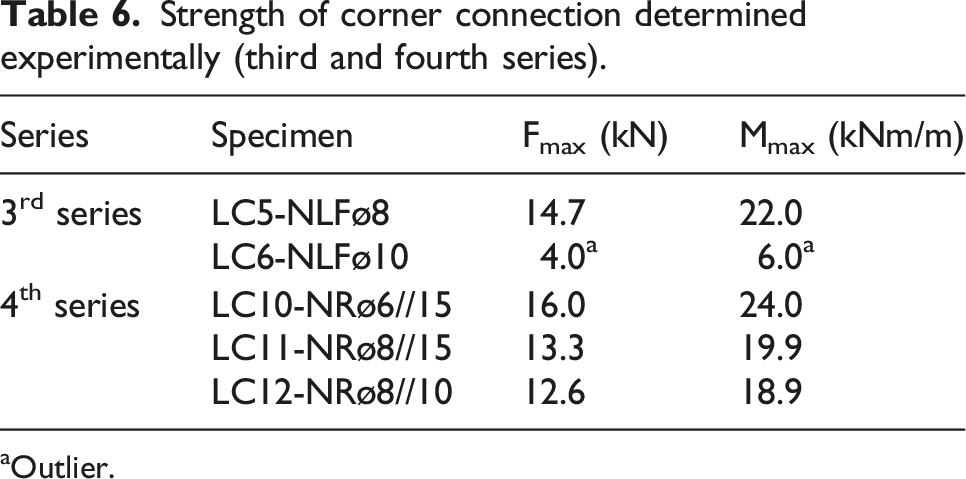
The M-δ curves were also plotted for both third and fourth series, and are shown in Figures 12(a) and 12(b), respectively. Even neglecting the specimen LC6-NLFø10, the results of the third series clearly show that the connection between the two perpendicular walls was not effective, being the maximum strength 36.6% lower than the similar specimen but submitted to positive moments (Table 6). This result indicates that the tension stresses were not properly transferred for the rebars. In this series the detachment of the prefabricated panel was not observed, probably because the maximum applied load, and consequently the generated shear stresses, are lower than those recorded in the tests of the 1st series. Moment-displacement relation (negative moments): (a) 3rd series; (b) 4th series. Strength of corner connection determined experimentally (third and fourth series). aOutlier.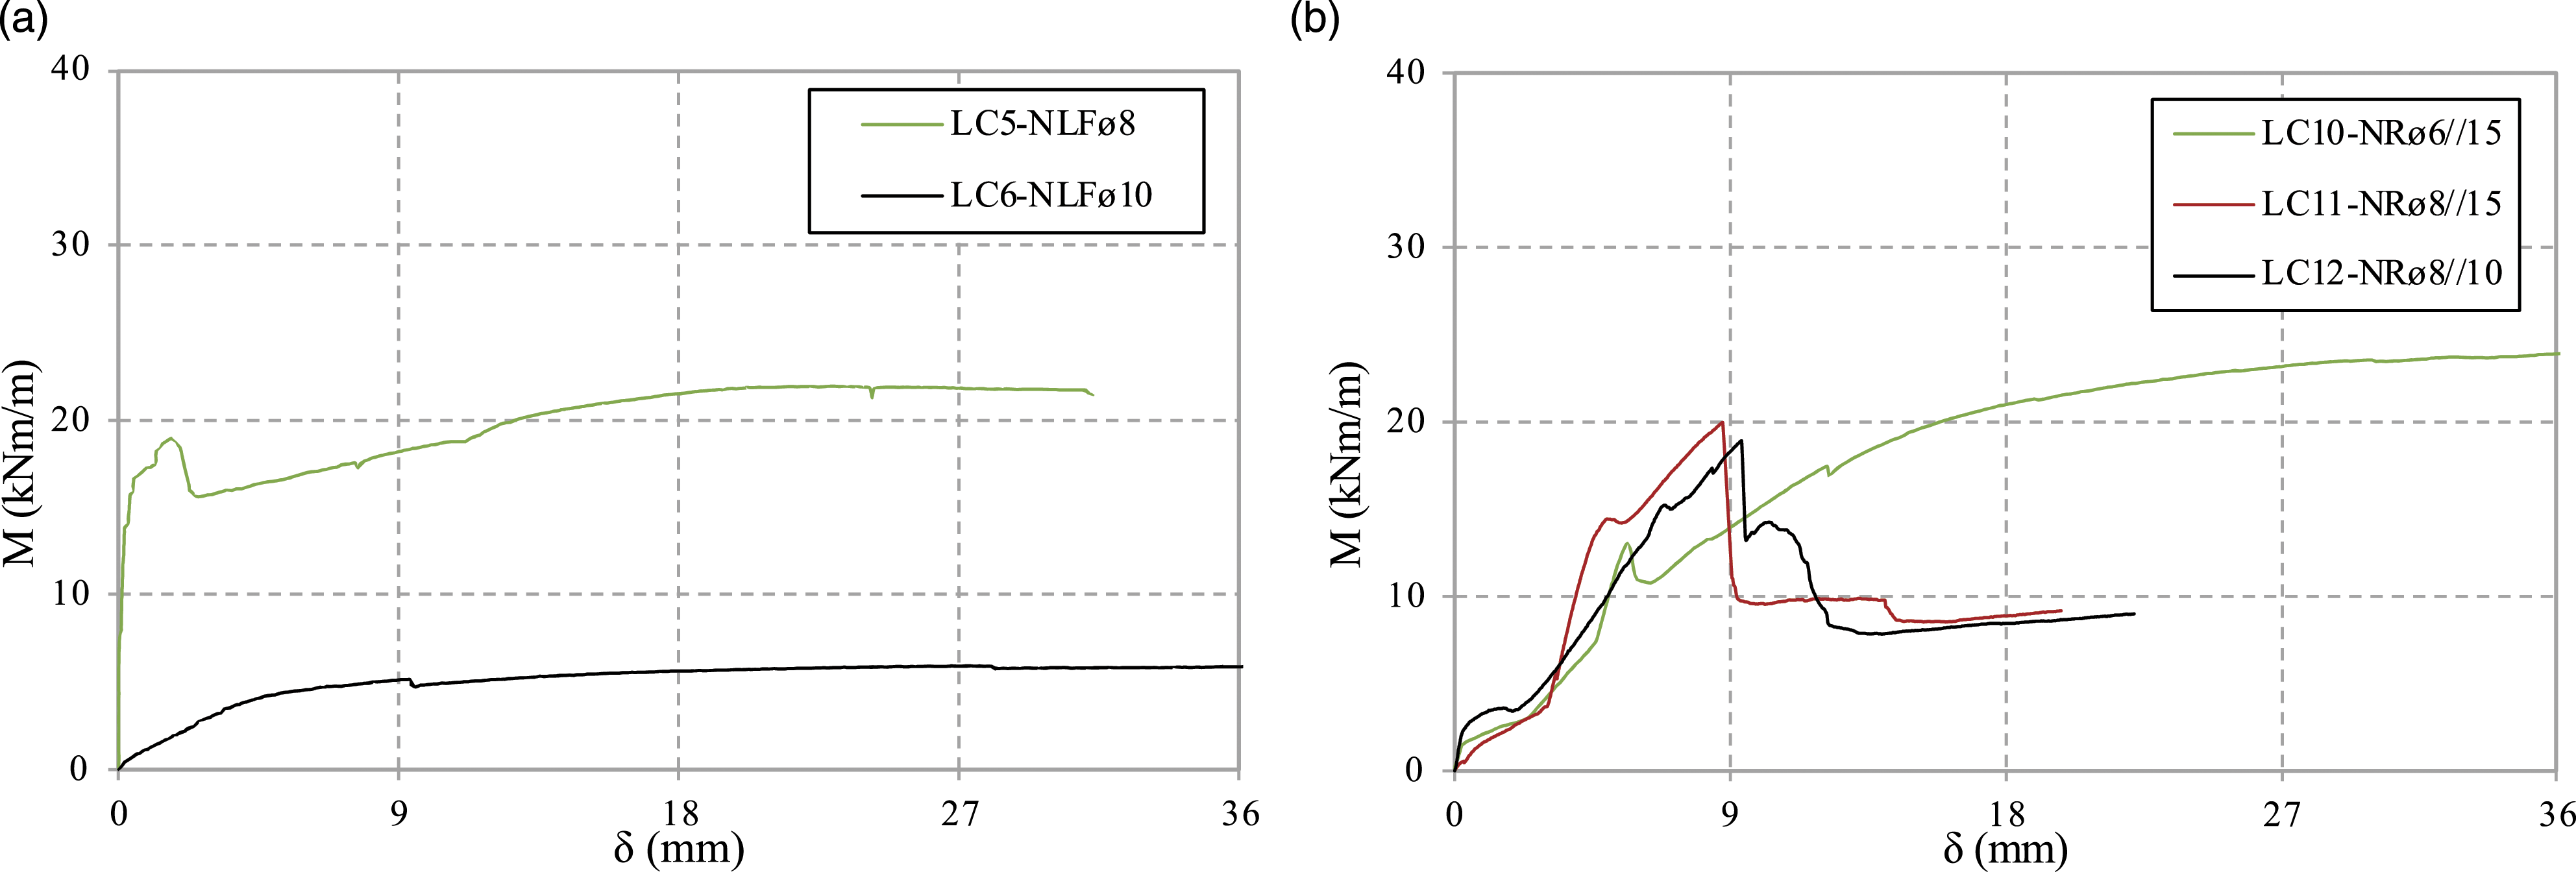
The first part of the curves corresponding to fourth series, up to a moment of 3 kNm/m, has an atypical trend due to the deformation of the supports. In fact, to prevent these specimens from being pulled up, it was necessary to use a metallic support, but small adjustments/deformations were registered with the application of the first tension loads. In this series, the variation of reinforcement did not have the expected effect, and the strength capacity did not increase with the increase of the reinforcement ratio (see LC10 and LC11), which confirms the above-mentioned statement: the tension stresses were not properly transferred to the steel reinforcement. The lack of space in the core did not allow to define a different reinforcement detailing. The improved anchorage of rebars, obtained by embedding these in the prefabricated panels, together with the use of epoxy resin, were insufficient to enhance the strength capacity of the connection under these conditions.
The cracking and deformation of the fourth series specimens were determined by computer vision (Figure 13). In LC10, the diagonal crack developed in the core splits into two cracks perpendicular to the cross section. Both LC11 and LC12 present a transversal crack in the vertical part of the specimen (panel with shorter reinforcement length), like in the second series, and there is a detachment of the inner panel at the vertical part of the specimen. These results also confirm the need to increase the length of the reinforcement inside the core. Cracking and deformation of 2nd and 4th series: (a) LC7; (b) LC8; (c) LC9; (d) LC10; (e) LC11; and (f) LC12.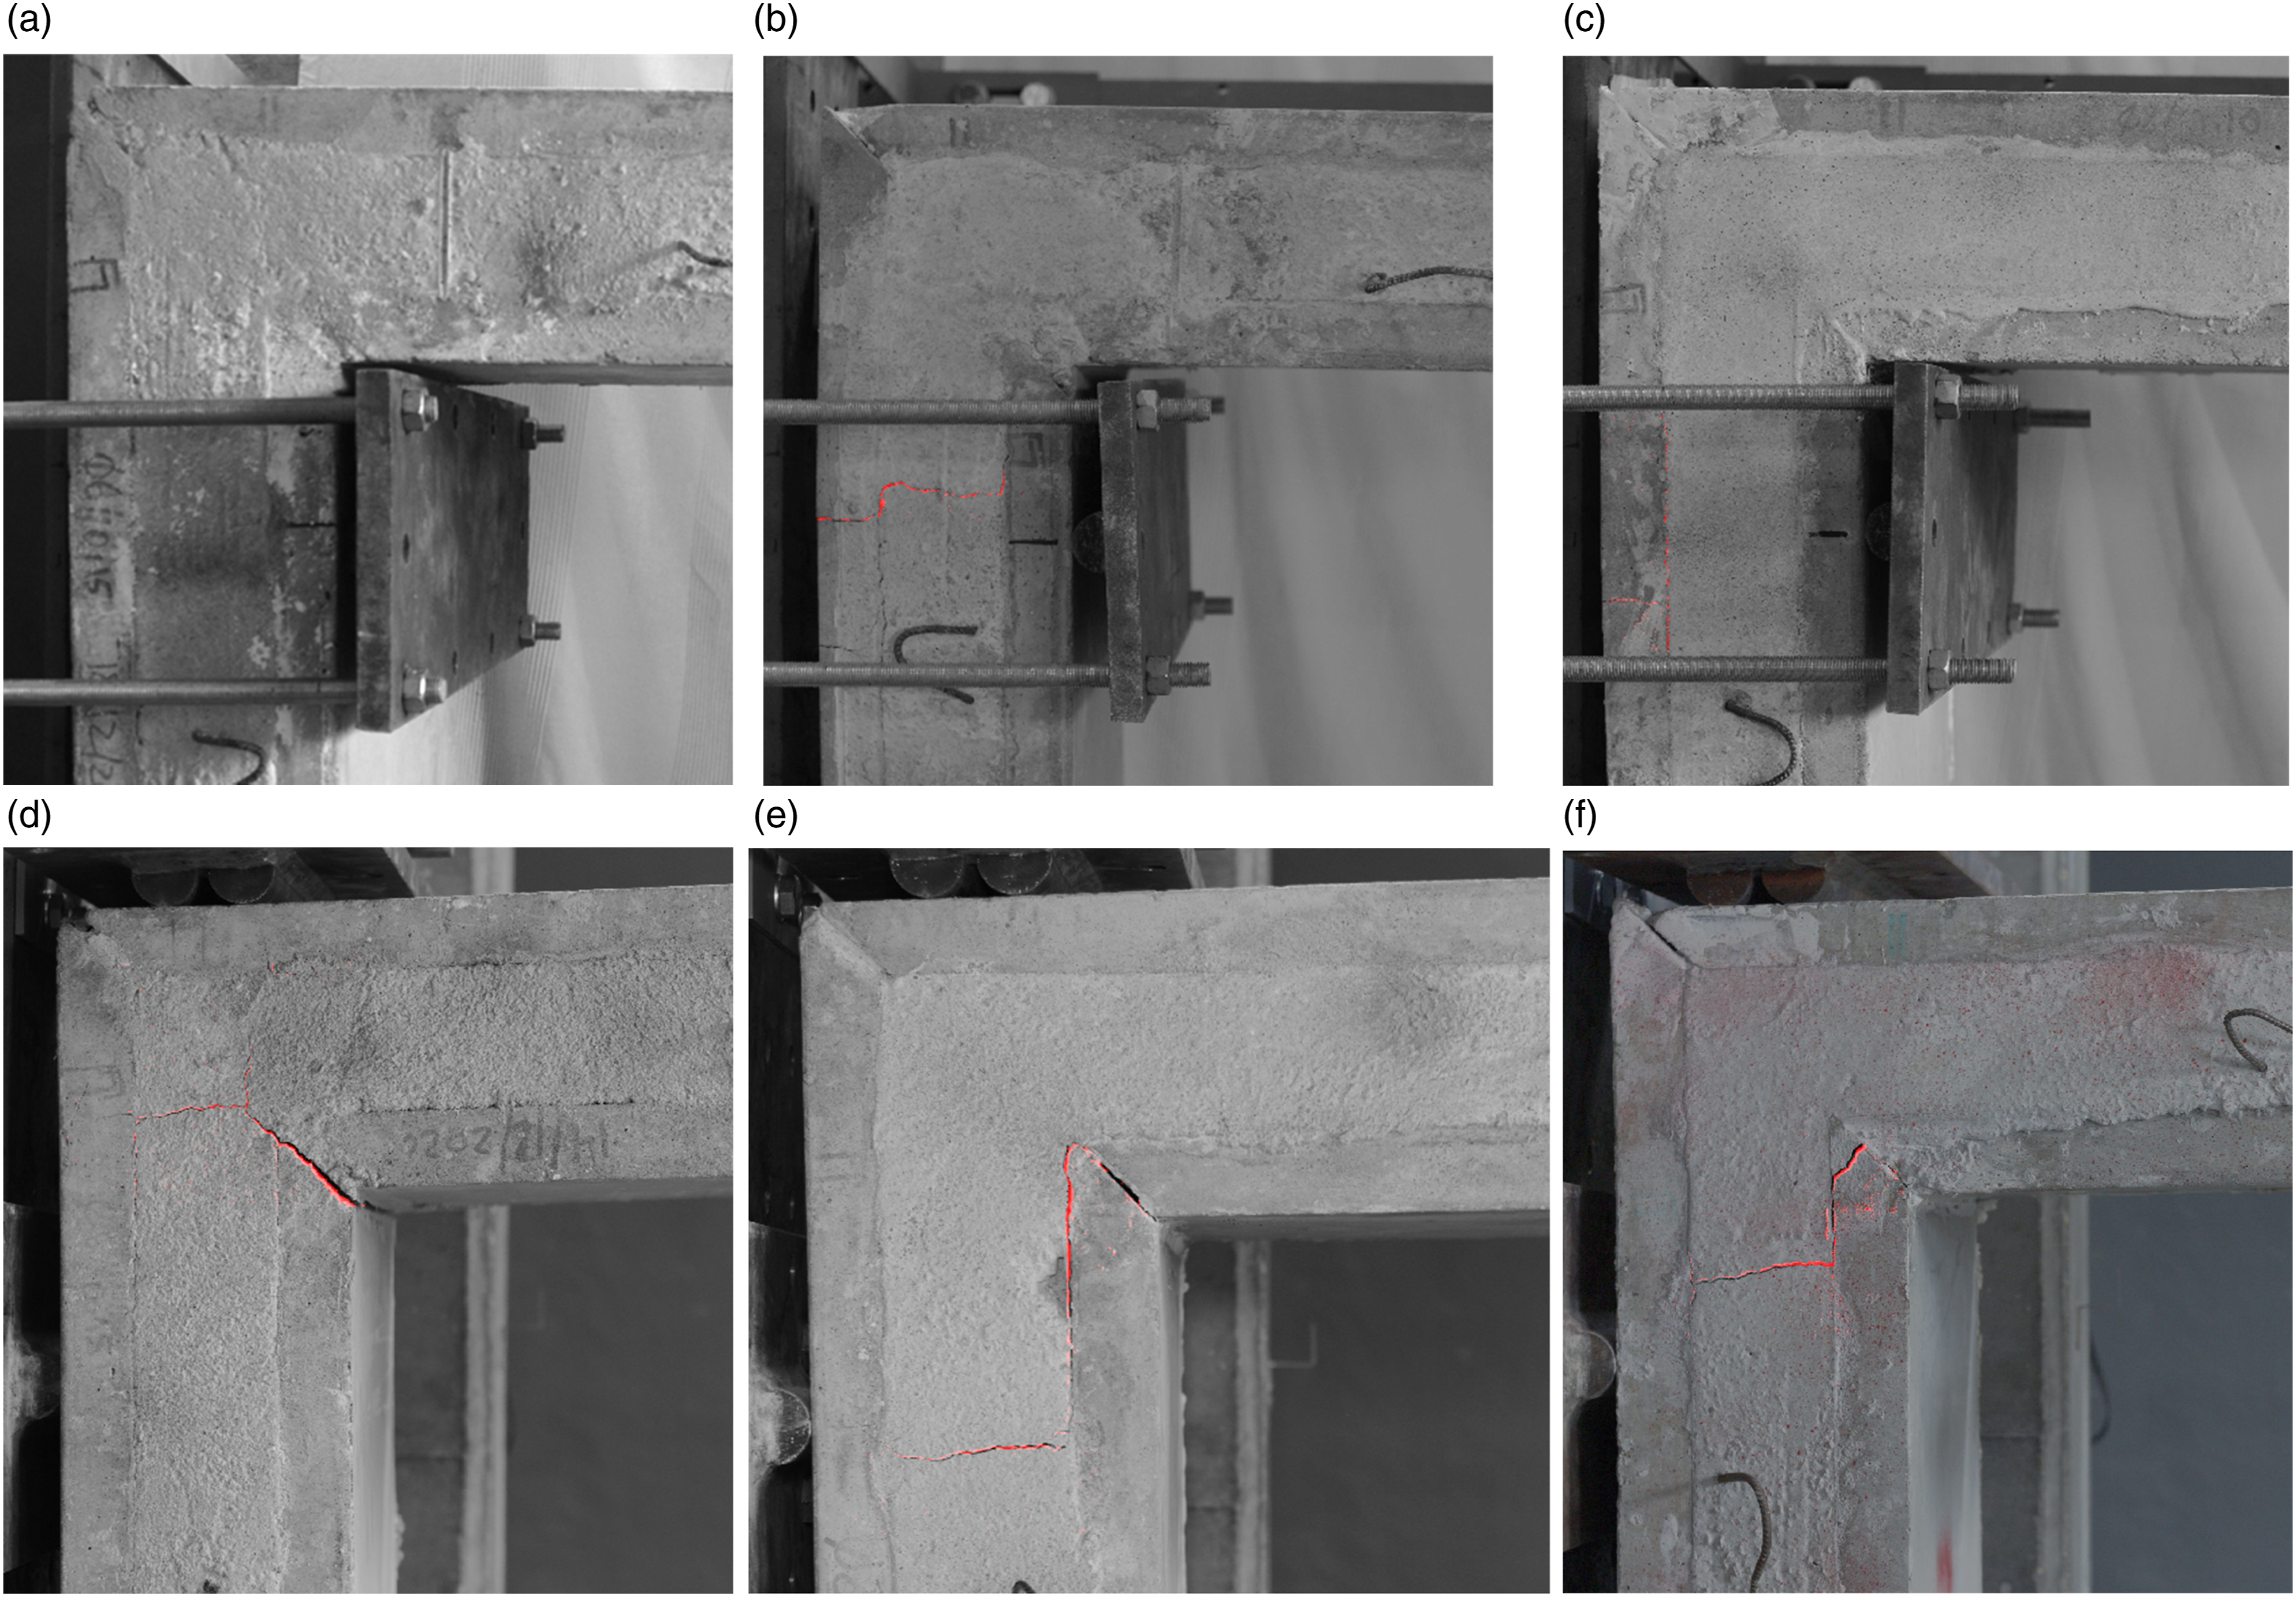
Results from computer vision
A detailed analysis was performed using computer vision and the following parameters were computed: (i) cracks pattern (Figure 13); (ii) evolution of the main crack width, w (Figure 14(a)); iii) variation of angle between the vertical and horizontal parts of the corner, Δθ (Figure 14(b)); and (iv) the deformation of the specimen (Figure 15). These parameters were measured in several instants: 1/3 Fmax, 2/3 Fmax, Fmax, as well as the instant immediately after failure and at post-peak stage. The deformed shapes presented in Figure 15 were computed for the maximum vertical displacement Results of image processing (2nd and 4th series): (a) M - w; (b) M- Δθ. Deformations of the horizontal part of the specimens at maximum load supported (2nd and 4th series). Parameters of the deformed shape at failure stage (second and fourth series).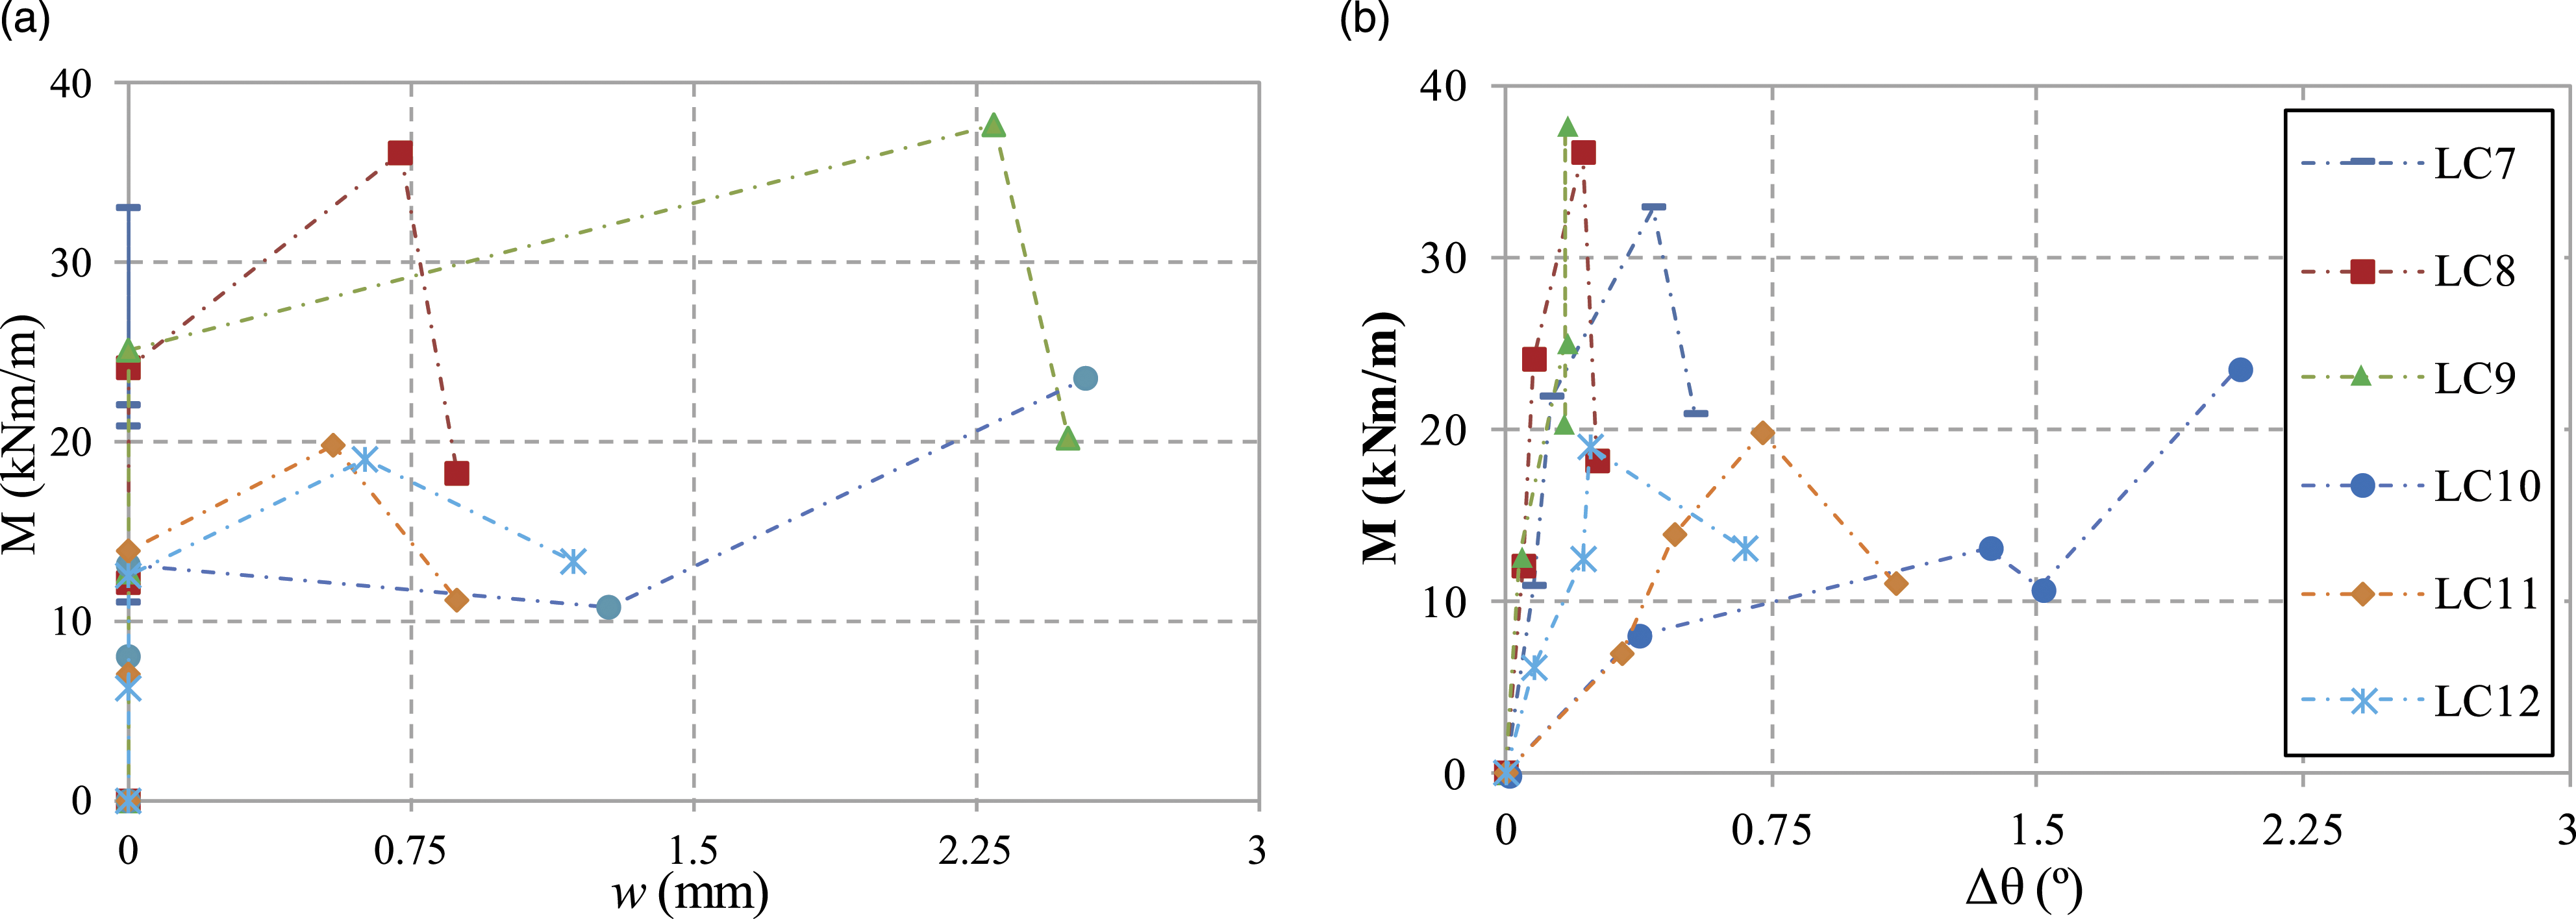
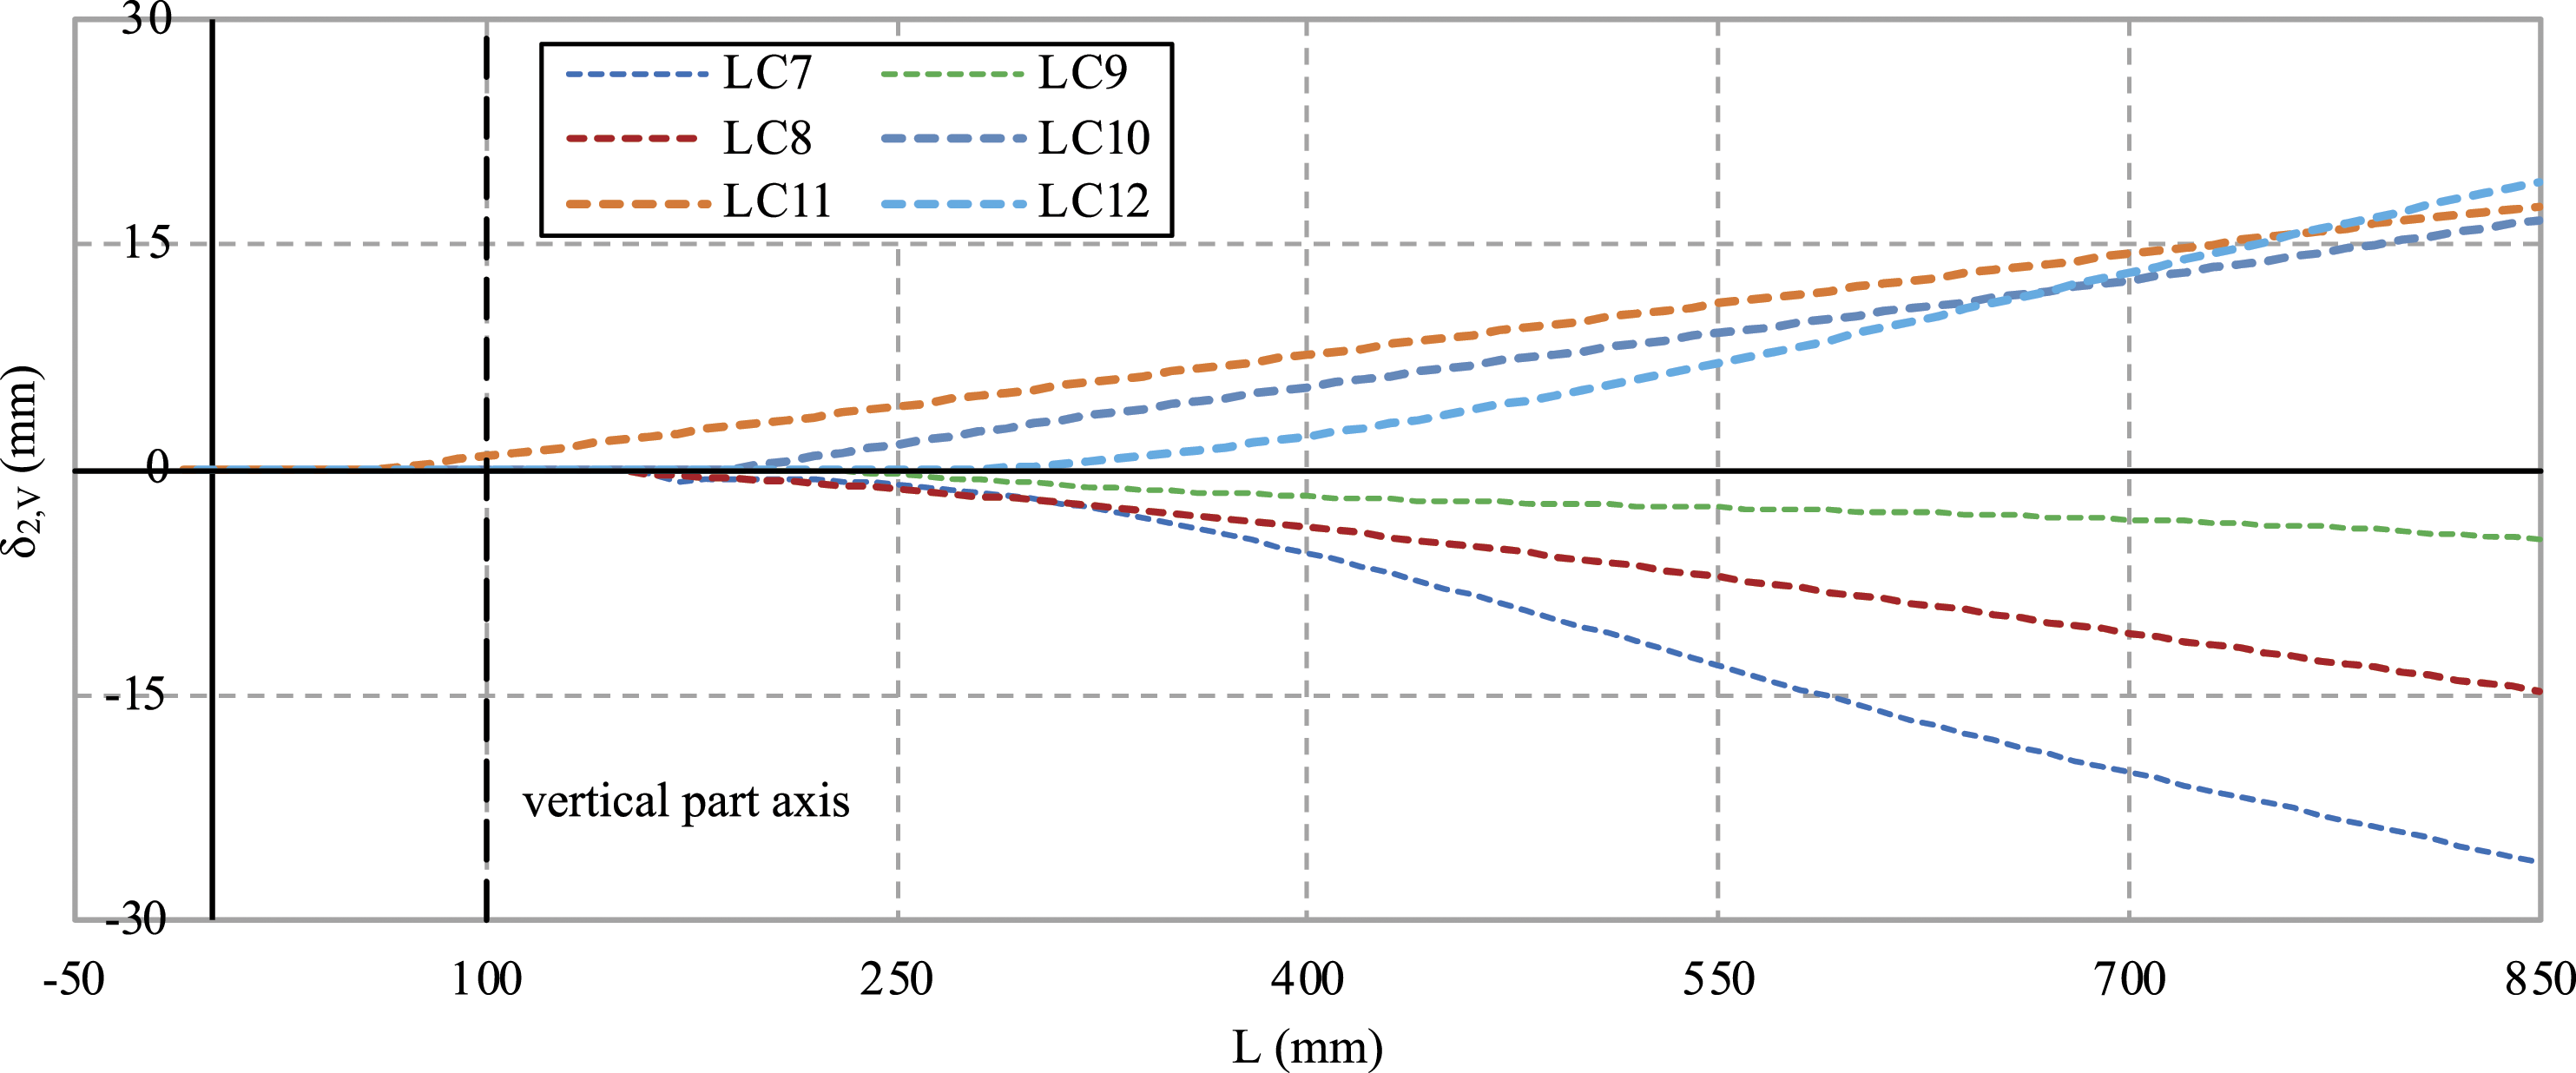
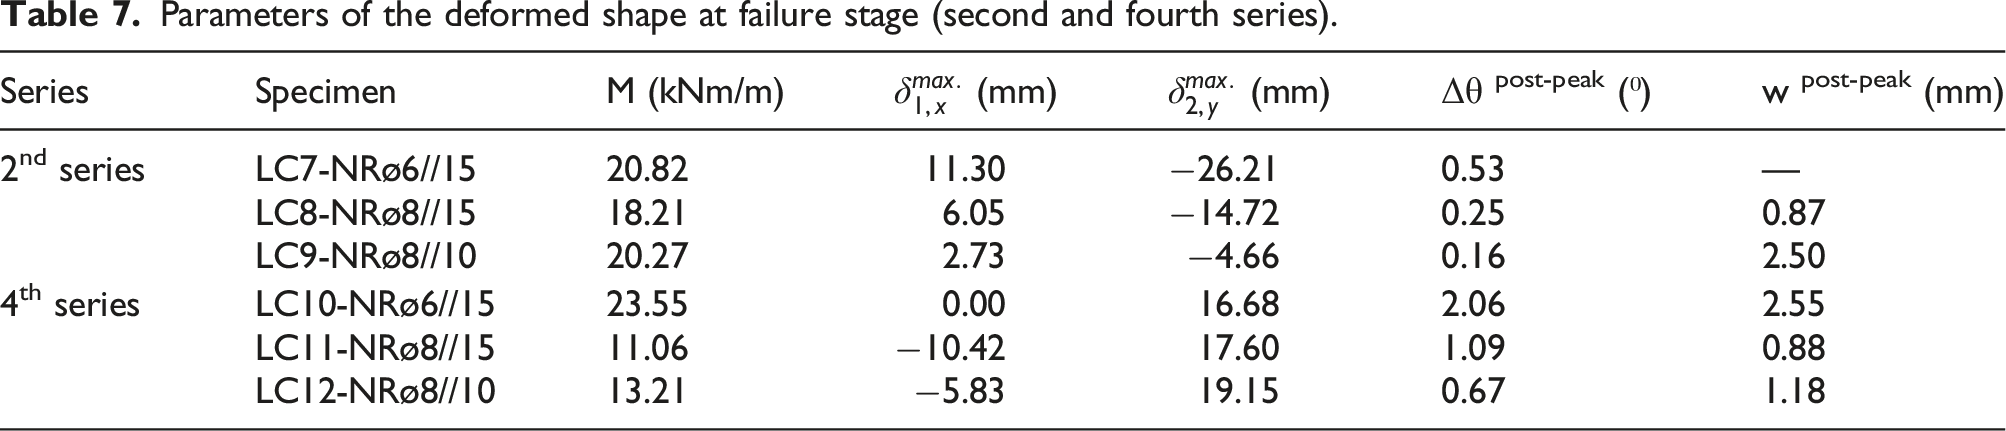
The analysis of the above-mentioned parameters clearly shows that failure is brittle in all specimens of the second and fourth series. The crack width had a discontinuous evolution, up to 22 kN.m/m for positive moments, and up to 13 kN.m/m for negative moments, and there were no cracks, or these were not detected in the images. After this stage the main crack had a sudden evolution and became very wide for a small increase of the applied moment. The evolution of Δθ has a different trend for the specimens under positive and negative moments. The specimens LC7 to LC9 have connections with a proper stiffness until failure. On the other hand, the curves of LC10 to LC12 have much lower slope, due to cracking and probably due to deformation of the supports. Figure 15 shows that the horizontal part of the specimens has practically no bending. The horizontal displacement, δ1,x, in the top of the corner presented in Table 7 and in Figure 15, occurred due to deformations of the vertical part of the specimen, as expected, with positive values for the second series, and negative values for the fourth series.
Numerical results and comparative analysis
The numerical results were compared with the results obtained with the experimental campaign, not only to validate the model, but also to help reaching a better understanding of the mechanisms of failure. The specimens the LC1, LC5, LC8 and LC11, one of each series, were used for this comparison. It must be pointed out that the CDP model was used in all numerical simulations, including the LC5, although the CDP is not fully adapted for concrete with steel fibres. Nevertheless, this was not a concern, because the concrete on the core does not play a relevant role in the structural response, as it was previously reported in a study about different types of connections (Martins et al. 2021b).
Comparing the numerical and experimental M-δ curves of LC1 and LC8, it is possible to identify some similarities and some differences, the results corresponding to LC1 have not exactly the same maximum moment but show a similar stiffness, and the results of LC8 hold a similar maximum moment but show a different stiffness (Figure 16). This latter difference was probably due to deformation of the supports in the experimental tests, as previously mentioned. The numerical simulations confirm that the rebars layout of the 1st series is not adequate and there is a premature detachment of the external panels, as recorded experimentally (Figures 11(a) and 16(b)). The results also show that the epoxy resin and the embedded rebars layout used in the second series increase the maximum moment, and this increment is equal to the value obtained experimentally. Comparing the Figures 11(b) and 16(c) and 16 days, it can also be stated that the numerical model simulates properly the failure mechanism of the second series, since the critical region, identified in red, is exactly the region where the main crack appeared. Considering the numerical results and difference to experimental ones, the instantaneous loss of strength of LC8 experimentally recorded, in the post peak stage, might be due to a weaker connection between the core and the panels resultant from a not so successful concrete casting of the core during the production process. Numerical results: (a) numerical and experimental M-δ curves; (b) LC1; (c) LC8; and (d) LC8 – perspective of inelastic strains.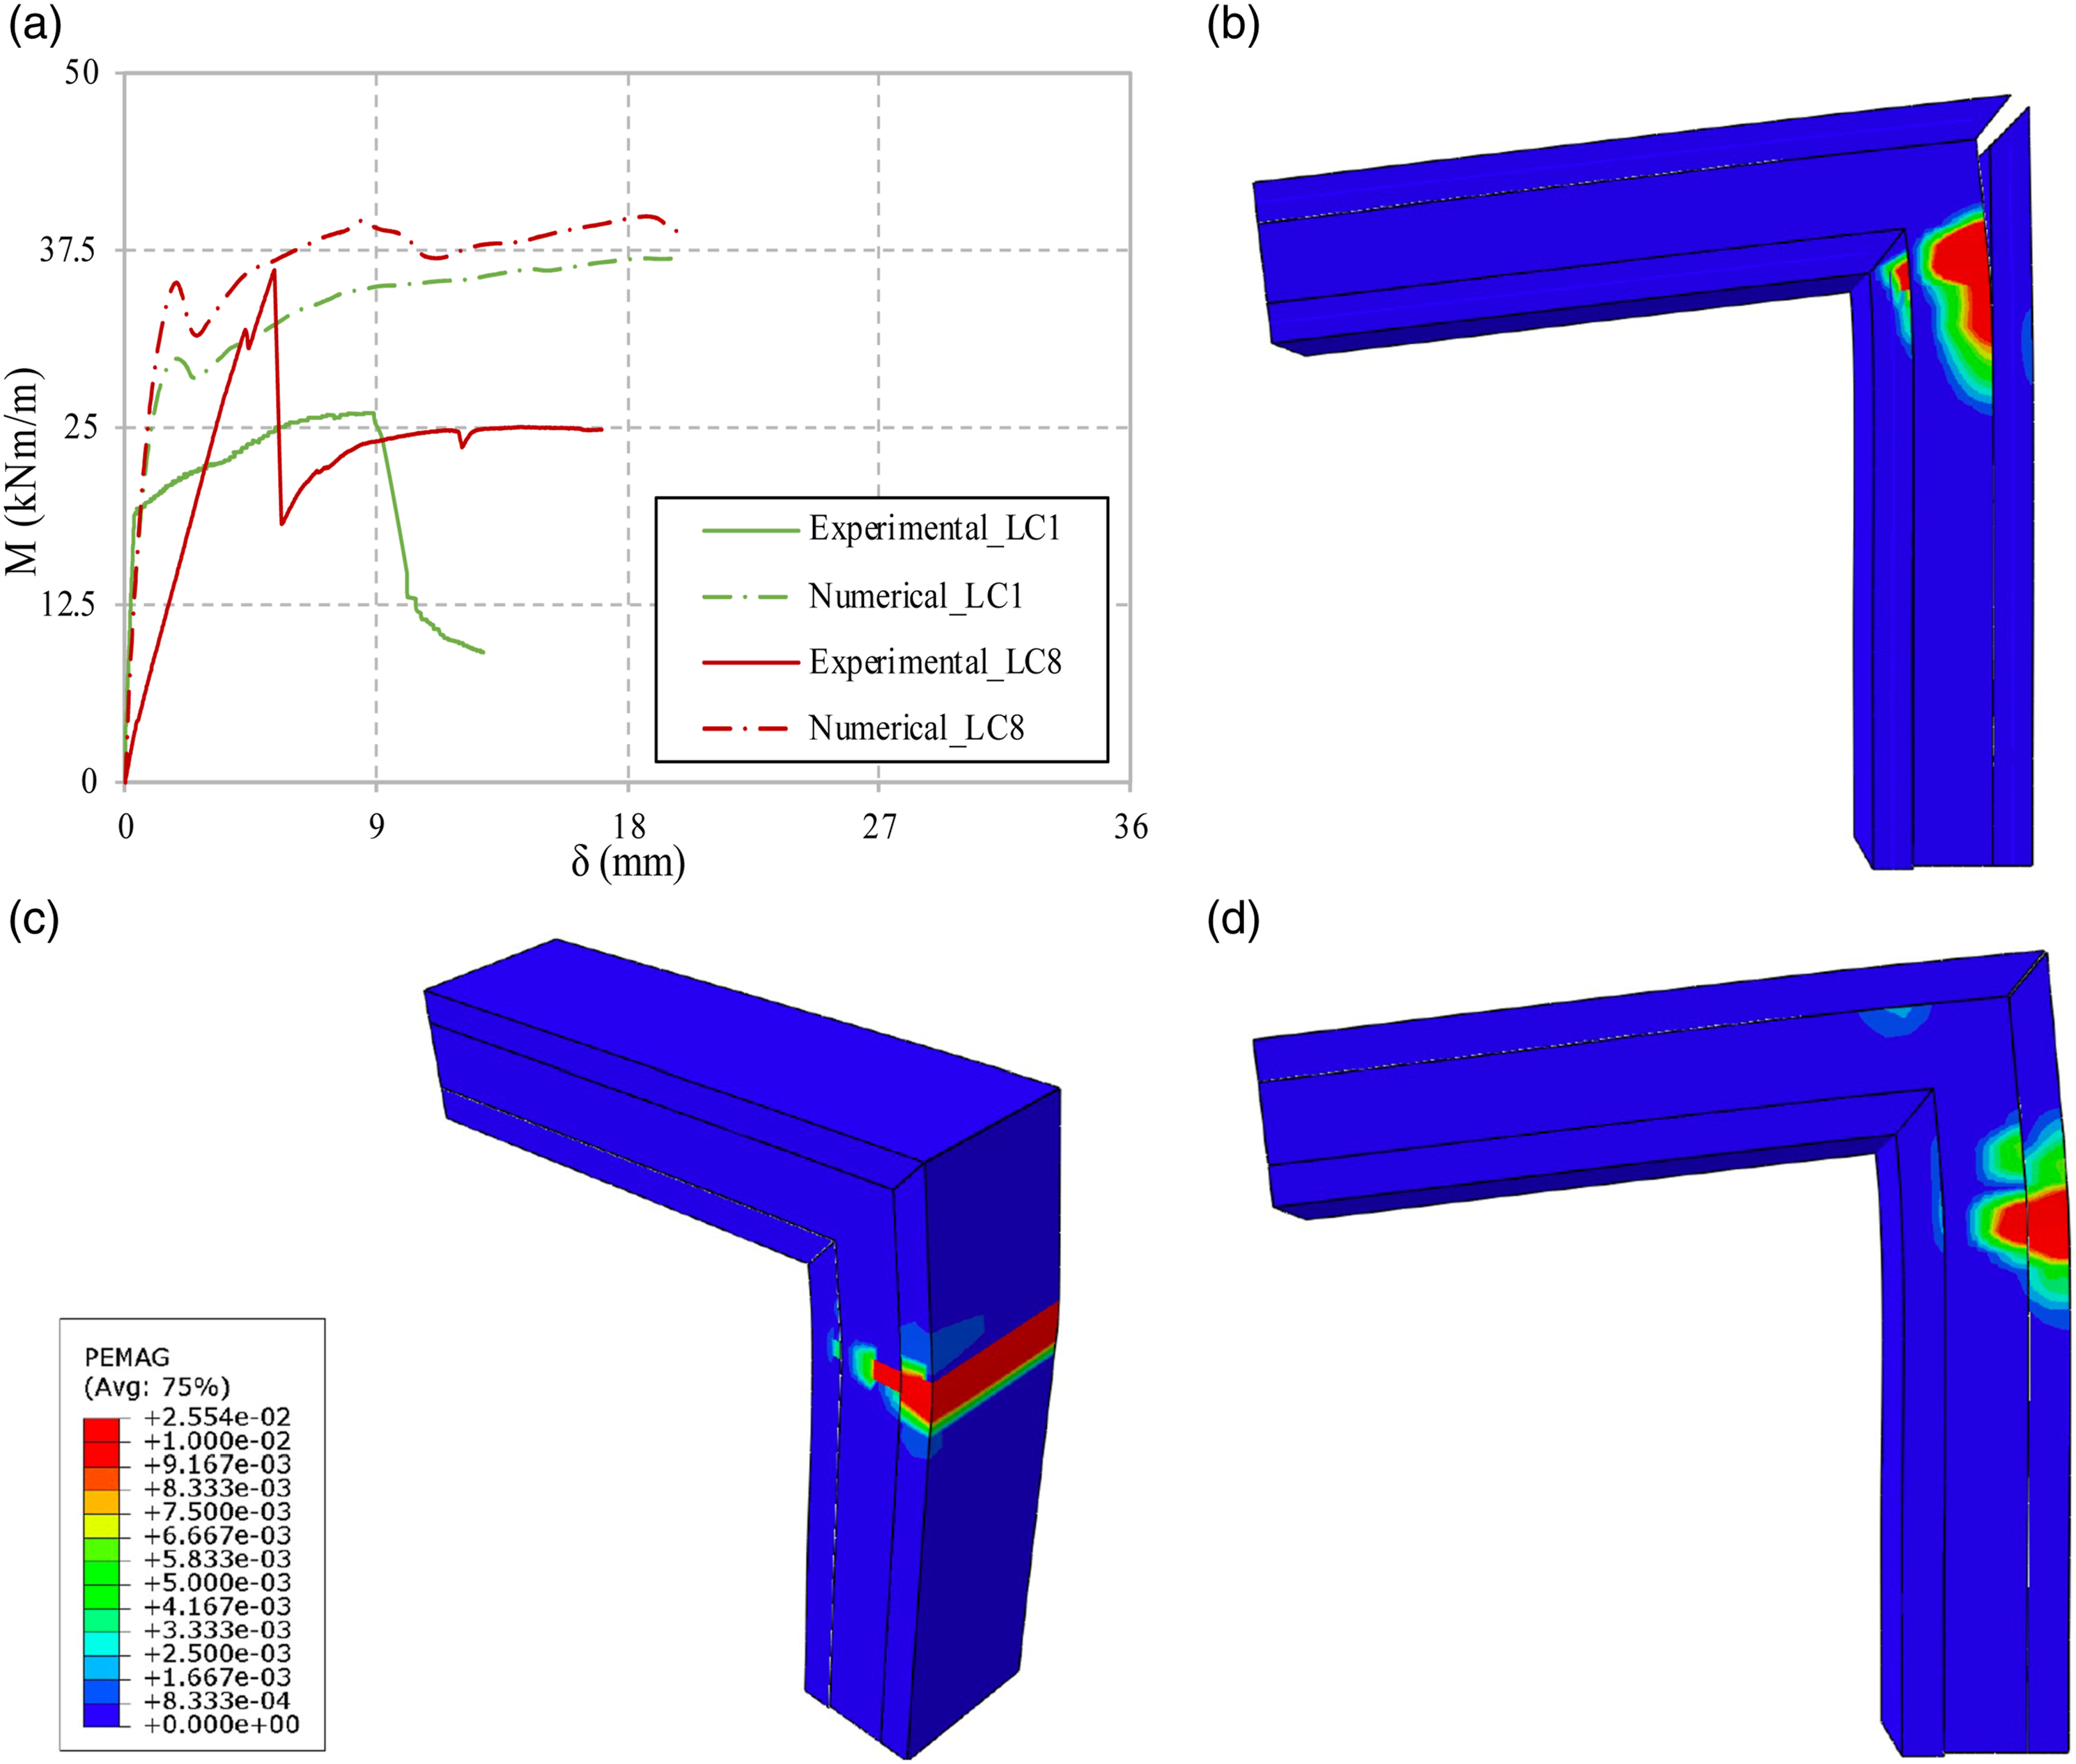
The main conclusions drawn comparing the numerical with the experimental M-δ curves of specimens under negative moments, LC5 and LC11, are like those referring to specimens under positive moments. The numerical results are very close to the experimental ones, particularly regarding the maximum supported moment (Figure 17). It should be pointed out that the initial adjustment of the reaction supports recorded in the test LC11 was not simulated in the numerical model. Structural response, M-δ curves for the specimens under negative moments.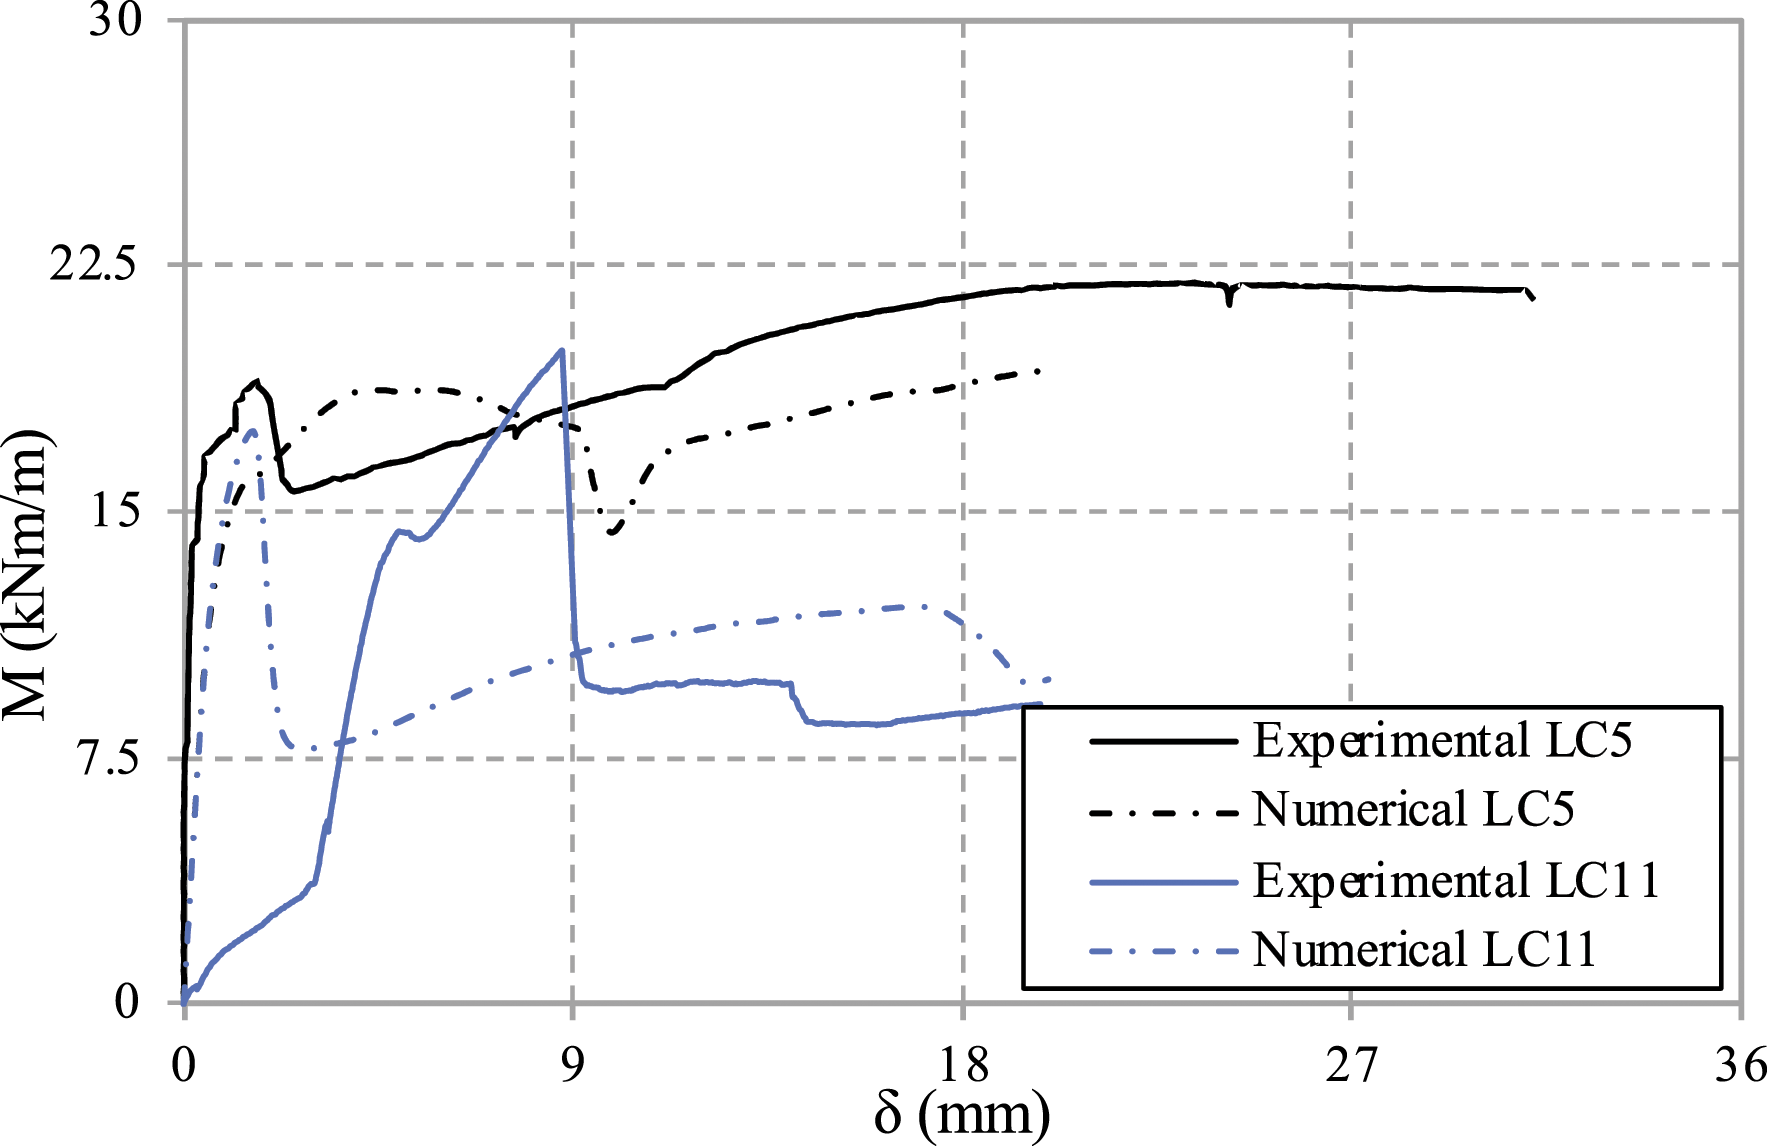
The gains predicted in terms of strength, by applying the epoxy resin and embedding the rebars in the external panels, were not significant and were almost the same in both situations, under positive and negative moments. These results prove that this solution does not provide an effective transmission of forces between the two perpendicular pre-walls. This comparison also leads to the conclusion that the numerical model can simulate the differences in flexural strength between the original and embedded rebar layouts.
Analysis of new solutions
After being validated, the numerical model was used to assess new solutions that can improve the transfer of forces between the two perpendicular pre-walls. The first approach consisted of increasing the roughness between the prefabricated panels and the core (Solution 1) to avoid the detachment observed in LC1, using a friction coefficient of 1.0 and a shear cohesive strength of 2.5 MPa. The second approach was related with the rebars arrangements, four different rebars layouts were defined (using rebars with the same diameter, ∅8), some aimed to be more adequate for positive moments (Solutions 2a and 2b) and the remaining aimed to be more suitable for negative moments (Solutions 3a and 3b), see Figure 18. To improve the anchorage of the reinforcement, some rebars were embedded on the prefabricated panels, which implies more work in the factory and a more demanding execution on site (Solution 2a and 3a). Solutions 2b and 3b have a similar arrangement to the other two but they were defined to be implemented at the construction site, therefore without embedded rebars in the panels. The diagonal rebars were defined to better support the tensile stresses located in the inner corner and the transversal reinforcement was defined to resist the tensile stresses that flow from the inner to the external vertices (see Figures 2 and 18). New detailing for the reinforcement.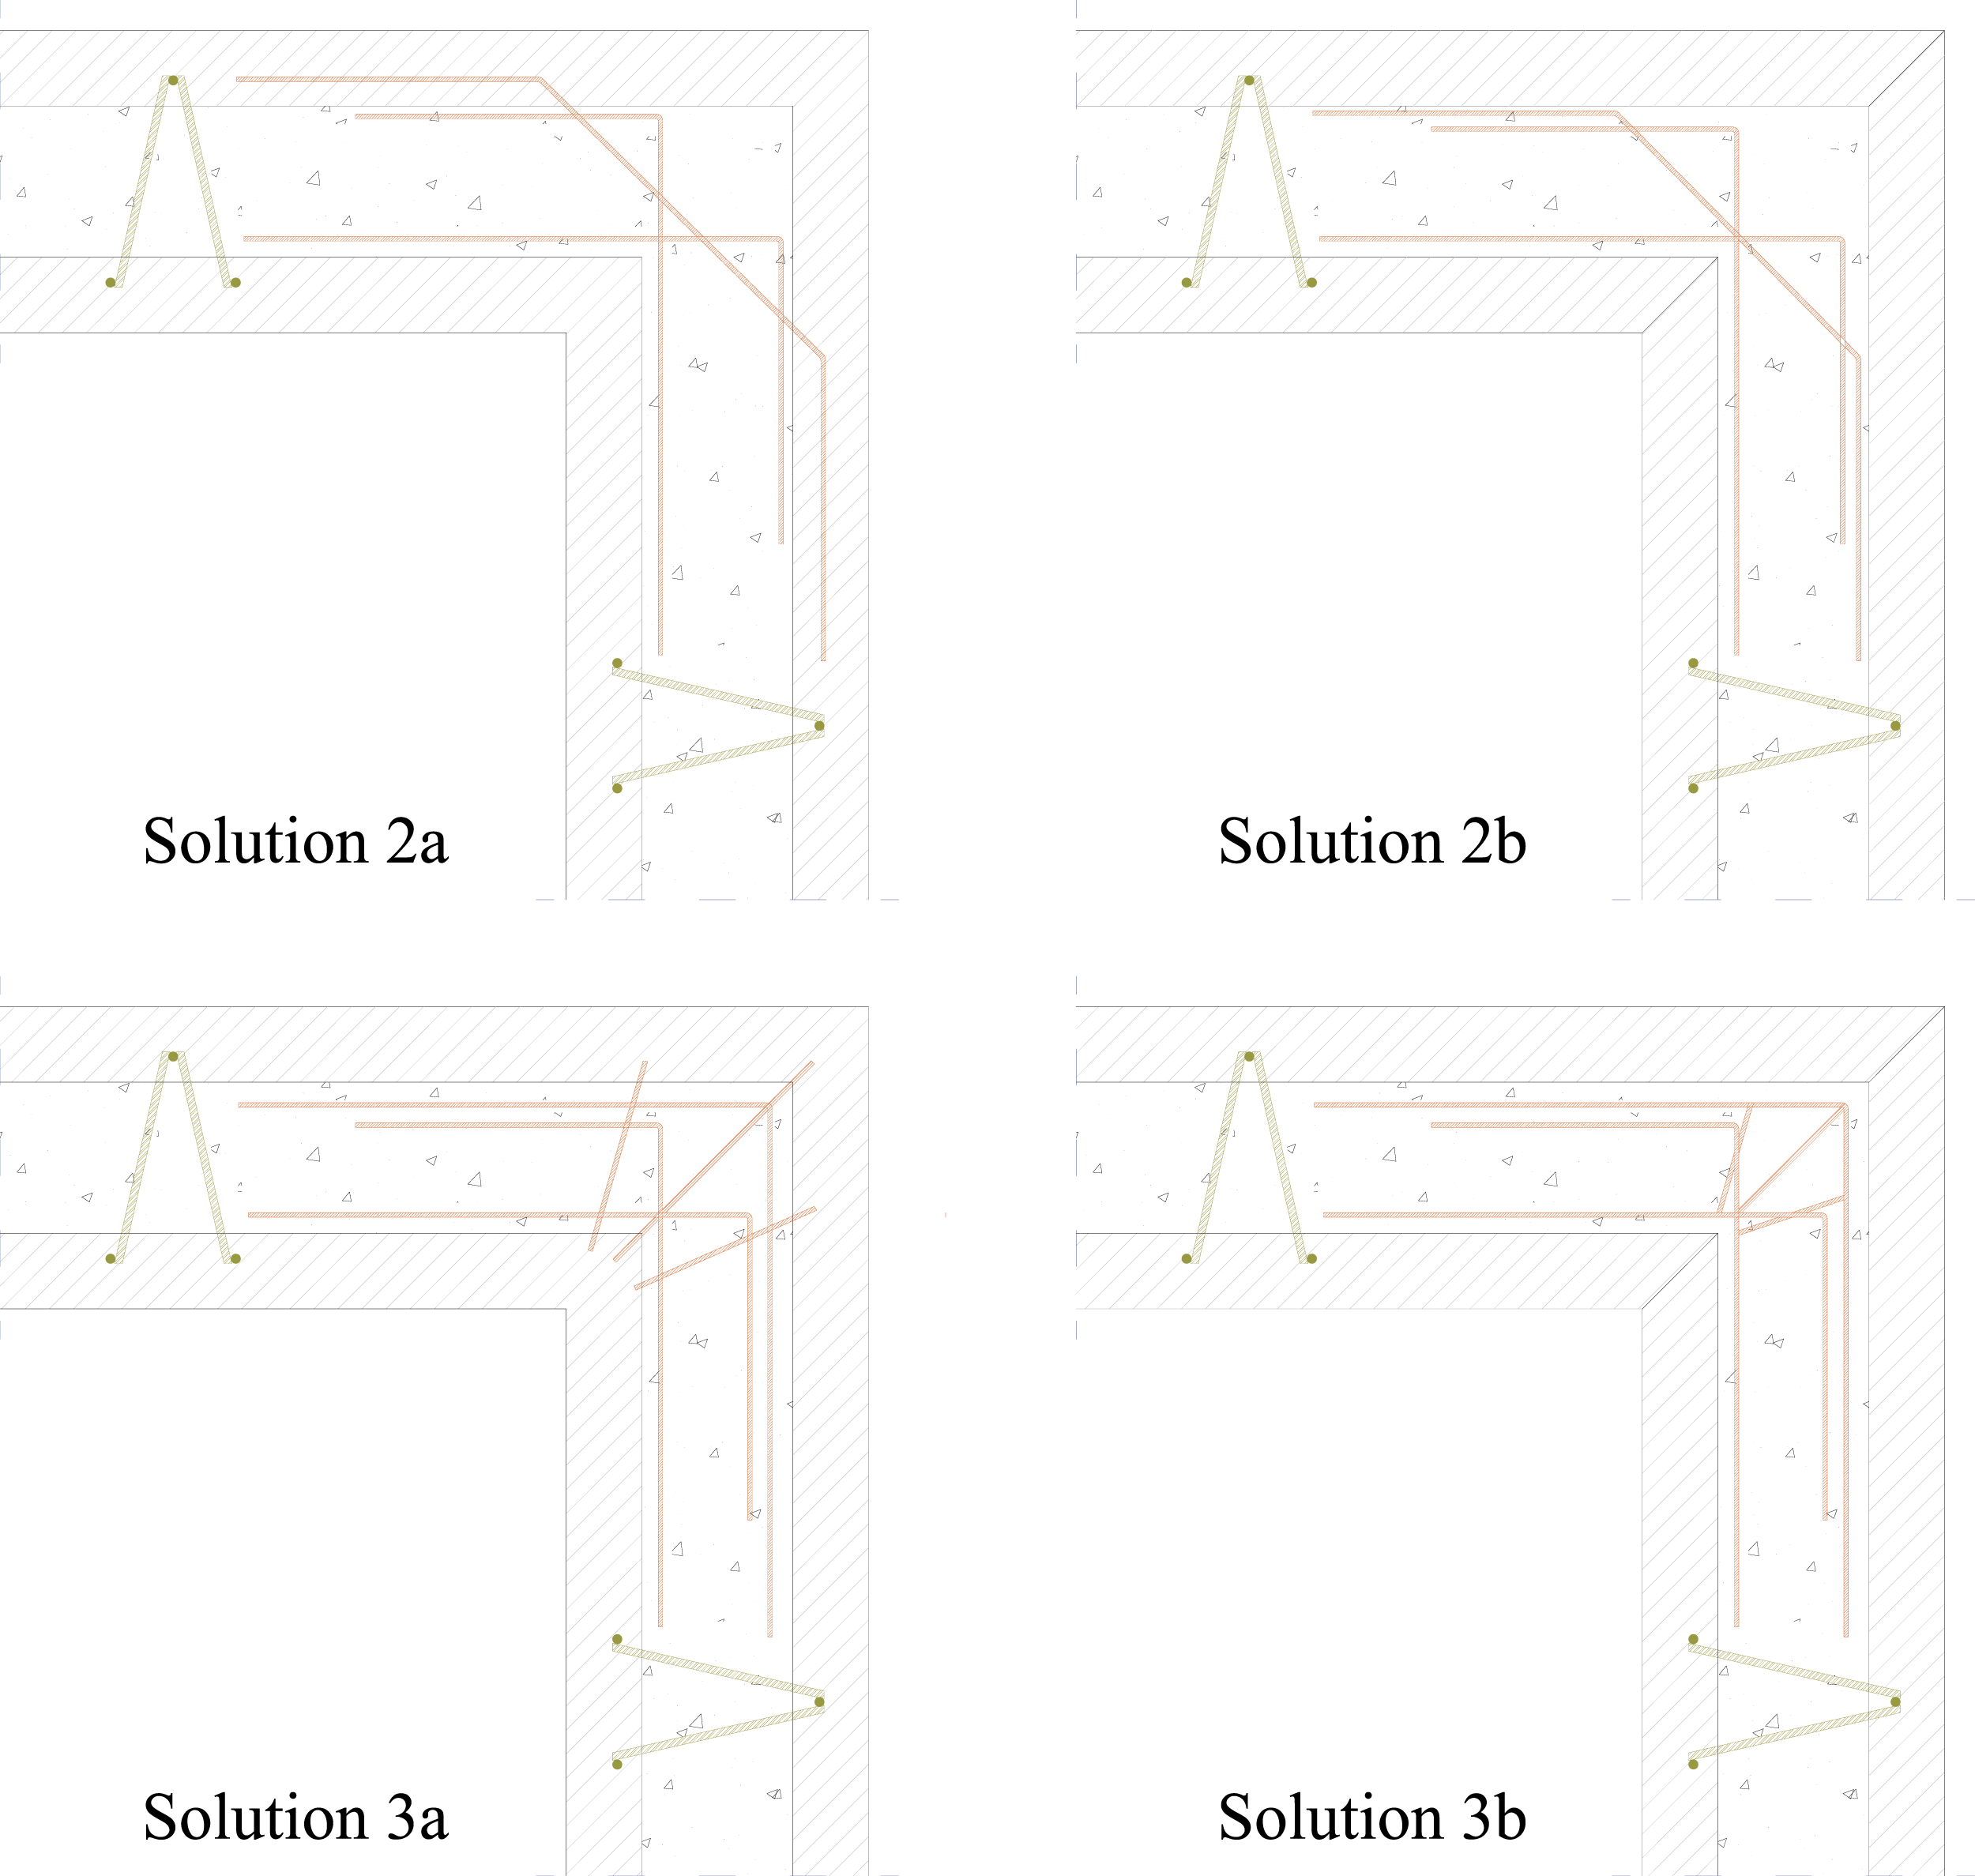
Ten new models were defined to simulate the behavior of the connection using the rebars layouts proposed and increasing the bond between the two concretes, half of the models were submitted to loads applied in compression and the other half to loads applied in tension. The previous mesh, materials and boundary conditions were kept in these new models.
For models subjected to positive moments, i.e., load applied in compression, it is possible to conclude, in terms of strength, that the increase of bond strength between the core and the precast panels, considerably increases the maximum strength, 51% relatively to LC1. After reaching the displacement of 7.5 mm, there was a significant loss of the interface shear strength, and the structural response approaches the original response. Comparing the curves corresponding to solutions ‘a’ and ‘b’, it is clear that the effect of connecting the rebars to the external panels mobilizes the external layer in a more effective way and thus the moment increases 47% relatively to LC1, at 7.5 mm (Figure 19). Without this type of anchorage, the M-δ curves are similar to those of the initial models. Under this type of load, the curves corresponding to solutions 2a and 3a were very close. Numerical results of the new solutions, positive moments: (a) numerical M-δ curves; (b) Model 2a - inelastic strains.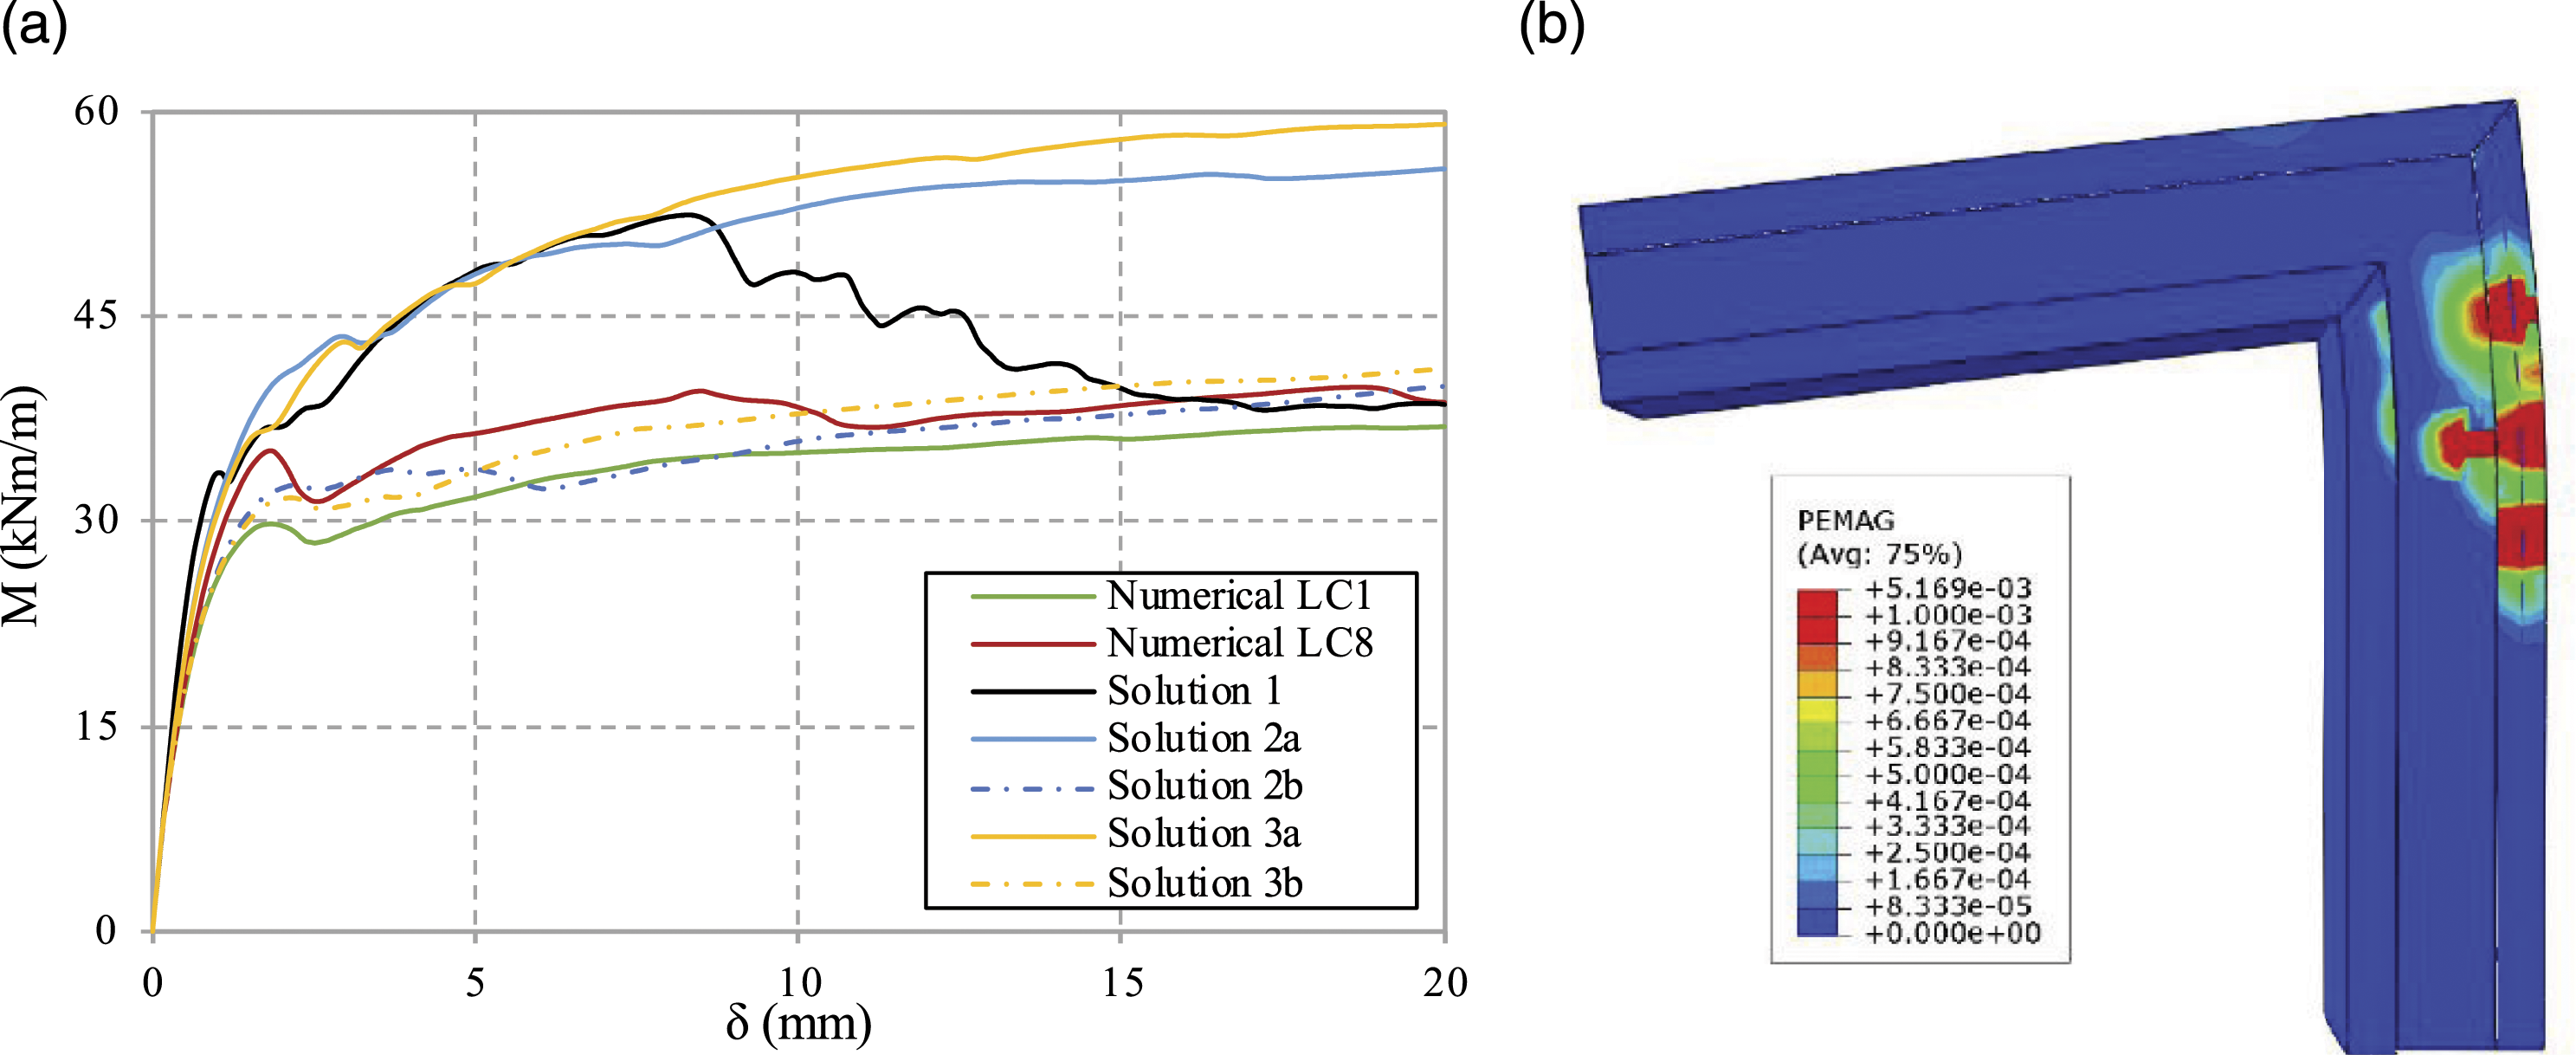
For models under negative moments, i.e., with load applied in tension, the differences between the several solutions were more significant, showing the relevance of the reinforcement layout for this state of stresses. The increase of bond between the core and the precast panels also increases the resistant moment at the first peak, but now the increase was only 14% relatively to LC5. The layout corresponding to model 3a is visibly the best option for this situation, with a resistant moment increase of 85% relatively to LC5. The model 2a also shows improvements in terms of strength, although lower than the previous one, being the corresponding increase 40%, proving once again the benefits of mobilizing the outer layer by embedding the reinforcement (Figure 20). As it can be seen, compared to cases submitted to positive moments, under negative moments is more difficult to achieve higher moments, the difference is circa 15 kN.m. Numerical results of the new solutions, negative moments: (a) numerical M-δ curves; (b) Model 3a - inelastic strains.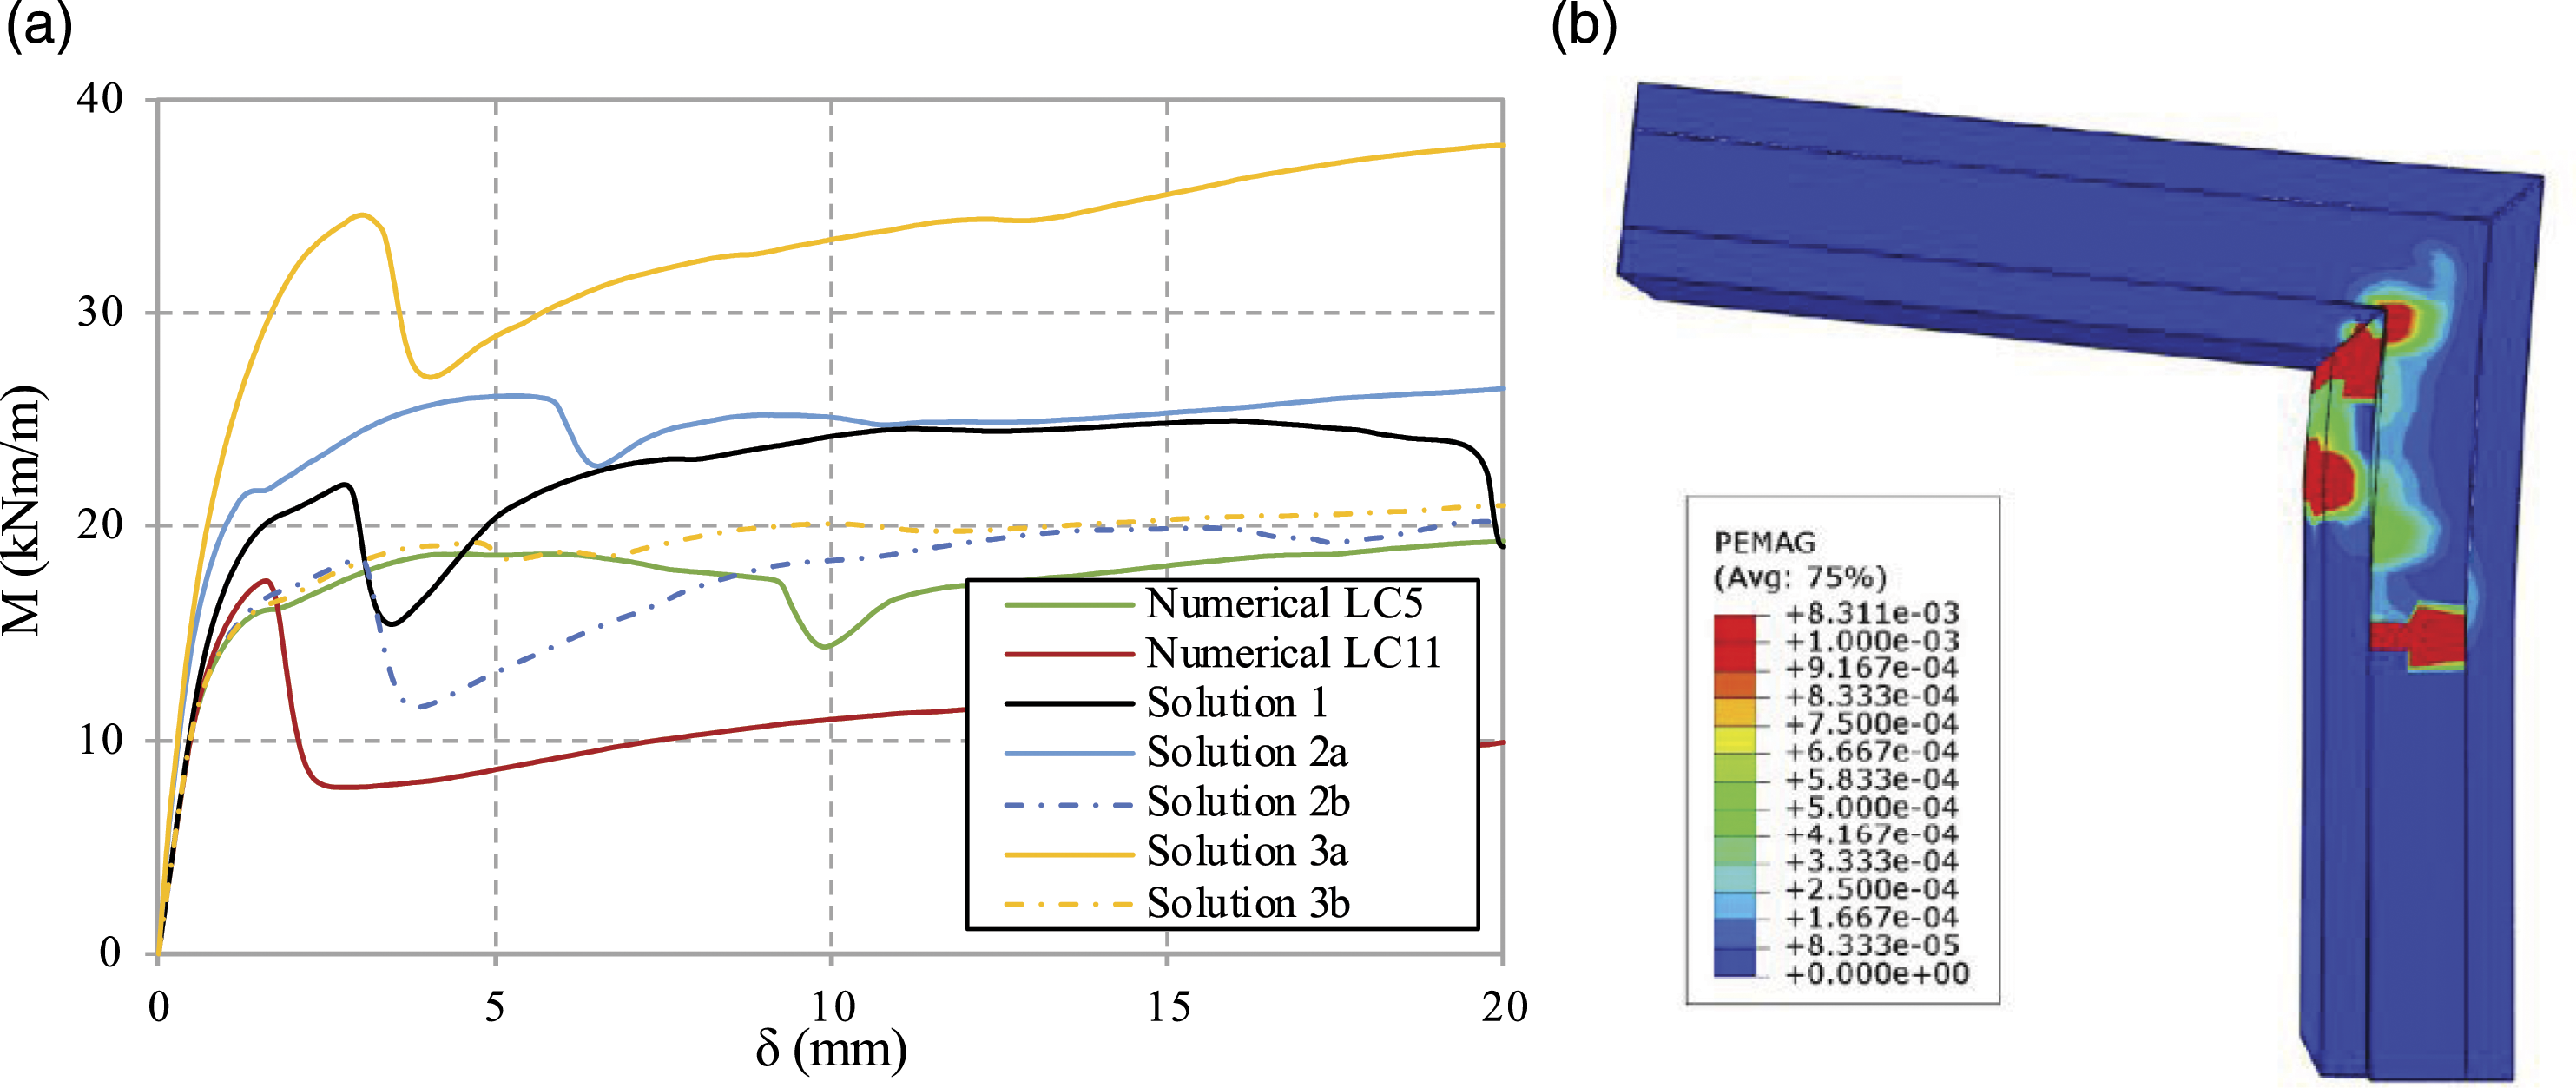
In general, the maximum moment is achieved for high values of displacement, and after the first peak is reached, showing that these connections have high deformation capacity without losing significant strength. Regarding the behaviour under serviceability conditions, i.e., 50%–60% of the maximum load, all models have small deformations, and similar stiffness.
Finally, to complement the previous layouts and to be used in high demanding situations, alternative solutions are proposed using prefabricated monolithic corners or prefabricated monolithic walls, that are assembled in situ to the remaining pre-walls (Figure 21). These are not exactly comparable with the previous ones because is not possible to fully use the superskin concept in the entire walls. These solutions were not tested and need to be more studied to prove that are suitable for these cases. Alternative solutions for corner: (a) monolithic corner; (b) monolithic wall.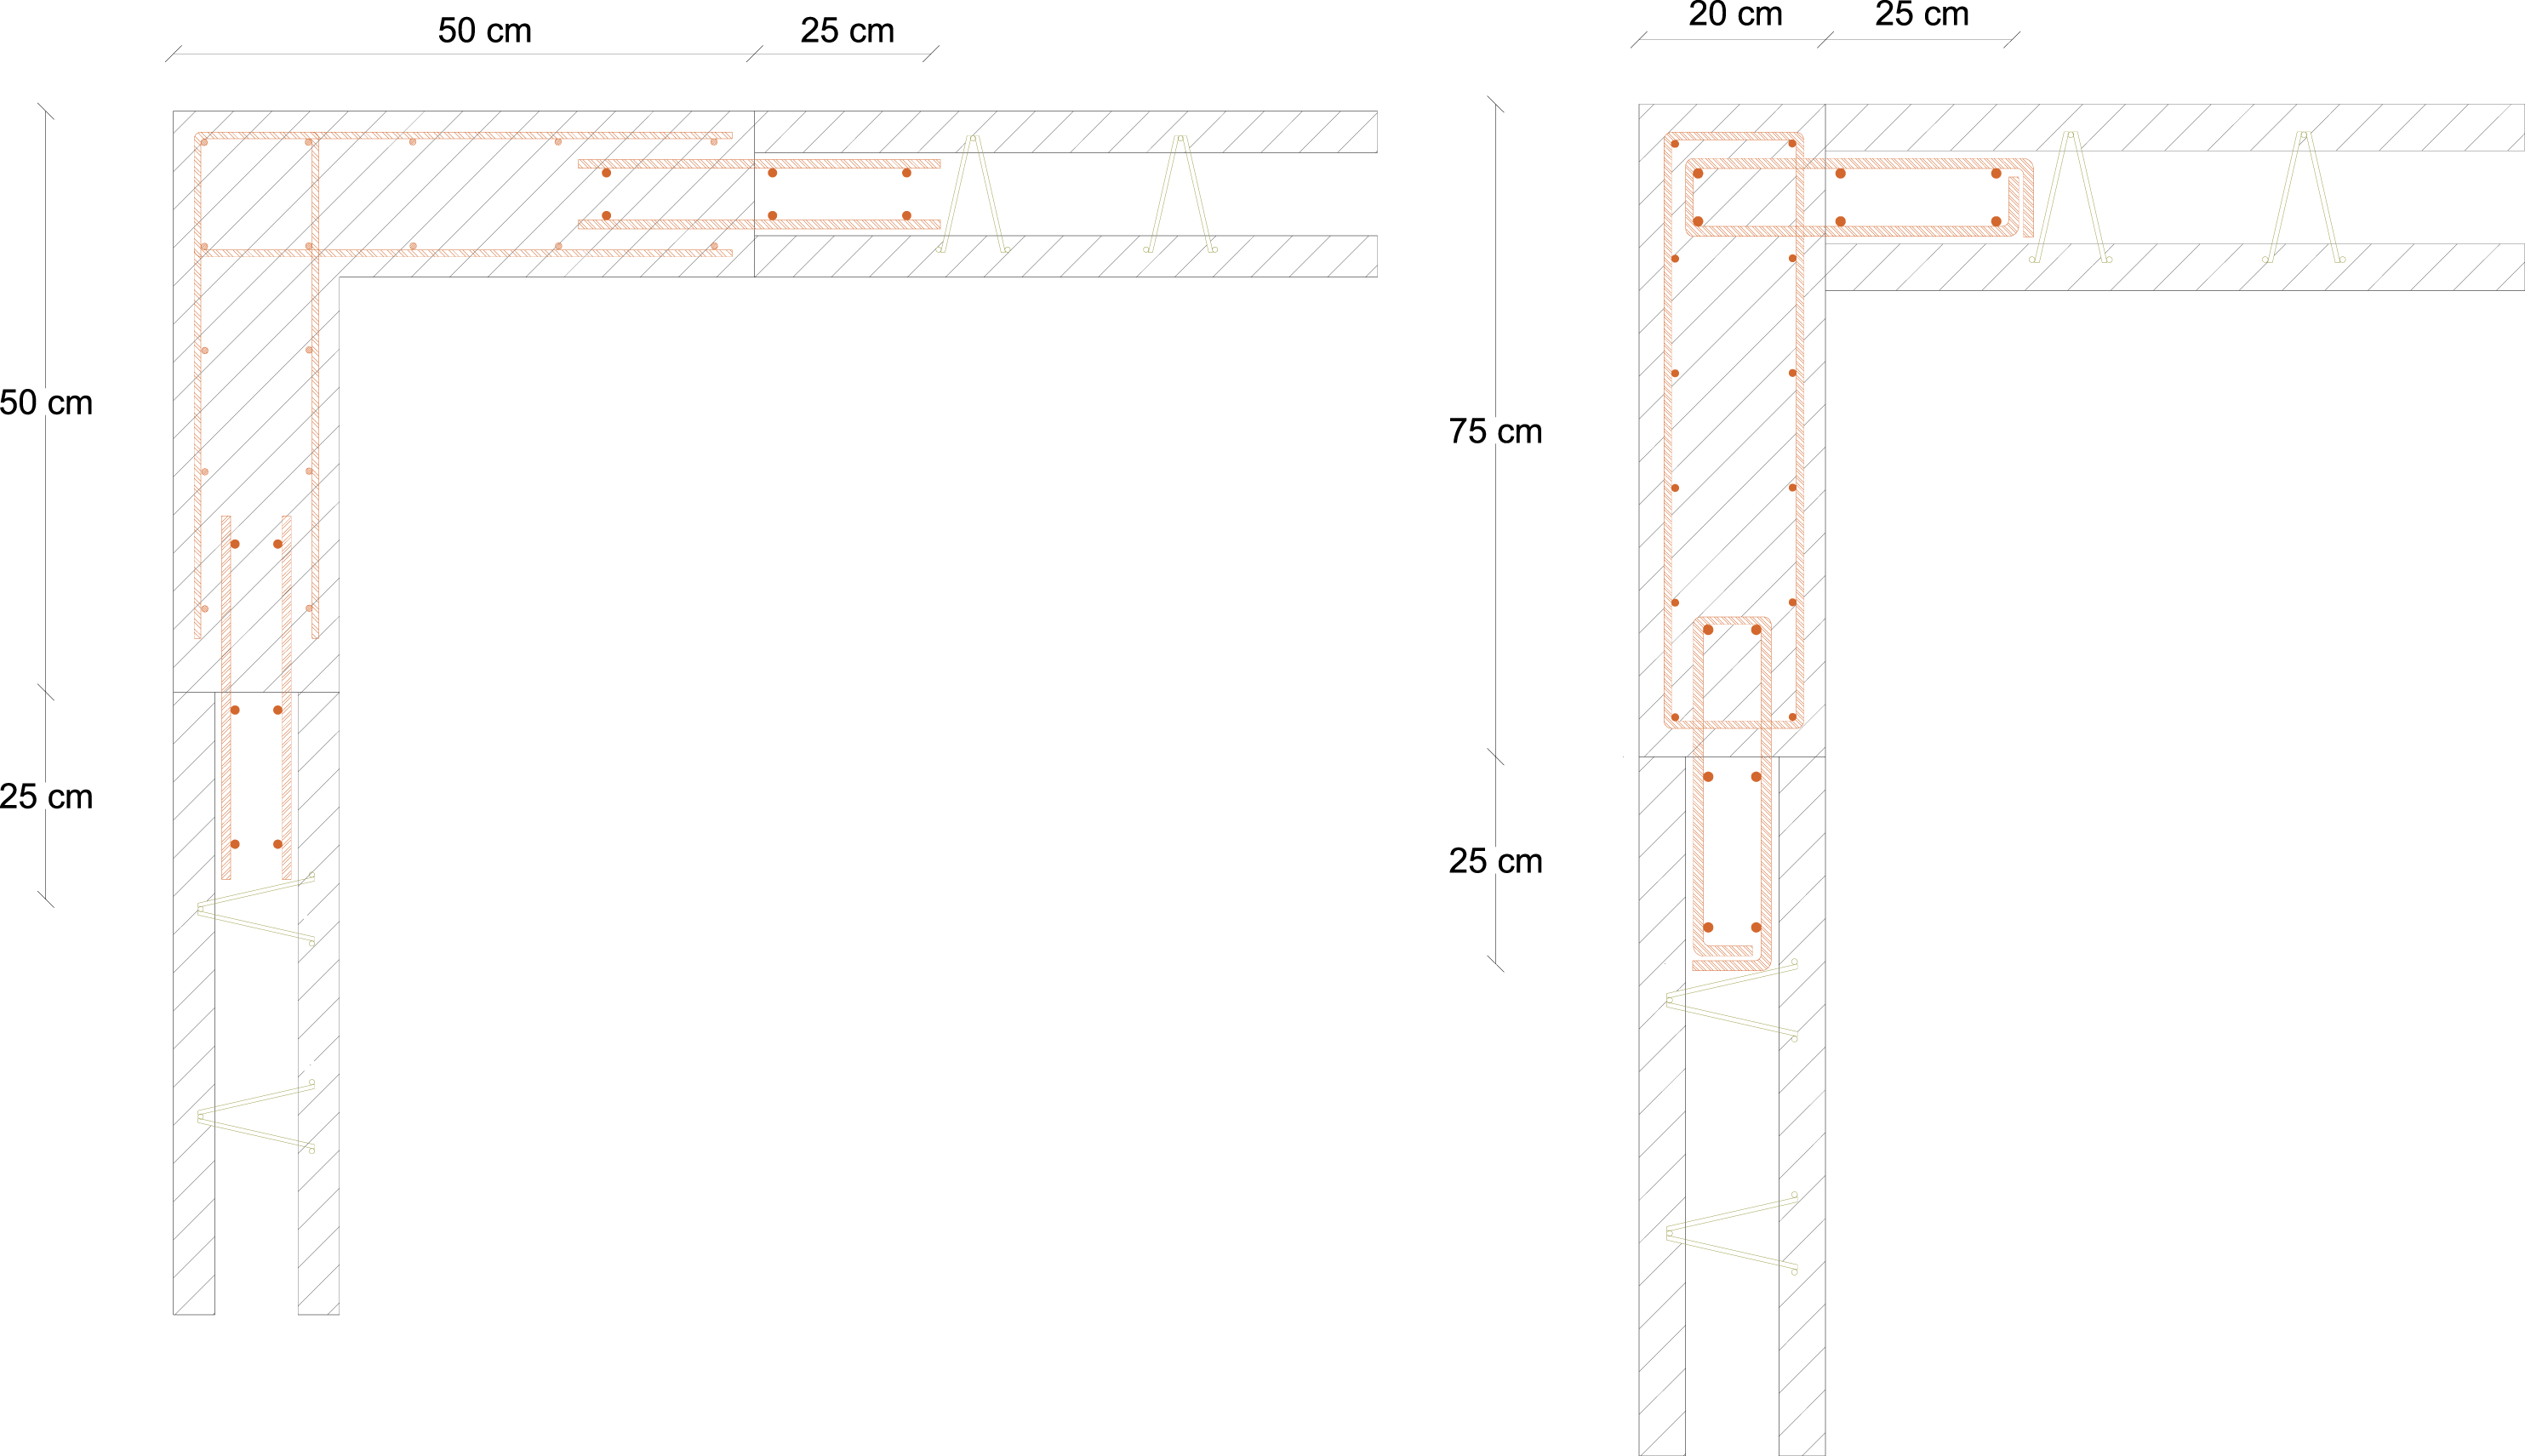
Conclusions
The structural pre-walls are difficult to connect when positioned in orthogonal directions, mainly due to the reduced thickness of the core, limiting the arm of the internal forces. Therefore, to address this issue several solutions were experimentally and numerically evaluated, and the main findings are presented next: (i) The experimental results (1st and 3rd series) clearly show that this connection is critical, presenting in some cases both strength and stiffness lower than those expected, particularly when submitted to negative moments. (ii) Placing reinforcement only in the core does not provide a strength capacity high enough, because the arm of the internal forces is reduced, and the anchorage length of the reinforcement is also insufficient due to the trusses position. (iii) The use of epoxy resin to glue the top of the panels and using part of the rebars embedded in the panels improves the transfer of forces in the corner, increasing the strength capacity by 38%, when submitted to positive moments. For the negative moments, this solution was not enough to enhance the strength capacity of the connection. (iv) The evolution of the crack width, w, the variation of the angle between the walls, Δθ, and the crack pattern, monitored using computer vision, was useful to better understand the failure mechanism and to confirm the main weak points of the first reinforcement arrangements. (v) New solutions were also developed using numerical modeling, saving time and money comparatively to an experimental campaign. After numerical model validation, it was used to identify the main factors that limited the transfer of forces: (i) bond between the core and the precast panels; (ii) anchorage length of rebars; and (iii) the reinforcement detailing. (vi) The new solutions proposed, using diagonal rebars and embedding the rebars in the external panels, significantly increase the strength capacity, circa 50% and 85% for positive and negative moments, respectively.
Further tests are envisaged to experimentally confirm the improvements expected based on the numerical approach as well as to increase the statistical significance of results.
Footnotes
Declaration of conflicting interests
The author(s) declared the following potential conflicts of interest with respect to the research, authorship, and/or publication of this article: The authors declare that they have no known competing financial interests or personal relationships that could have appeared to influence the work reported in this paper.
Funding
The author(s) disclosed receipt of the following financial support for the research, authorship, and/or publication of this article: The authors thank the project POCI-01-0247-FEDER-033534, entitled “MC-Pool: Modular Concrete Pool”, co-funded by the European Regional Development Fund (FEDER), through the partnership agreement Portugal2020 - Operational Programme for Competitiveness and Internationalization (COMPETE2020), the Foundation for Science and Technology’s support through funding UIDB/04625/2020 from the research unit CERIS, the PhD Grant 2020.05254.BD of R. Martins and the research contract CEECIND/04463/2017 of J. Valença.