
Abstract
The constant changes to which telecommunications have accustomed us in recent decades oblige a similar adaptation in other branches of engineering. Structures such as monopoles and short lattice towers are becoming increasingly wind-sensitive and dynamically active with the introduction of 5G technology, which will require new larger and heavier antenna equipment. Expert consultants agree the need to revise the current accounting for structural damping that has not changed in design codes after more than 30 years. A complete set of full-scale field tests is presented to obtain reliable structural damping values in short communications structures. The described methodology analyses free-decaying responses obtained after excitation of the main analysed cantilevered modes in the time domain. A standardized acquisition system based on local accelerometers and an external innovative system using the Video GaugeTM system are required to obtain the desired responses, which use curve-fitting and the eigensystem realization algorithm to estimate modal properties such as the corresponding modal structural damping. The results obtained using the presented methodology agree on higher values of structural damping for both damping estimators and perfectly converge with consultant feedback, which suggested over-conservative (i.e. low) values of structural damping as compared to the conventional values used in civil engineering.
Introduction
In the progressive research areas of structural dynamic engineering, such as deterioration diagnosis from fatigue, monitoring of vibration in terms of response and loading identification, and response prediction to build adequate structural assessments, numerically modelled vibration modes must agree with real behaviour of structures in terms of stiffness and damping. Due to the complexity of civil engineering structures in terms of geometry, materials, uses, and so on, the differences between calculated predictions and measured responses may be quite different. Modal structural damping is invariably a parameter that provides more uncertainty during the calculation of structural dynamics and is normally assumed as a proportional damping value for simplicity, chosen from conservative estimations in completed investigations in the literature. Unlike natural frequencies and mode shapes, where the accuracy is high enough to be accepted, structural damping requires further research on each structure typology to provide essential knowledge for increasing the precision of predictions. Since the development of the current standards of communications structures in 70–80s, more and more structural assessments have been refusing coming technologies due to a lack of structural capacity of present structures according to longstanding knowledge, and the sub-optimal approaches frequently taken to the evaluation of dynamics. Structural telecoms engineers are demanding corroboration studies and, newer and more reliable approaches.
The first advances in understanding and quantifying structural damping arose from research conducted in nuclear structural buildings (Housner et al., 1953), (Stevenson, 1980) obtained as single values for all modes, stress and earthquakes levels using response spectra methodology. The results of these studies were used extensively in the US and Japan for seismic analysis in the 60s and 70s. During these decades, (Blevins, 1977), structural damping was defined as the energy dissipation during vibration due to friction, impact, scraping and motion of trapped fluid within a joint, also establishing the related material damping due to yielding and heating of energy dissipation of materials or fluid damping to explain viscous drag dissipation and radiation to the surrounding fluid. Further researches, (Newmark, 1969, 1972), classified structural damping by materials, stress levels, connection types or soil-foundations influence. Those concepts were rapidly applied to communications structures (Clow, 1974).
The most important mechanisms considered in structural damping are material damping and friction/coulomb interfacial damping. In actual slender structures, material damping is based on energy losses due to internal hysteresis in materials that comprise the structure (Scruton and Flint, 1964). On the other hand, there is evidence that a high percentage of structural damping is caused by connection friction (Coulomb friction) of the structural response (WG4. IASS, 1981). These friction forces occur when relative motion occurs between adjacent members. In communication towers and masts, these members include the joints between leg bracings and horizontal members of lattice towers and the joints between the foundation and superstructure or between steelwork installed to hold equipment. Those forces are independent of the amplitude, frequency and velocity of tower motion and constantly oppose the normal motion of the structure. Welded connections tend to reduce the contribution of interfacial damping compared to bolted connections (WG4. IASS, 1981).
A more feasible engineering concept considers structural damping as the energy dissipated calm air without fluid aerodynamic, external passive or active damping. Since this definition, (Scruton and Flint, 1964), focused the issue in telecoms structures and claimed that structural damping depends mainly on construction methodologies and is highly independent of frequency and amplitude over the decay time course, essentially relying on the material component to explain the differences between diverse results with foundations which were considered to contribute considerably to overall structural damping.
Later, during the building of the standards and resulting from the high discrepancy in the existing literature, a unique value of structural damping related to conservative estimations of the previously analysed results was suggested. In those terms, (British Standards Institution, 1986; The Institution of Lighting Engineers, 2013), advise critical damping values due to the steel and the nature of structural connections between
As a consequence, an updated theoretical prediction of the response may result in more reliable dynamic models and structural assessments. In such predictions, damping is highly relevant for the definition of the integrity of the structure. It has been demonstrated to be a key factor in the determination of propensity of aeroelastic effects through the Scruton number, such as vortex shedding in across-wind vibration, and helps to reduce high responses in resonance frequencies under buffeting along-wind excitation, providing more ‘structural capacity’ (Commission, 1991).
The difference between the current state of the structure and the best-optimized design is called structural capacity. An increase in this capacity is used by owners to potentially increase the amount of equipment supported by each structure. Unlike other civil engineering fields, the optimization of the structural design of towers and masts is a goal closely tied to business as well as to requisite safety margins. An increase in total damping, from either a better understanding of the topic or strengthening based on the provision of supplementary damping, can offer a consequent increase in financial profit.
For that reason, both owners and consultants require improved trustworthiness and coherent damping approaches to correctly represent dynamics in their assessments. This paper provides damping evaluation using full-scale data on short telecom structures in the UK. Structural damping is calculated from free-decaying responses under calm weather conditions. External human excitation using ropes through pull and release is able to obtain different amplitudes of the response without affecting the free-decaying performance. Two acquisition methods, synchronized accelerometers and visual vibration capture systems, were used to extract suitable response data to be analysed by two methods of parameter identification: typical free-decaying curve-fitting (CF) in the time domain applied to re-orientated data on main modal coordinates, and the eigensystem realization algorithm (ERA) using cross-covariance functions generated from the same free-decaying response in frequency domain.
Reliable data for 16 telecoms structures (including two short lattice towers) covering different manufacturers, designs, geometries, foundations and lumped masses have been compiled in a database to describe damping ratio characteristics of short telecoms structures. A summary of such data can build an idea of damping behaviour to increase current knowledge and compare it with current recommendations that appear in the literature.
Characteristic Response of Short Telecoms Structures
With the purpose of supporting the necessary antennae for different telecoms technologies, such as broadcasting, radio and, in particular, mobile telephones, telecoms structures are characterised as highly wind-sensitive and flexible due to a high degree of slenderness, with natural frequencies often below 2 Hz. This article focuses on short structures of below 40 m, mainly designed to cover nearest fields for a variety of mobile customers.
The two most common specific types of the aforementioned structure are shown in Figure 1: (1) Monopoles, which are vertical steel cylinders used to hold equipment at the top of the element but rarely along the length of the structure – monopoles have a height range of between 10 and 35 m and are typically around 15–20 m tall; and (2) Short steel lattice towers (below 40 m), which look like a smaller version of the tall lattice towers used in broadcasting or the pylons used by the National Grid to transport electric power. Such towers have varied typologies, being triangular or square and tapered or straight, and can be used for different technologies and customers at several levels. Left. Example of a monopole. Right. Example of a short lattice tower.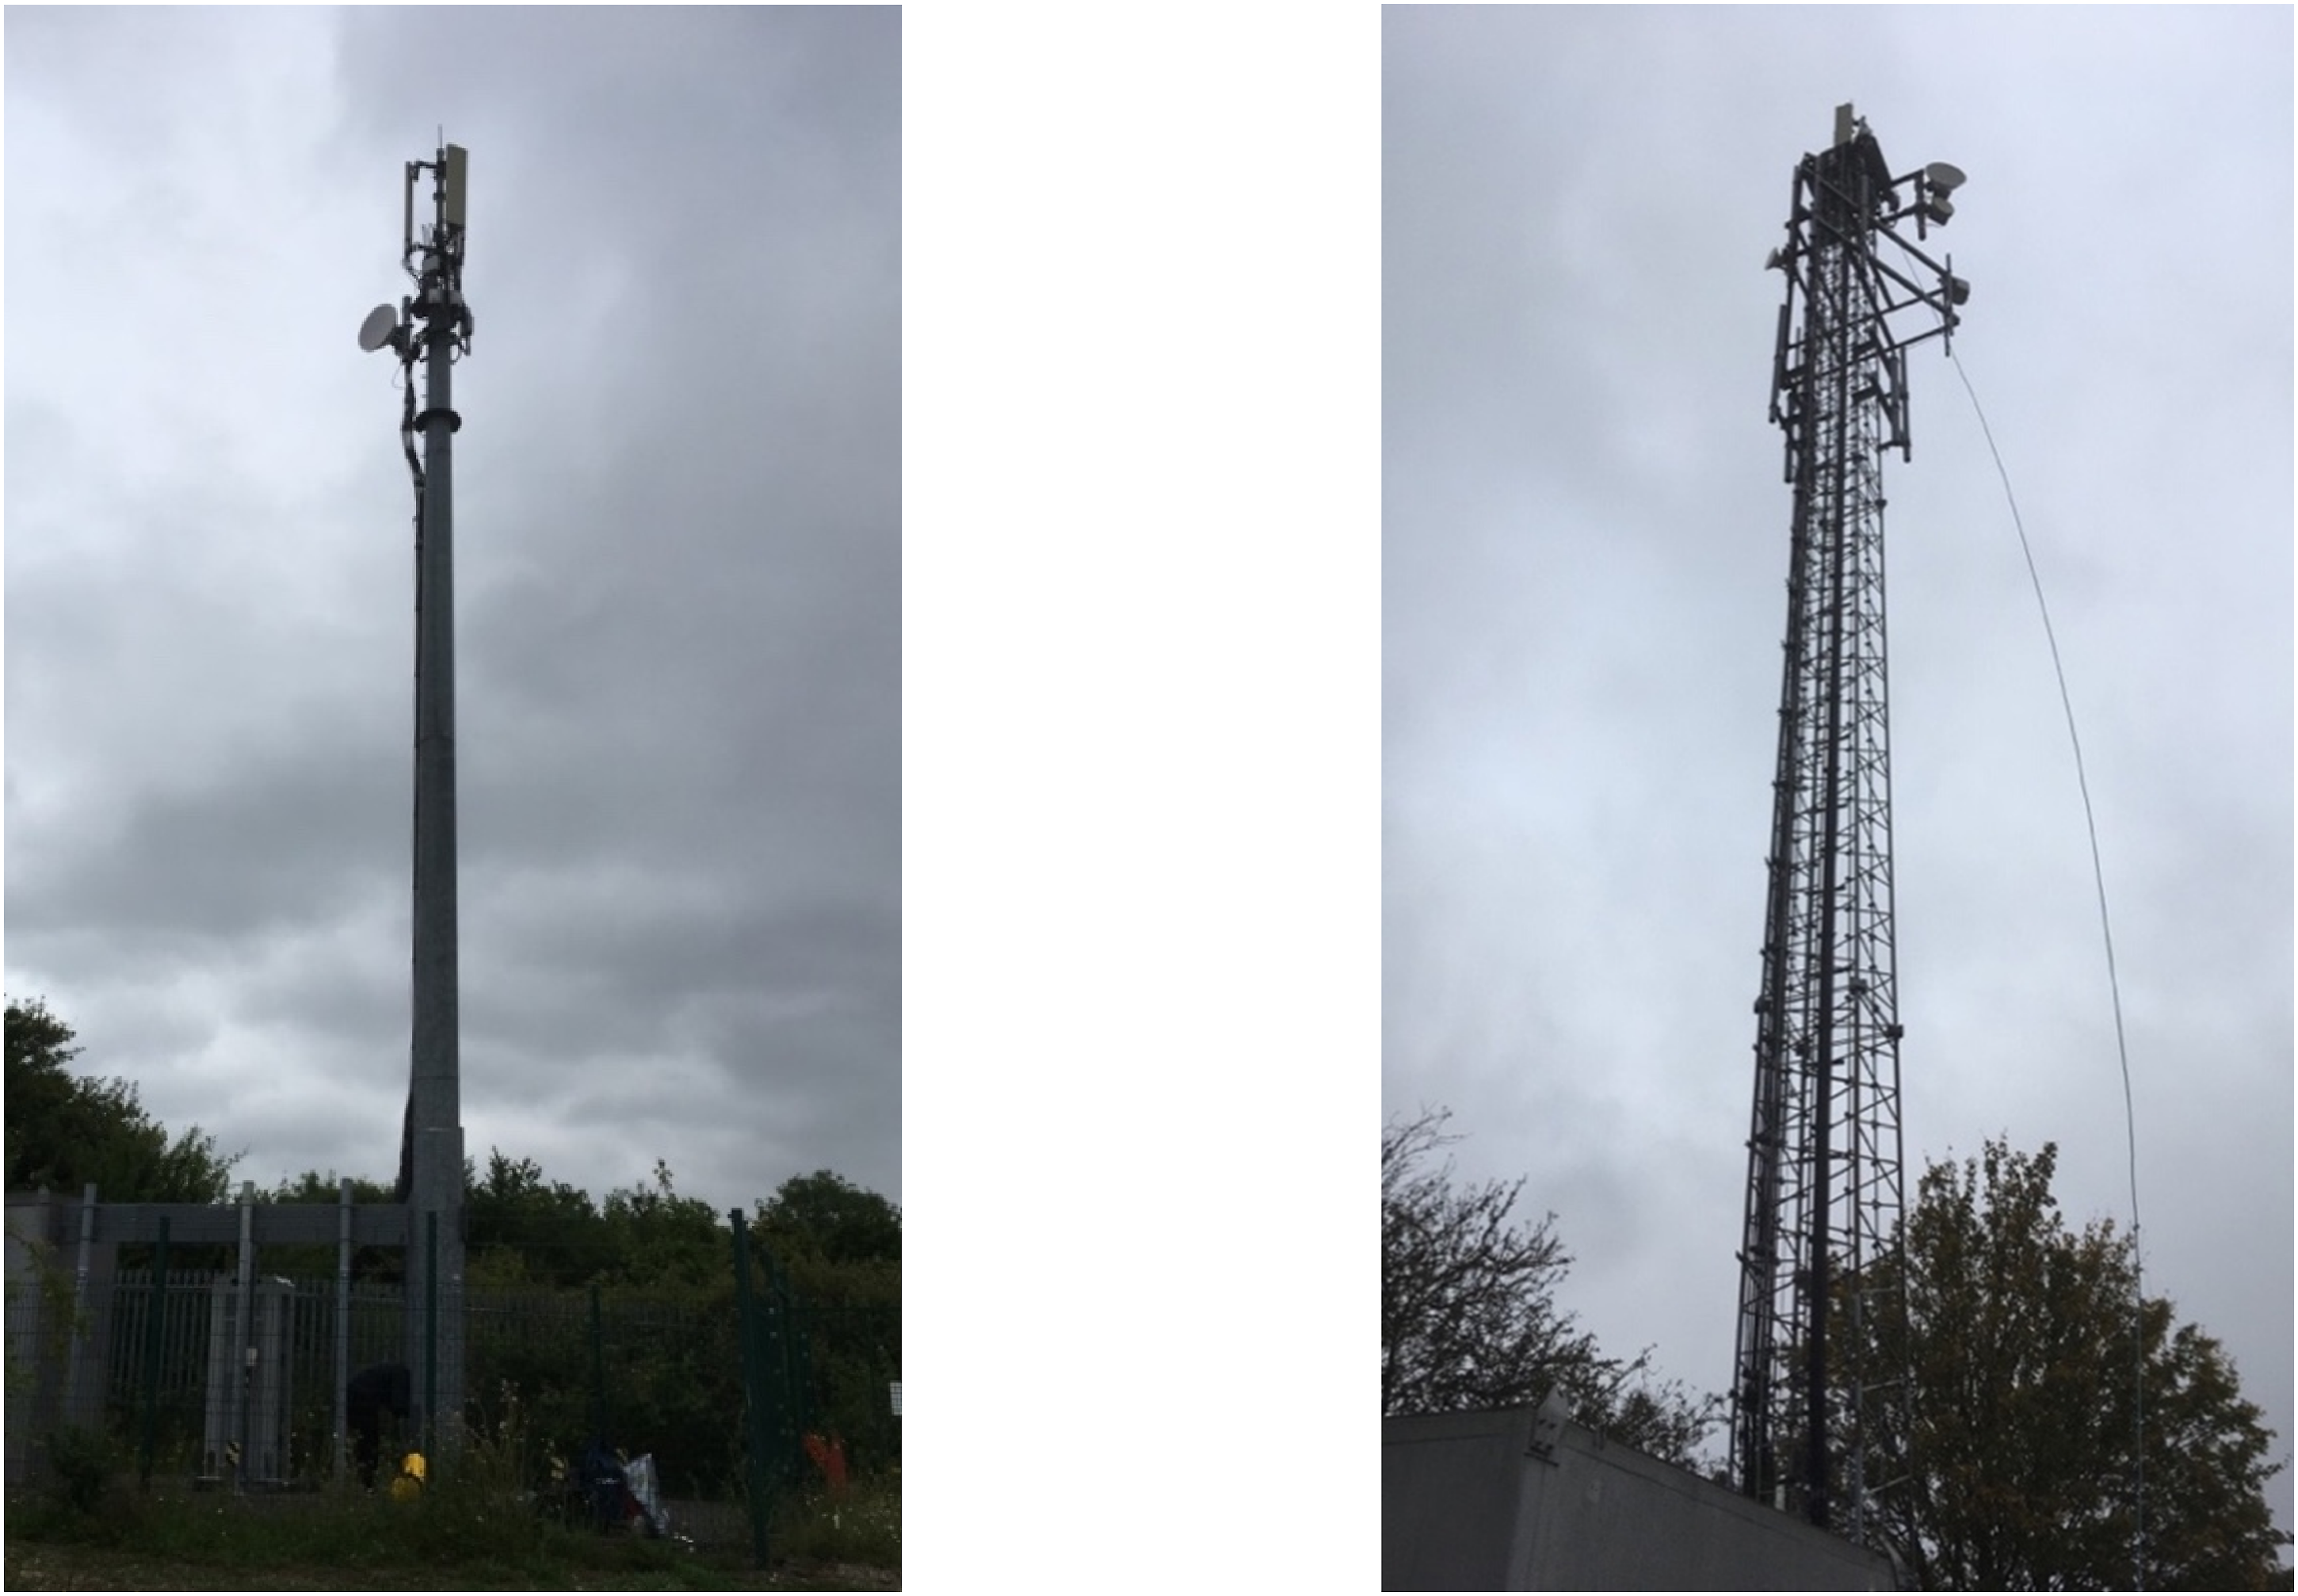
The above structures, with a design life of 25 years, began to be placed at the end of the 1990s, comprising categories of steel between S275J0 and S275JR, with foundations based on concrete blocks. On the one hand, in terms of connections, monopoles tend to have linear welding along their tubular or polygonal sections and a slip-sleeve or flanged joint between tapered shafts. At the base, holding bolts attach the structure to the foundations through a flat flange welded to the first shaft panel. On the other hand, lattice towers use bolted connections between leg elements and foundations and either bolted or welded connections between corresponding bracing or horizontal elements.
In terms of dynamics, standards agree a response described by a main mode with a typical cantilever bending shape defined by the industrialised geometry which is highly symmetric about different axes. However, all the necessary attachments, such as ancillaries, antennae and steelworks, and linear loadings, such as necessary cabling or ladders, break the symmetry with two primary directions of stiffness, which define the mentioned modes as the power spectrum density diagram appeared in Figure 2. This figure identifies modes as the dominant singular value in typical frequency range (for monopoles) between 1.2 and 2 Hz. Typical free-decaying response in monopoles. (a) Free-decaying time line. (b) Power Spectrum Density of free-decaying response. (c) Horizontal vibration of monopole under free-decay vibration.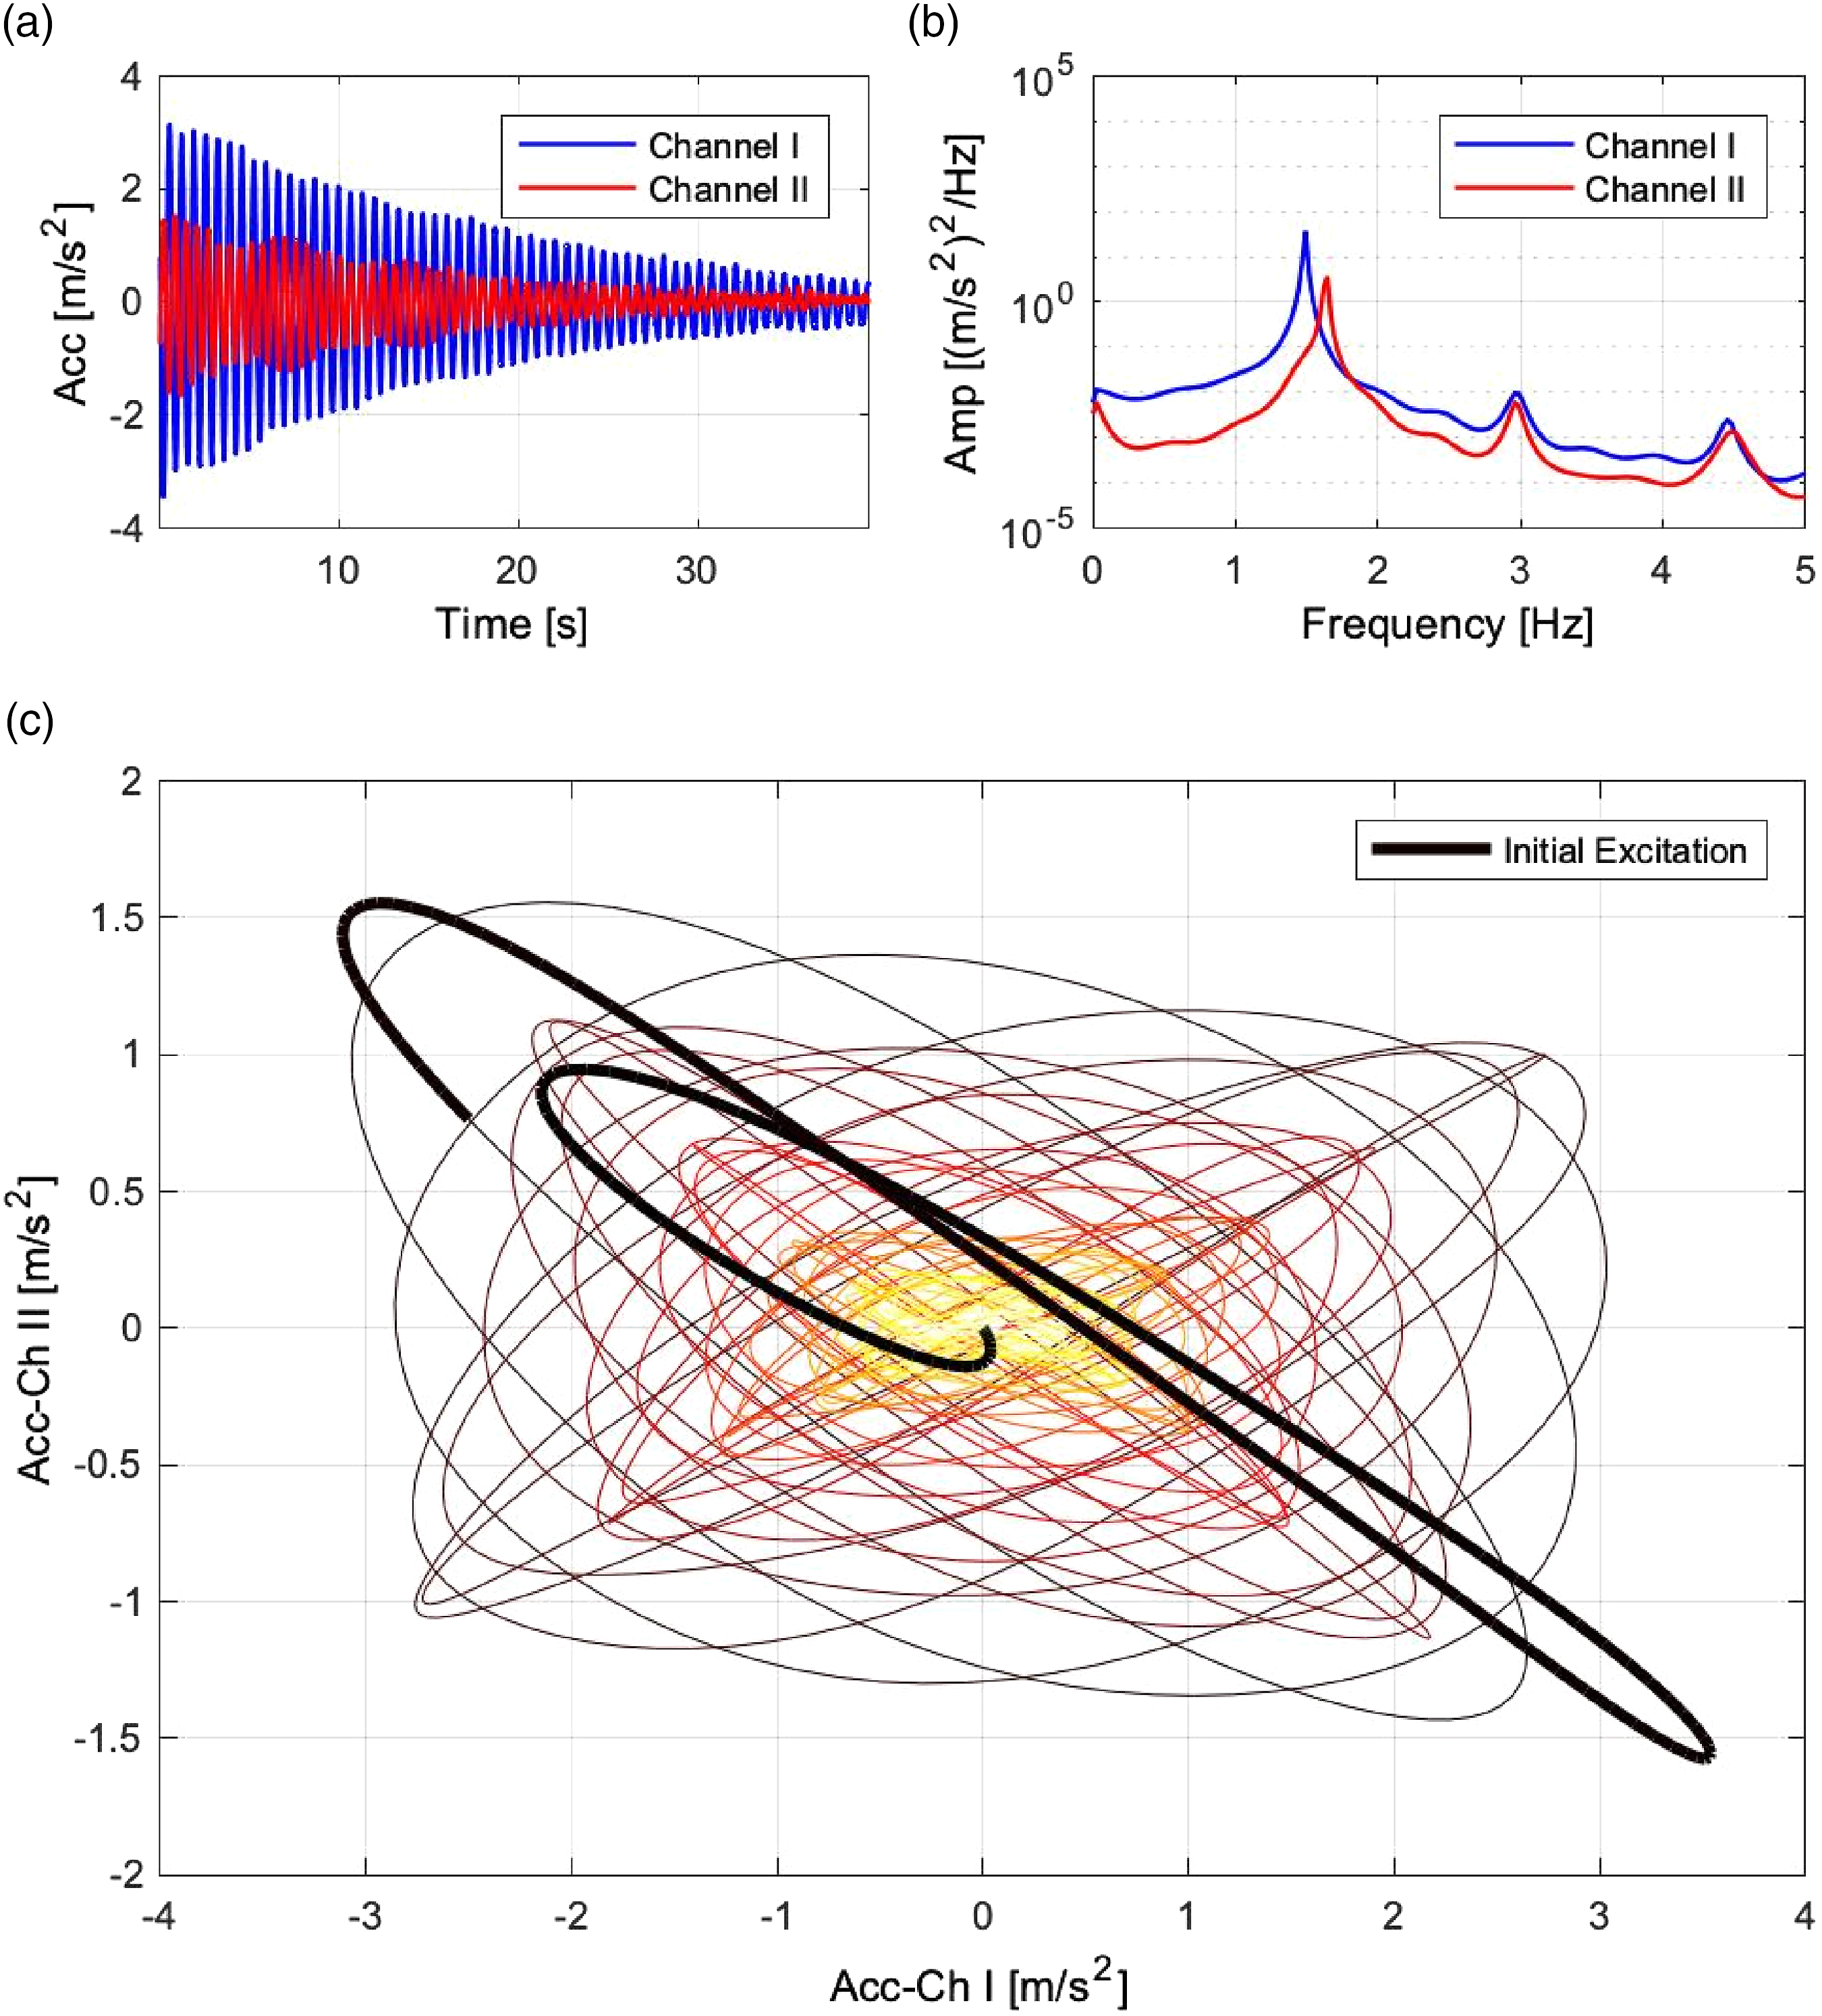
Under ambient wind loading, such as during service life, or free-decay vibration after forced excitation, such as the field tests proposed in this article, these closely related modes tend to work in a coupled manner, defining an elliptical shape. Such a vibration pattern, in the absence of loading, appears to move from one mode direction apparently due to the asymmetry.
Figure 2 plots the response of a typical monopole during a free-decaying response. The response is captured by two accelerometers positioned orthogonally to each other at the top of the structure in along symmetry axes defined by the location of the external ladder and cabling, and expected to align with vibration modes. The (a) figure shows the free-decay response after an external impulsive force in a particular direction intended to excite both modes, for research purposes. This way, first and second channels can identify the two modes, as shown in the power spectral density in the (b) figure, which also captured second and third pairs of modes. Finally, the main (c) figure shows, in plan view, how both modes combine to define a free-decay response which oscillates in different directions. This behaviour makes separation of modal response, needed to identify proper modal parameters, via simple free decay estimation more difficult. Given this, to obtain the perfect modal damping the responses must be in agreement in any given modal direction to maximally reduce the amount of energy absorbed by the other mode.
Under present ambient loading conditions, such a state is not achievable, as the turbulent component of buffeting will always include high components of cross-wind response belonging to the undesired mode, unless some aeroelastic event, such as vortex shedding, induces the resonance and ‘lock-in’ of the mode – an event whose occurrence is unlikely for the aforementioned main pair of modes.
Such bi-modal behaviour is not covered by any of the current standards, which mainly focus on buffeting along-wind excitation in a single mode. To obtain useful results with which to draw comparisons, there is a need for a specific methodology to apply during field data acquisition, subsequent analysis of the responses, and damping estimation.
Critical Damping Ratio Identification
This study sets a specific excitation methodology in order to create perfect free decays which, under the absence of alternative source of damping, total structural damping assumes the whole process of energy dissipation. This procedure was implemented on 16 different structures with different geometry and loading, analysed under same data processing methodology.
Field Test Methodology
The exercise uses the excitation called the ‘pull and release’ method. This is based on the application of sharp tugs on a rope attached to a point close to the top of the structure timed to build up a strong (resonant) response before allowing the structure’s vibration to decay freely as in Figure 2(c). To extract the best horizontal response from each tug, the length of the rope must be greater than the height of the structure. This has been shown to be a highly effective method to obtain a desired free-decaying vibration during operational modal analysis (OMA) surveys (He and Xie, 2018), (Weber and Distl, 2015), in which the chances of installing a shaker are very limited due to logistical challenges similar to some type of wind turbines where similar excitation is applied (Carne et al., 1982). Such free vibration tests performed in other civil engineering structures for the identification of modal damping ratios (Magalhães, Cunha and Caetano, 2010) may arise from the application of periodic sinusoidal loads with an excitation frequency coincident with either the structure’s natural frequencies, an impulse force or imposed displacement.
Both excitations are applicable to those structures to obtain responses at different heights. Other advantages of this methodology include the following: The resonant response level achieved is similar to the level of response for design service life estimation under service wind loading. The range of main frequencies of the structures of The influence of the rope after the application of the pull is negligible.
This excitation method encounters some issues in dealing with taller structures, which, despite being more slender than short ones, require stronger forces to be excited due to the amount of distributed mass to mobilise with the pulls, in turn requiring more people with the corresponding synchronization to achieve the desired responses shown in Figure 3. Picture of pull application on lattice towers during modal test.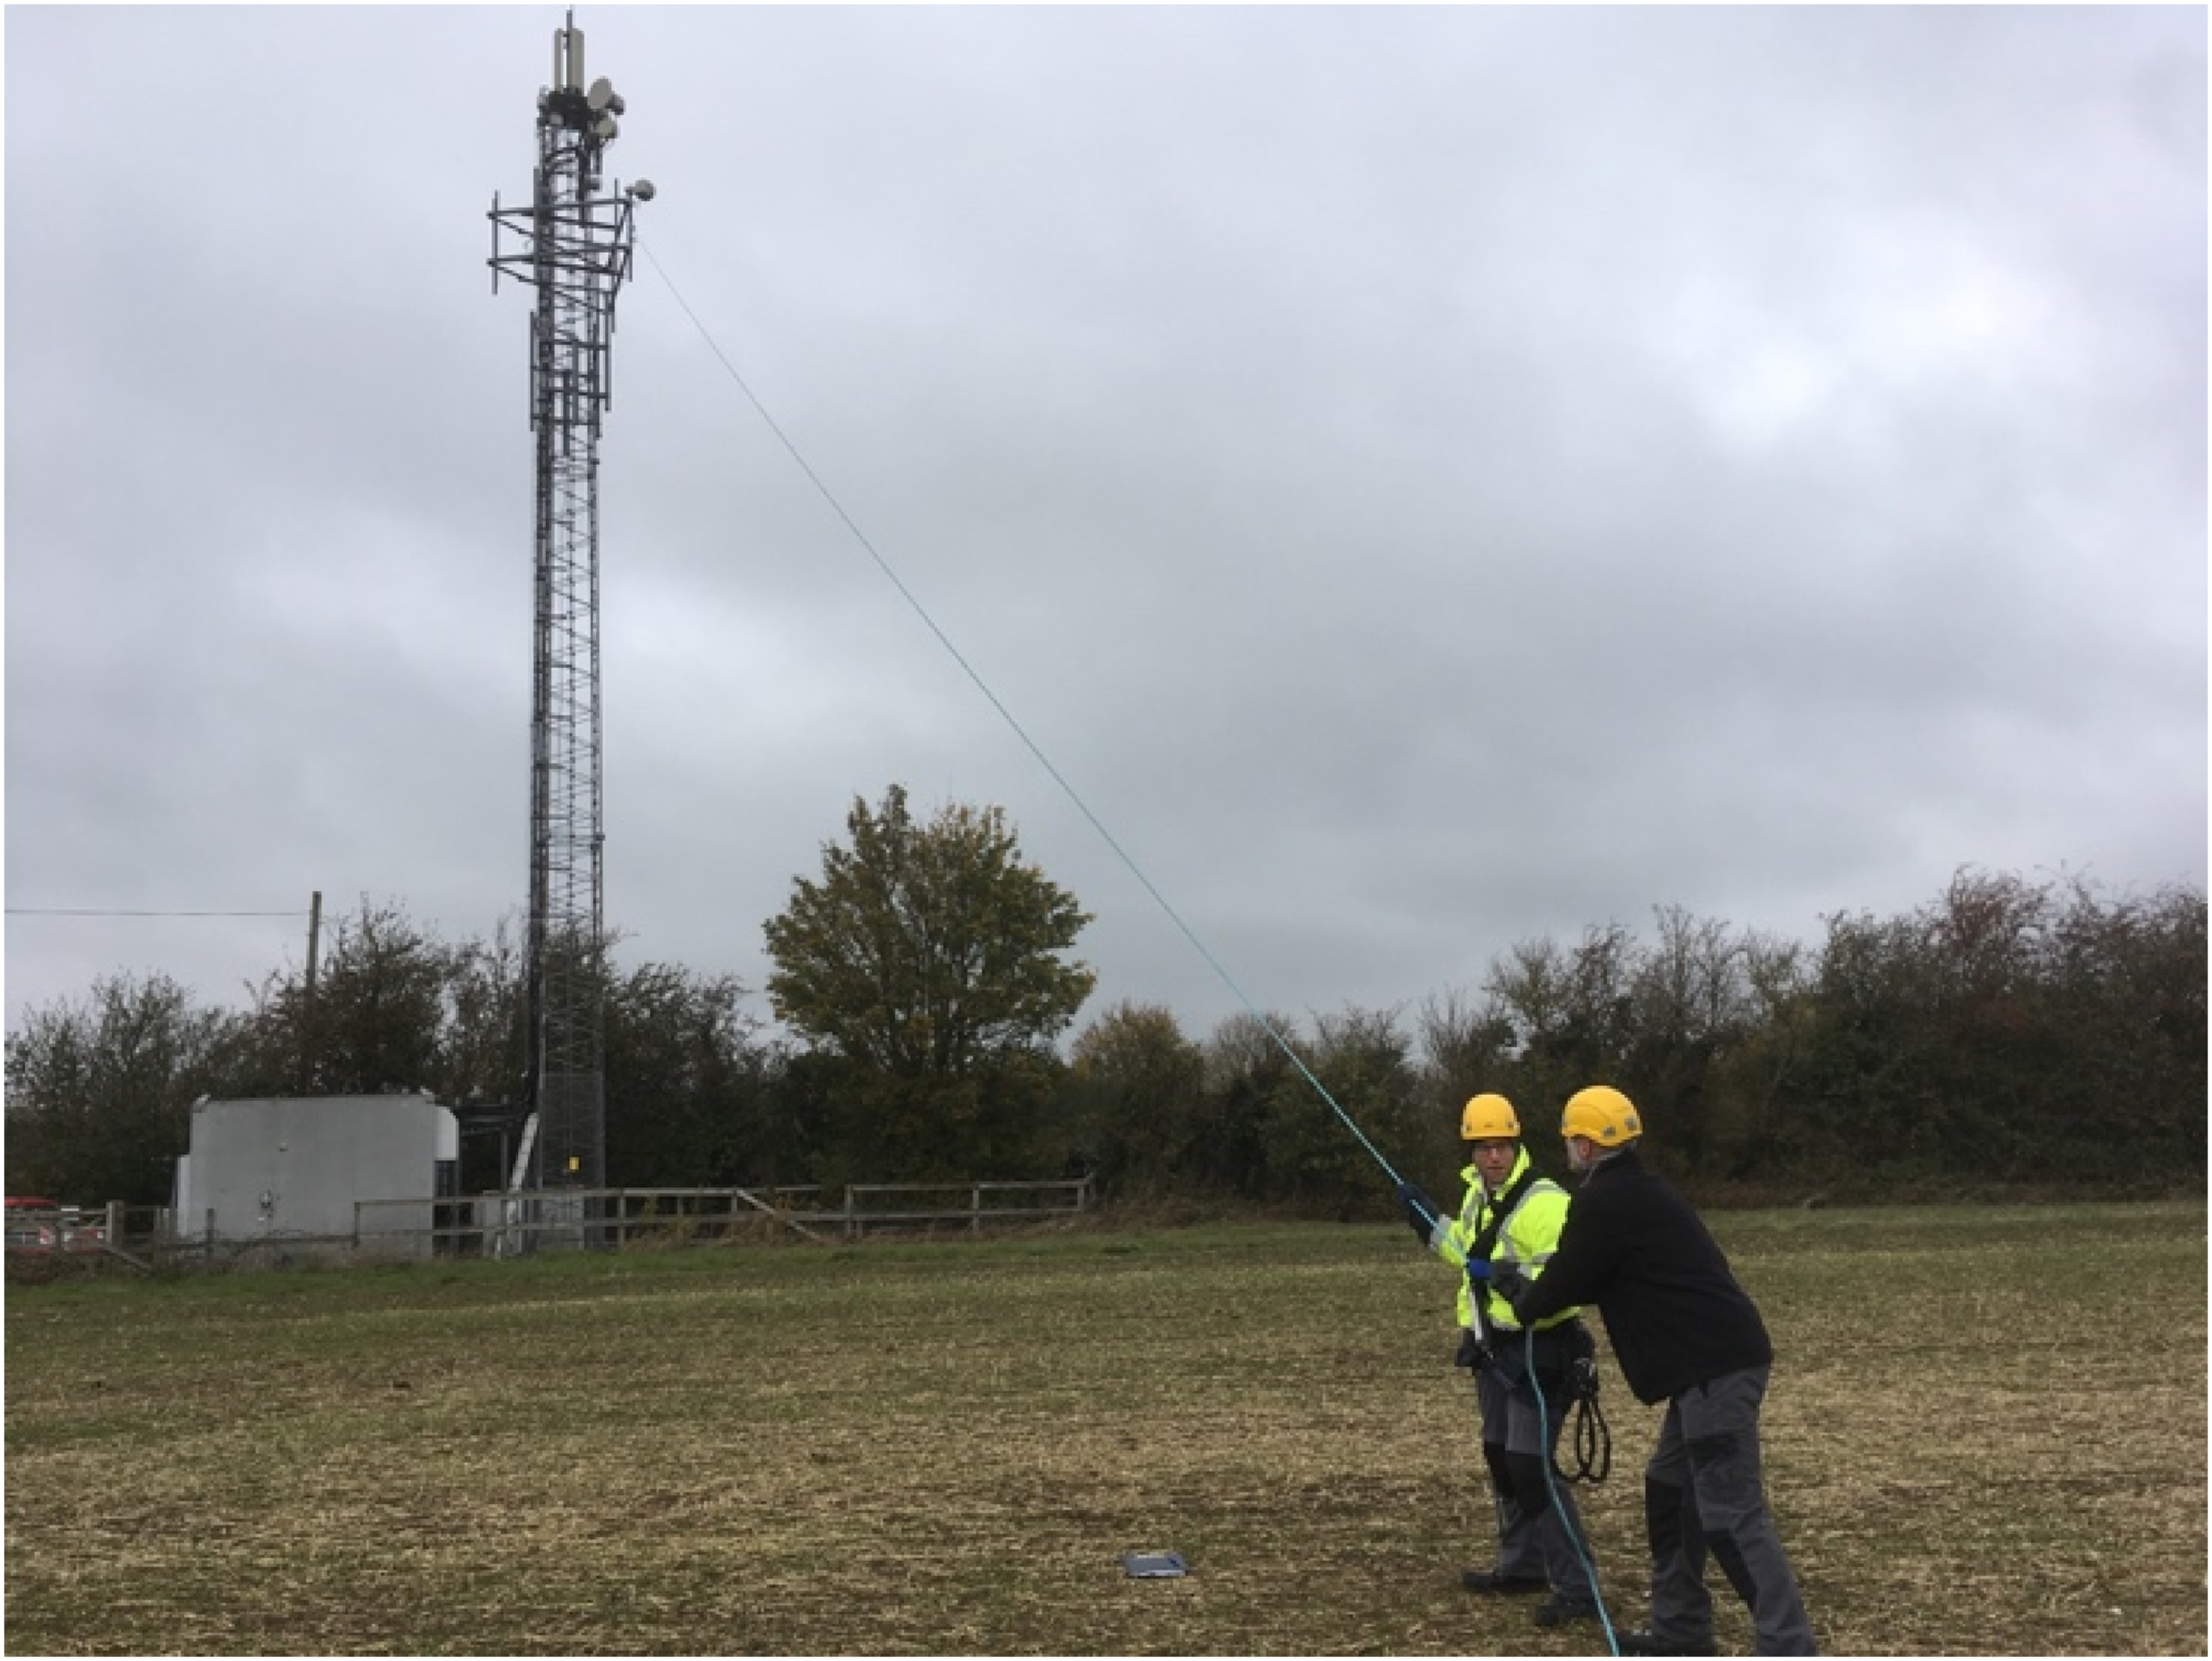
In the absence of wind, obtained decays are suitable to assess structural damping. To agree perfect conditions, only calm weather days were specifically chosen to carry out modal surveys. However, some minor aerodynamic influences might arise from sporadic low gusts or turbulent present as a result of the structure’s movement.
Data processing method
As the uncertainty of damping ratio is relatively higher than the other two modal parameters, multi methods should be used as cross-reference to make sure the right result is obtained. In this work, two methods were used for damping ratio extraction from the free-decay vibration: the curve-fitting (CF) and the eigen system realization algorithm (ERA) methods. Both methods were selected as old and new approaches which provide unique values comparable to equivalent viscous damping values given main standards.
The principle of the CF method (Ray et al., 1995) is that the envelope of free-decay vibration curve is an exponential function with a damping ratio-related index. Once the envelope of the decay curve is obtained, the damping ratio can be obtained with CF, as Figure 4 shows. This method requires a clean and perfect response to have a good fit along the decay. Theoretically, any two peaks are enough to find out the index, here, all the peaks are used with the least square fitting to obtain the average damping ratio. This would mean a decrease in the reliability of the fitting at key high amplitudes, presumably due to the existence of non-linearity caused by different sources. Sketch of curve-fitting method.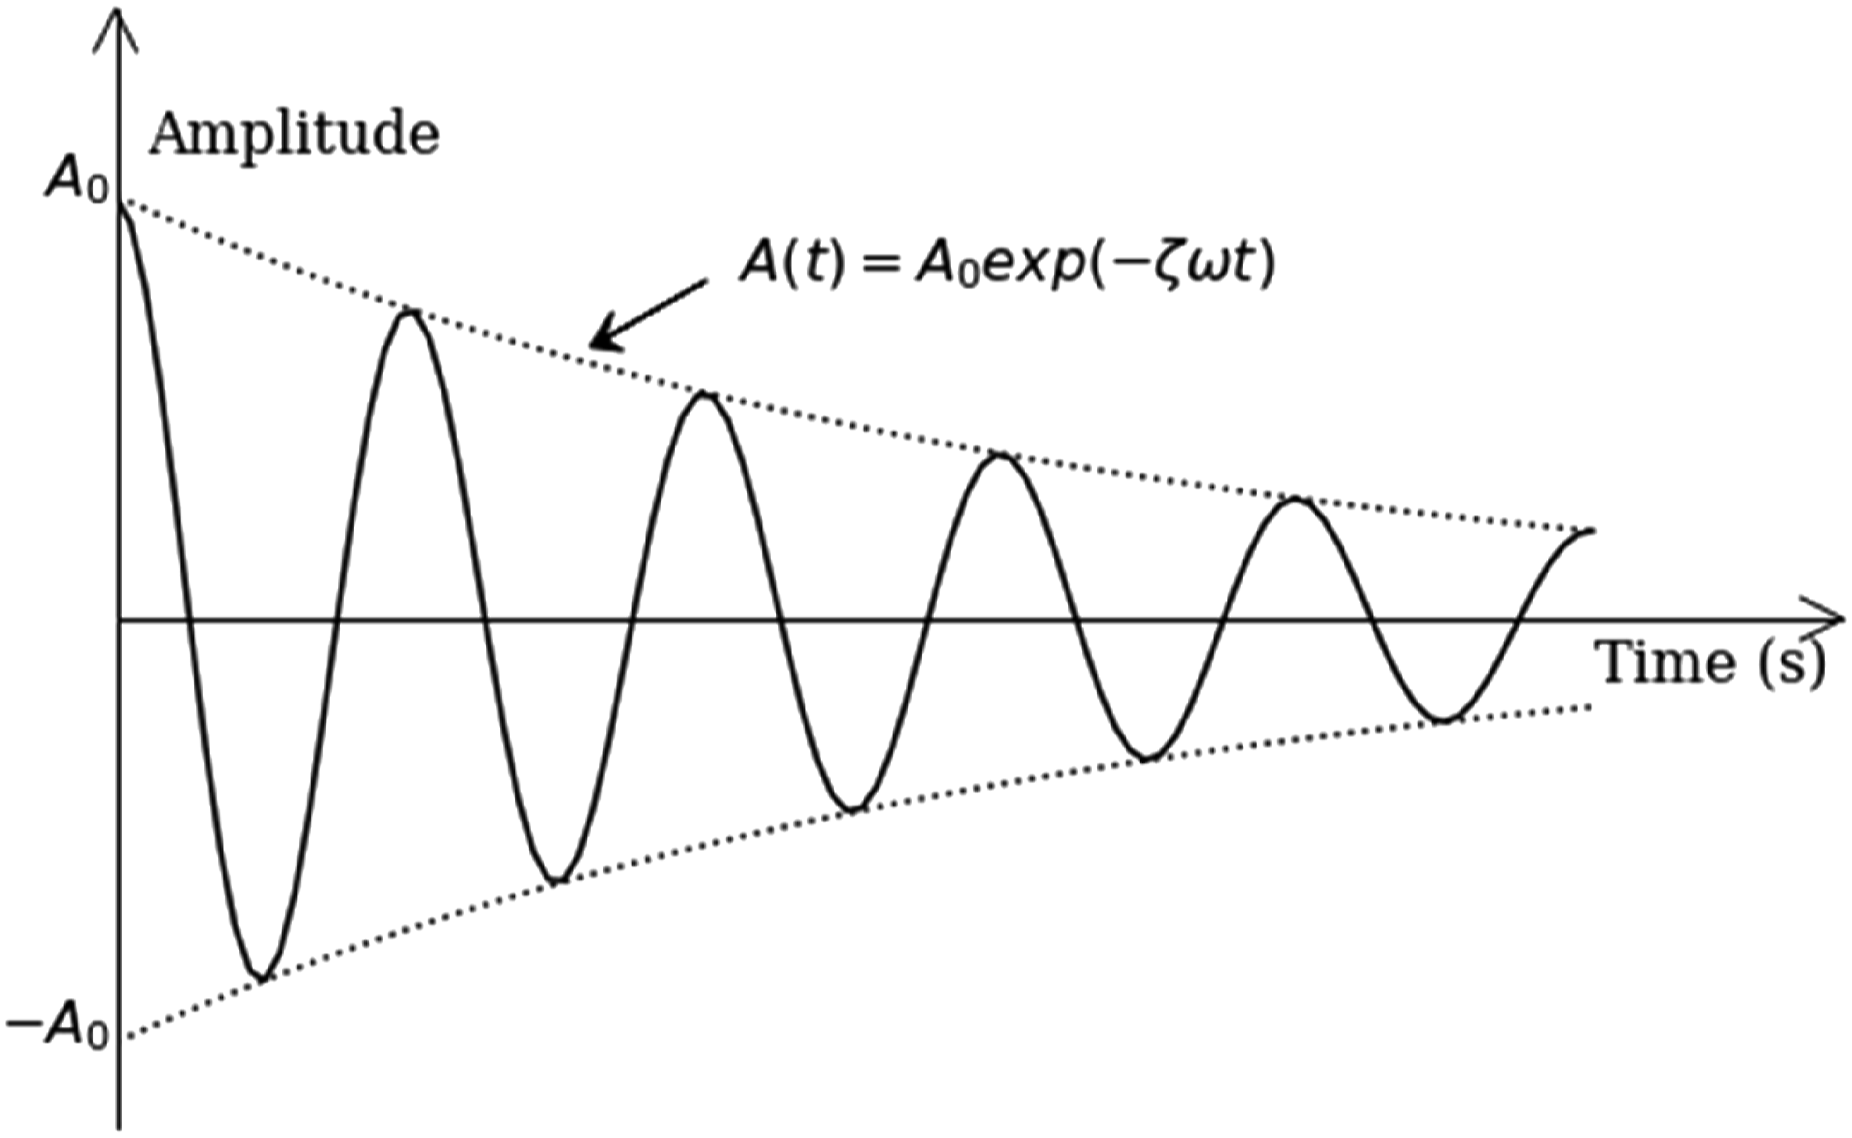
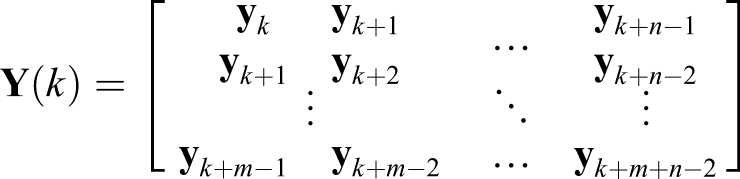
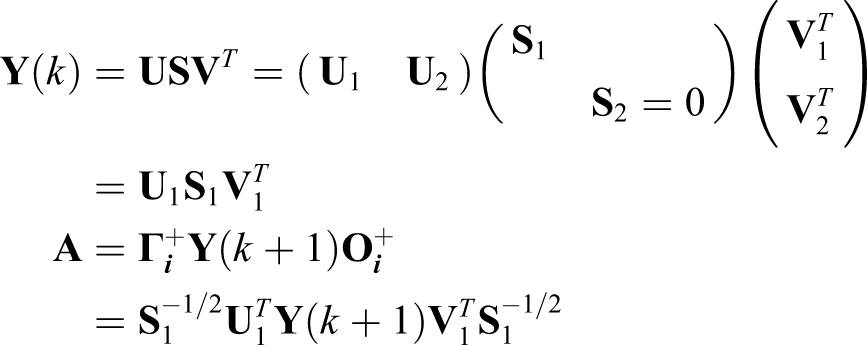
The principle of the ERA method (Juang and Pappa, 1985; Giraldo et al., 2004) is to use the decay measurement to estimate the system matrix
Simply using the ERA method can lead to fake results, thus the stabilization diagram was used to eliminate the unstable results. A stabilization diagram shows the results of different assumed system orders (the size of matrix Sketch of stabilization diagram during ERA application.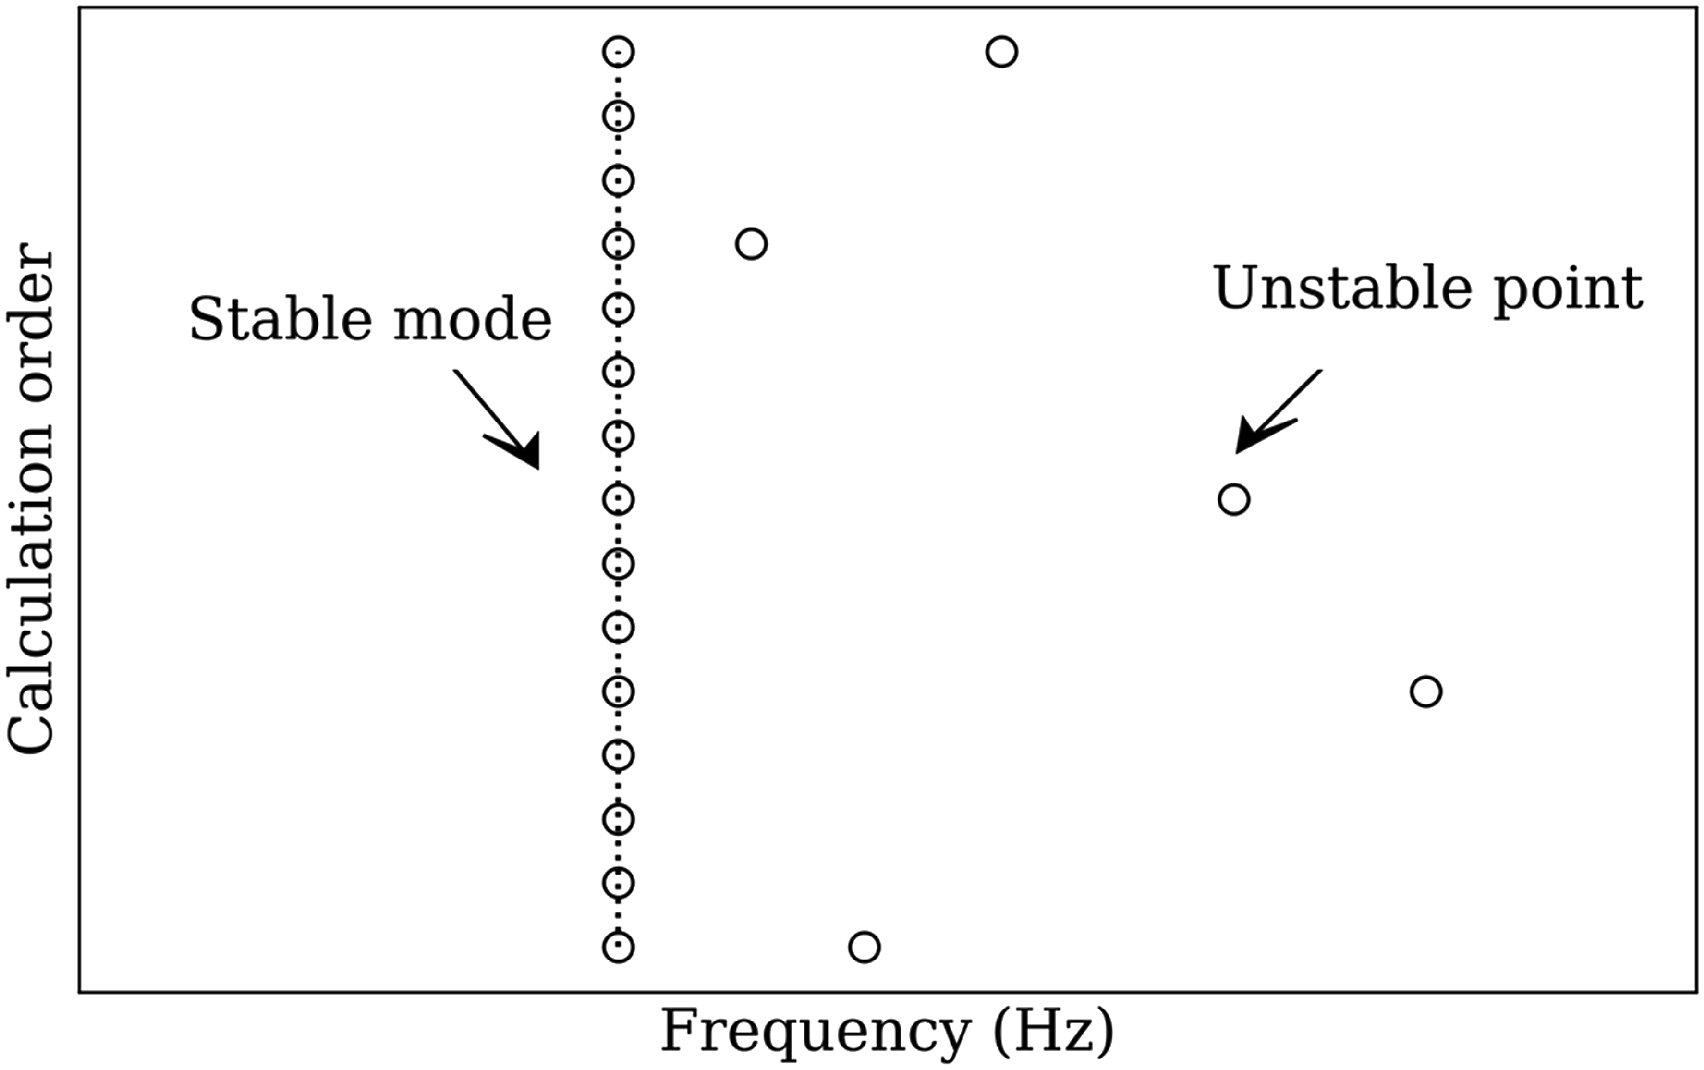
Field Test of Kinning Monopole
Introduction of Monopole Structural Details
To illustrate the procedure and results followed on each field survey, this modal analysis was carried out on a Portasilo monopole, Figure 6, one of the most common telecoms structures existing in the UK portfolio. The structure is a monopole comprising S275J0 steel for the main core and plates of 25 mm thick S355J2. There are two sections: a tubular tapered panel between ground level and 14.5 m and a triangular steelwork headframe suitable for the accommodation of mobile antennas. Also, there is an external spine ladder with a Latchways fall arrest system. For loading, three antenna panels are installed in the upper section, with a small plate antenna at 14.3 m and all necessary cables run internally. This structure is joined to the foundation through a flange plate and 12 grade 8.8 M24 bolts, without grouting. Some other details are shown in Table 1. Elevation and plan view of surveyed site: Kinning. Selected site details.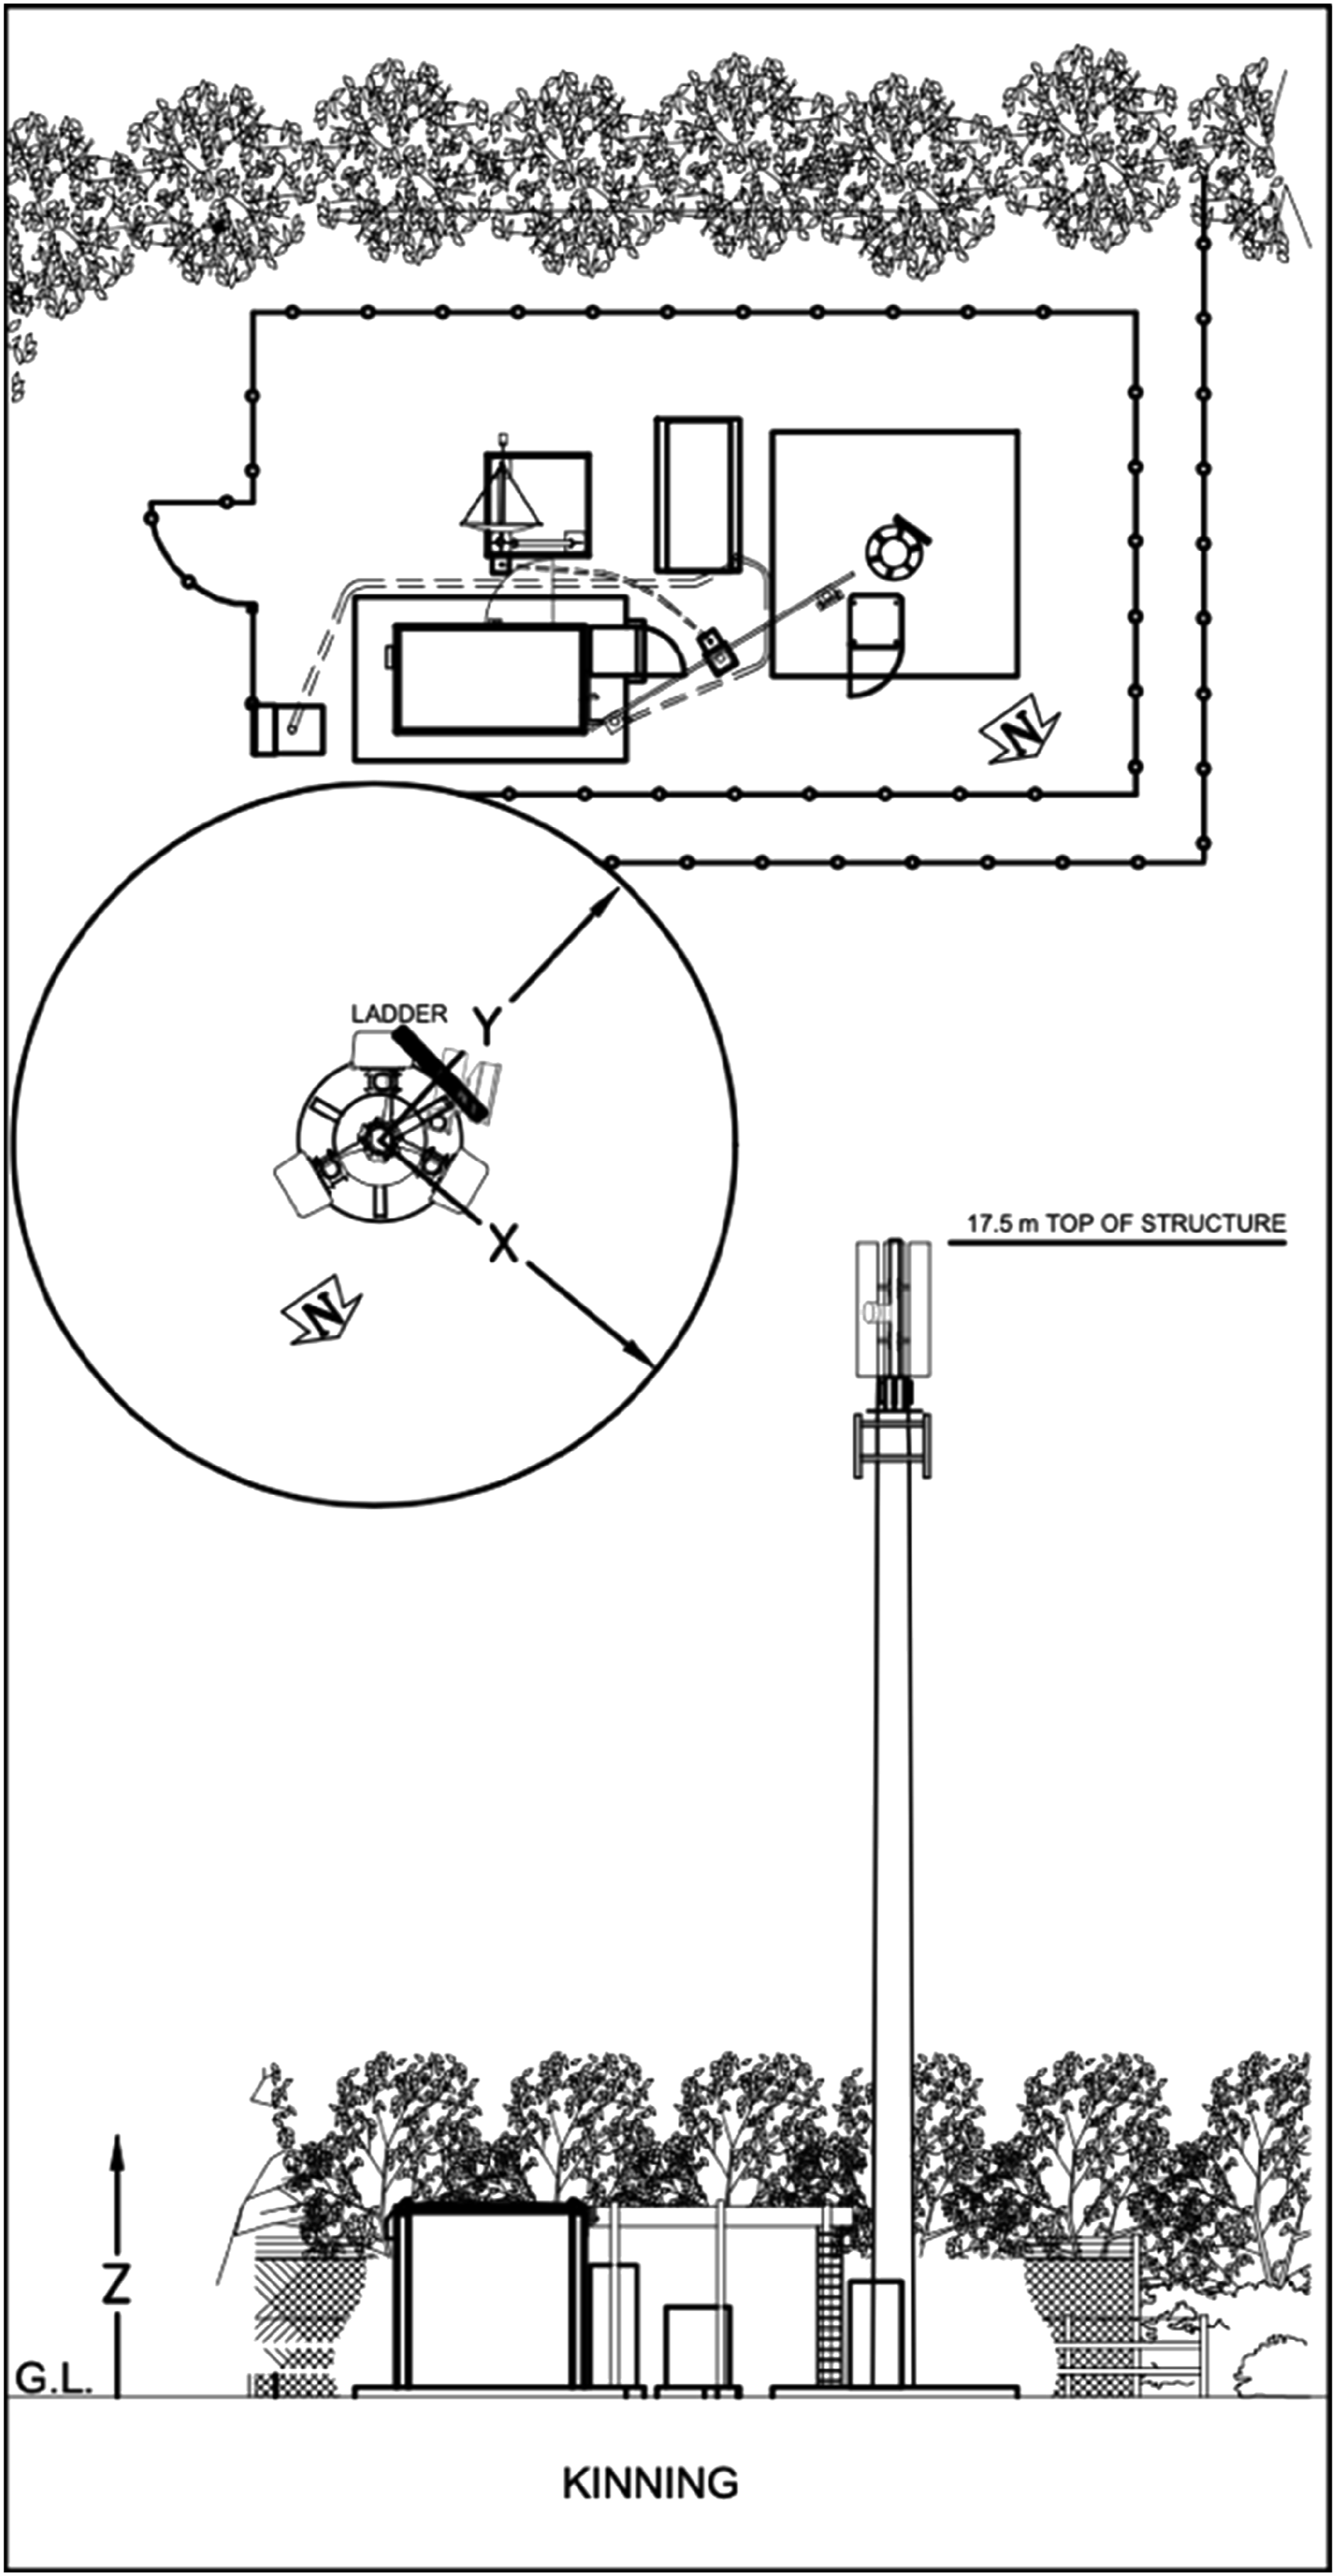
These monopoles are characterized as very flexible structures, with relatively low stiffness and high masses which help to obtain high responses under ambient wind loading and which are also easily excited by sharp human tugs. The high dynamics implications penalise these structures heavily, with one of the highest dynamic amplification factors (The Institution of Lighting Engineers, 2013) during static structural assessments, in turn ruling out any spare capacity for additional equipment. In addition, major concerns have been identified at the base level due to fatigue induced during the short service life (less than 10 years from installation).
The new loading requirements with the upcoming wave of 5G technology will test the integrity of thousands of existing structures which are currently close to total capacity. Expensive replacements or strengthening works will be required under current design rules.
In particular, this site (Figure 6 and Table 1) is situated between Exeter and Barnstaple in Devon, United Kingdom, with a relatively high basic wind speed.
Experimental setup and response data
Before the official date of the survey, a quick climb was carried out to capture some response data. The purpose of that was to obtain key dynamic properties that helped during the main OMA at Kinning: (a) the stiffness of the structure in terms of natural frequency, important to induce proper tug rhythm and (b) mode shape orientation, important to induce desired modal resonance response. This way, it was estimated that the structure responds at two main frequencies:
APDM OpalTM system
Opals are wireless inertial measurement units including triaxial accelerometers with a noise floor of ∼120 (a). Measurements using OPAL system. (b). OPALs installed in monopole. (c). OPAL sensor.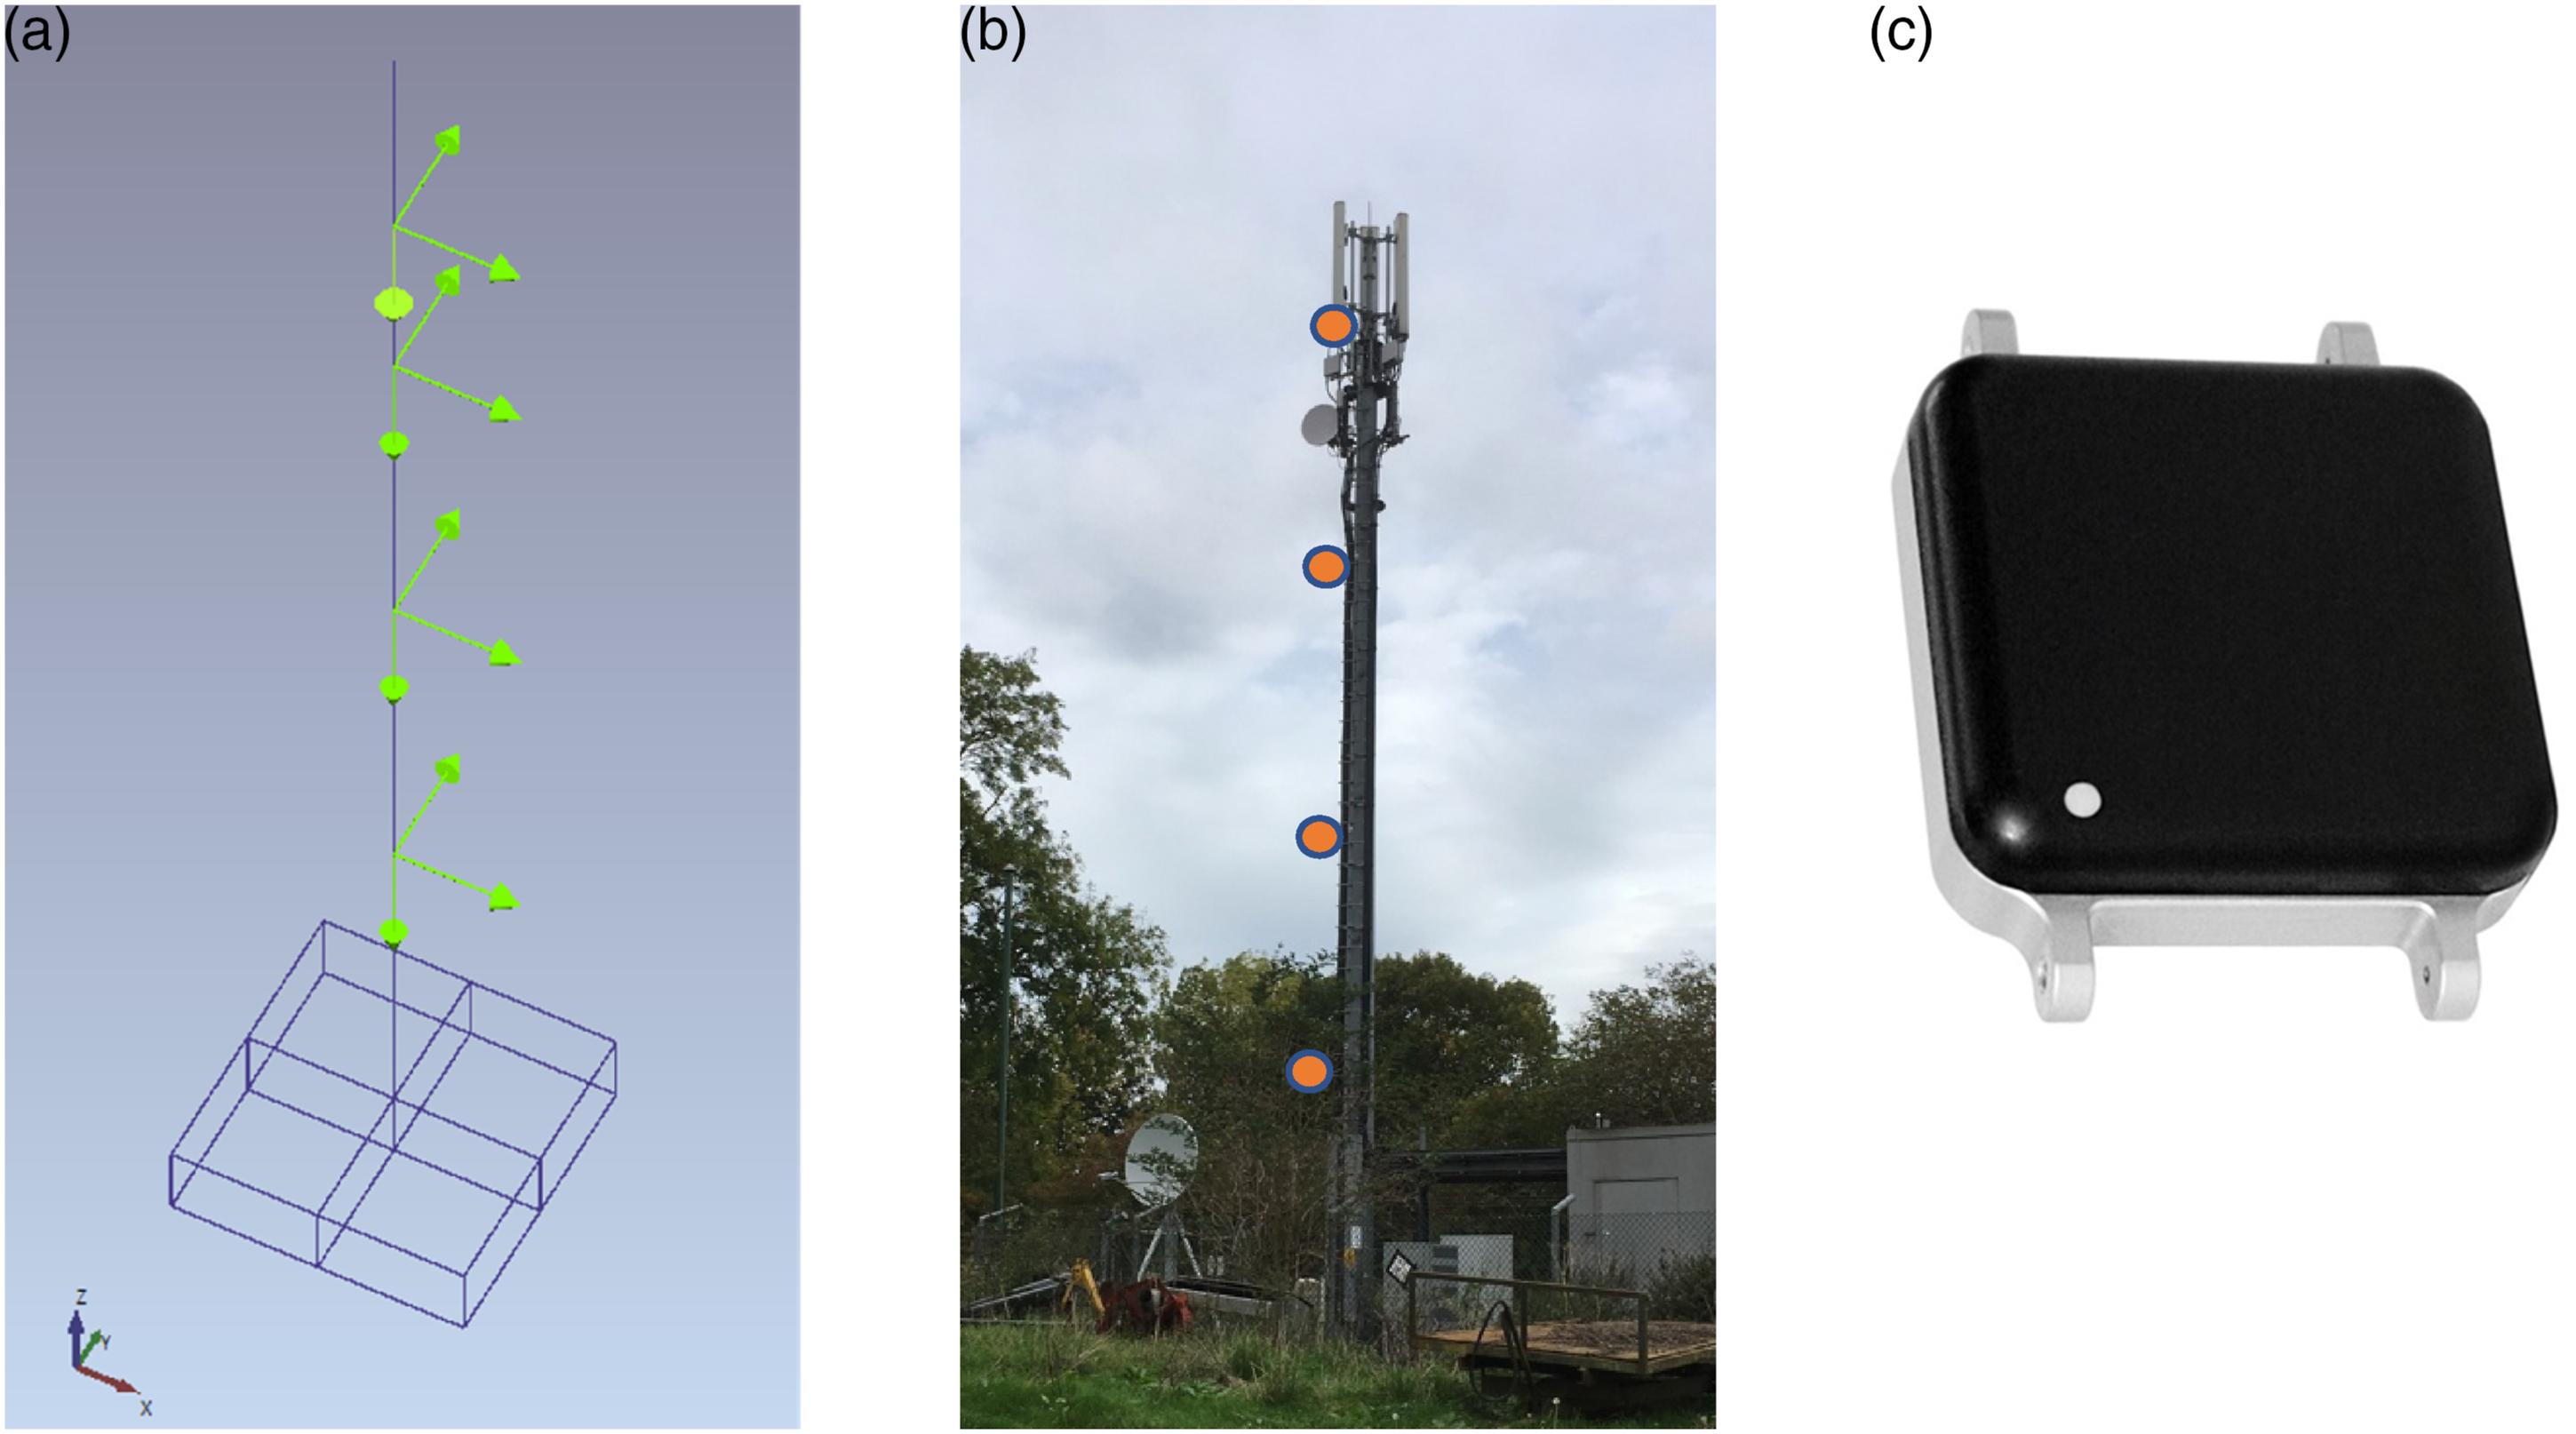
Video GaugeTM system
The Video GaugeTM system, which is developed by iMETRUM was also used for data acquisition. The Video GaugeTM system uses high-speed and high-resolution cameras to obtain videos of the measured structure, before using a sub-pixel template match algorithm to predict the movement of a certain target. The highest resolution can be 1/500 pixel and the real-world resolution depends on the scale of the targets.
During the measurement, shown in Figure 8, two cameras were set up on each main vibration direction of the monopole. To improve the accuracy and robustness of the Video GaugeTM system, artificial bull’s eye targets were installed directly below the antenna, which is close to the OPALTM sensor. The sizes of the bull’s eye targets were taken as references to obtain the target movement in real-world coordinates. Only measurements taken during each pull were recorded since the video files are relatively large. Figure 8 shows the installation of the Video GaugeTM system (camera setup and bull’s eye target). Camera setup in Kinning and bull’s eye target.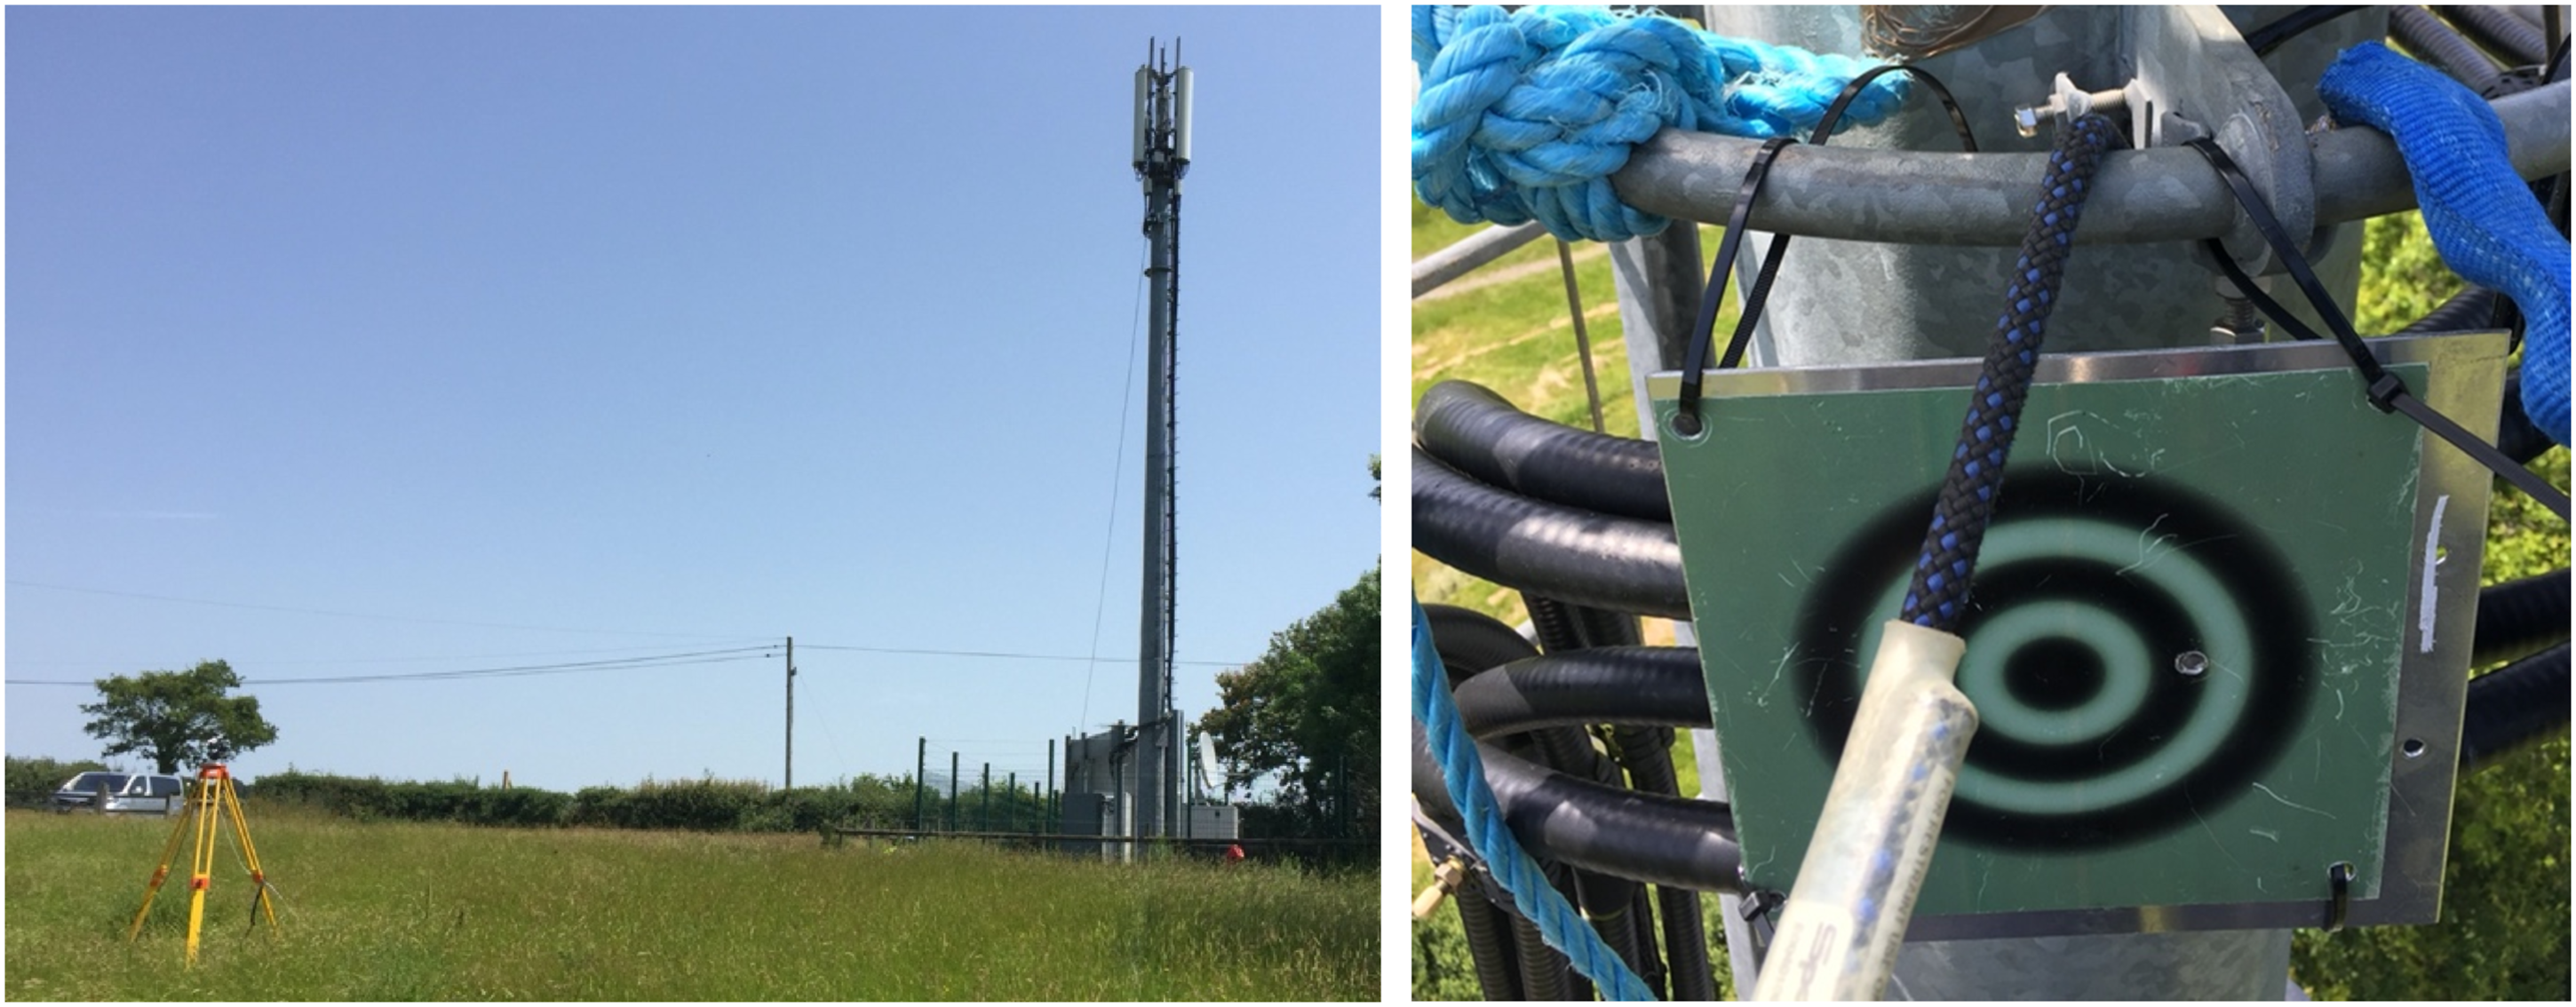
Results
Each response was initially compared across acquisition methods through the integration of the accelerations and the composition of both camera recording channels. The displacements obtained from the two systems were consistent with only a very minor error. For the purpose of the analysis, accelerations were taken as the main response unit and a higher percentage of the surveys were carried out with the APDM OpalTM system.
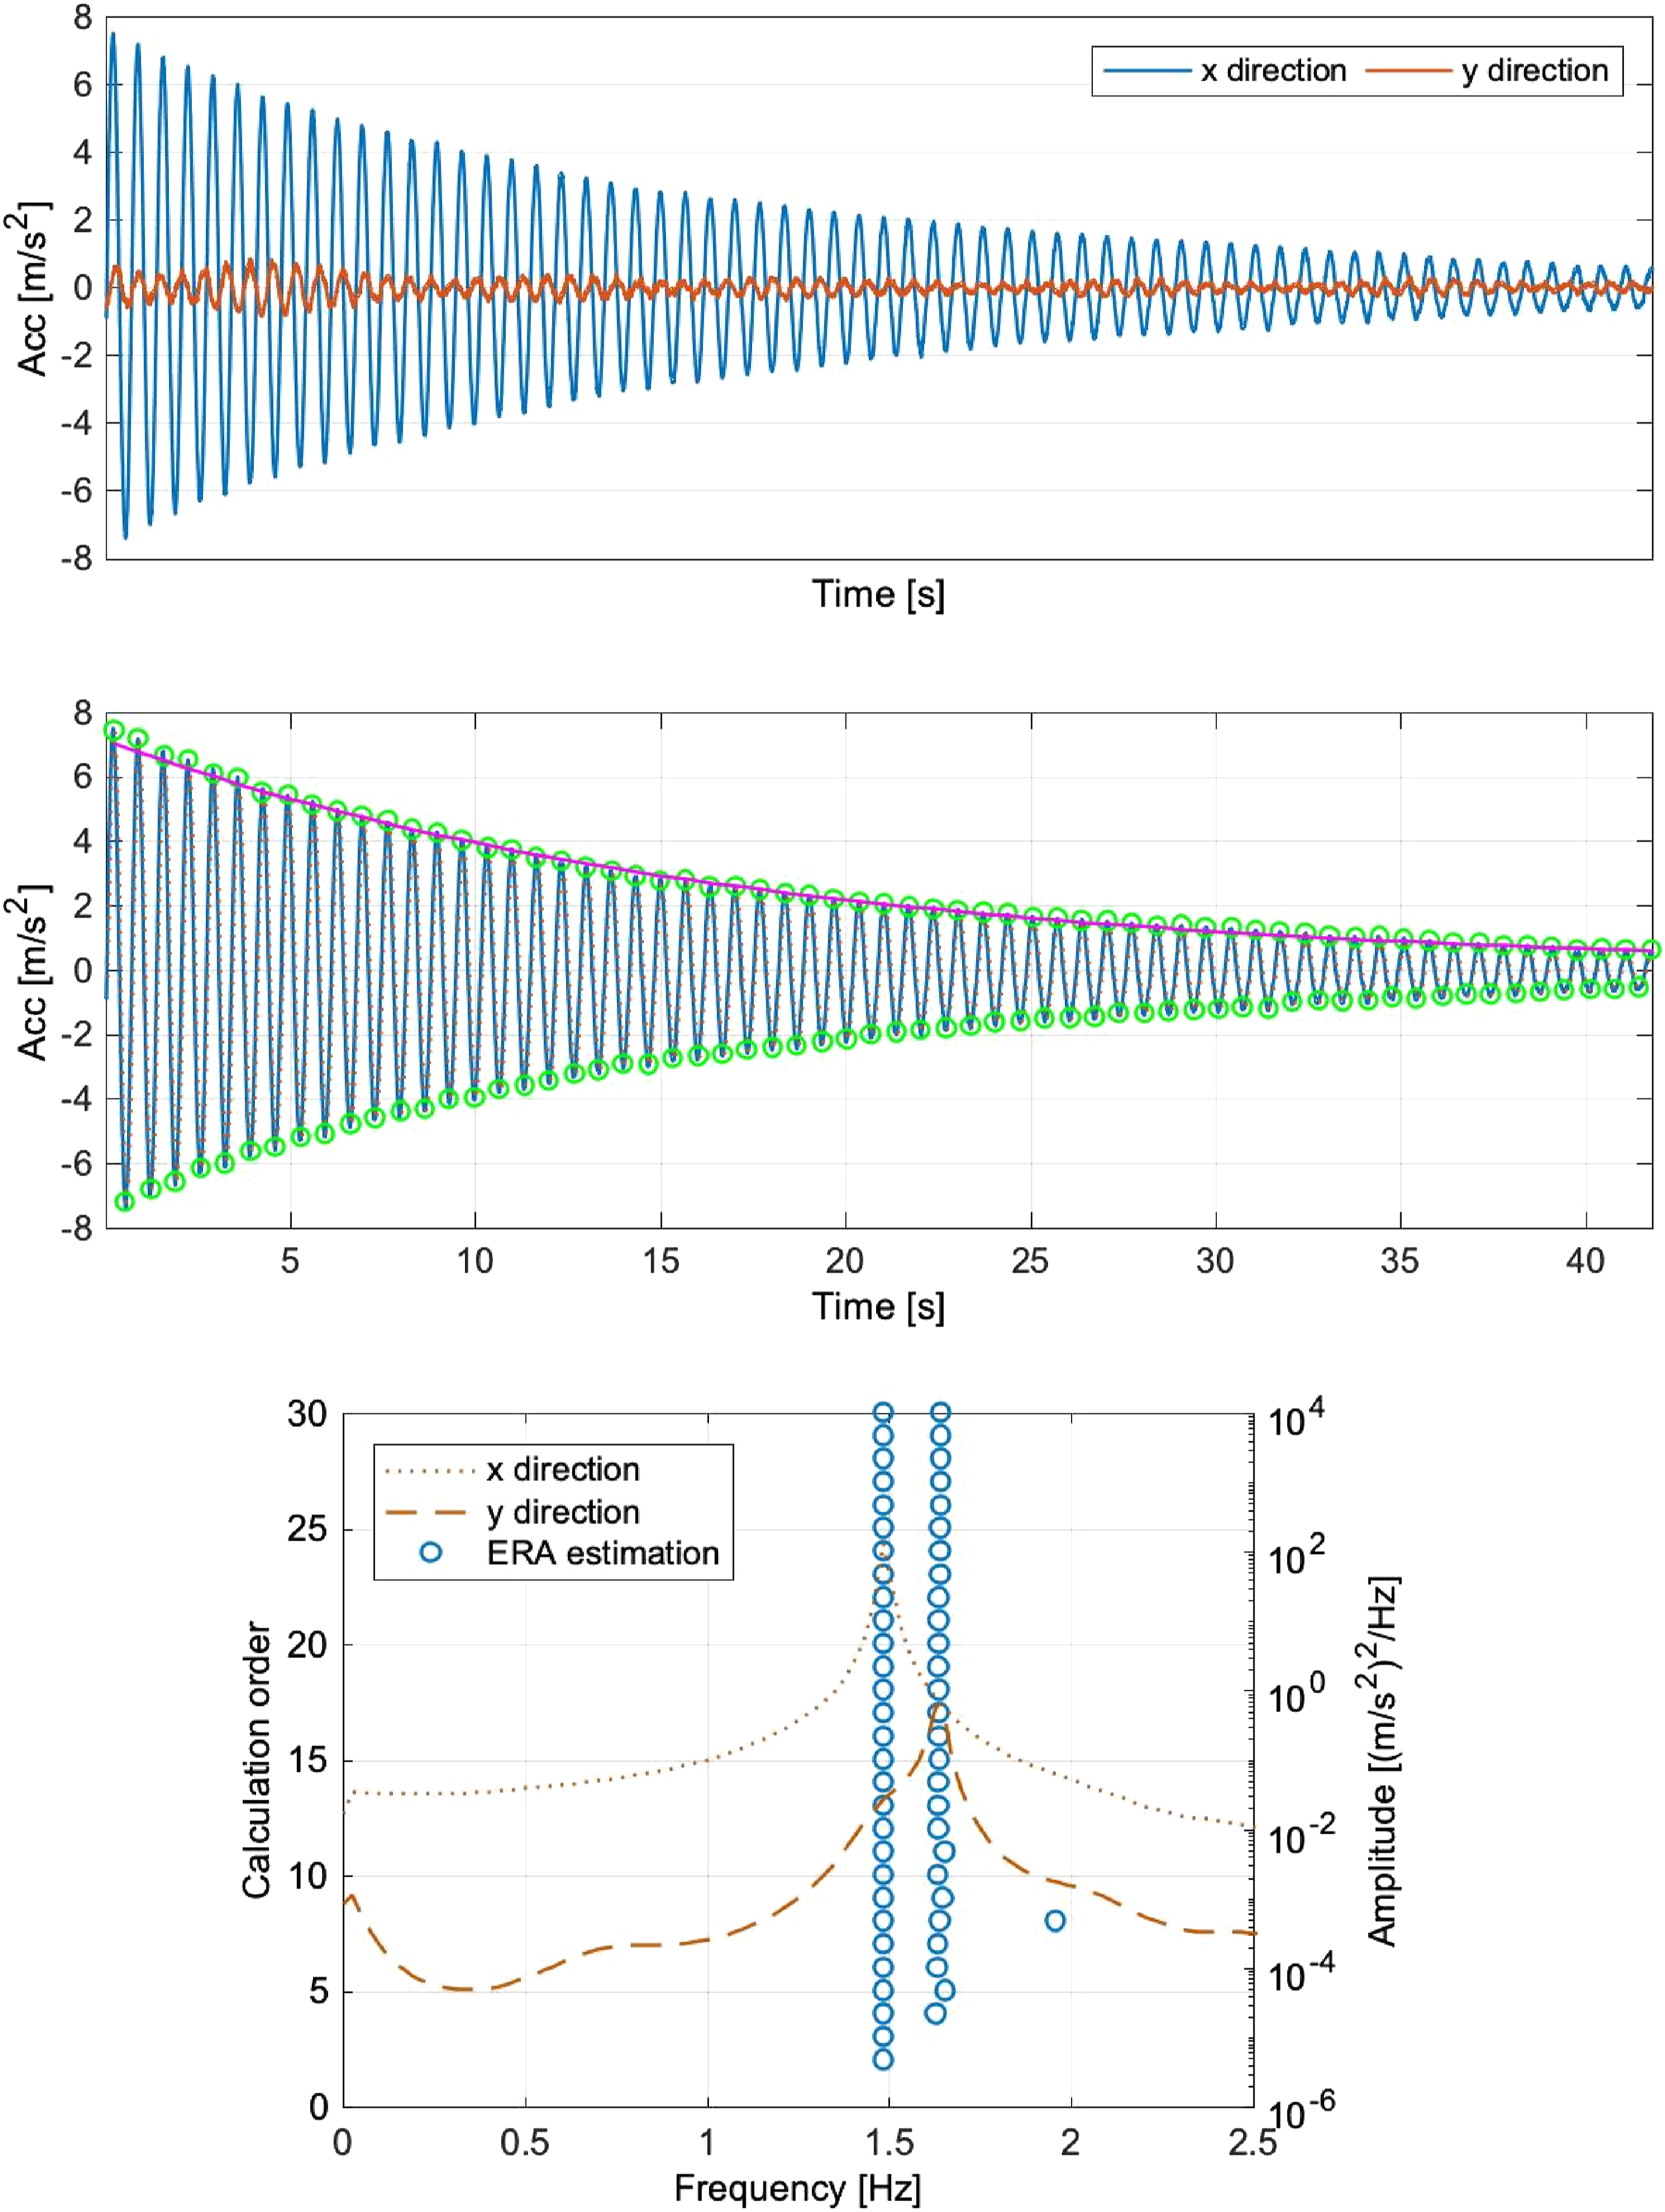
At Kinning, the OMA survey findings can be divided into three types of vibration: free-decay vibration (at 1.49 Hz excitation in the x direction), free-decay vibration (at 1.63 Hz excitation in the y direction) and coupled vibration between x and y. These vibration data were processed and analysed in the following sections.
Even with the correct direction of pull, data collected from both acquisition systems required slight rotation to find the clearest decay trace for each case. This rotation does not distort results with either method. Under CF, the correlated curve minimises the error between typical viscous damping decay and processed data to obtain the best fit. The ERA method is used to process the decay vibration data. That method can be combined with stabilization diagrams to show which identified modes are stable. In this work, the PSDs are also plotted with stabilization diagrams as references. • First mode. Decay vibration (at 1.49 Hz excitation in the x direction). The rotated decay vibration, shown in the first plot of Figure 9, suggests a suitable decay under the first mode and minimal influence of the secondary mode which oscillates slightly along the decay. During the vibration, energy can be transferred from one direction to the other, and the vibration presents a beat characteristic. Nonetheless, the response obtained in the main excitation mode is well accepted for the CF method, as shown in the second plot of Figure 9. The discrepancies between real decaying and CF would suggest a nonlinear amplitude-dependence behaviour which should be studied with other methodologies. The third plot in Figure 9 shows the corresponding stabilization diagrams of rotated data after the application of ERA, which finds both modes. For damping analysis purposes, results in the second mode were neglected as they were meaningless. The similar results of the first six decays shown in Table 2 provide a consistent main natural frequency at • Second mode. Decay vibration (at 1.63 Hz excitation in the y direction) Similar to the previous decay, the excitation of the second mode was capable of obtaining clear responses thorough a degree of rotation to decrease the impact of the first mode. In these kinds of monopoles, the higher mode is normally related to stiffening elements installed in the structure which break the original symmetry. In Portasilo monopoles, external linear loading, such as the existence of ladders or external cable trays align to the orientation of the mode shape to excite under pulling. Uncoupled decay vibration and coupled decay vibration (at 1.49 Hz excitation in the x direction). Top. Free decay response acquired from both channels. Center. Curve-fitting approximation. Bottom. ERA estimation diagram. Results summary of each selected pull of the survey.
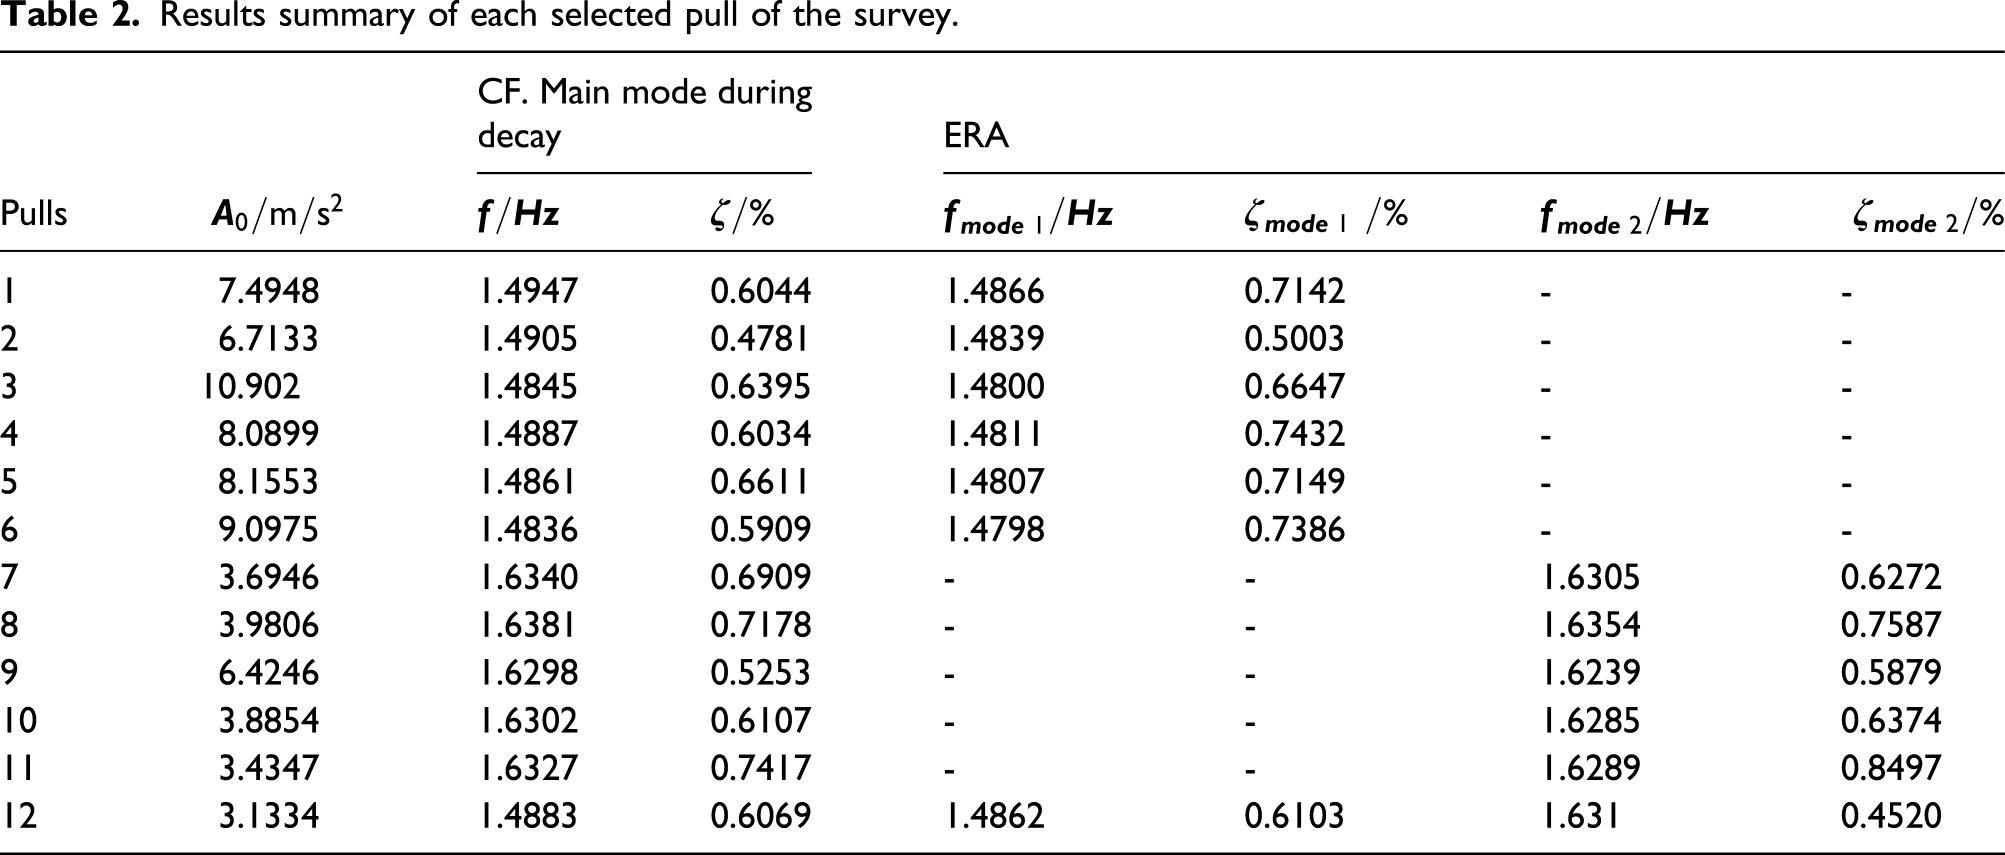
The third panel in Figure 10 shows the corresponding stabilization diagrams of rotated data after the application of ERA, which finds both modes as previously. For damping analysis purposes, the results in the first mode were neglected as they were of inferior quality for the estimation. The results of five similar decays shown in Table 2 provide a consistent main natural frequency at Uncoupled decay vibration and coupled decay vibration (at 1.63 Hz excitation in the y direction) Top. Free decay response acquired from both channels. Center. Curve-fitting approximation. Bottom. ERA estimation diagram.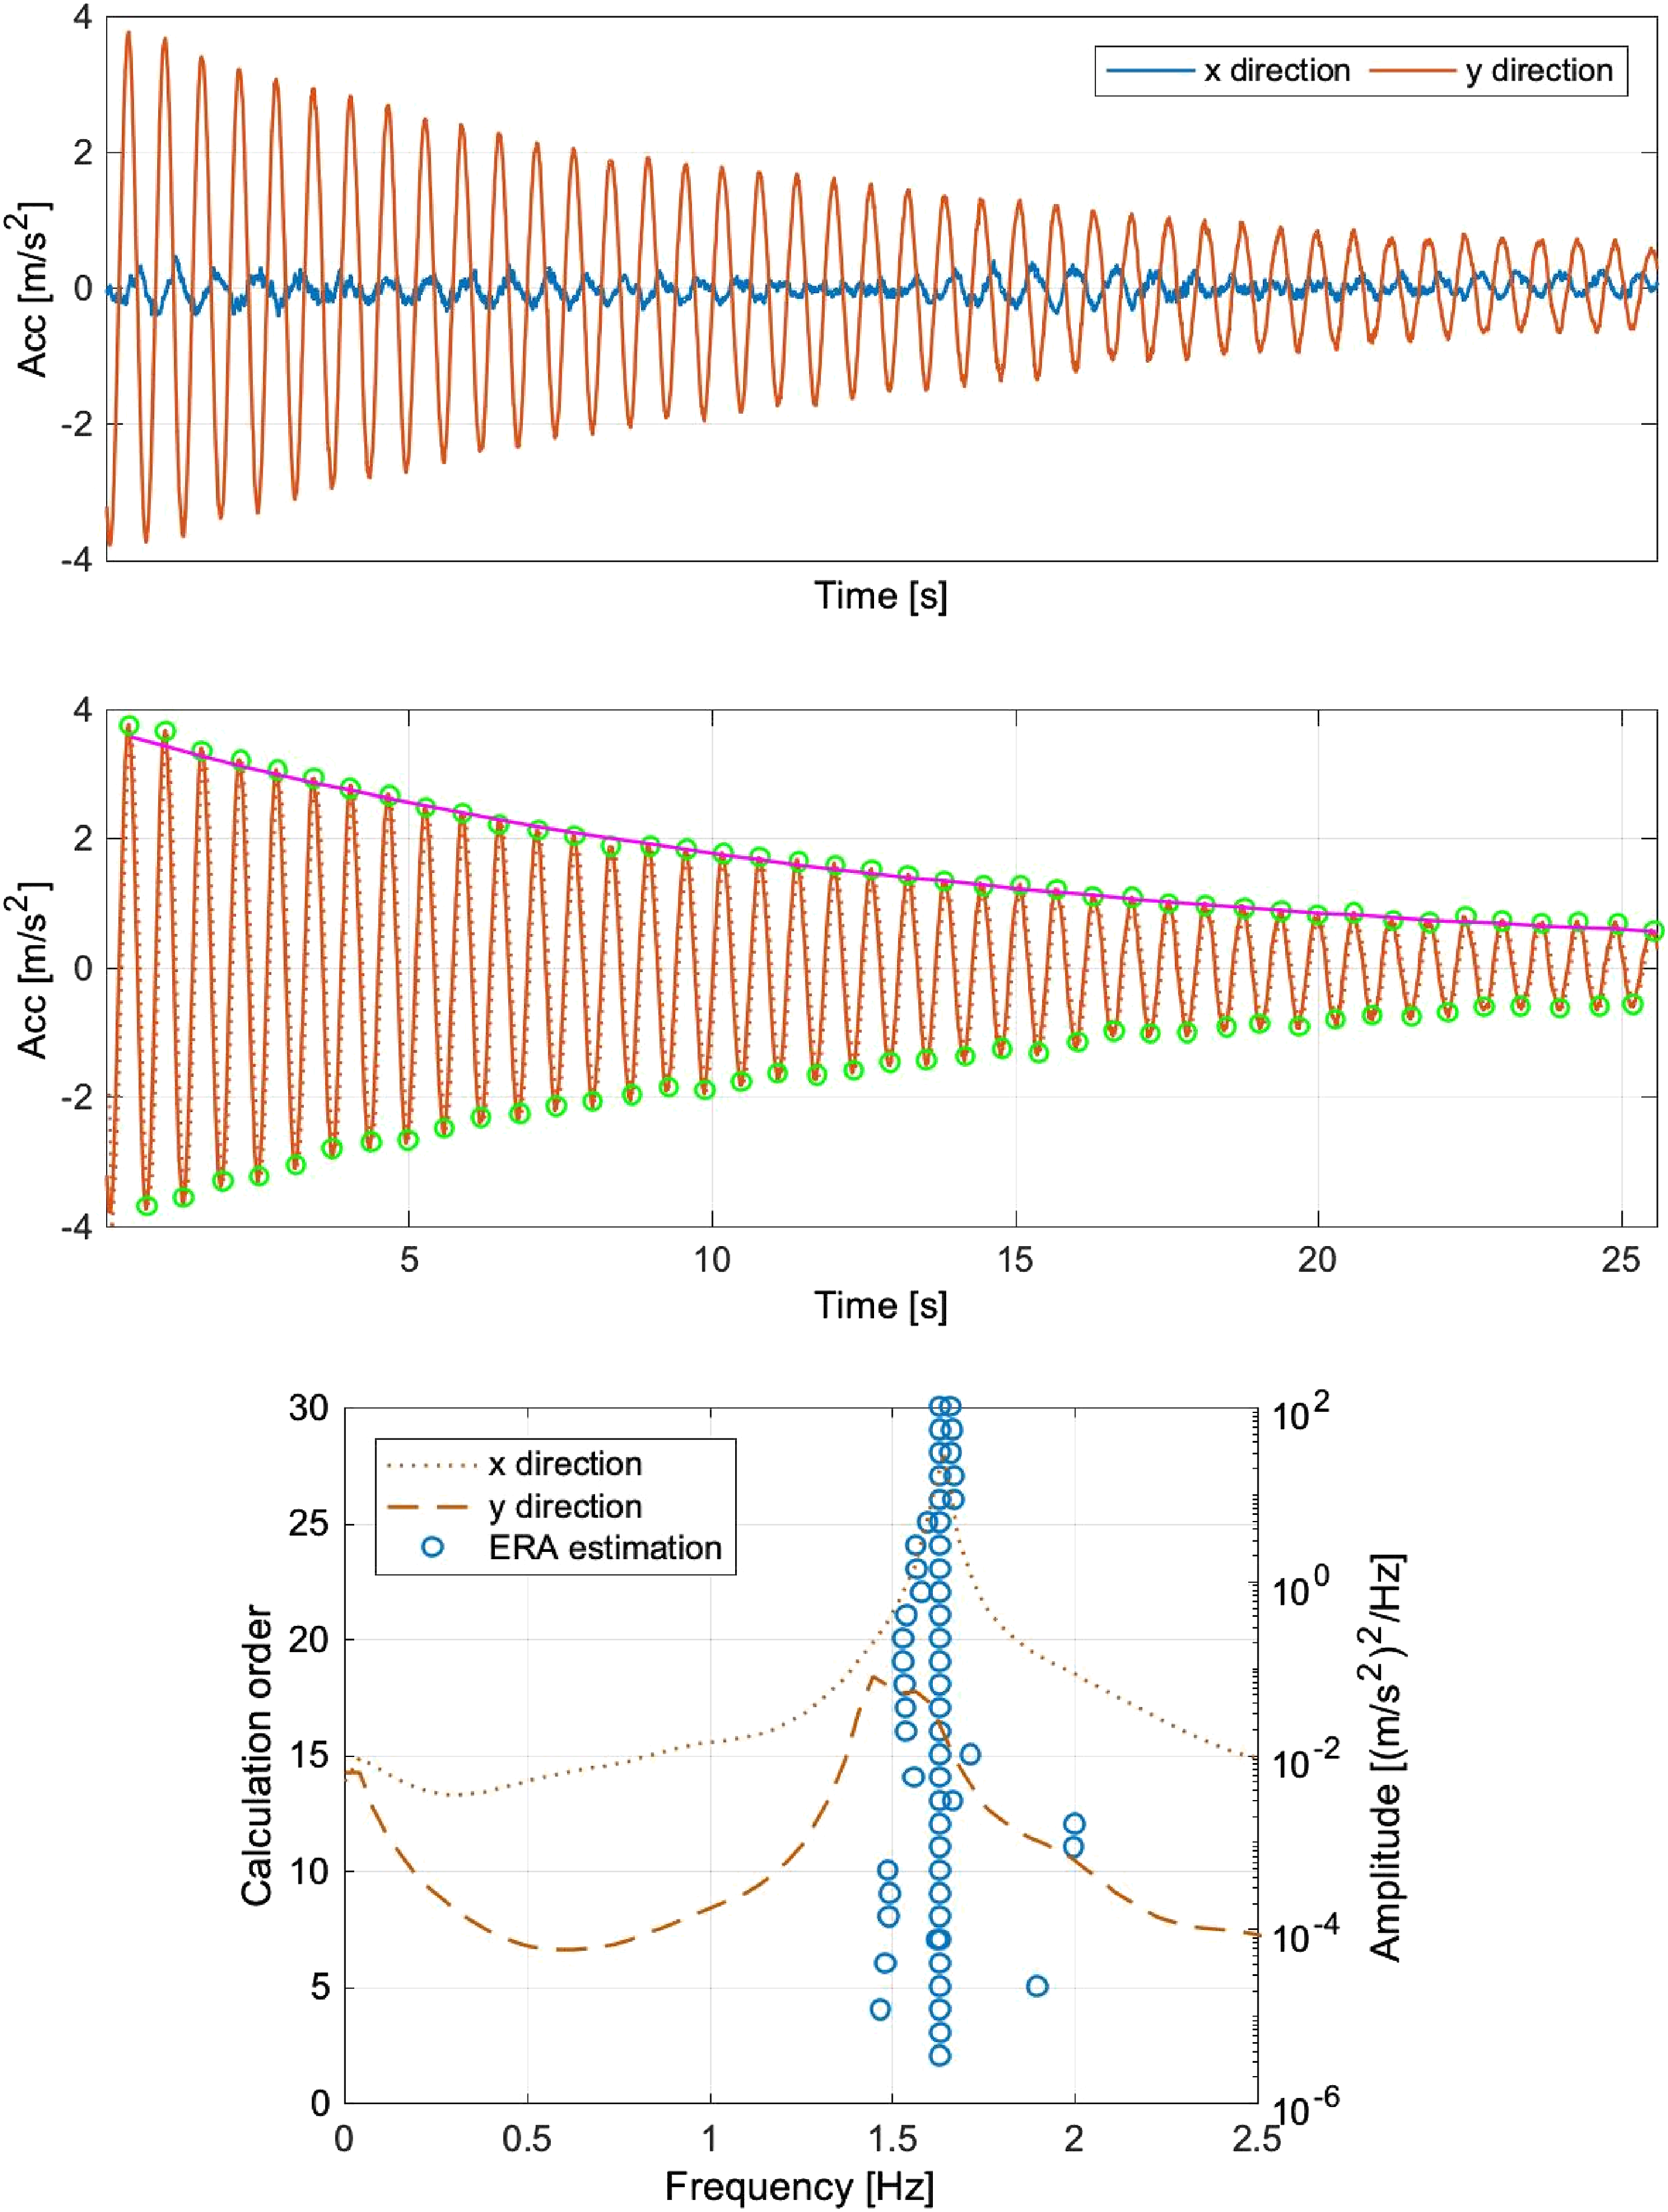
Coupled modes. Decay vibration
Finally, to verify the behaviour of the structure under coupled motion, a few pulls were carried out in the non-main modal directions. This way there is a high influence of both modes along the decay – the rotation of the response does not improve the shape of the decay and consequently both modes form beat features which deteriorate the response to be analysed under CF, as shown in Figure 11. The second mode response was not taken for CF analysis as the optimization did not converge. Uncoupled decay vibration and coupled decay vibration (excitation in symmetric direction) Top. Free decay response acquired from both channels. Center. Curve-fitting approximation for both decays. Bottom. ERA estimation diagram.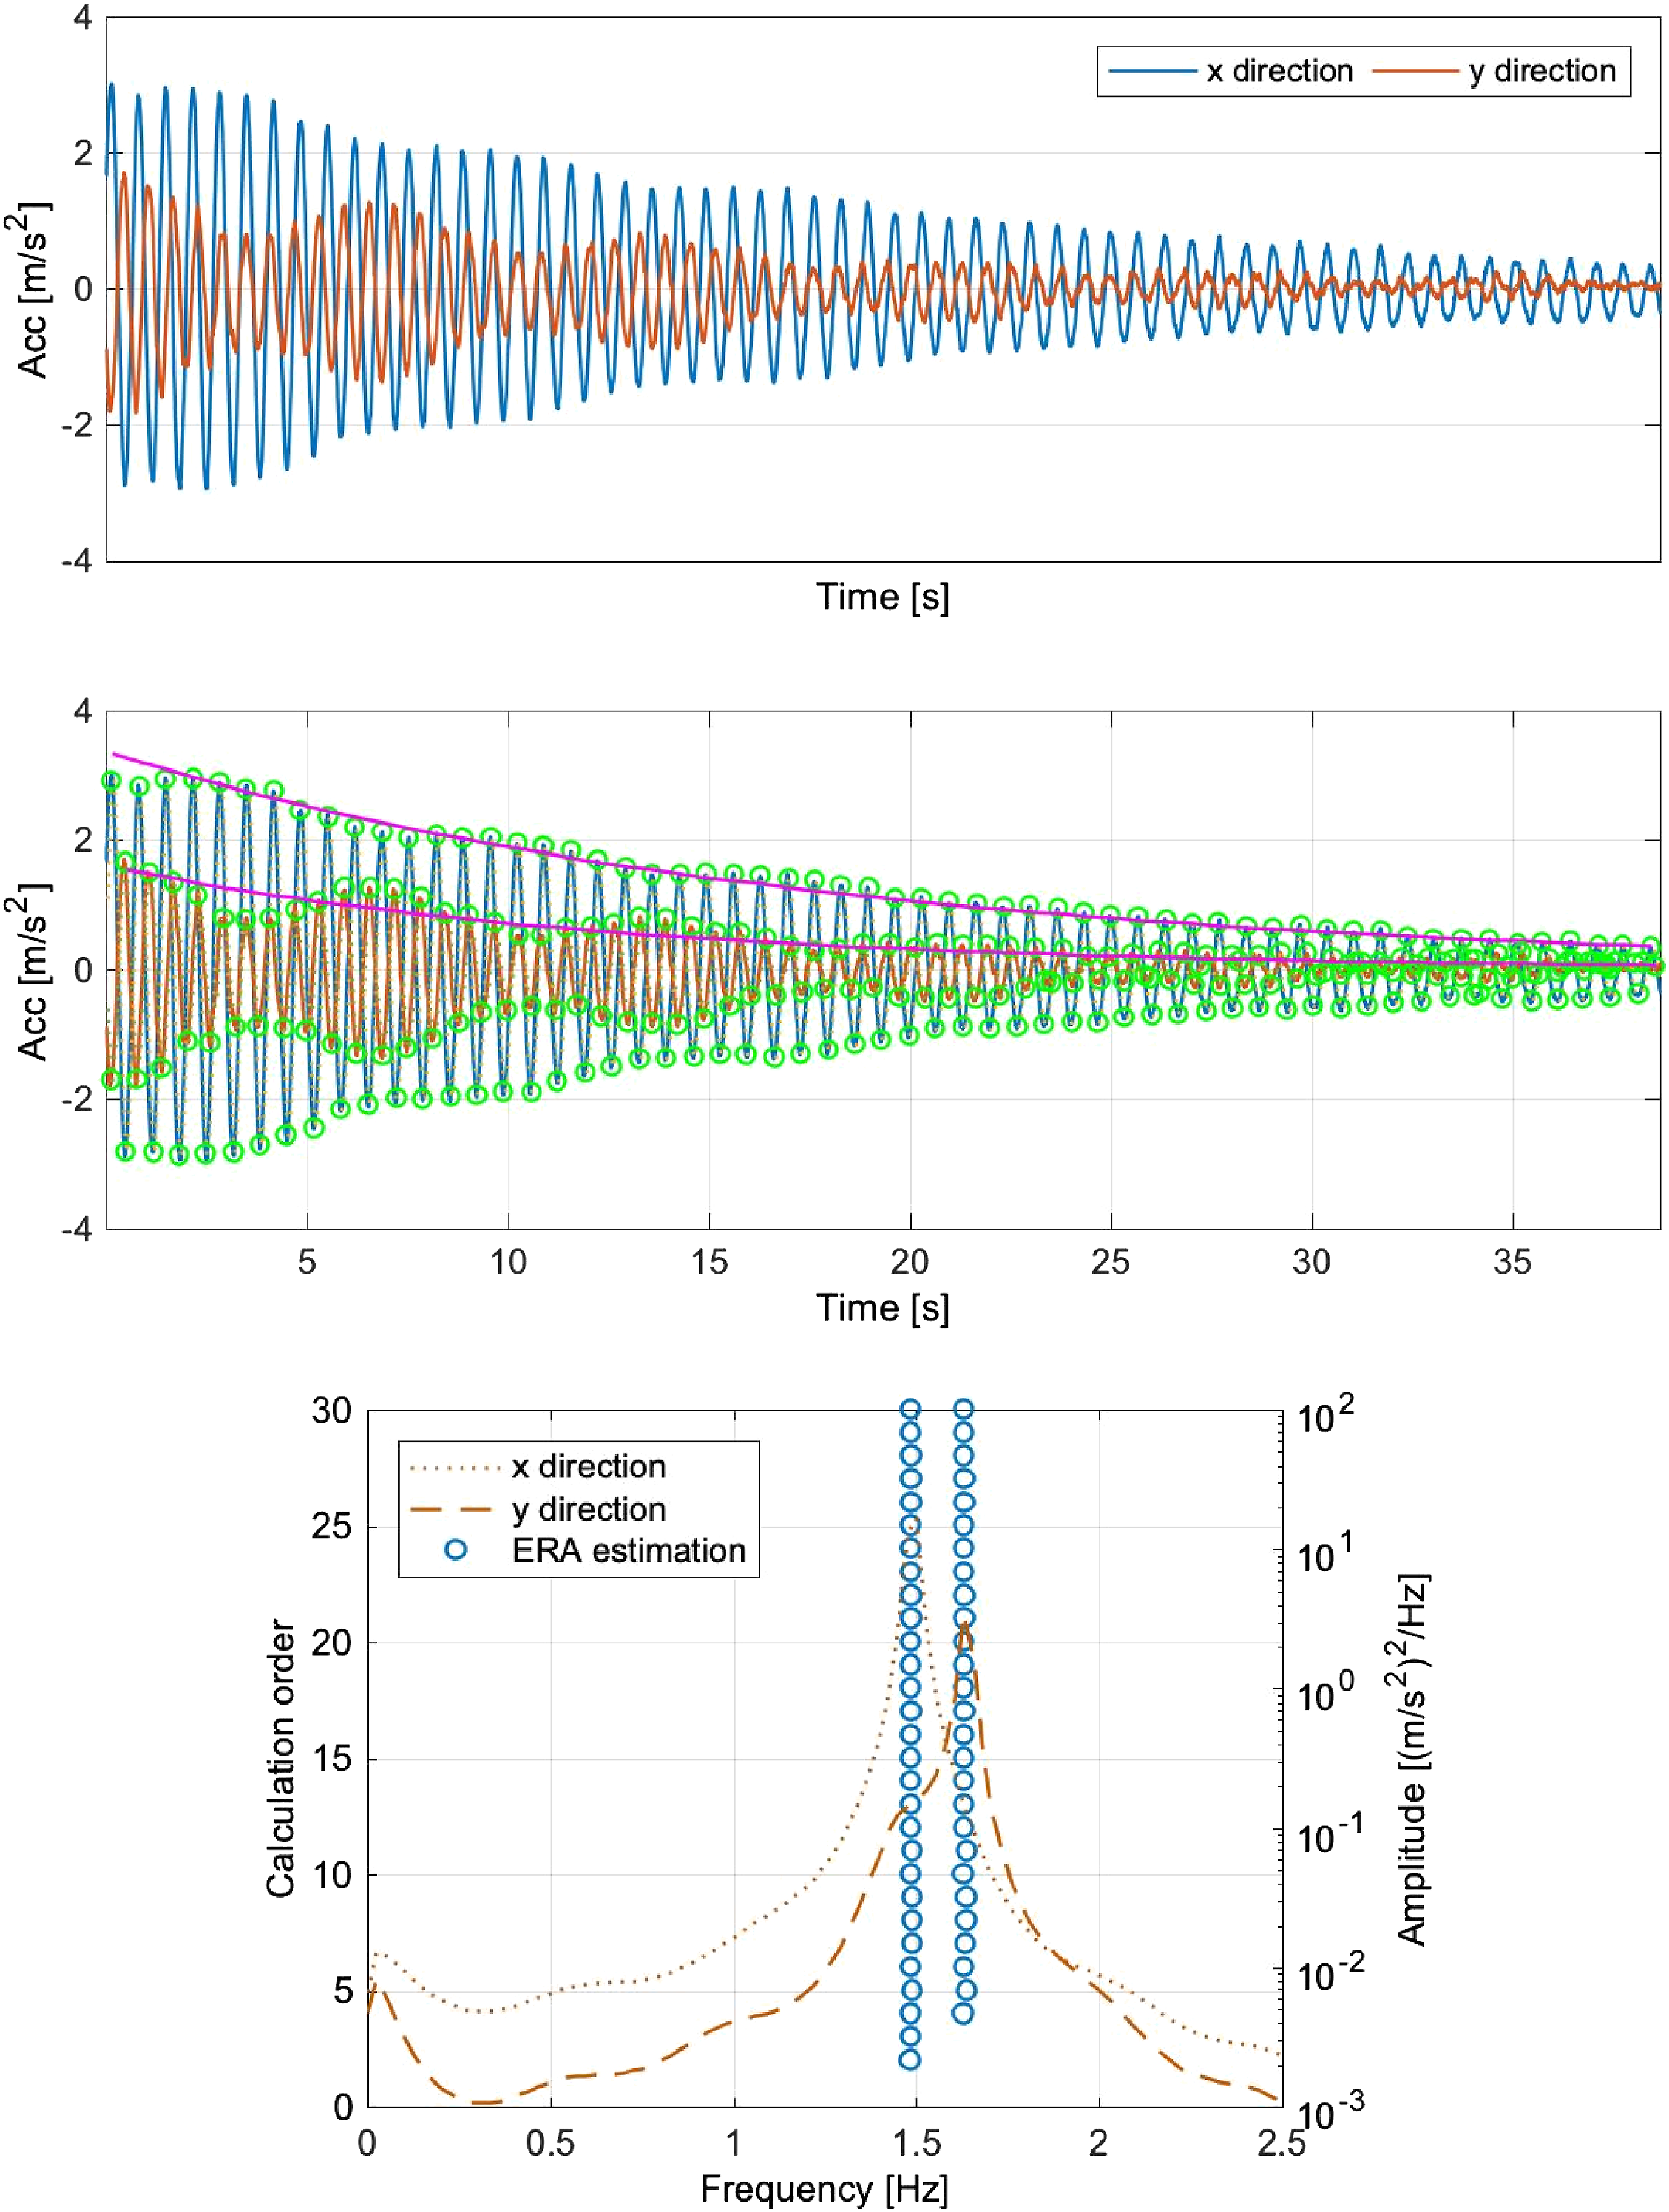
The third plot in Figure 11 shows the corresponding stabilization diagrams of non-rotated data after the application of ERA, which finds both modes.
The result of the last entry in Table 2 provides sensible values in terms of natural frequencies at
As shown, the coupled scenarios tend to have lower values of modal critical damping than the individual cases due to cleaner decay responses, higher amplitude responses, thanks to achieving a higher resonance level or the transfer of energy dissipation between modes. Responses under the main modes are then a target to be obtained during the OMA survey. Since the OPAL sensor remained on the structure, the whole-time history was obtained as shown in Figure 12, where each considered decay (in red) was analysed. On the other hand, the Video GaugeTM system takes time sets for each pull that are later correlated to the APDM OpalTM system. Period of time response of the Kinning survey.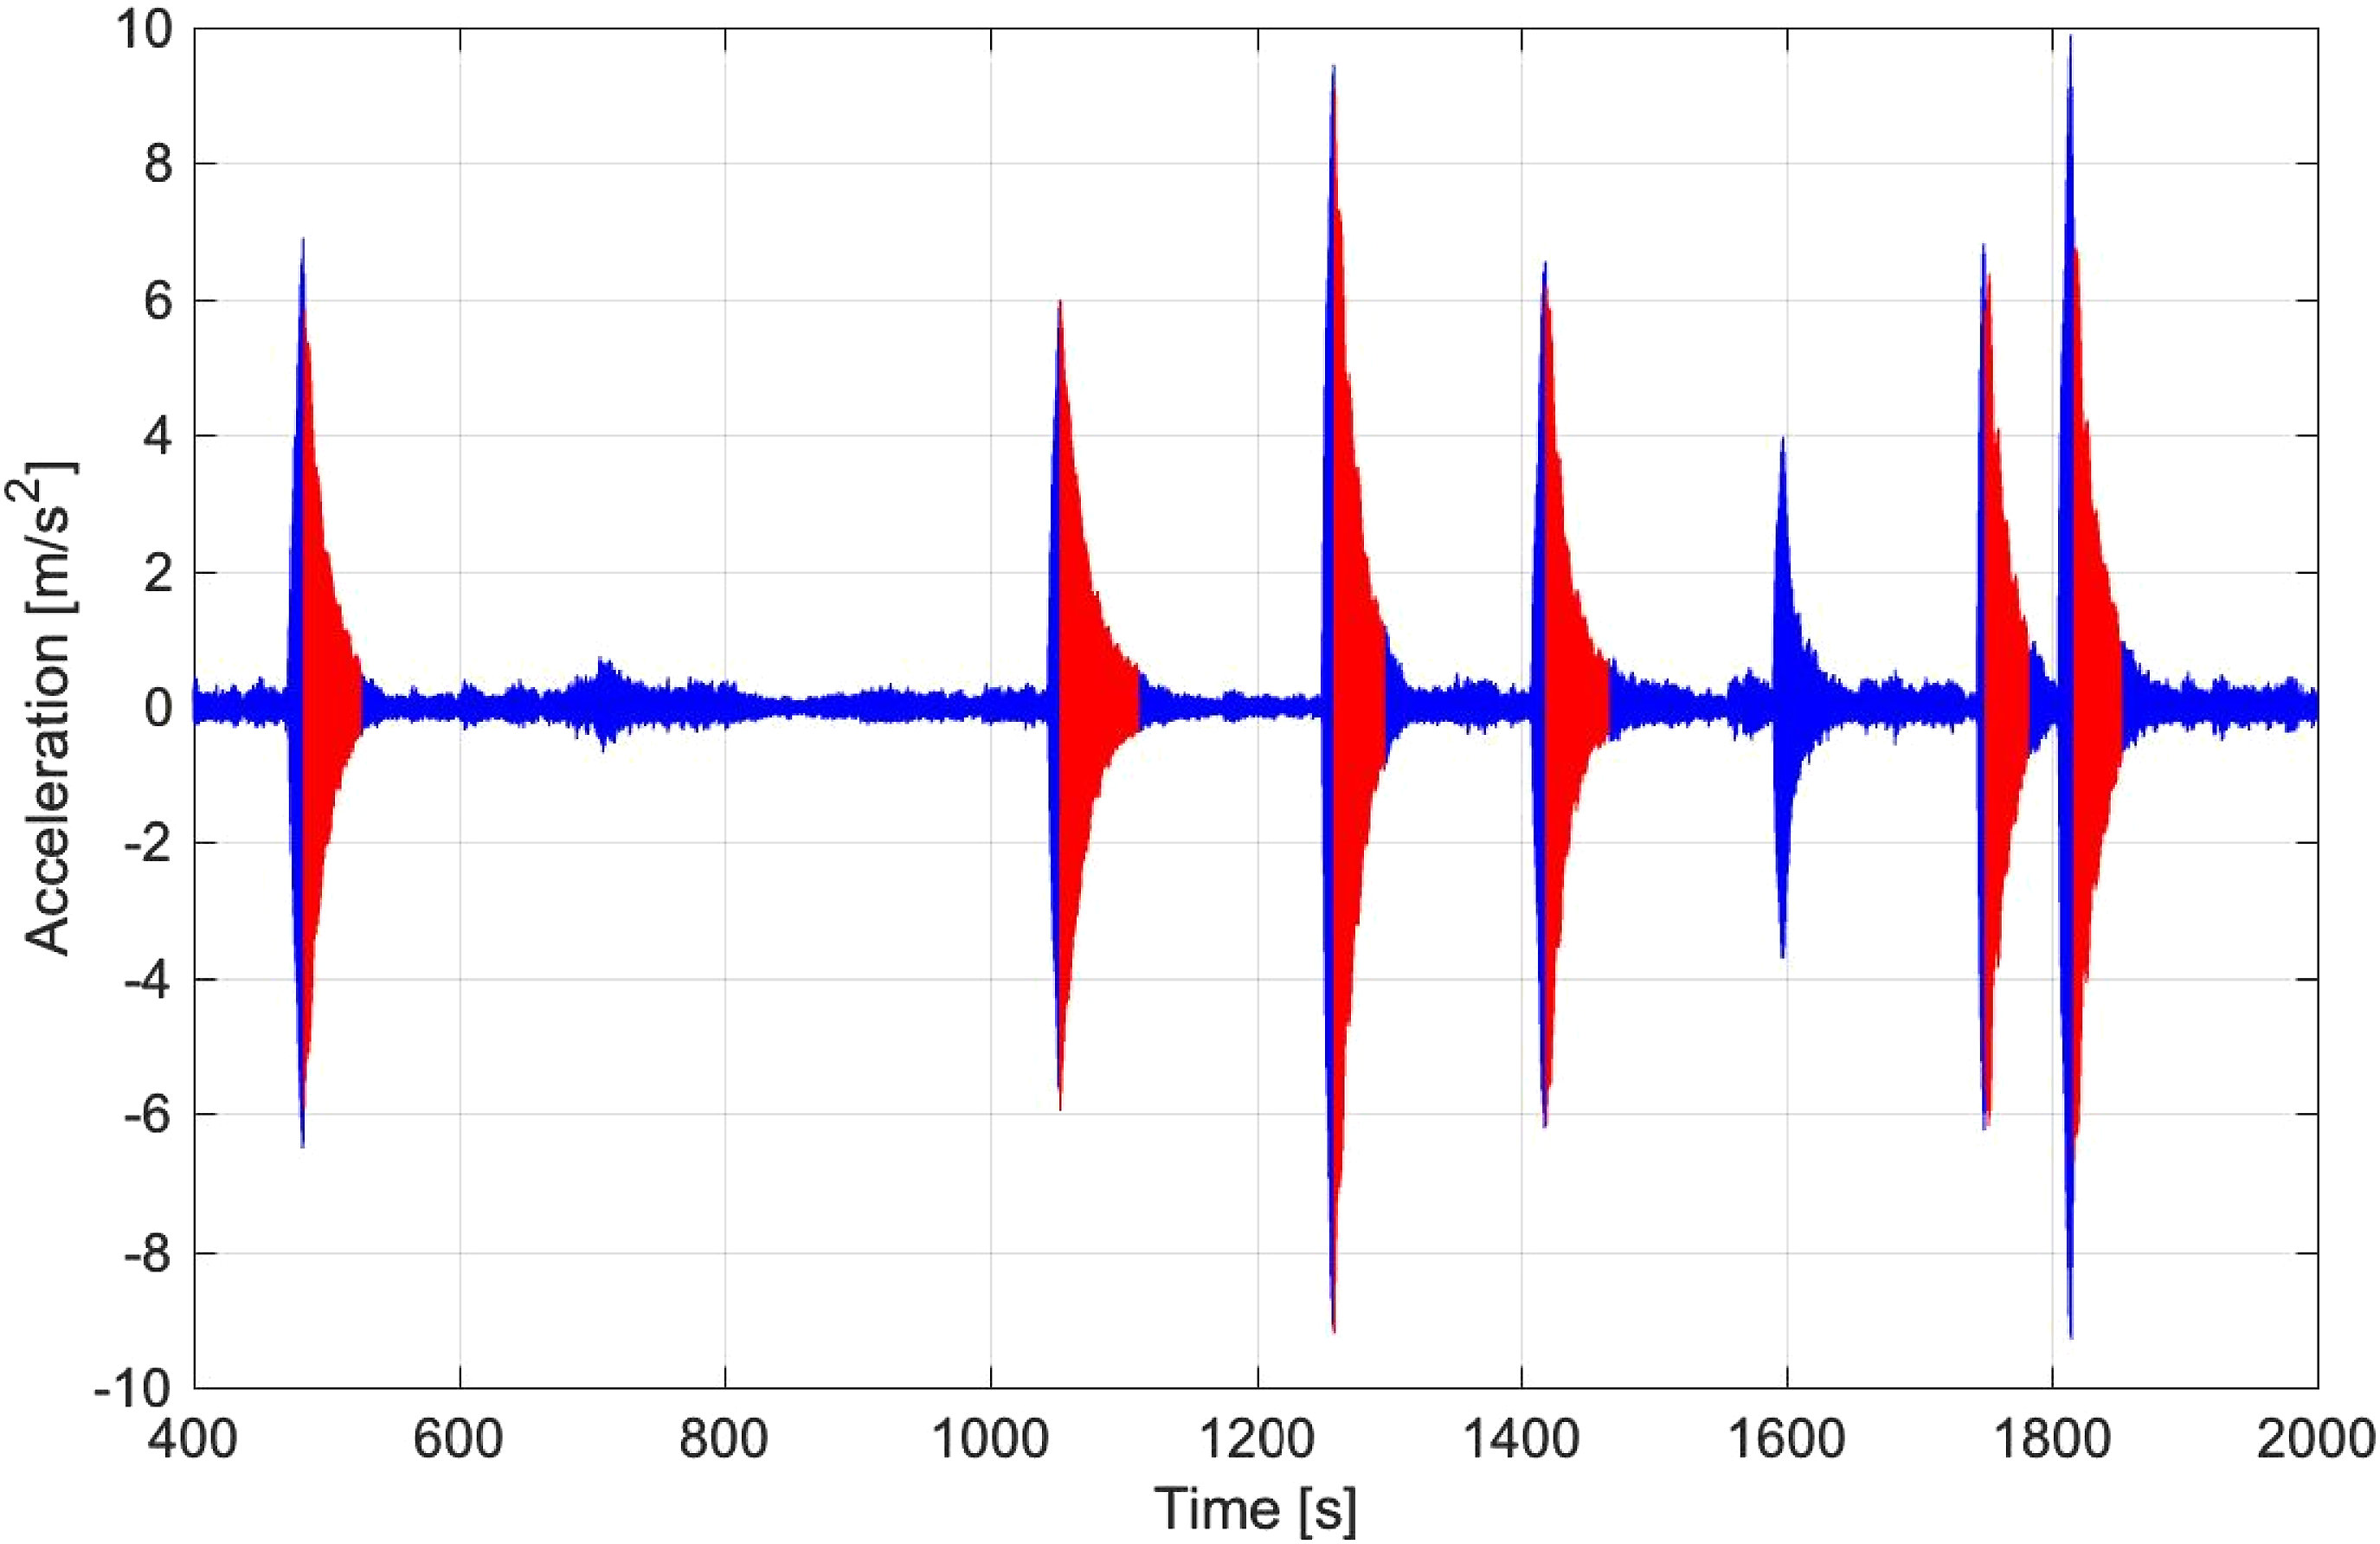
As shown in Figure 12, different levels of maximum response are achieved due to different levels of resonant forcing. However, the exposed methodology calculates the mean value of damping taken as the most optimised along the decay, as shown in Figure 13, in which no evidence of amplitude dependency was found. Applying time-dependent damping identification on each decay such as via amplitude-dependency backbone curve methodology (Londoño et al., 2017) would provide instantaneous damping values from which amplitude dependency might be indicated. Amplitude against damping in Kinning OMA.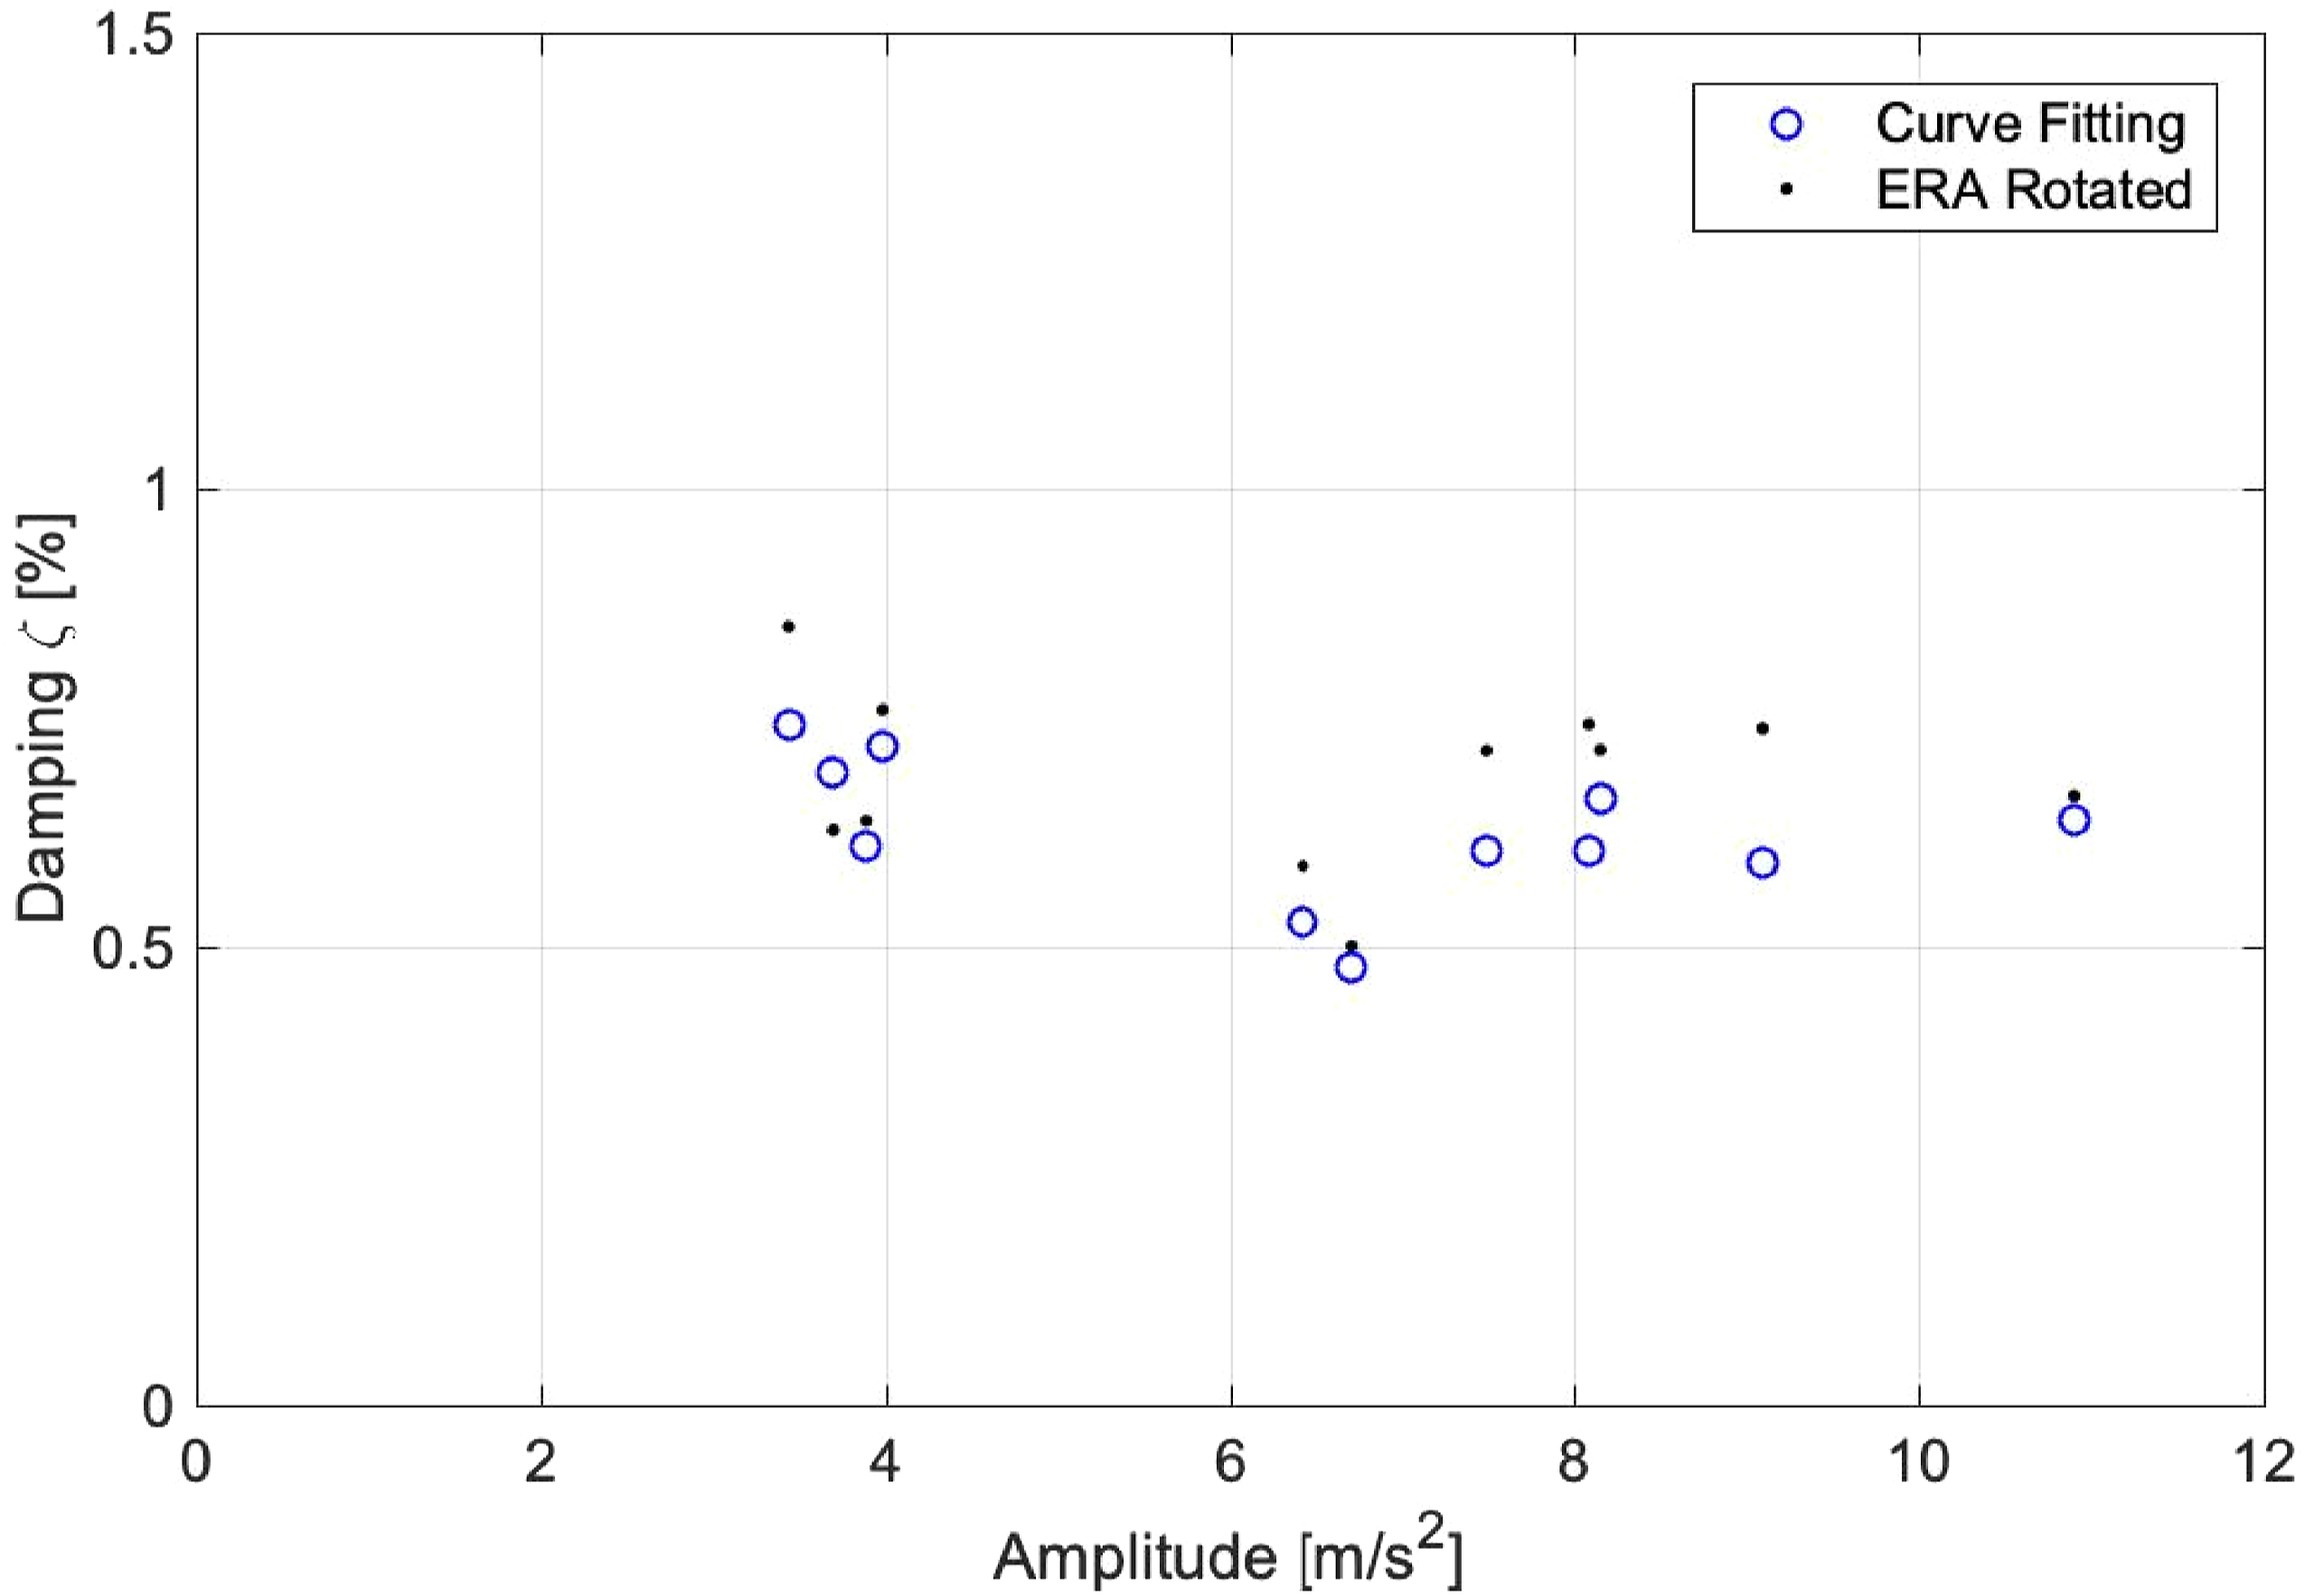
In addition to that, there is a trend among methods in which CF approaches slightly lower values than ERA. This behaviour which depends on the quality of the signal is not confirmed in other surveys. The final results in Table 2 suggest similar behaviour between modes with common values of critical damping in a narrow band between
Application to population of short communication structures
Summary of pull & release surveys. Results on ERA method.
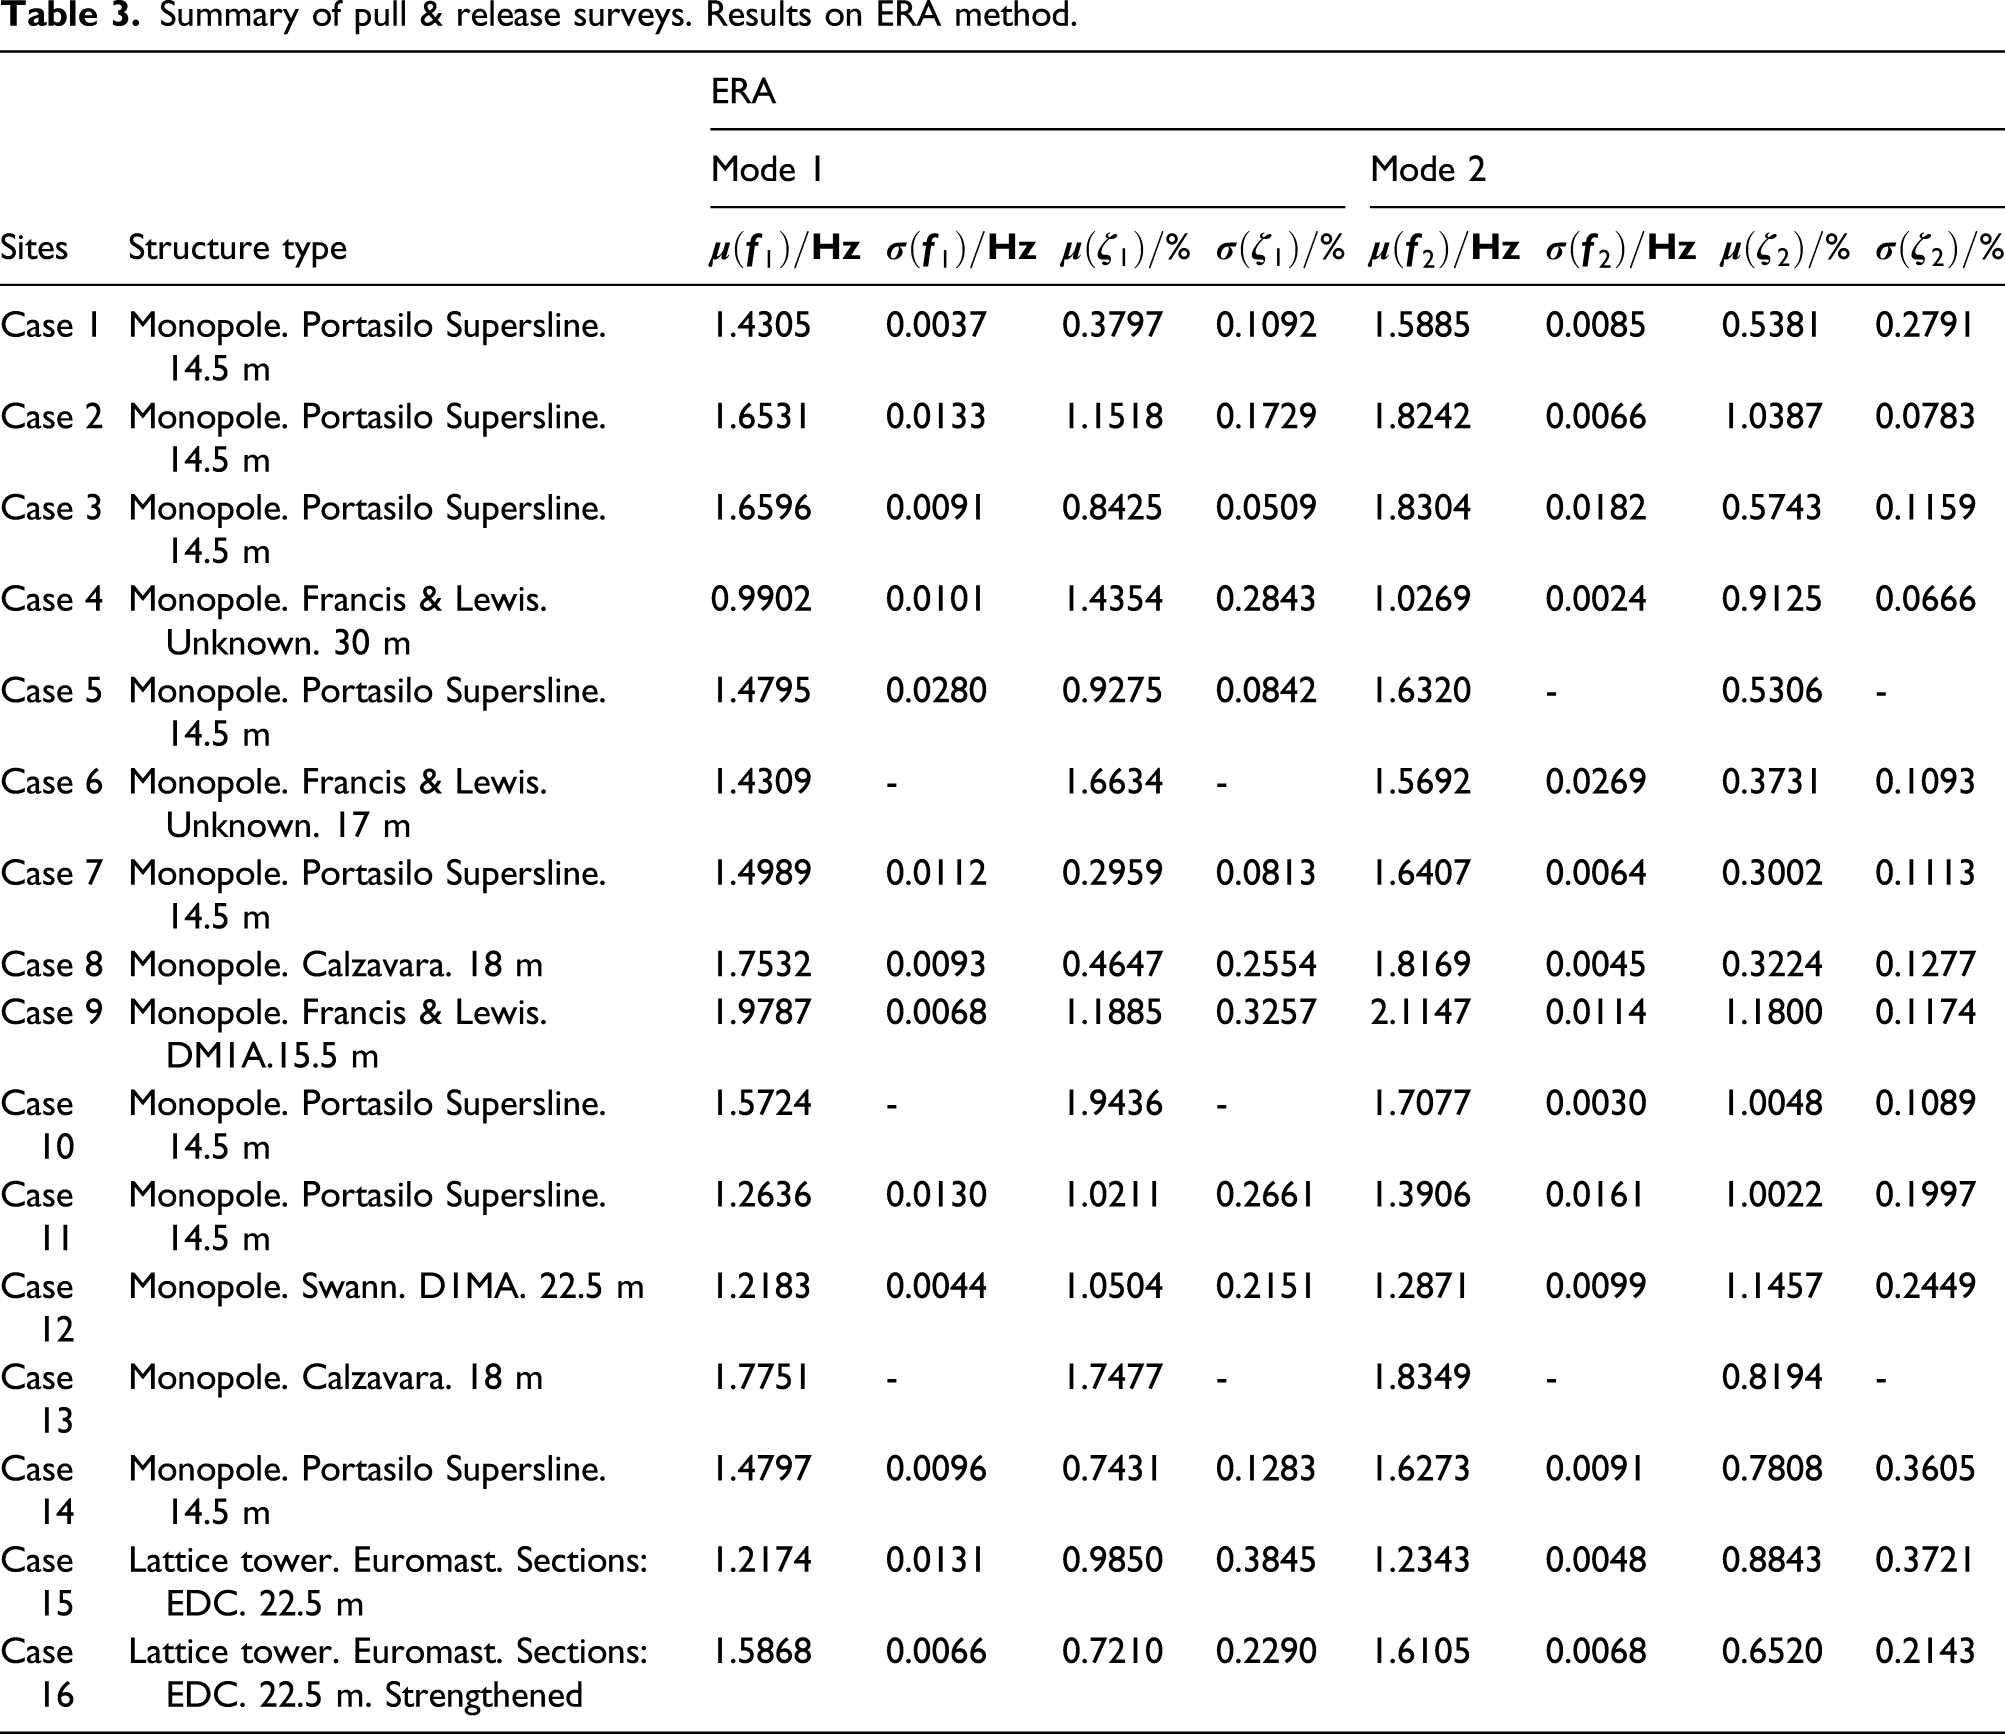
Table 3 summarises the ERA results obtained for each set-up as mean values and the corresponding deviation for natural frequency and modal critical damping applied for both main modes. This way, each site can easily be classified and compared with each other and with respect to recommendations. Figure 14 plots results from Table 3 enclosing each modal result in a rectangular block using mean values as centre point and deviation as sides. That way, the figure shows how both parameters behaves, natural frequency in x axis and modal critical structural damping in y axis. On some surveys, there was no possibility to obtain clear decays on both modes, and consequently, CF was not applied in such cases.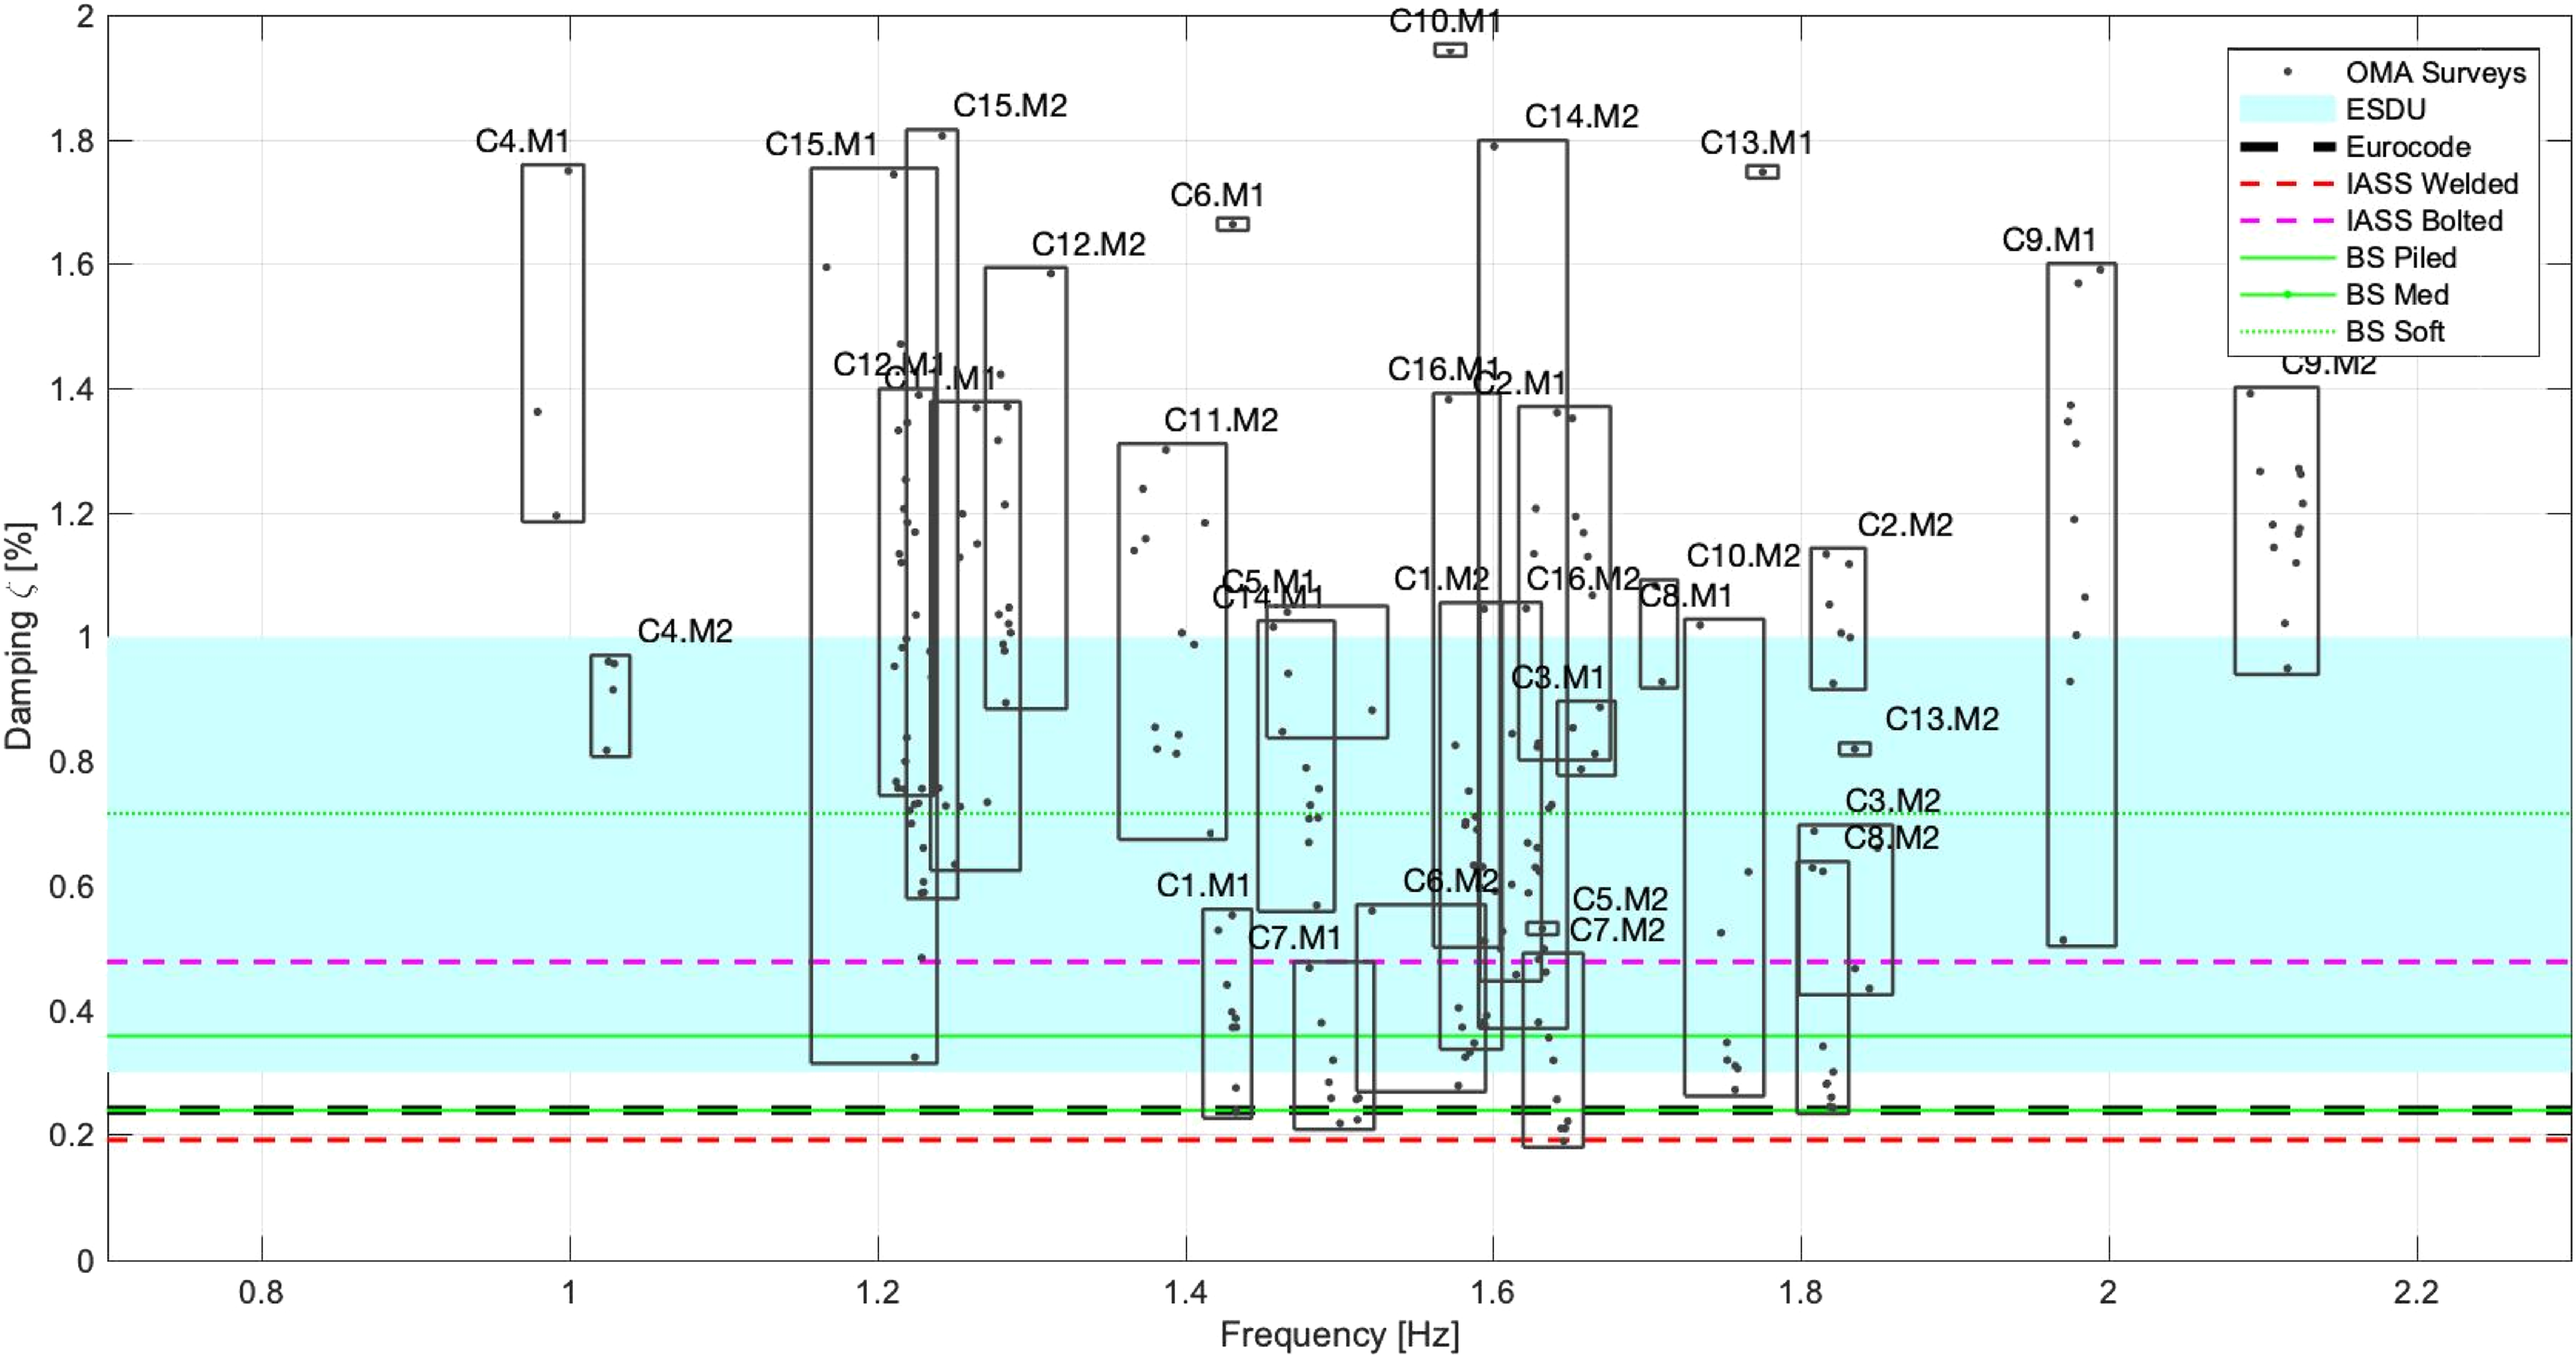
As expected, a similar response based on two main close-related cantilevered modes was identified in all cases with deviations less than
As shown in previous Table 2, damping estimation is more challenging as the deviation between data from the same site is much higher than between frequencies, with an error margin of
Between the estimation methodologies, ERA and CF, the tendency observed in the Kinning results, Table 2 is not followed for the full population of surveys. The quality of the response decay is the key factor defining the CF or the cross-correlation function used in ERA, and consequent damping results.
In terms of typology, the exercise covered a few typical short lattice towers, called Euromasts, which have been used extensively in the UK for the last decade. Despite being wider and heavier structures with more connections between leg, bracing and horizontal members, they have similar dynamic parameters to monopoles. The main frequencies appear in the same range of between
In addition to that, they showed high discrepancies between old installations which exhibited lower frequency levels and very low values of damping
On the one hand, all of the above results appeared to be in the ranges provided by ESDU (ESDU, 2012), which are based on an extensive literature review of similar steel structures, such as chimneys or tall lattice towers. However, some values exceed this range on both sides: conservatively and unsafely.
On the other hand, the recommended value of
The old considerations provided by the IASS, particularly for bolted steelwork rather than welded, are also within the range of results experienced in this study.
The variability of the results obtained from the full-scale tests endorses the need for field test surveys to find essential dynamic parameters, in turn enhancing structural design assessment by decreasing the level of uncertainty. Over time, and by generating a database of values, this could be used to support a change in the current standards or at least allow them to offer more representative guidance without compromising safety.
Conclusions
Short communication structures demand better knowledge of dynamics to properly calculate their structural integrity under dynamic loading, such as seismic or wind loading. By using a simple field test based on human excitation with response acquisition systems to obtain free-decaying responses of two main modes, the key modal parameters (natural frequency and structural damping) can be found, providing essential information for structural engineers.
Curve-fitting and eigensystem realization algorithm estimation methods are proven to work satisfactorily for the analysis of the decays. Between methods, small discrepancies were found that explain the differences in quality in the free-decay response. To obtain the best performance of the decay for each mode, it is necessary that each excitation focus on the desired mode. Here, previous knowledge of each structure can be helpful.
After implementing the methodology in 16 cases of field tests, of which 14 were monopoles and two were lattice towers, the calculated structural damping values covered a wide range of between
The results confirm the concerns of the consultancy sector about the conservative values of damping recommended by the main codes. All the results of the paper showed superior values to the
Footnotes
Acknowledgements
Support for this project was provided by Vibration Engineering Section of University of Exeter and Arqiva Ltd as owner of the structures tested and sponsor of the PhD Research.
Declaration of conflicting interests
The author(s) declared no potential conflicts of interest with respect to the research, authorship, and/or publication of this article.
Funding
The author(s) received no financial support for the research, authorship, and/or publication of this article.