
Abstract
If policy preferences follow material interests, the experience of socioeconomic disadvantage ought to increase support for redistributive policies. However, experiencing disadvantage might also reduce faith in government’s ability to make things better, indirectly reducing support for redistributive action, and leading to a spiral of widening disadvantage and increasing political disengagement. Indeed, disadvantaged communities sometimes favour right-wing platforms over those offering redistribution, as in the taking of ‘red wall’ constituencies in the North and Midlands of England by the UK Conservative party in 2019. This article uses quantitative data from a survey of ‘red wall’ voters (n = 805) to examine the bases of people’s perceptions of redistributive policies. We find that even a radical redistributive policy, Universal Basic Income (UBI), receives consistently high levels of support (69.45 SD 27.24). Lower socioeconomic status, greater financial distress and greater risk of destitution all increase support. These effects are partly mediated by mental distress, which is markedly higher among the less well off. However, the same socioeconomic factors also reduce faith in government, which in turn is associated with lower support. Thus, those who stand to benefit most from redistribution are aware of their material interests, but are also the least confident in the ability of government to improve their lives. As such, there is a clear political challenge for progressive politicians: those whose support they depend upon require a significant redistributive offer, but also need to be persuaded of the viability of reform to support progressive change.
Introduction
A body of evidence now indicates an association between higher levels of inequality and lower health, well-being and social outcomes. Indeed, a recent study demonstrated that rising inequality has had a substantial negative effect on life satisfaction in wealthy countries (Bartram, 2022). This is true even when there have been absolute gains by virtue of economic growth. The impacts are profound. The pandemic has highlighted the enormous cost of health inequalities that track socioeconomic inequalities. Indeed, we have found that over one third of all 16- to 24-year-olds met clinical threshold levels of anxiety and depression on the SF-12 measure in 2019 before the pandemic (Parra-Mujica et al. (2022)), with morbidity driven by subjective socioeconomic markers such as perception of status and financial distress. However, progressive policymakers currently face a challenge in countries with rising inequality of wealth: there appears to be a trend of lower-income voters rejecting traditional parties of the centre and centre-left and supporting the centre-right and right-wing parties (Polacko, 2022). In part, this may reflect declining faith in the ability of left and centre-left parties – and government in general – to make things better. Given that parties of the right and centre-right are associated with the very policies that promote inequality in the first place, there is a hypothetical downward spiral in which support for parties committed to reducing inequality falls as inequality rises, preventing the economic source of dissatisfaction from being addressed.
The electorally critical ‘left-behind’, ‘red wall’ constituencies in Wales and the North and Midlands of England (see Mackinnon, 2020) are archetypal examples of areas that stand to benefit from redistribution but have recently begun to support right-wing parties. The loss of many of these constituencies in the 2019 UK General Election has led the leadership of the main progressive UK party, Labour, tactically to eschew redistributive policy in favour of mimicking the English identity politics, including sidelining of socially progressive policy (Berry, 2021; Goes, 2021; Nandy, 2020) and promotion of visible symbols of ‘patriotism’ (Hayhurst, 2021) of the Conservative Party. Not only has this found limited electoral success, but it also means that the very policies that might stop the downward spiral are being abandoned. This may be tactically naive, as evidence suggests that voters’ support for policies associated with right-wing politicians is grounded in the perception of material benefit, whether through mitigating zero-sum competition for low-paid employment via Brexit or through ‘pork barrel’ infrastructural investment (see, e.g. Huber and Ting, 2013).
In this article, we use a key redistributive reform currently being trialled by the Labour Administration in Wales, Universal Basic Income (UBI), as an example around which to explore the contextual factors behind people’s policy preferences. Our findings suggest that people’s perception of socioeconomic status (SES), financial distress and exposure to the risk of destitution significantly increase redistributive preferences: those who stand to benefit most from redistribution are indeed aware of their material interests. This is partly mediated by mental distress, which is markedly higher among those who are worse off and in turn predicts greater support for UBI. However, on the other hand, disadvantage also reduces faith in government, which in turn suppresses support for the redistributive policy.
Inequality, mental health and policy preferences
For the past five decades, industrialised countries have been broadly committed to trickle down economic policies that have radically increased inequality (Piketty and Saez, 2014). This shift has been advanced through the justification of absolute societal gains. The UK Conservative Party, in particular, has argued that reducing the tax burden on the wealthy would stimulate economic activity that would incrementally improve the welfare of those in all subsequent strata of society (Thatcher, 1975). Any increase in inequality was justified through reference to any absolute material gain among the worst off on the grounds that such impacts improve the interests and well-being of all members of society. There is evidence that the opposite may be true. Wilkinson and Pickett (2010) provide a substantive overview of the impacts of inequality on society: as inequality rises, crime and social disorder increases and health, among other social goods, decreases. Not only does the distribution of risk increase among particular groups, morbidity and mortality increase overall (Marmot et al., 2020). Marginal absolute gains among the worst off do not mitigate impacts. Indeed, Bartram’s (2022: 2) analysis of 1981–2020 World Values Survey and European Values Study data shows that, despite economic growth over the last 40 years, ‘in wealthy countries increased inequality has a substantial negative impact on life satisfaction, while in poorer countries any effect (positive or negative) is small’. He highlights that UK life satisfaction in 2018 was similar to that during recession-hit 1981 when inequality was much lower (British Sociological Association, 2022).
In the United Kingdom, there is evidence both of higher rates of anxiety and of depression among lower SES groups and bi-directional causality. Not only are conditions affected by SES, but they also affect income (Wilson and Finch, 2020), compounding inequality. We have argued that data from longitudinal studies and some controlled trials of income interventions indicate that the primary driver is income to health (Parra-Mujica et al. 2022). This is likely the case for a large number of other health conditions, but depression is critical given that it has long been suggested as the most costly disease to society (Lecrubier, 2001) and the leading cause of disability worldwide (Bernardi and Johns, 2021). If governments are serious in their ‘prevention’ strategies, there is a genuine need for upstream socioeconomic interventions that address the source of morbidity and broader social pathologies: material inequality.
Evidence on voting participation suggests a political challenge. Those from lower SES groups (Hill and Leighley, 1992) and those with mental health conditions, in particular, are less likely to vote than average (Sund et al., 2017). Ojeda and Pacheco (2017) found that ‘self-rated health is associated with a lower probability of voting in one’s first election’ and ‘depression is related to a decline in turnout over time’. Ojeda (2015) argues that this is because depression reduces motivation by instilling a sense of hopelessness and imposes somatic burdens that reduce capacity for participation. He argues that this creates a political cycle of depression: 1) individuals with depression are unlikely to participate in the political process, 2) the lack of participation leads to underrepresentation and a lack of policies that benefit those with depression, and 3) the lack of beneficial policy outcomes perpetuates the experience of depression. And so it repeats. (Ojeda, 2015: 14)
There is evidence that the clustering of anxiety and depression among lower SES groups has played a significant role in recent electoral outcomes. For example, there is evidence both of association between income and of increased support for ‘Leave’ in the UK’s 2016 Referendum on EU Membership (Stark, 2017) and that psychological traits like anxiety and depression positively predicted support for ‘Leave’ and Trump in 2016 (Obschonka et al., 2018). There are two contrasting explanations for this trend. First, the campaigns focused on increasing control, including by claiming to support particular constituents against competitors for material resources (see, e.g. The Atlantic, 2016). This provides means of mitigating a source of anxiety and depression. Second, Bernardi and Johns (2021) argue that those with depression or depressive traits support the politics of the least upheaval. With regard to Brexit, they argue that there was a shift from pre-referendum support for Remain to post-referendum Leave in order to ‘make the issue go away’ (Bernardi and Johns, 2021). These two explanations highlight a tension in preferences among lower SES voters who are disproportionately affected by anxiety and depression, between increasing control and mitigating unpredictability, since the means of delivering the former require a degree of reform beyond the status quo. The very voters who stand to benefit most from change may have a psychological disposition against the uncertainty bound up with that change.
A second challenge to redistribution is that those from higher SES groups, who are more likely to vote, are less likely to benefit from redistribution and may, in fact, lose out through increased taxation to fund redistribution. Indeed, policymakers, who are much more likely to be well off, fall into this category (see Johnson & Nettle 2020; Dickins, 2020). That is to say, the very people responsible for addressing inequality have a personal interest in not pursuing policies to address it. Evidence on concern for relative gains suggests that this is a crucial consideration: Voters are less likely to support policies that impose a personal net loss to achieve a net gain for others. Moreover, people’s perception of their socioeconomic status and their potential exposure to tax rises means that they may believe that they are at risk of losing out, even when they stand to benefit significantly.
Third, a number of red wall constituencies are older industrial towns (see Mackinnon, 2020). Older voters are more likely to be more secure materially, both by acquiring wealth throughout their working lives and by having access to guaranteed basic income through their pensions. We have shown elsewhere that age and wealth predict the evaluation of UBI Johnson, Johnson et al. (2022).
These challenges mean that politicians often conclude that redistribution is a vote loser. In the United Kingdom, the consequence has been that the present Labour leadership has eschewed radical redistributive policies and focused on New Labour-style technocracy combined with English identity politics. This may assuage concerns about the previous leadership’s ambivalence towards English national identity but leaves open the possibility of much longer term electoral problems. The trend of PASOKification suggests that the more unequal a society becomes, the less likely it is to be able both to function and to support middle-ground parties. This creates a hypothetical downward cycle in which the worst off expand in number, lose faith in government and support right-wing parties. As a consequence, public health diminishes, social disorder increases and the means by which to address the overall trend are reduced by the lack of electoral success among progressive parties.
Elsewhere, we have argued that increased awareness of exposure to the risk of destitution among the population has increased support for equality-promoting measures that enhance security (Nettle et al., 2021). Our findings suggest that UBI, as a radical redistributive measure, has high (~75%) levels of approval both in the United Kingdom and the United States and within ‘red wall’ constituencies (Johnson et al., 2022). Indeed, we have shown that narratives co-designed through adversarial collaboration with opponents of UBI have the capacity to increase support further. Our health modelling of three UBI schemes designed to reduce inequality (we have modelled elsewhere (Reed et al., in press)) indicates that this would have a significant impact on anxiety and depression (Johnson et al., 2022).
Here, we explore the material and sociopsychological bases of ‘red wall’ voters’ assessment of redistributive policies. We assess the relationship between people’s appraisal of UBI as an equality-promoting measure and their basic demographic characteristics, their perception of their socioeconomic status, their perception of the degree to which they control their lives, their faith in government, and their mental health. We examine both support for the idea of UBI in general and support for the more specific schemes we have modelled elsewhere (Reed et al., in press).
Method
Participants and recruitment
We obtained 805 responses from ‘red wall’ constituencies in Wales and the North and Midlands of England between 28 February and 9 March 2022 via prolific.co, a crowd-sourcing platform for psychological and social research. The period was towards the end of COVID-19 restrictions but in the first week of Russia’s invasion of Ukraine. Participants defined their gender as 412 female, 377 male and 14 non-binary or self-described another way. The mean age was 39.27 (SD 13.21). The ‘red wall’ constituencies were identified by the first part of postcodes, which means that a small number of participants may have lived just outside of relevant constituencies. A full list of the constituencies is available at https://doi.org/10.17605/OSF.IO/7GRA2. No quotas were applied during recruitment, but weights were used during analysis (see ‘Data analysis’ section). Participants were paid £5 payment for completion of a 20-minute survey.
Design and measures
Our materials were preregistered and are available at https://doi.org/10.17605/OSF.IO/7GRA2. Responses were made using sliders with a range of 0 to 100 or with discrete Likert-type-style responses where the original source had used this format.
The survey consisted of four sections. Part 1 described UBI as ‘a system in which every adult British citizen would be given a payment each month that meets your basic needs. Unlike current welfare, it is not affected by whether you work or how much money you have. Its supporters come from across the political spectrum’. It then presented one of three 180- to 200-word narratives developed from our previous study (Johnson, Johnson et al., 2022). We categorised these as focusing on (1) flourishing, (2) efficiency and (3) security. The full texts of the narratives can be found in the protocol at https://doi.org/10.17605/OSF.IO/7GRA2. Participants were then asked, on a scale of 0 to 100, to what extent they supported or opposed the introduction of UBI in general.
Part 2 asked respondents to provide details of their net household income, satisfaction with their income, perception that they were managing financially, and self-placement on the MacArthur ladder of subjective socioeconomic status (Adler et al., 2000). Part 2 also contained measures of mental distress: the PHQ-8 (Kroenke and Spitzer, 2002 though removing an item on self-harm for safeguarding reasons), widely used self-report measure of depressive symptoms; the GAD-7 (Spitzer et al., 2006), a measure of generalised anxiety and respondents’ perceived level of control over their circumstances. It also contained six statements probing cynicism about government constructed from common expressions (such as ‘it does not matter which party is in government’). These statements were developed using a similar method to Agger et al. (1961) who identified six popular assertions about the motivation and capacity for the advancement of interests among politicians in the early 1960s and used them to track party political levels of cynicism. Our statements sought to measure participants’ perceptions of similar categories of trust and cynicism, focusing on the motivation of politicians, effectiveness of political processes and outcomes of government policy. This section also contained some measures not analysed here, such as self-rated physical health.
Part 3 presented three specific UBI schemes and asked the respondent to indicate the degree of support for each. The schemes were designed specifically for a UK context to provide pathways to a Minimum Income Standard. They extend from Scheme 1, which is a fiscally neutral starter scheme, to Scheme 3, which is a full MIS-level scheme, with Scheme 2 at the mid-point of the extremes. The schemes have been modelled for tax-welfare outcomes as part of this project (Reed et al., 2022). In this section, respondents were further asked to describe the impact UBI would have on their lives and assess the likelihood of its being implemented. Part 4 asked for basic demographic information (age, gender), previous voting participation and future voting preferences.
Data analysis
Data were analysed in R (R Core Development Team, 2018). Raw data and R scripts are freely available at https://osf.io/2n37u/.
Relative to voting in these constituencies at the 2019 General Election, our sample overrepresented people who voted as compared with not voting, overrepresented Labour voters and underrepresented Conservative voters (Supplemental Table S1). In the statistical analyses that follow, we have therefore applied post-stratification weights that make our sample representative of the constituencies with respect to 2019 voting behaviour. Results are very similar using unweighted responses. Table 1 and figures other than Figure 2 show unweighted data.
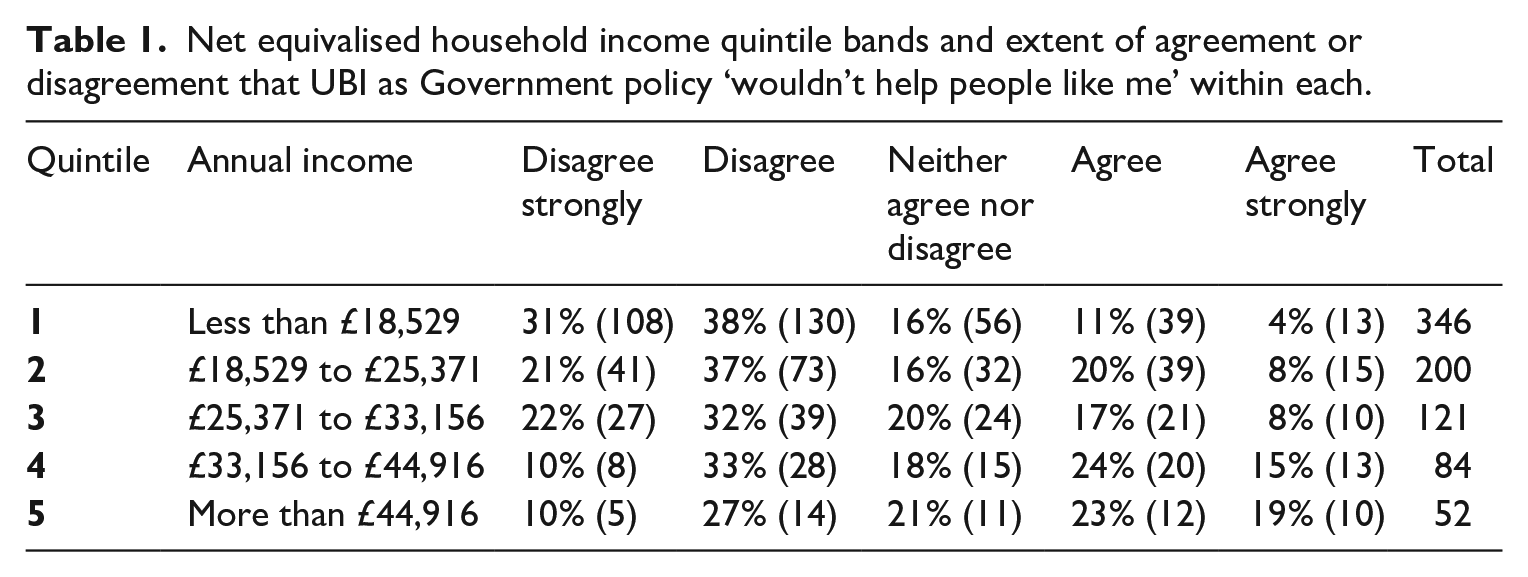
Net equivalised household income quintile bands and extent of agreement or disagreement that UBI as Government policy ‘wouldn’t help people like me’ within each.
Our main outcome variable was overall support for UBI. Although there were significant effects of which narrative was presented on this outcome, these effects did not appear to interact with demographic, socioeconomic or attitudinal factors. Here, our main focus is on the socioeconomic predictors of UBI support and the psychological variables through which they act. In Results section, we therefore present the narrative effects briefly and without extensive discussion.
To understand the factors affecting overall support for UBI, we used structural equation modelling (SEM) in R package ‘lavaan’ (Rosseel, 2012). Briefly, SEM simultaneously estimates (a) latent variables that capture the covariance among our various indicator variables, for example of those of socioeconomic position and mental health and (b) regression relationships between those latent variables and the outcome of interest, here degree of support for UBI. Our model postulated the following latent variables: socioeconomic position, indexed by (logged) equivalised income, satisfaction with income, assessment of whether managing financially and self-placement on the MacArthur SES ladder; mental distress, indexed by the (square-root transformed) PHQ depression score, the (square-root transformed) GAD anxiety score and the sense of being in control of life; and cynicism about government, indexed by the six items described earlier. Our model specified that all three of these latent variables, plus age, could directly influence support for UBI. We further specified that socioeconomic position could have indirect influences on support for UBI via mental distress on the one hand (with mental distress hypothesised to increase support) and cynicism about the government (with cynicism about the government hypothesised to reduce support) on the contrary. Our model allowed for covariances between mental distress and cynicism about government and age and socioeconomic position. We also investigated the levels of support for the three specific schemes, including how age and socioeconomic position affected these.
Results
General support for UBI overall and by narrative treatment
The overall level of support for UBI as a general principle was high, regardless of which narrative was presented (69.45 SD 27.24). Seventy-seven percent of respondents expressed levels of support above the midpoint of the scale (50), and 50% levels of support above 75. There were significant narrative differences (F(2, 800) = 12.83, p < 0.01). The security narrative produced the most support, and the flourishing narrative the least (see Figure 1).
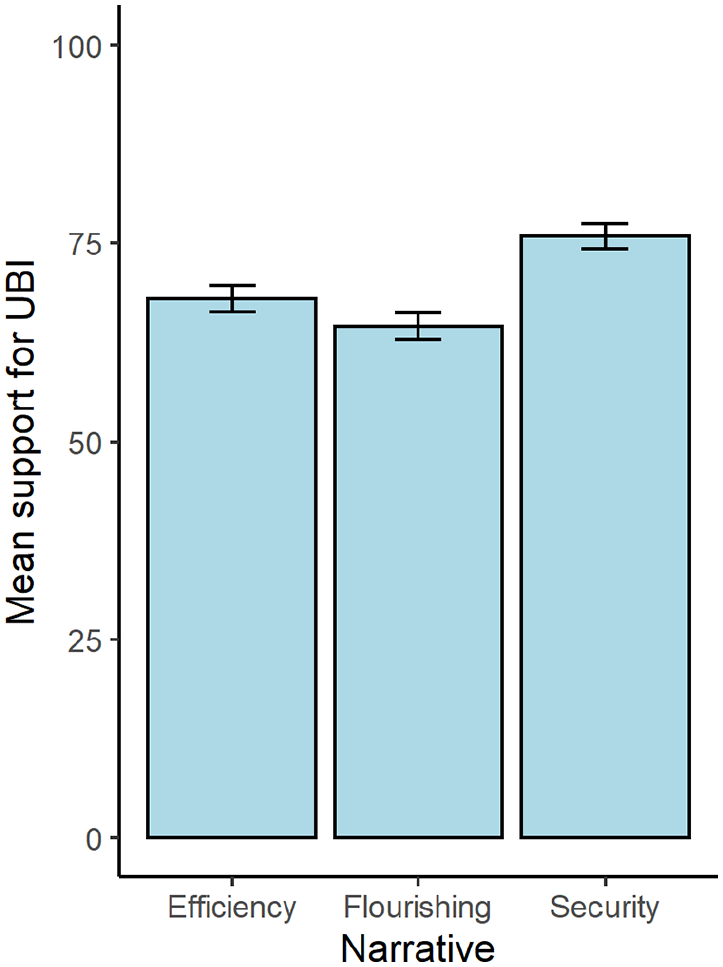
Support for UBI in general (mean ± standard error), by narrative presented.
Factors affecting support for UBI
As discussed in Methods section, we fitted the SEM shown in Figure 2 to the data, collapsing across narrative conditions. The comparative fit index was 0.91; >0.90 is generally taken to indicate adequate model fit (Bentler, 1990). The root mean square error of approximation (RMSEA) statistic was 0.07; <0.05 is generally taken to indicate a very good fit and <0.10 reasonable fit (Fan et al., 1999).
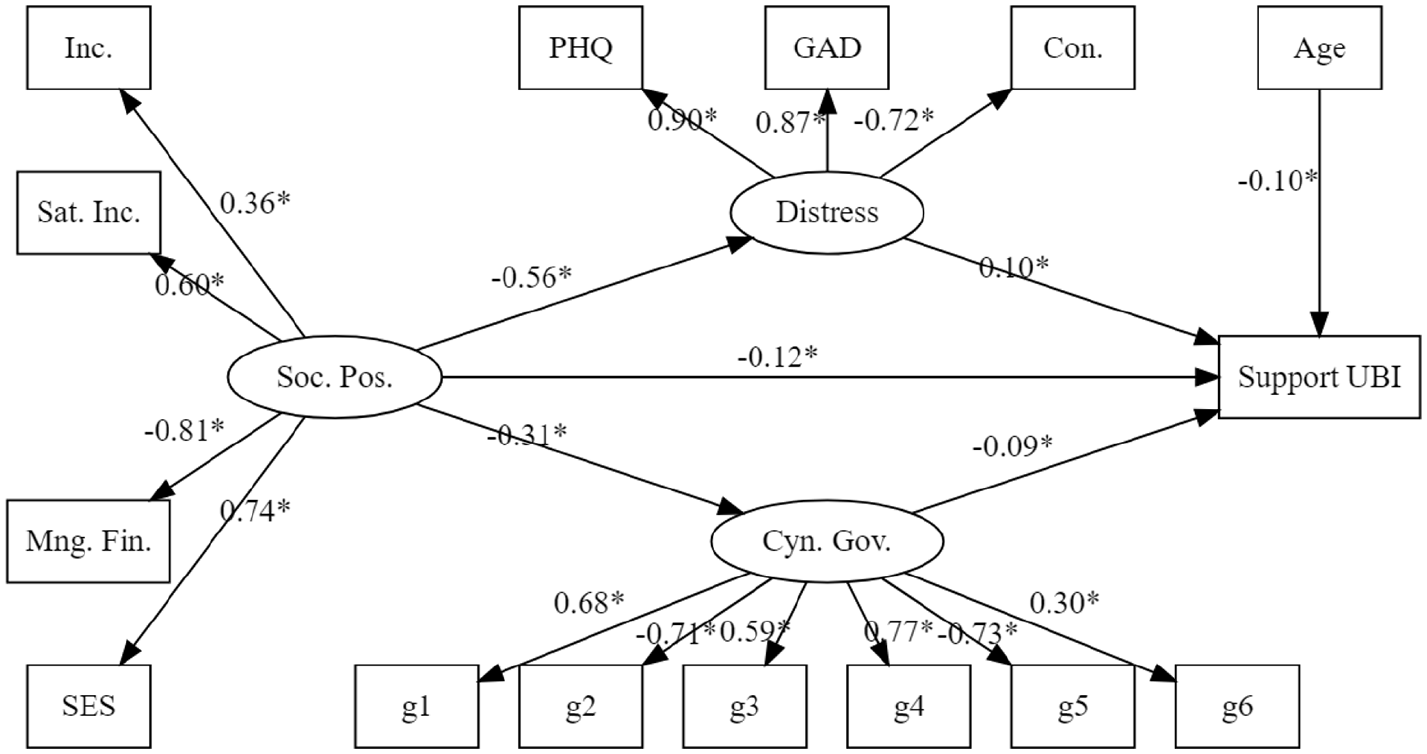
Structural equation model predicting support for UBI. Boxes show measured variables, and ovals inferred latent variables.
Standardised model parameters are shown in Figure 2 (for full model output see Table Sx). Socioeconomic position affected support for UBI via three separate pathways. First, there was a direct pathway, with a weak negative coefficient: lower socioeconomic position leading to greater support. Second, there was an indirect pathway via mental distress: lower socioeconomic position was strongly associated with more mental distress, and more mental distress was weakly associated with greater support for UBI. Finally, there was an indirect pathway via cynicism about the government, with lower socioeconomic position associated with greater cynicism about the government, which in turn weakly reduced support for UBI. Note that this pathway acts in the opposite direction to the other two; lower socioeconomic position decreases support for UBI via its effects on cynicism about government but increases support directly and via its effects on mental distress. There was also a significant association between age and support for UBI (support decreasing with age), independent of the effects of age on socioeconomic position, mental distress and cynicism about the government.
Support for different schemes
The mean support for each of the specific schemes was lower than for UBI in general, with the intermediate Scheme 2 having the highest and the least generous Scheme 1 having the lowest levels of support (Scheme 1: 47.15 SD 27.18; Scheme 2: 58.00 SD 28.59; scheme 3: 55.27 SD 31.47). To examine predictors of support for specific schemes, we created a socioeconomic position variable by extracting the first principal component from income, subjective SES, satisfaction with income and the managing financially response (this variable was therefore conceptually similar to the socioeconomic position variable in Figure 2). We fitted a linear mixed model with scheme, age, socioeconomic position and the interactions between age and scheme and socioeconomic position and scheme. As shown in Figure 3, there were significant main effects of the scheme (F(2, 1870.60) = 16.49, p < 0.01), socioeconomic position (F(1, 869.75) = 6.56, p = 0.01) and age (F(1, 858.91) = 32.22, p < 0.01). There were also significant interactions between scheme and socioeconomic position (F(2, 1870.60) = 4.21, p = 0.01) and scheme and age (F(2, 1870.60) = 4.79, p < 0.01). Figure 3 visualises these patterns. The least generous Scheme 1 was about equally supported across the socioeconomic position spectrum, while Schemes 2 and 3 had markedly higher support among respondents of lower socioeconomic position. All schemes were more highly supported by younger respondents, but this was particularly true for the intermediate Scheme 2.
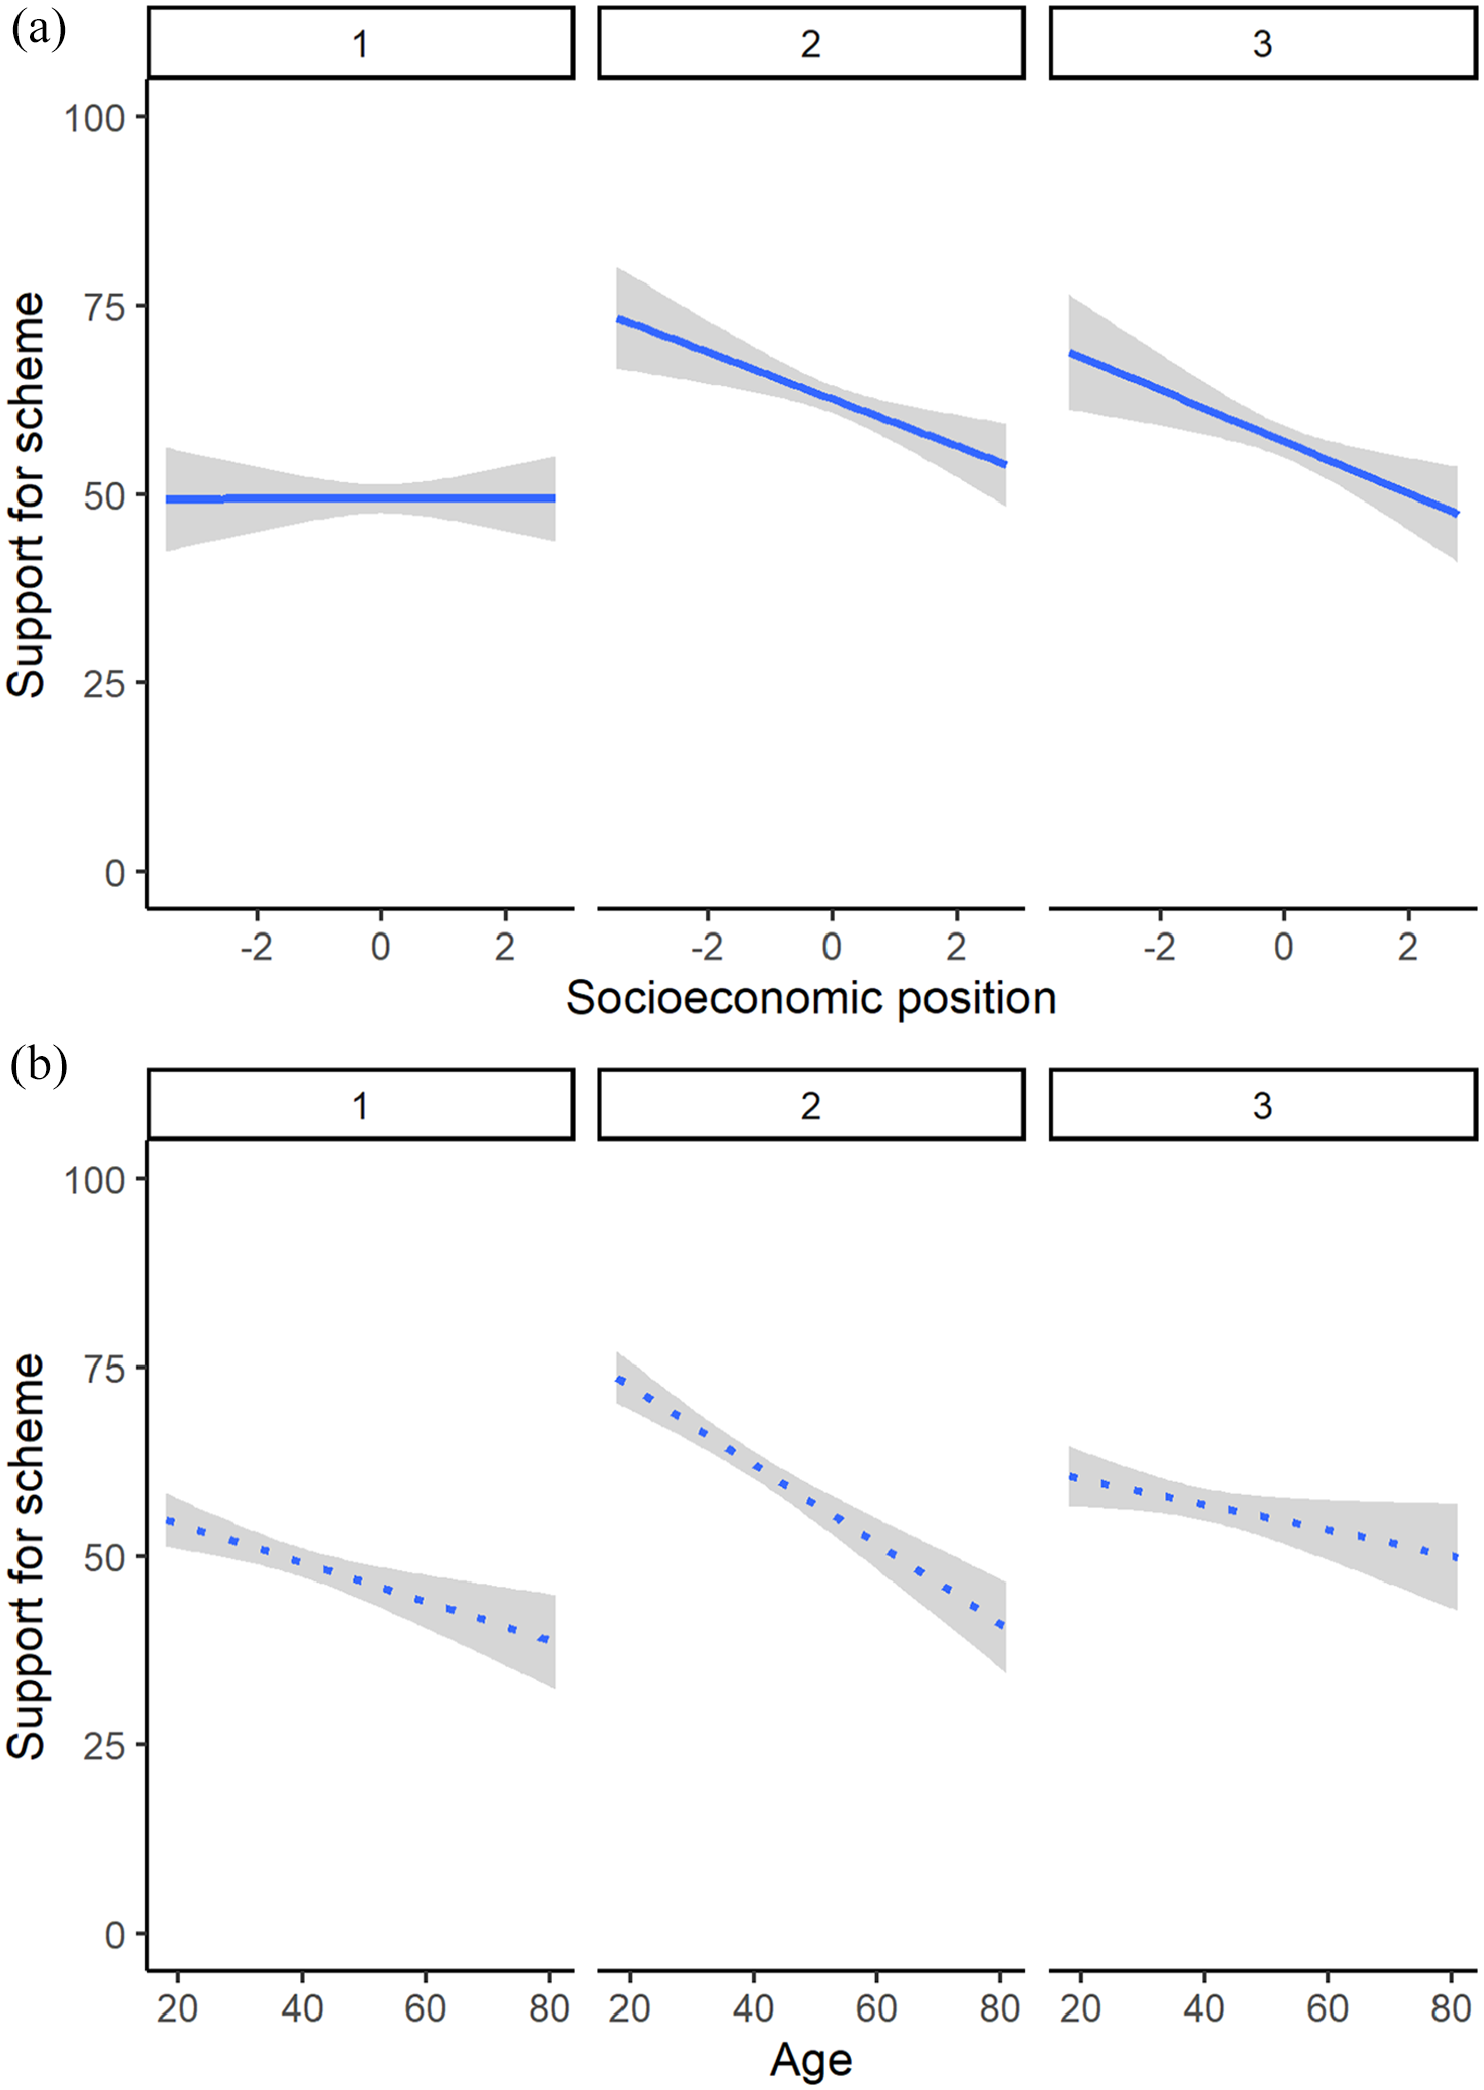
Levels of support by treatment, SES, sense of control and faith in government: (a) Support for scheme by socioeconomic position. (b) Support for scheme by age.
Income and evaluation of benefit
We calculated net equivalised household income quintiles using Family Resources Survey 2019/20 data uprated to 2020/21 (Table 1). We allocated respondents to these quintiles to explore how subjective perception of the impact of UBI on household finances varies with income. Microsimulation indicates that Scheme 1 will raise the disposable income of those in Quintile 1, while Schemes 2 and 3 are likely to raise incomes among all but the higher earners within Quintile 5. We asked respondents to what extent they agreed or disagree with some descriptions of Universal Basic Income as Government policy. Although unweighted figures and only indicative without confidence intervals, Table 1 suggests that those in Quintile 1 may be more likely to disagree that ‘it wouldn’t help people like me’, with disagreement reducing progressively up the quintiles. However, even in Quintile 1, 31% of respondents were not convinced that the scheme would help people like them, choosing neither agree nor disagree, disagree or disagree strongly on the scale. As such, there is evidence of voters erroneously assessing their financial status and the impact of redistributive policies.
This is supported by respondents’ perception of the difference made by their favoured UBI scheme on how well they are managing financially between the present and the future in which the scheme is implemented. As Figure 4 illustrates, only respondents from Quintile 1 perceive mean levels of improvement in condition, although the median in Quintiles 2 and 3 is also positive.
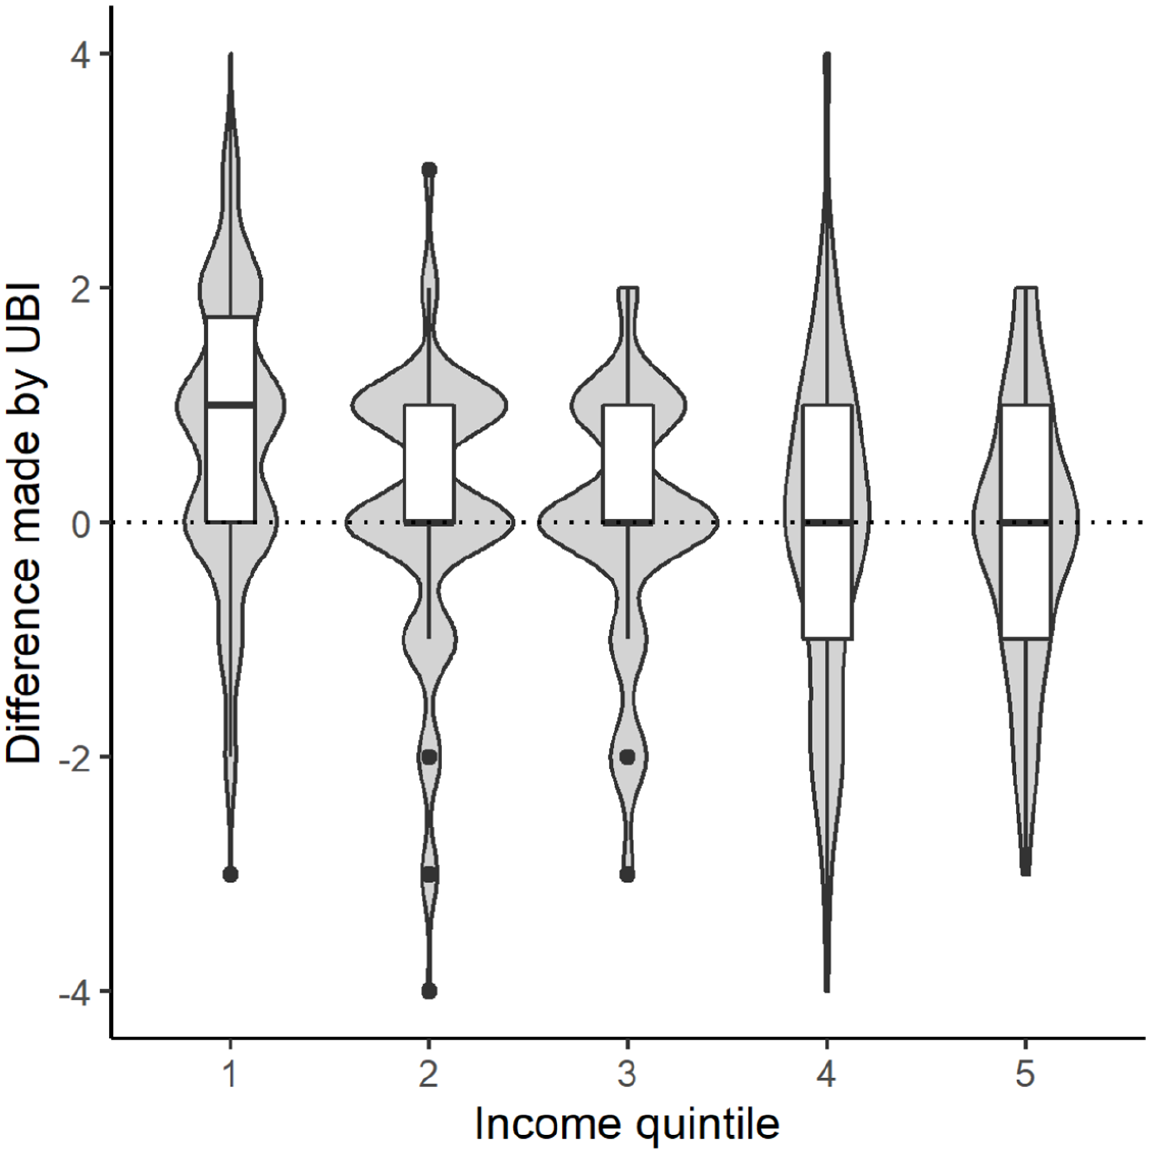
Difference between how I would manage and how I am managing (positive = I would manage better), by income quintile.
To understand the part played by the perception of subjective socioeconomic status on the assessment of impact from welfare schemes, we then compared their self-positioning on the 10-step MacArthur ladder to their income quintile. As Figure 5 illustrates only in the lowest income quintile did the median response fall below 6.
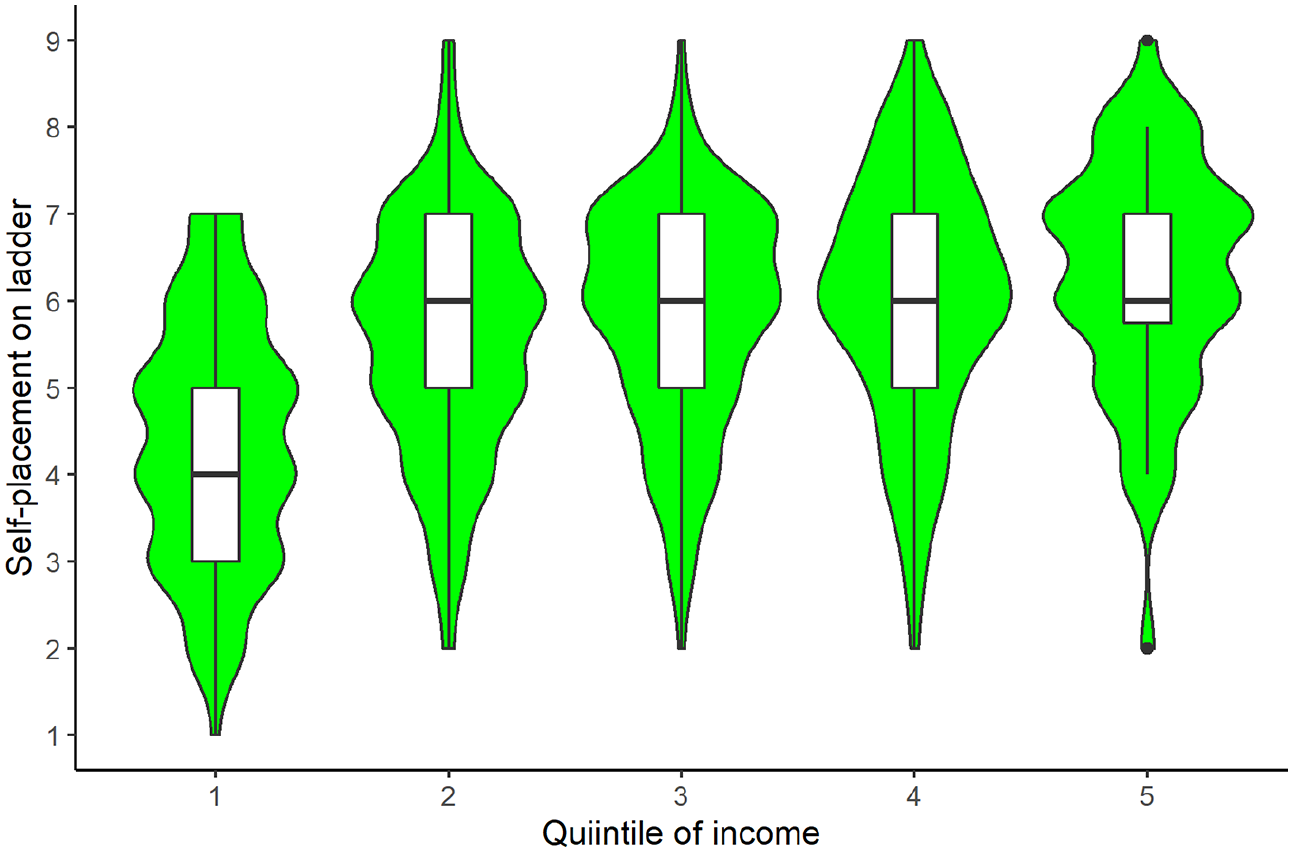
Comparison of individuals’ perception of their position within their community by placement on the MacArthur ladder and their quintile of income.
Discussion
Summary of results
We briefly re-summarise our key findings before turning to their interpretation and the political challenges and opportunities they present. First, in our sample of ‘red wall’ voters, support for a UBI was extremely high. This concurs with previous findings (Johnson et al., 2022) but stands in stark contrast to the perceived social conservatism and recent Conservative majorities in many of these constituencies. We also found more generous schemes were rather more strongly supported than a minimal one.
Second, we find that greater socioeconomic disadvantage predicts stronger support for UBI (and, specifically, for more generous schemes rather than less generous ones). Part of this association is mediated by psychological distress (depression, anxiety and lack of perceived control). There were strikingly strong associations in our data between socioeconomic disadvantage and psychological distress. Greater psychological distress in turn increased support for UBI. Thus, material disadvantage produces motivation for progressive socioeconomic policies in part via the means of causing mental suffering, mental suffering that people presumably wish to alleviate via political means. However, greater disadvantage also promoted cynicism about the government, perhaps because the failure of the government and politicians is partly blamed for the extent of the disadvantage in the first place. Greater cynicism about government in turn was associated with reduced support for UBI, presumably because people appraise that progressive policy implemented by incompetent or corrupt politicians would be ineffective or worse. This is the potential ‘downward spiral’ of our title: increasing inequality, far from making the disadvantaged swing their support behind progressive platforms to counteract it, can promote cynicism and withdrawal from progressive commitment, allowing policies that increase inequality further to be implemented and so on. In our data, this negative pathway via cynicism about government was more than offset by the propensity of greater disadvantage to increase support for the progressive policy; but this may not always be the case.
Third, we found that most people did not consider that UBI would help them personally in a financial sense, even many in the lowest socioeconomic groups. This may stem from people’s overestimation of their relative socioeconomic position, a point we discuss further below.
Income, socioeconomic status and anxiety and depression
The strong correlations between anxiety and depression and between both conditions and socioeconomic position supports recent attempts to reframe these experiences less as brain diseases, or distortions of faulty individual cognition, but more as distinctive reactions to real social determinants (Davies, 2021). The political implications of these experiences have scarcely been explored. However, our finding of a pathway from psychological distress to support for UBI, albeit a weak one, suggests these experiences can find expression in support for political action. The finding that perception of control is correlated with perception of socioeconomic status supports the notion of society mattering in ways that neoliberal economists dismiss. Although the law protects individuals’ negative liberty by prohibiting physical coercion, individuals experience a diminution in a sense of control in ways that correlate with their perception of socioeconomic status. We have argued elsewhere that positions within hierarchies determine capacity for domination – the ability of individuals to make decisions that affect our fundamental interests without reference to the importance of those interests to us (Johnson and Johnson, 2019). Those individuals need not actually make those decisions; the capacity itself induces a sense of powerlessness and psychological stress. It is important to emphasise that the experience of domination extends upwards beyond the lowest rungs of the ladder in the MacArthur scale. Given that the socioeconomic conditions of the constituencies within our sample are lower than the national average, this may explain the high numbers of those perceiving low levels of control within our sample.
Evaluation of different schemes
We have suggested elsewhere (JJohnson, ohnson et al., 2022; Nettle et al. 2021) that the pandemic increased opposition to austerity measures and increased support for redistributive measures that reduce exposure to risk. The present findings endorse this trend. Support was lowest for Scheme 1, which retained the complexity of the present welfare system but offered partial supplements through a small universal payment. Support was higher for the full MIS scheme, which offered full protection for individuals and eliminated most conditional benefits. The most popular scheme was the intermediate scheme. Were individuals concerned solely with fiscal and monetary restraint, there would have been a linear appraisal in reverse numerical order. In our results, Scheme 1 was unique insofar as support was consistent across age groups. Older participants were fairly consistent in their rating of the Schemes. This may be because they are already in receipt or close to receipt of age-conditional basic income of comparable size to the payments. Scheme 2 and Scheme 3 differ insofar as support is much higher among younger participants. This may be cause the schemes benefit a much broader body of the population much more clearly, granting more generous support to those dependent upon work for the satisfaction of their needs. We have highlighted the importance of relative gains previously. There is more evidence of that impact here. Scheme 1 may be regarded solely as supporting the least well off – externalised ‘others’ with whom there is little expectation of reciprocity. This is a particular deficit in the scheme since the large number of conditions attached to payment render it much less appealing to those in work, who may view the payment as inadequate.
Vitally, this externalisation leaves the scheme open to precisely the same objections as Universal Credit and other needs- and means-based payments: as something for ‘others’ to be progressively diminished as those in work experience greater financial distress. Fiscal responsibility may not be the salient consideration for voters in this regard. In contrast, Schemes 2 and 3 may be perceived as benefitting participants specifically as an in-group. Again, this supports the notion that progressive politicians have a good reason for adopting schemes that are grand in their formulation specifically because they benefit those more likely to vote. Scheme 2 may be more popular than 3 because it is the intermediate scheme and was perceived as a reasonable compromise.
Mean levels of support versus perception of impact
As mentioned at the beginning of the Discussion, although levels of support were consistently high, there was a significant discrepancy between participants’ rating of the policy and their perception of impact. Such high levels of approval would seem to be dependent upon voters believing that the policy would make a significant impact on the sources of their financial distress and associated psychological conditions. However, the data presented here suggest a significant discrepancy: People appear to be aware of their financial distress, but underestimate the impact of a significant cash transfer on their affairs. This may be due to individuals misidentifying the intended beneficiaries of UBI or erroneously regarding those recipients as an out-group. This suggestion finds support in both the belief among the majority of Quintiles 3 to 5 and significant numbers of Quintiles 1 and 2 that UBI would be of little or no benefit to their personal finances and the consistency of responses to the MacArthur ladder in Quintiles 2 to 5. If people believe, subjectively, that they are above average position within a hierarchy and that welfare schemes are designed specifically to benefit the destitute, then they may regard the scheme as of abstract relevance or of benefit to others. This represents a challenge of narrative: this is a policy designed specifically to benefit the majority of voters directly by redistributing resources and by providing social security. Its universality provides additional value beyond needs- and means-based schemes by providing scope for its being regarded as an in-group benefit, as in the case of Pensions and, formerly, Child Benefit.
This issue speaks to the concept of egotropic versus communotropic voters (McKay et al., 2021), with the former prioritising benefit for their own circumstances and the latter benefit their community. There is evidence from the EU referendum that this is not as strict a dichotomy as might be expected, as the gap between support for leave among graduates and those with General Certificate of Secondary Education (GCSEs) in low-skilled areas was half that in high-skilled areas (Goodwin and Heath, 2016). These two drivers of voting intention are likely, therefore, to interact in ways that result in differences in associations in the ‘red wall’ compared with other, more affluent, areas.
More broadly, we are unable to say how generalisable the patterns described in this article are beyond the red wall or beyond the United Kingdom. They are however suggestive.
The political challenge
Even given these particular issues of comprehension, mean levels of support for UBI remain historically high, especially in comparison with other welfare or health policies (e.g. Health Foundation, 2022: 56; YouGov, 2022). This finding, which has been repeated in several similar studies, emphasises the extent to which voters are aware of the need for upstream interventions to mitigate risk. Even if individuals do not immediately regard themselves as personal beneficiaries, they broadly regard the policy as being of value. This is significant for progressive politicians seeking support in ‘left behind’ communities.
People with low levels of control have higher levels of support for our example redistributive policy. This is at odds with claims of insurmountable social conservatism in ‘red wall’ constituencies. People want more control over their lives and recognise that redistribution in the form of secure, predictable income can increase it. However, those who perceive low levels of control also have less faith in the government. Having more faith in government is associated with increased support for our redistributive measure. As such, it may be that even though individuals recognise the need for the policy, they may not be persuaded to vote by virtue of a lack of faith in the government’s capacity to improve their interests. Moreover, the literature on the desire of those with anxiety and depression to avoid upheaval and uncertainty presents opponents of progressive change with the capacity to suppress support. This is a common and effective tactic among centre-right and right-wing politicians, with claims of ‘chaos with Ed Miliband’ in 2015 and a ‘Coalition of chaos’ between Labour and the SNP in 2017 both deployed to some success, although the outcome was upheaval through the Brexit referendum in 2016 and the subsequent internal conflict within Government during the Conservative minority administration of 2017–2019. Progressive politicians therefore face the dual challenges of having to present policies capable of increasing control while resisting claims from opponents that such measures will lead to uncertainty and unpredictability.
This is particularly problematic in the United Kingdom, in which progressive parties have been out of Government for over a decade and are still associated with the Global Financial Crisis of 2007/2008 and underplaying the scale and impact of migration, both of which have lingering impacts in ‘red wall’ constituencies. However, there is little reason to suppose that not offering change on the basis that voters seek continuity and technocratic competence is not feasible: progressive politicians’ views of their historical records may not be the same as those of voters. As such, politicians need to emphasise both that the present system is chaotic and that redistribution is the means of reducing uncertainty.
This leaves the question of funding. At a time of a cost of living crisis, any increase in income tax to pay for schemes is likely to be problematic, not least because people may not understand rates of marginal taxation and their exposure to any increases. As such, there are two tactical options that require examination: first, externalising costs through land and wealth taxes in ways that a majority of voters view as beneficially redistributive; second, by being less concerned with fiscal neutrality. A decade of rising public debt and historically significant investments to pay for covid-19 mitigation measures has been associated with few clear consequences in day-to-day lives. The public may be less concerned about abstract debt considerations and achieving static fiscal neutrality than they were in 2010. As the ‘Levelling up’ agenda indicates, there is scope for narratives of investment and growth out of crisis.
Crucially, there is growing evidence that perceptions of Government spending and what defines ‘unaffordability’ have shifted due to the pandemic (Nettle et al., 2021) and now the cost-of-living crisis. For example, the Labour Party leadership recently committed to freezing the energy price cap at a cost of £29bn over 6 months (Labour Party, 2022). Rather than undercutting their support due to fears they previously harboured about losing their carefully curated position of ‘fiscal responsibility’, the policy attracted levels of support that had previously been entirely out of reach for the party under Keir Starmer. An Opinium poll for 38 Degrees (2022) found that 85% of 2019 Conservative voters (86% overall) support the policy. Further, 72% of Conservative voters (73% overall) back temporarily nationalising energy companies if they cannot contain bills at their current levels, supporting a policy initially outlined by Gordon Brown. In contrast with the subsequent approach that the Conservatives have taken under Liz Truss, which included a vastly more costly freezing of energy prices for homes and businesses at around £2,500 per year for 2 years (Thomas, 2022), 71% of Conservative voters agreed that windfall taxes on energy companies and bankers’ bonuses should be used to fund extra support measures. Given concerns about environmental breakdown and conflict in Europe, crisis conditions are likely to be far more persistent than in previous eras. UBI may, therefore, be far more salient in future elections than it has in the past, and more politically feasible given the lack of alternatives at the scale of intervention required.
Conclusion
This article highlights pathways through to the delivery of progressive public policy. Politicians need both to recognise voters’ need for greater control and belief in the ability of policies to reduce uncertainty and unpredictability. The current balance pursued by progressive politicians between attractiveness and plausibility may require rethinking. Those on the right have successfully promoted ‘grand schemes’ that are sufficiently attractive in their promising improvement in material conditions as to override voters’ concerns about uncertainty and unpredictability. Progressive politicians have, in redistributive policies such as UBI, schemes that can attract voters and deliver greater control, certainty and predictability. The example of the Welsh Government, which is gaining support after years in office, ought to be instructive to progressive politicians grappling with ‘red wall’ strategy – Labour, in particular, can only be successful insofar as it is committed to transforming lives. The evidence presented here and elsewhere suggests that redistributive policies, properly framed and narrated, have the capacity to persuade voters. The outstanding question is whether politicians can be persuaded to change direction on that basis.
Supplemental Material
sj-docx-1-bpi-10.1177_13691481221146886 – Supplemental material for Can the ‘downward spiral’ of material conditions, mental health and faith in government be stopped? Evidence from surveys in ‘red wall’ constituencies
Supplemental material, sj-docx-1-bpi-10.1177_13691481221146886 for Can the ‘downward spiral’ of material conditions, mental health and faith in government be stopped? Evidence from surveys in ‘red wall’ constituencies by Matthew T Johnson, Elliott Aidan Johnson, Howard Reed and Daniel Nettle in The British Journal of Politics and International Relations
Footnotes
Ethical approval
This research was approved by the Faculty of Medical Sciences ethics committee, Newcastle University.
Funding
The author(s) disclosed receipt of the following financial support for the research, authorship, and/or publication of this article: This work was supported by the Wellcome Trust under Grant 223553/Z/21/Z. For the purpose of open access, the author has applied a CC BY public copyright licence to any Author Accepted Manuscript version arising from this submission
Supplementary information
Additional supplementary information may be found with the online version of this article.
Content
Table S1: Structural equation model output for the model shown in ![]() .
.
References
Supplementary Material
Please find the following supplemental material available below.
For Open Access articles published under a Creative Commons License, all supplemental material carries the same license as the article it is associated with.
For non-Open Access articles published, all supplemental material carries a non-exclusive license, and permission requests for re-use of supplemental material or any part of supplemental material shall be sent directly to the copyright owner as specified in the copyright notice associated with the article.