
Abstract
Women and underrepresented minoritized (URM) persons remain marginalized in physical science, technology, engineering, and math (pSTEM). Relative to non-URM men, URM women may experience a double disadvantage based on their gender and race whereby they observe few same-gender and few same-race role models in pSTEM while additionally internalizing stereotypes linking pSTEM with non-URM men. Our hypothesized model was partly supported in a sample of undergraduates (N = 1,068; 68% women, 44% URM). First, perceiving same-gender or same-race pSTEM role models predicted lower explicit stereotypes among women and URM individuals regarding gender and race, respectively. Second, explicit and implicit associations linking pSTEM with men and White/Asian persons predicted (a) lower pSTEM identity among women and URM students and (b) higher identity among men and non-URM students. Finally, both implicit and explicit pSTEM identity positively predicted expectancy–value beliefs.
Careers in physical sciences, technology, engineering, and math (pSTEM) are some of the most well paid and fastest growing jobs in the US (National Science Foundation [NSF], 2021). However, large gender and racial/ethnic gaps persist in these fields. For example, only 16% of women and 20% of Black and Latinx Americans work in pSTEM careers, compared to 35% of men and 33% of Asian and White Americans (NSF, 2021). Addressing these gaps is important for advancing social and economic equality, promoting the talents of all members of society, and diversifying the perspectives represented in pSTEM fields. Accordingly, extensive research conducted in recent decades has documented multiple factors that contribute to these achievement gaps. Among them are the negative gender and racial/ethnic stereotypes in the US that link pSTEM with being male (vs. female) and being White or Asian (vs. Latinx, Black, or Indigenous; e.g., Archer et al., 2015; Evans et al., 2011). In the present study, we tested whether endorsement of both explicit and implicit stereotypes predicted U.S. undergraduate students’ pSTEM belonging and motivational beliefs. In addition, we tested these effects separately based on the students’ gender (self-identified women compared to men) and underrepresented minoritized status (URM; self-identified Latinx, Black, or Indigenous compared to White or Asian). We additionally considered whether exposure to same-gender or same-race pSTEM role models predicted implicit or explicit stereotypes.
pSTEM Motivational Beliefs and Identity: Do I Belong?
According to situated expectancy–value theory (Eccles & Wigfield, 2020), motivational beliefs comprise two components: expectancy and value beliefs. Expectancy beliefs refer to one’s ability self-concepts and expectations for success in a given subject. Value beliefs regarding a given subject are based on interest and the importance of doing well (intrinsic value) and the subject’s perceived usefulness now and in the future (utility value). Extensive research has demonstrated that expectancy and value beliefs about a subject predict later career-related choices and achievement, such as enrolling in advanced coursework and persistence (see Guo et al., 2015; Schoon & Eccles, 2014; Watt, 2006). Thus, it is notable that there have been average gender differences in pSTEM motivational beliefs. In prior research, girls and women tended to demonstrate lower motivational beliefs about math and other STEM subjects relative to boys and men (e.g., Eccles & Wang, 2016). Fewer studies have tested for racial/ethnic differences in STEM-related motivational beliefs. In one investigation, Black and Latinx youth tended to have lower math expectancies compared to their White and Asian peers (Andersen & Ward, 2014); however, no significant differences were indicated in another study (Else-Quest et al., 2013).
According to the situated expectancy–value theory model, people’s identities can influence their motivational beliefs. This premise is further articulated in balanced identity theory (Cvencek et al., 2012; Greenwald et al., 2002), which posits that people pursue congruence between their group identities, group stereotypes, and self-concepts. Individuals gain a sense of belonging when they view themselves matching the stereotypes or prototypes for a given group identity—such as people in pSTEM. Thus, if someone associates people belonging in pSTEM as being from a different gender or racial/ethnic group, they may become less likely to identify with pSTEM (Kessels et al., 2014; Leaper, 2015; Master et al., 2016; Starr & Leaper, 2019). That is, they may not perceive themselves as typical or belonging with other persons in pSTEM. In turn, this may negatively affect their pSTEM motivation (Jones et al., 2013; London et al., 2011; Rosenthal et al., 2011). Conversely, ingroup identification with pSTEM may bolster students’ motivation (Cohen & Garcia, 2008; Starr et al., 2020).
Stereotype threat theory similarly posits that people perform worse in academic tasks when they feel threatened by negative stereotypes about their ingroup’s competencies in that subject (Steele, 2010). Studies investigating stereotype threat (or stereotype identity threat) in academic settings have found that women and URM people experience stereotype threat significantly more often than men and non-URM persons in STEM, leading to negative impacts such as lower feelings of belonging (e.g., Cromley et al., 2013). In the present study, we did not directly test stereotype threat effects. However, related to the premises of this approach, we looked at students’ felt typicality with persons in pSTEM to infer their sense of belonging (for similar approaches, see Cheryan et al., 2020; Martin-Hansen, 2018; Starr et al., 2020).
In summary, our study investigated possible predictors of undergraduates’ pSTEM identity (felt typicality) and pSTEM motivational beliefs (expectancy and value). As reviewed next, we tested a model whereby perceived same-gender and same-race role models in pSTEM would predict students’ likelihood of holding gender- and race-based stereotyped associations that persons in pSTEM are male and White/Asian. In turn, we hypothesized holding these stereotypes would predict pSTEM identity (felt typicality with pSTEM) and motivational beliefs. We also examined stereotyped associations and pSTEM identity using both implicit and explicit measures. Before reviewing the potential impact of role models, we first consider how stereotyped associations might affect students’ pSTEM motivational beliefs.
Explicit and Implicit Associations of Gender and Race With pSTEM: Who Does pSTEM?
According to the situated expectancy–value theory model, the cultural milieu shapes people’s expectancy and value beliefs (Eccles & Wigfield, 2020). Cultural stereotypes about people working in pSTEM may influence whether a person identifies with these fields and, in turn, influence their expectancy and value beliefs (Eccles & Wigfield, 2020; Starr, 2018). Notably, there are widespread stereotyped views of successful persons in pSTEM as White or Asian men, which appear related to average gender and race/ethnic differences in motivational beliefs and achievement in pSTEM (e.g., Hsieh et al., 2021; Schoon & Eccles, 2014).
When investigating the potential impact of pSTEM stereotyping, researchers have considered both implicit and explicit measures of people’s associations of gender with science or math (e.g., Nosek et al., 2009; Smyth & Nosek, 2015). Explicit stereotypes are directly assessed by asking participants about their views (Cvencek, Meltzoff, et al., 2021). In contrast, implicit associations are indirectly assessed via the Implicit Association Test (IAT; Greenwald & Lai, 2020). Implicit associations are formed unconsciously through repeated observations in a culture— as, for example, when individuals are disproportionally exposed to men as scientists in a society. In some cases, individuals’ implicit associations may conflict with their explicit stereotypes (Cvencek, Meltzoff, et al., 2021; Passolunghi et al., 2014). Also, because of their unconscious nature, implicit associations may be less prone to social desirability bias (Cvencek, Kapur, & Meltzoff, 2015). Possibly for these reasons, prior research indicated implicit measures added predictive power beyond explicit measures in predicting various pSTEM outcomes (Cvencek, Meltzoff, et al., 2021; Farrell & McHugh, 2020; Starr, 2018; Steffens et al., 2010).
Many people explicitly view pSTEM as a male domain (e.g., Carli et al., 2016; Kuchynka et al., 2018; Picho et al., 2013; Smyth & Nosek, 2015; Starr & Simpkins, 2021) and as a White or Asian domain (Burnett et al., 2020; Cvencek, Kapur, & Meltzoff, 2015; Evans et al., 2011; Rowley et al., 2007). In a similar manner, many individuals implicitly associate STEM with men (e.g., Farrell & McHugh, 2020; Nosek et al., 2009; Smyth & Nosek, 2015). Although little work has examined implicit race–pSTEM associations, at least one study reported a tendency for people to associate STEM with Asian people (Cvencek, Nasir, et al., 2015).
There is ample research suggesting that both explicit and implicit associations between gender and pSTEM are related to pSTEM motivation. Cross-national studies of adolescents and adults discovered that both implicit and explicit associations of gender with pSTEM-related fields were related to motivational beliefs and sense of belonging (Block et al., 2018; Cvencek, Kapur, & Meltzoff, 2015; Cvencek et al., 2011; Dunlap & Barth, 2019; Gilbert et al., 2015; Kiefer & Sekaquaptewa, 2007; Nosek & Smyth, 2011). Researchers also found that gender stereotypes correlated with achievement outcomes in pSTEM-related subjects (Nosek et al., 2009; Steffens & Jelenec, 2011; Steffens et al., 2010). Less research has investigated similar relations between race stereotypes and pSTEM motivational beliefs or identity. However, research on stereotype threat has found that underrepresented minoritized students’ performance in math and science subjects was negatively affected when primed about intellectual ability prior to assessments (for a review, see Nguyen & Ryan, 2008; Shewach et al., 2019).
Students’ pSTEM identity may act as a mediator between stereotypes and pSTEM motivational beliefs. For example, researchers found that explicit or implicit pSTEM identity mediated links from implicit associations and explicit stereotypes to pSTEM expectancy and value beliefs (Starr, 2018), pSTEM confidence (Cundiff et al., 2013), and STEM major selection (Dunlap & Barth, 2019). Research suggests analogous patterns regarding pSTEM identity as a mediator of associations between race-based stereotypes and pSTEM motivational beliefs (e.g., Cvencek, Nasir, et al., 2015; Rowley et al., 2007). It is potentially revealing to explore the relative contribution of both implicit and explicit identity, as they each often explain unique variance and may relate to predictors and outcomes differently (Cvencek, Brečić, et al., 2021). Thus, in the present research, we considered implicit and explicit stereotypes regarding pSTEM and both gender and race as possible predictors of both implicit and explicit pSTEM identity and pSTEM motivational beliefs.
Role Models: If You See It, Can You Be It?
Whereas cultural stereotypes can bias individuals’ views about pSTEM, these partly depend on the messages inferred from popular media (Eccles & Wigfield, 2020). Exposure to exemplars of an underrepresented group has been found to decrease implicit and explicit negative stereotypes (e.g., Gawronski & Bodenhausen, 2006). For example, multiple studies following Barack Obama’s election in the 2008 U.S. presidential election found a general decrease in implicit negative stereotypes about African Americans (Bernstein et al., 2010; Plant et al., 2009; Roos et al., 2013; but also see FitzGerald et al., 2019).
Research suggests that observing same-gender or same-race role models in pSTEM may reduce corresponding gender and race stereotypes about these fields for women and URM people, respectively. Experiencing ingroup role models (gender and/or race) predicted lower stereotyping or stereotype threat (Hernandez et al., 2017; Marx & Ko, 2011; Shin et al., 2016; Starr et al., 2019; van Camp et al., 2019). Additionally, prior research has found stronger feelings of belonging, identity, and motivation beliefs when students experienced ingroup role models (for reviews, see Casad et al., 2018; Lawner et al., 2019). This included same-gender role models (e.g., Merritt et al., 2021; Solanki & Xu, 2018; Stout et al., 2011) or same-race role models (e.g., Johnson et al., 2019; Murray et al., 2009) or both (Pietri et al., 2020). Moreover, a cross-national study of country-level variations in women’s representation in STEM indicated adolescent girls’ math self-concepts were higher in countries with greater gender diversity in STEM (Niepel et al., 2019). Thus, we tested whether students’ reported observations of same-gender and same-race models would predict lower implicit and explicit gender- and race-based stereotypes about pSTEM, respectively. Our measure of ingroup pSTEM models included people observed in person (e.g., teachers) or through popular media (e.g., TV shows). In turn, we postulated that gender and race stereotypes would predict implicit and explicit pSTEM identity—with negative relations for women and URM individuals, respectively; and positive relations for men and non-URM individuals, respectively.
Intersection of Gender and Racial/Ethnic Identities: Dual Advantages or Disadvantages?
A notable feature of the present research was its consideration of both gender and race in relation to participants’ role models and stereotyped associations. Most prior studies examining stereotyping, identity, and pSTEM domains have focused on either gender or race/ethnicity (e.g., Cvencek, Kapur, & Meltzoff, 2015; Cvencek, Nasir, et al., 2015; Starr, 2018). Given the unique barriers women of color may face in pSTEM, it is important to investigate potential group differences and similarities by both gender and race. According to the intersectional framework (e.g., Cho et al., 2013; Mays & Ghavami, 2018), the combination of different identities like gender and race may differentially undermine or advantage students in complex ways. First, underrepresented minoritized women may be least likely to observe pSTEM role models that reflect both their gender and race/ethnicity. Second, the combined effects of gender- and race-based cultural stereotypes about pSTEM may further disadvantage them. Hence, Black and Latinx women may experience a double disadvantage based on their gender and race that leads to a lower sense of pSTEM identity and motivation. In contrast, the available role models and the cultural stereotypes may advantage White and Asian men based on the combination of their gender and race (e.g., Blustein et al., 2013; Koch et al., 2019; Simpkins et al., 2015; Tao et al., 2020).
Several studies have explored explicit stereotypes regarding both race/ethnicity and gender. They generally indicated that people stereotyped girls/women and URM students as less competent or qualified in pSTEM-related subjects (Eaton et al., 2020; Evans et al., 2011; Rowley et al., 2007). To our knowledge, no study to date has explored either both same-race and same-gender role models or implicit associations about both race and gender regarding pSTEM domains.
The Current Study
The present study adds to the current literature in three ways. First, we simultaneously focus on how both race and gender relate to the experiences of students in pSTEM. Our sample comprised over 1,000 undergraduate students with similar numbers of women and men from underrepresented minoritized (URM) and non-URM backgrounds. Second, we assessed participants’ experiences observing same-gender or same-race models in pSTEM. And third, we included both explicit and implicit measures of gender and race stereotypes as well as pSTEM identity. As described in what follows, we tested two sets of hypotheses.
We first tested possible average group differences based on students’ gender and URM status. We predicted that women and URM students would have significantly lower exposure to same-gender and same-race role models in pSTEM when compared to men and non-URM students, respectively. Additionally, we hypothesized women and URM students would have significantly lower explicit and implicit pSTEM identity and motivation.
Next, we tested our hypothesized path model linking observed pSTEM role models, pSTEM stereotypes, pSTEM identity, and pSTEM motivational beliefs as follows:
(a) Exposure to same-gender and same-race role models in pSTEM would significantly predict gender- and race-based implicit/explicit associations with pSTEM. The positive or negative direction would be moderated by gender and URM group membership (e.g., observing same-gender role models and associating pSTEM with males would be negatively related among women and positively related among men).
(b) Race- or gender-based implicit and explicit stereotyped associations with pSTEM would be significantly related to pSTEM implicit and explicit identity. When pSTEM was associated with either men or non-URM persons, we hypothesized a relatively greater disadvantage for URM women and a relatively greater advantage for non-URM men.
(c) Students’ pSTEM identity would significantly predict pSTEM motivational beliefs (expectancy and value).
(d) Finally, implicit and explicit pSTEM stereotyped associations would have an indirect effect on motivational beliefs via pSTEM identity.
Method
Participants
Undergraduates were recruited from introductory psychology courses at a large public university in Northern California. They were given research participation credit in their psychology course. The initial sample comprised 1,113 students. Given the present study’s focus, we dropped those who either did not indicate their gender or identified as gender-nonbinary or agender. In addition, we dropped another 16 participants due to missing two or more full scales or IATs. Analysis of the patterns of missing data in the remaining sample revealed that less than 1% of all items for all cases were missing, and 99.43% of the items were not missing data for any case. Considering individual cases, 85% of participants had no missing data. The most common items to be missing were IAT (gender, race, or self) data. IATs were missing due to the data being excluded because they did not meet IAT quality standards (e.g., the participant was too fast or slow in responding; Greenwald et al., 2003). Full information maximum likelihood (FIML) was employed to impute missing data (Enders, 2010).
The final sample of 1,068 undergraduates included 724 women (68%) and 344 men (32%). Individuals who identified as trans women or men were included with cis women or men, respectively. Regarding underrepresented minority status, 44% of participants (n = 466) were categorized as URM, while 53% (n = 602) were categorized as non-URM. By gender and race, 35% (n = 368) were non-URM women, 33% (n = 356) URM women, 22% (n = 234) non-URM men, and 10% (n = 110) URM men. More specifically, participants self-identified their primary race/ethnic categories as follows: Latinx (38%; n = 409), Asian/Asian American (31%; n = 334), White/European American (26%; n = 280), Black or African American (6%; n = 62), Middle Eastern (4%; n = 45), Indigenous/Native American (2%; n = 26). Based on current representation in pSTEM fields, individuals who identified as Latinx, Black, or Indigenous American were included in the URM group, while those who identified as Asian, White, or Middle Eastern were included in the non-URM group. Students could provide further detail about their ethnicity if they chose to; many students who identified as Asian or Latinx did so. Among Asian students, the most frequent ethnicity students identified with was East Asian (e.g., Chinese, South Korean, Hongkonger, Taiwanese; n = 140), while among Latinx students, the most common ethnicity identified with was Mexican or Chicana/o/ x (n = 275). Finally, about half of participants (46%; n = 493) were the first in their immediate family to go to college.
On average, participants had been attending the university for 2.6 years (SD = 1.55) and were 20.2 years old (SD = 2.30). Roughly, half of participants (59%) had declared a major. We asked participants to report their declared or planned major(s). About a third (31%) of participants listed a pSTEM major, such as computer science, engineering, physics, or cognitive science. (Life and health sciences were not included in pSTEM.) The most popular declared or planned major was psychology (55%), which was not categorized as pSTEM.
Procedure
Institutional review board (IRB) approval was granted from the University of California – Santa Cruz. Students filled out the IAT and surveys online, through Qualtrics. All IATs were created through IATgen, which allows you to administer IATs through Qualtrics (Carpenter et al., 2019). Students were first shown a consent form. Next, they were asked to make sure they were in a quiet space and to minimize all distractions.
Students were shown a screen that defined pSTEM as “physical Sciences, Technology, Engineering, and Math.” In addition, the screen indicated what fields the survey does and does not include in pSTEM. Next, they were asked to fill out a few comprehension questions to make sure they understood this definition (see Table S1 in the supplemental material for complete text of directions).
Next, the various measures were administered on the survey (described in what follows). First, participants took the three IATs (gender–STEM, self–STEM, and race–STEM). Afterwards, they took the following scales in random order: pSTEM expectancy–value beliefs and career motivation, humanities expectancy–value beliefs and career motivation (not included in this study), and pSTEM identity beliefs. Next, students took the following scales in random order: their personality trait self-concepts (not included in this study), their exposure to people in pSTEM in the media, and their explicit stereotypes about women and underrepresented minorities in pSTEM. Finally, they reported their demographic information. At the end of the session, a message was shown thanking participants for their time and encouraging them to email the first author if they had any questions.
Measures
Implicit association task
Implicit associations were measured using three different Implicit Association Tests (IAT; Greenwald et al., 2003). In these tasks, participants are asked to quickly sort words on a computer, using the “e” and “i” keyboard keys, into categories presented at the top left and right corners of the screen. The words were presented at random and fell into four different categories. All IATs included pSTEM-oriented words and liberal-arts-oriented words, adapted from the gender–STEM IAT (Greenwald et al., 2003; Xu et al., 2021). The only change made was that the word “biology” was replaced with “computer science” in order to focus on pSTEM rather than the life sciences. The other two categories depended on the kind of IAT: the gender–pSTEM IAT included female- and male-oriented words; the race–pSTEM IAT included Asian/White- and Black/Latinx-oriented words; and the self–pSTEM IAT included self- and other-oriented words (described later). pSTEM-oriented words included “engineering,” “computer science,” and “physics.” Liberal-arts-oriented words included “literature,” “humanities,” and “English.”
Stimuli were presented one word at a time, and participants were asked to sort each word into the correct corner as quickly as possible. All IATs included a “congruent condition” and an “incongruent condition.” In the congruent condition, participants were asked to sort words from the stereotype-congruent categories into one corner (e.g., female-oriented and liberal-arts-oriented into one corner, and male-oriented and pSTEM-oriented words into the other). In the noncongruent condition, participants were asked to sort stereotype-incongruent categories into each corner (e.g., male-oriented and liberal-arts-oriented words into one corner, and female-oriented and pSTEM-oriented into the other). Participants who hold higher implicit associations are faster at sorting words in the congruent condition (i.e., pSTEM- and male-oriented are in the same corner), compared to the noncongruent condition (i.e., pSTEM- and female-oriented are in the same corner). IAT scores were calculated using the latest scoring procedure described in Greenwald et al. (2003).
Two pertinent measures of reliability to report for the IAT are split-half reliability and error rate (Carpenter et al., 2019). A split-half reliability above .70 is considered acceptable, with higher values indicating higher internal consistency (Cortina, 1993). Error rate is unique to the IAT and indicates the percentage of mistakes participants made out of the total number of trials. Participants are expected to make some mistakes on the IAT; a very low error rate indicates that the two categories are not distinct, while a high error rate may indicate low effort. A typical error rate range for the IAT is between 5 and 10%, although error rate may differ slightly depending on the stimuli (i.e., more distinct stimuli may result in higher error rates; Rudman, 2011).
Gender–pSTEM IAT
Gender–pSTEM implicit associations were measured using an adapted version of the gender–science Implicit Association Test (Greenwald et al., 2003; science words were adapted to only include pSTEM words, as described before). Female-oriented words included “woman,” “girl,” and “female”; and male-oriented words included “man,” “boy,” and “male.” Larger discrepancies (indicated by higher IAT scores) between the two conditions indicated a higher implicit association between pSTEM and men, compared to pSTEM and women. Split-half reliability with Spearman–Brown correction was .80, indicating satisfactory internal reliability. Error rate was 9%, which is within the typical range.
Race–pSTEM IAT
The race–pSTEM IAT was created for the current study. We piloted it among a sample of 79 undergraduate women (40% URM) before using it in the present study. Asian/White-oriented words included “White,” “European American,” “Asian,” and “Chinese American”; Black/Latinx-oriented words included “Black,” “African American,” “Hispanic,” and “Mexican American.” We chose to use words rather than faces to avoid confounding race and gender. Larger discrepancies (indicated by higher IAT scores) between the two conditions indicated a higher implicit association between pSTEM and Asian/White people, compared to pSTEM and Black/Latinx people. Split-half reliability with Spearman–Brown correction was .71, indicating acceptable internal reliability. Error rate was 10%, which is within the typical range.
Self–pSTEM IAT
An adapted version of the math self-concepts IAT (Nosek et al., 2002) was used to measure undergraduates’ implicit association of themselves or others with pSTEM versus humanities/liberal arts. To make the task pSTEM focused, math-related words (e.g., “calculus,” “algebra,” “geometry”) were replaced with pSTEM-related words (e.g., “computer science,” “engineering,” “physics”). Self-oriented words included “I,” “me,” and “my”; and other-oriented words included “they,” “them,” and “their.” Larger discrepancies (indicated by higher IAT scores) between the two conditions indicated a higher implicit association between pSTEM and oneself, compared to pSTEM and other people. Split-half reliability with Spearman–Brown correction was .79, indicating satisfactory internal reliability. Error rate was 11%, which is slightly higher than the typical range, but reasonable (Rudman, 2011).
Survey measures
The self-report measures are described in the following sections. All items and factor analyses are presented in Table S2 in the supplemental material. In addition, participants were asked to provide the following demographic information: gender and race (both checking a box and free response options were given), most recent math grade, number of years in college, and maternal education level.
Exposure to same-gender and same-race role models in pSTEM
To measure participants’ exposure to representations of their own gender and race identities in pSTEM, a new measure was created for this study. Six questions were asked about exposure to men or women in pSTEM (depending on participant’s gender), and six questions were asked about exposure to same race/ethnicity in pSTEM. These questions ranged from asking about the media to interpersonal interactions (for all items, see Table S2 in the supplemental material). Example questions include: “I often see women in pSTEM on TV or in popular culture,” “As a child, I knew men who worked in pSTEM,” and “Off the top of my head, I can name several famous people of my race/ethnicity in pSTEM” (see supplemental material for all items). Participants were asked to answer on a 7-point scale (1 = strongly disagree, 7 = strongly agree). Internal consistency reliability was .86 for the female role models in pSTEM items (factor loadings: .73–.80), .84 for the male role model items (factor loadings: .70–.76), and .91 for same race/ethnicity role models in pSTEM items (factor loadings: .75–.87).
Explicit association of STEM with gender and race
To measure explicit stereotyped associations of pSTEM with race and gender, five questions were asked regarding gender and five regarding race. Questions were adapted from Starr’s (2018) Nerd-Genius Scale to ask about gender and race stereotypes about pSTEM, rather than nerd-genius stereotypes. Three questions asked about associations of men or White/Asian people with STEM, and two questions assessed beliefs that women or Black and Latinx people are not in pSTEM. (This was done in efforts to make these measures similar to the IATs, which also measured associations of women and URM groups with pSTEM.) Example items include, “If I hear that someone works in pSTEM, I assume that they’re probably a man” and “People who work in pSTEM are often Asian or White” (see Table S2 in the supplemental material for all items). Participants were asked to answer on a 6-point scale (1 = strongly disagree, 6 = strongly agree). Internal consistency reliability was .87 for gender-related items (factor loadings: .77–.84) and .86 for race-related items (factor loadings: .73–.85).
Explicit pSTEM identity
Participants’ pSTEM identity was evaluated in terms of their felt typicality with people in pSTEM (Leaper et al., 2012; Tobin et al., 2010). Felt typicality, in addition to relating to identity, is related to feelings of belonging (Wilson & Leaper, 2016). Four items from a recently devised scale (Starr et al., 2020) were used: “I feel like I’m just like people who are good at pSTEM,” “I feel that the things I like to do in my spare time are similar to what most pSTEM-oriented people like to do in their spare time,” “I think I am a good example of what it means to be someone who is good at pSTEM,” and “I feel that the kinds of things I’m good at are similar to what most ‘pSTEM people’ are good at.” Participants were asked to answer on a 6-point scale (1 = strongly disagree, 6 = strongly agree). Internal consistency reliability was .81, factor loadings were .77–.83.
pSTEM expectancy and value beliefs
Eleven items adapted from Eccles’s expectancy–value motivation model (Eccles & Wigfield, 1995) were used to measure participants’ expectancy and value beliefs in pSTEM. All items were rated on a 5-point scale. The Expectancy Beliefs Scale included seven items (five pSTEM self-concept items and two expectations for success items; see supplemental material for all items). Sample questions are, “In general, how difficult are pSTEM tasks for you?” (1 = very difficult, 5 = very easy) and “In general, how confident are you in your ability to do well in pSTEM courses?” (1 = not at all confident, 5 = extremely confident). Internal consistency reliability was .93. The Value Beliefs Scale included four questions (two utility value items and two interest items), which had an internal consistency reliability alpha of .87. Sample questions are, “How important is it to you to do well in pSTEM courses?” (1 = not at all important, 5 = extremely important) and “How useful is what you learn in pSTEM for your life after you finish college?” (1 = not at all useful, 5 = most useful). A factor analysis indicated that expectancy and value items loaded onto their factors (loadings for expectancy: .71–.87; loadings for value: .84–.86; see Table S2 for more detail).
Results
Preliminary Analyses
Descriptive statistics and bivariate correlations across variables are presented in Tables 1 to 3, respectively. Also, factor analyses for all scales are presented in Table S2 in the supplemental material.
Descriptive statistics and group comparisons of gender and URM group for major variables.
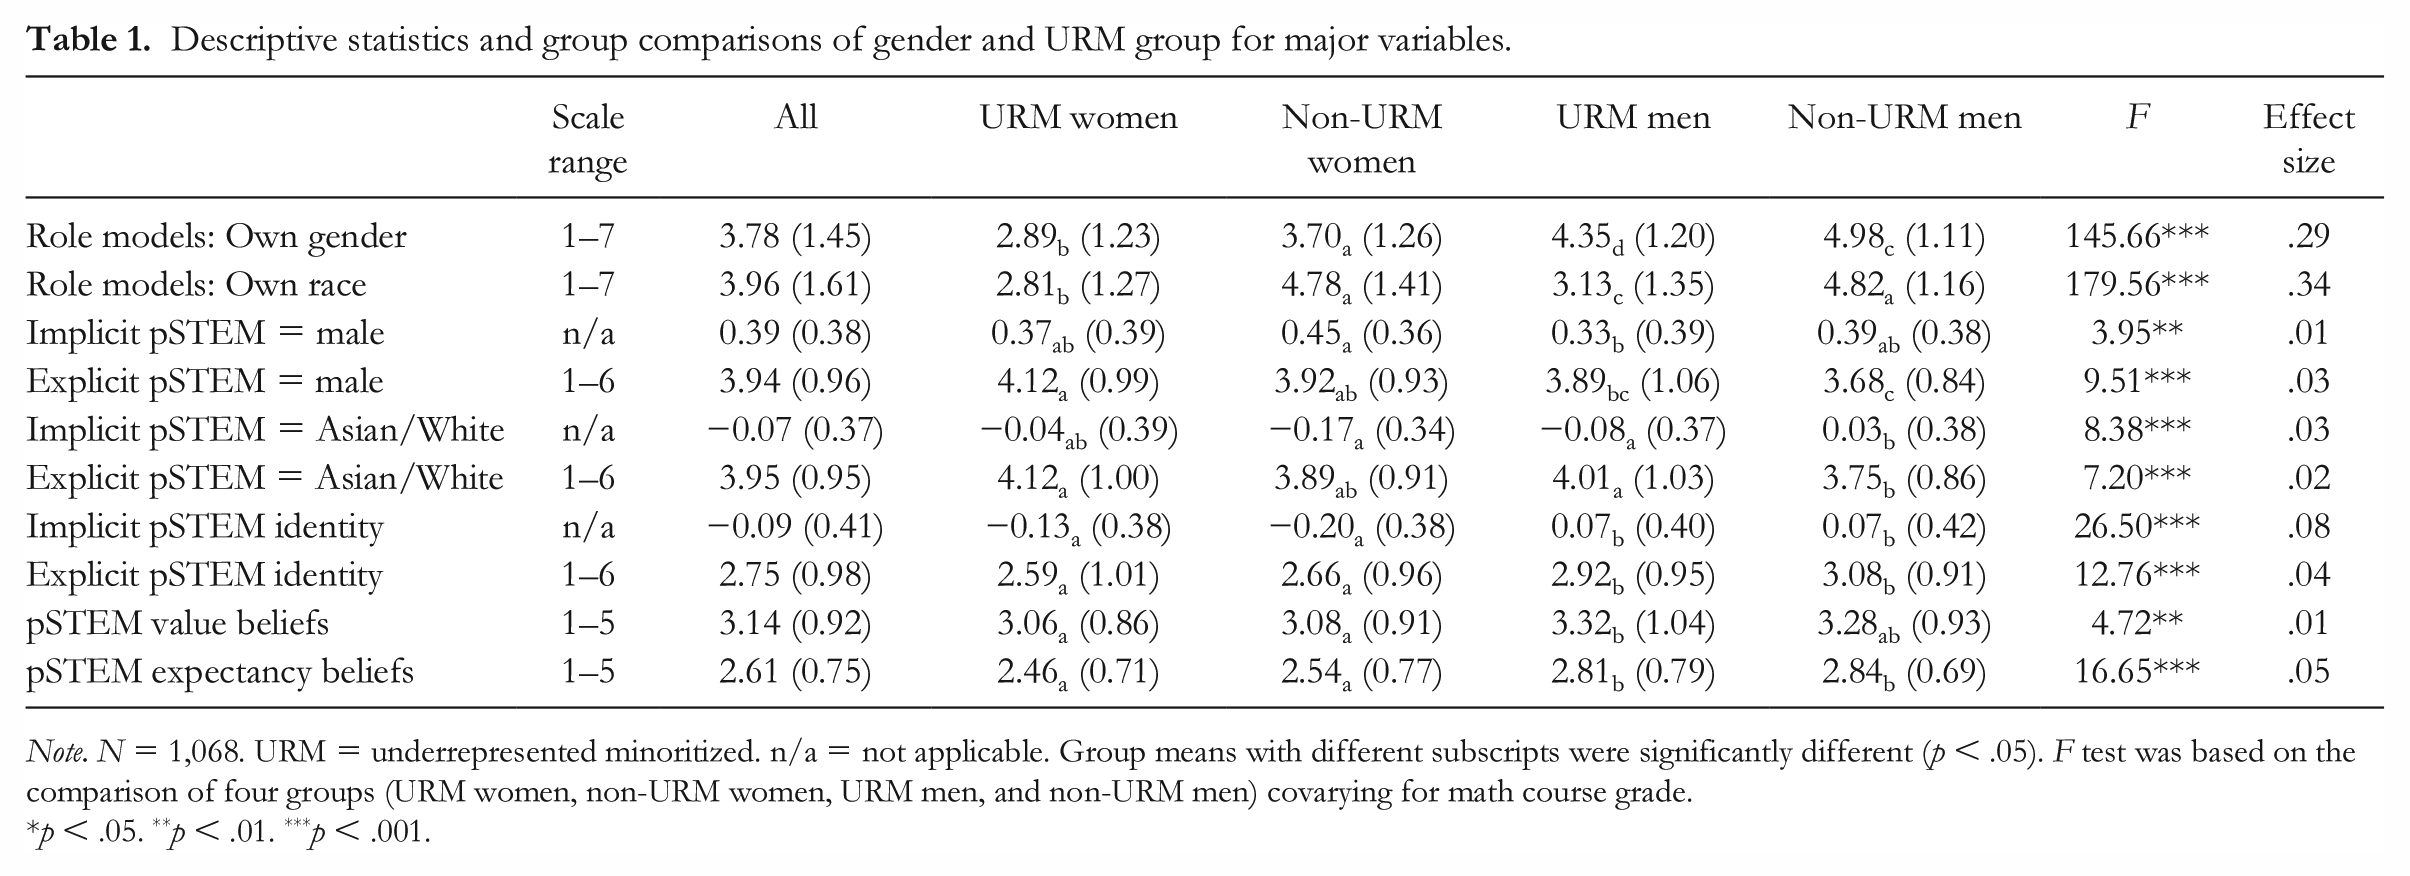
Note. N = 1,068. URM = underrepresented minoritized. n/a = not applicable. Group means with different subscripts were significantly different (p < .05). F test was based on the comparison of four groups (URM women, non-URM women, URM men, and non-URM men) covarying for math course grade.
p < .05. **p < .01. ***p < .001.
Bivariate correlations between major variables: URM and non-URM women.
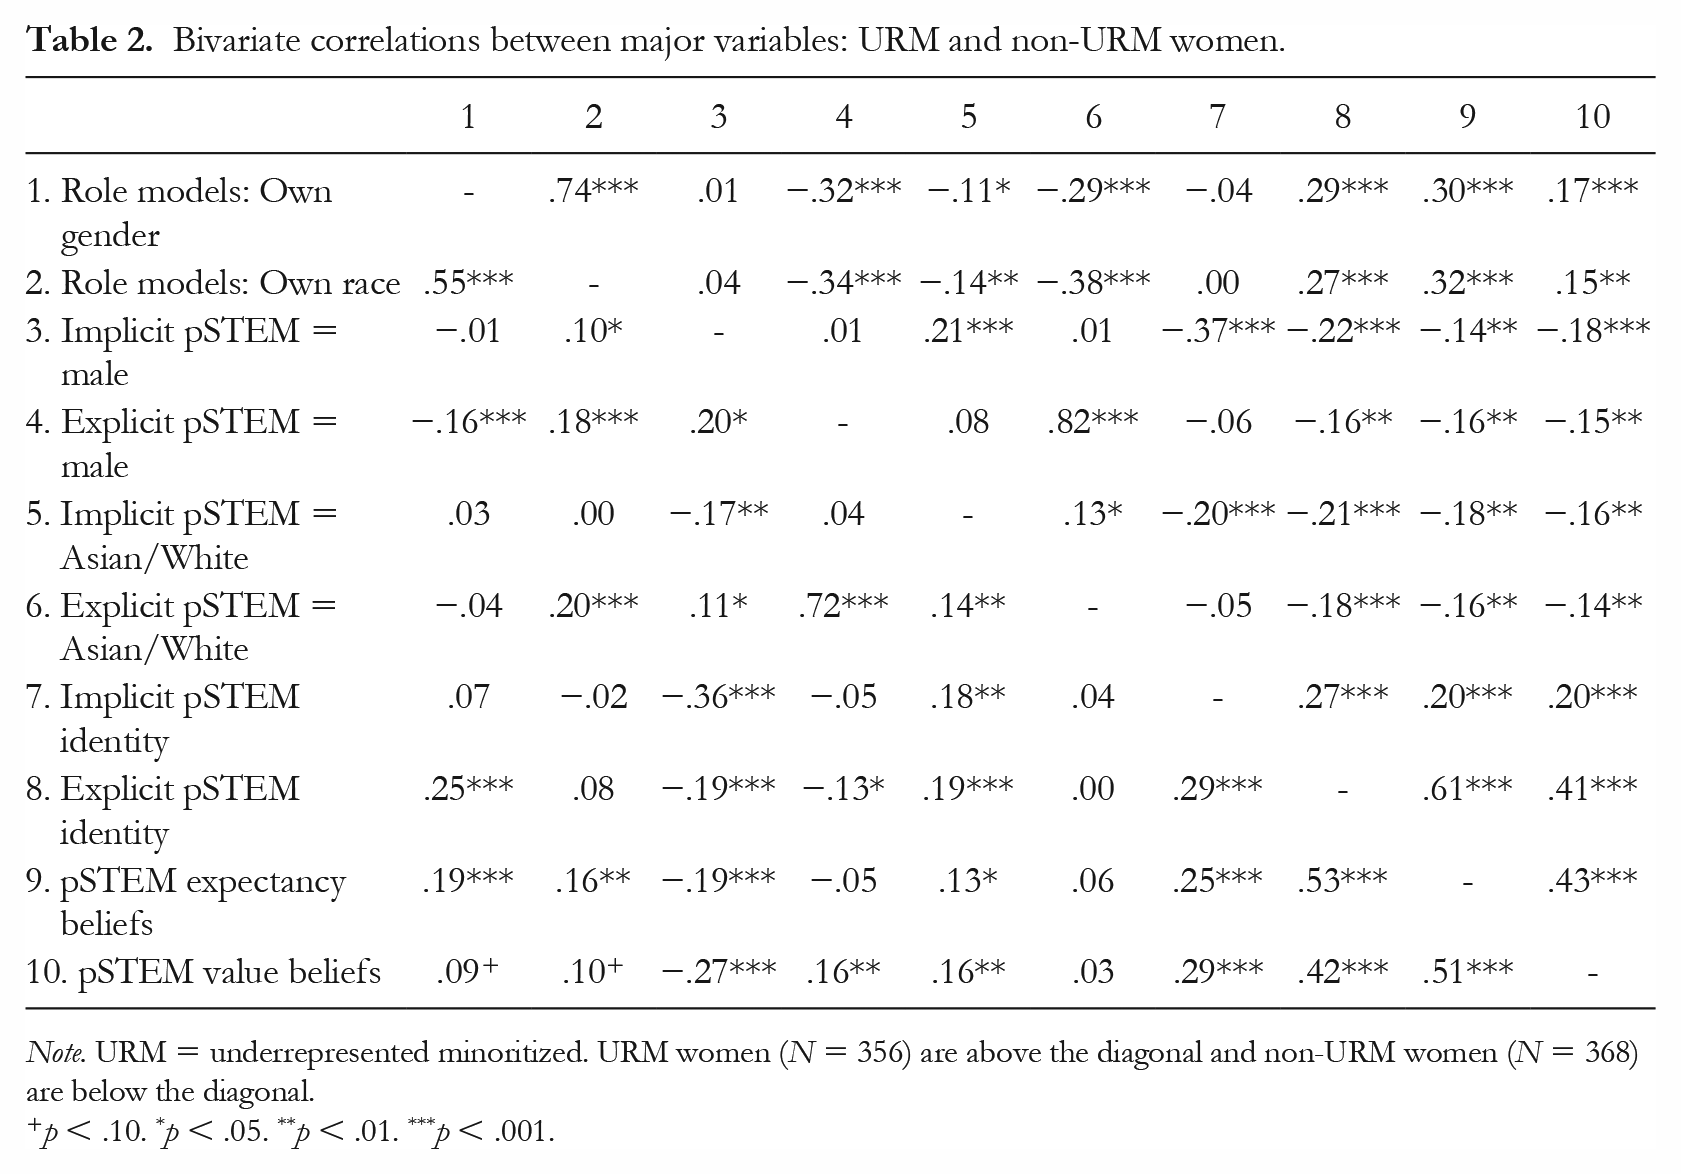
Note. URM = underrepresented minoritized. URM women (N = 356) are above the diagonal and non-URM women (N = 368) are below the diagonal.
p < .10. *p < .05. **p < .01. ***p < .001.
Bivariate correlations between major variables: URM and non-URM men.
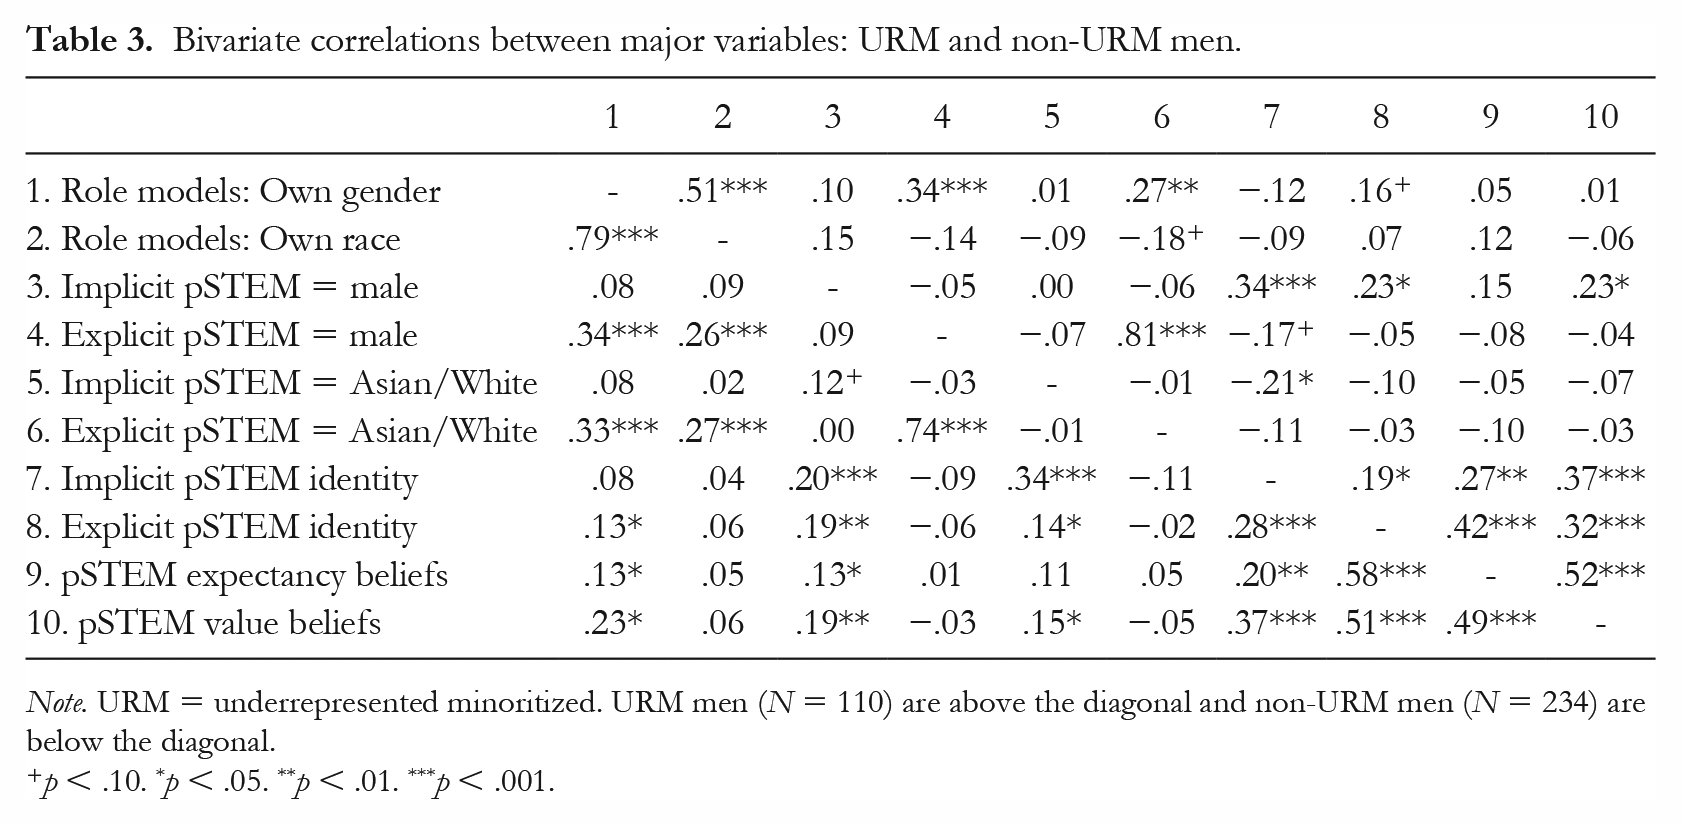
Note. URM = underrepresented minoritized. URM men (N = 110) are above the diagonal and non-URM men (N = 234) are below the diagonal.
p < .10. *p < .05. **p < .01. ***p < .001.
Measurement invariance was tested across the four groups (URM women, non-URM women, URM men, and non-URM men; see Table S3 for more detail). Analyses indicated strong, configural, and weak measurement invariance for expectancy and value beliefs, pSTEM identity, and explicit stereotyping of pSTEM as male. Thus, group differences in factor means were unbiased and had common meaning across groups; and formal comparison is therefore appropriate (Kline, 2016). Analyses indicated that experiences with same-gender and same-race pSTEM role models and stereotyping pSTEM as White/Asian had configural and weak measurement invariance. This indicates that formal comparison is appropriate, although there could be different response styles based on gender and race/ethnicity.
Hypothesis 1: Testing for Variations Across Gender and URM Status
To assess potential differences among participants based on gender and race/ethnicity, four-way ANCOVAs comparing the four groups (URM women, non-URM women, URM men, non-URM men) controlling for math grade, with Bonferroni corrected Tukey’s honestly significant difference (HSD) post hoc tests were performed (see Table 1). We hypothesized that women would report significantly fewer same-gender pSTEM role models compared to men, and URM students would report significantly fewer same-race pSTEM role models compared to non-URM students. Furthermore, we hypothesized that, compared to men, women would have significantly lower pSTEM identity beliefs (both explicit and implicit) and pSTEM motivation (career and expectancy–value beliefs). Similarly, we anticipated that URM women would have significantly lower pSTEM identity and motivation compared to non-URM women, and URM men would have significantly lower identity and motivation compared to non-URM men. Implicit and explicit group differences were explored but no formal hypotheses were made prior to analyses.
Results were largely as expected (see Table 1). First, compared to men and non-URM students, women and URM students had significantly fewer same-gender or same-race pSTEM role models, respectively. Furthermore, compared to non-URM women and URM men, URM women reported significantly fewer same-gender and same-race role models, respectively. Second, non-URM women had significantly higher implicit pSTEM = male associations when compared to URM students of both genders. Also, non-URM men held significantly higher pSTEM = Asian/White associations compared to all other groups. Third, regarding explicit stereotypes, both URM and non-URM women had significantly higher pSTEM = male explicit associations compared to men. URM women had significantly higher pSTEM = Asian/White explicit associations compared to non-URM students, and URM men had significantly higher associations when compared to non-URM men. Fourth, regarding implicit and explicit pSTEM identity, significant average gender differences occurred. Women (both URM and non-URM) reported significantly lower pSTEM identity than did men (both URM and non-URM). Finally, the results for the motivational outcomes (pSTEM career motivation, expectancy beliefs, and value beliefs) indicated average group differences based on gender but not on URM status. Women had significantly lower motivational outcomes than did men. However, there were no significant differences either between URM and non-URM women or between URM and non-URM men.
Hypotheses 2a, 2b, 2c, and 2d: Testing the SEM Model
We hypothesized that exposure to same-gender and same-race role models in pSTEM would be significantly related to gender and race stereotypes/associations about pSTEM. In turn, we expected that gender and race stereotyped associations would be significantly related to pSTEM implicit and explicit identity. For the previous two hypotheses, we expected that gender and URM group membership would be significant moderators. Finally, we hypothesized that pSTEM identity would be significantly related to pSTEM expectancy–value beliefs, and that stereotypes would have an indirect effect on outcome variables through pSTEM identity; in other words, we predicted pSTEM identity would mediate the relation between stereotyped associations and pSTEM motivation.
To test our hypotheses, we used the R structural equation modeling (SEM) package lavaan (Rosseel, 2012). The three IATs (gender–, race–, and self–pSTEM) were manifest indicators, while all other indicators were latent indicators. Given our hypotheses, gender and race group membership were examined as a moderator using multigroup analysis with four groups: URM women, non-URM women, URM men, and non-URM men. Model fit was tested using multiple indicators. First, the chi-square test of model fit was examined. Additionally, the following indices were examined: Tucker–Lewis index (TLI), comparative fit index (CFI), and root-mean-square error of approximation (RMSEA). For both the TLI and CFI, a value ⩾ .90 indicates a good model fit (Hu & Bentler, 1999). For RMSEA and standardized root-mean-square residual (SRMR), values ⩽ .08 indicate a good model fit (Kline, 2016).
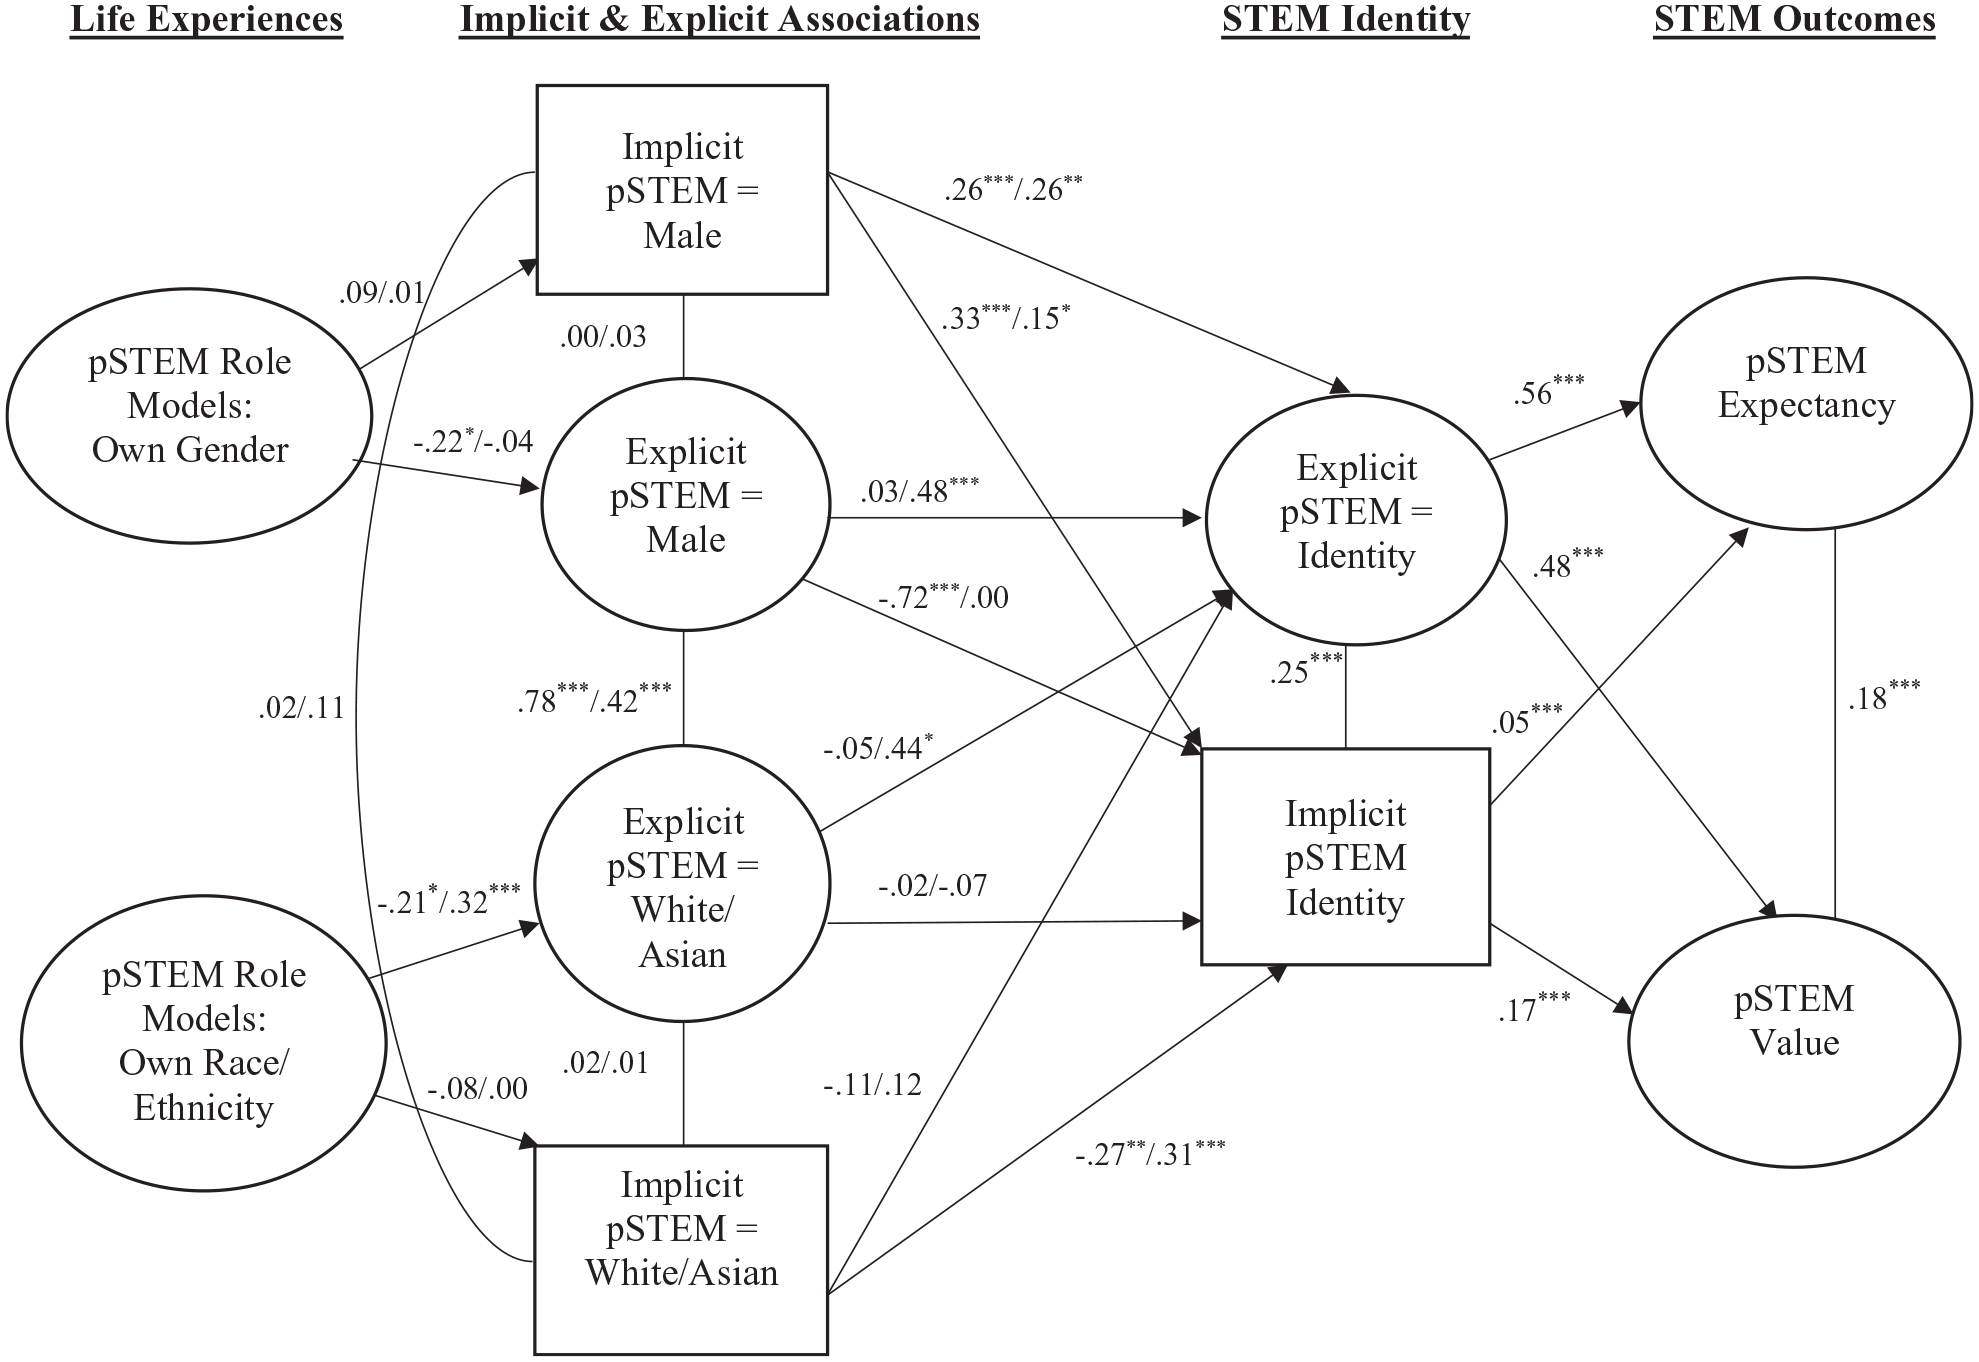
The hypothesized model was a good fit to the observed data, as indicated with fit indices that met the standard for a good fit, χ2(3120, N = 1,068) = 24912.74, TLI = 0.91, CFI = .92, SRMR = .08, RMSEA = .05, 95% CI [0.05, 0.05]. Factor loadings indicated that latent variables significantly loaded onto same-gender (⩾ .70; ps > .001) and same-race role models (⩾ .75; ps > .001); explicit gender (⩾ .77; ps > .001) and race stereotypes (⩾ .73; ps > .001); and explicit pSTEM identity (⩾ .77; ps > .001), expectancy beliefs (⩾ .71; ps > .001) and value beliefs (⩾ .84; ps > .001). Standardized parameter estimates for the SEM models by gender and URM status are presented in Figure 1 (URM and non-URM women) and Figure 2 (URM and non-URM men). For full output from the SEM analyses, please see Table S4 in the supplemental material. As described further below, at the end of the Results section, an alternative SEM model was tested.
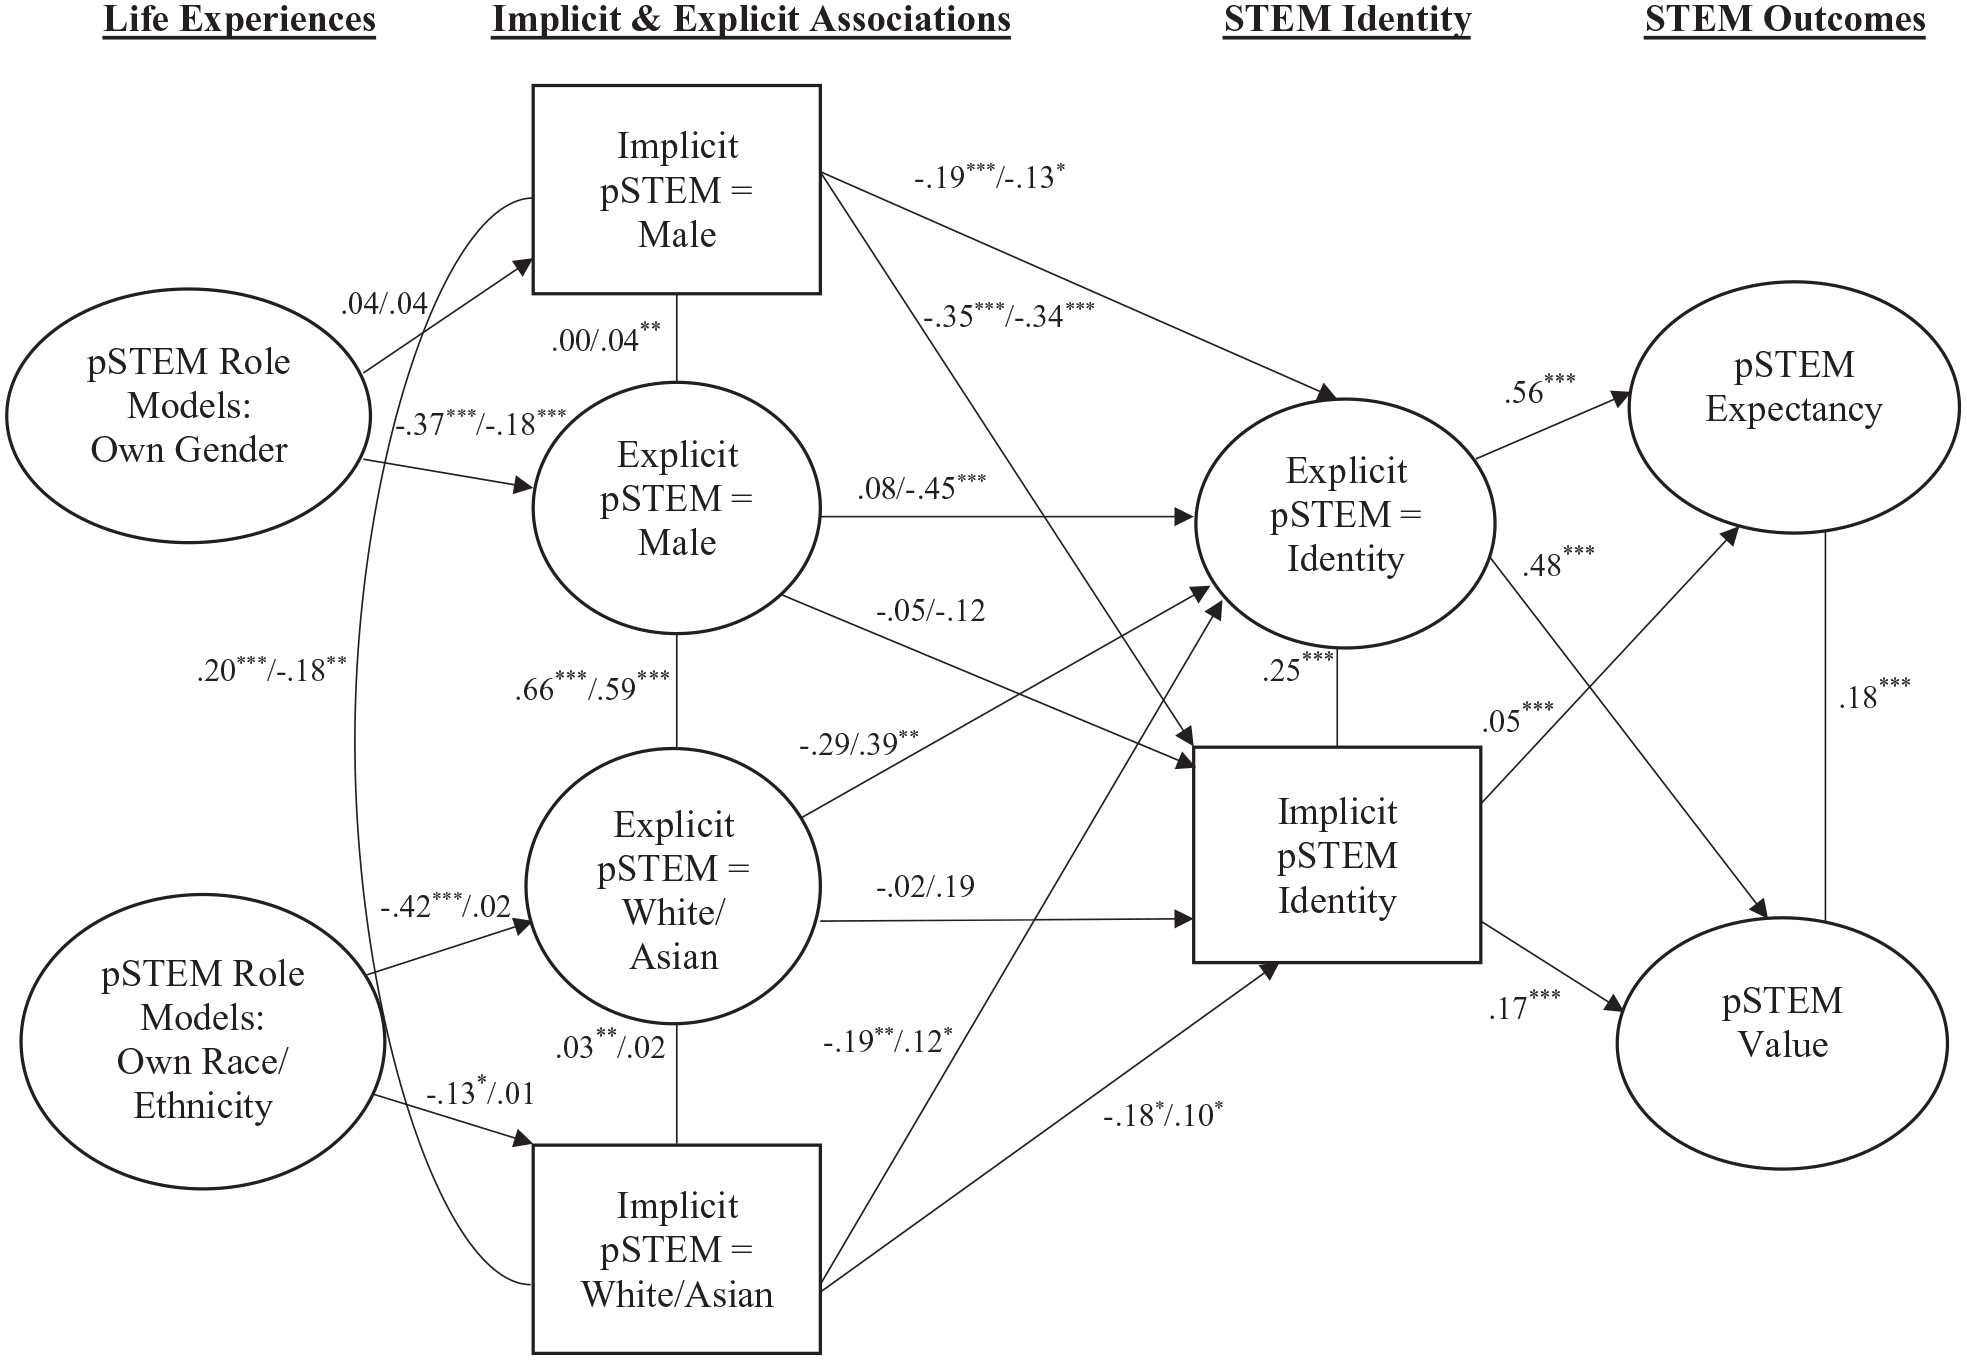
SEM model among URM women (Black and Latina) and non-URM women (Asian and White).
SEM model among URM men (Black and Latino) and non-URM men (Asian and White).
Hypothesis 2a: Relations between exposure to same-gender and same-race role models and pSTEM stereotypes
In general, exposure to same-gender and same-race role models was significantly and negatively related to explicit (but not implicit) stereotypes among marginalized groups (see Figures 1 and 2). Exposure to same-gender role models in pSTEM was significantly negatively related to expressing explicit pSTEM = male associations among women (both URM and non-URM). Similarly, exposure to same-race role models was negatively related to holding explicit pSTEM = White/Asian associations among URM women and men. Additionally, for URM women, exposure to same-race role models was negatively related to implicit pSTEM = White/Asian associations. Finally, for non-URM men, exposure to same-race role models was positively associated with explicit pSTEM = White/Asian associations. These paths between same-gender and same-race role models and explicit gender and race stereotypes were significantly different for URM women compared to non-URM women, URM men, and non-URM men (z = −7.10 to 6.26, ps < .001). Thus, exposure to same-gender and same-race role models may be especially influential in decreasing explicit stereotypes among URM women.
Among URM women, exposure to same-gender or same-race role models accounted for 10% of the variance in explicit STEM = male associations, 14% of explicit STEM = Asian/White associations, and 2% of implicit pSTEM = White/Asian associations. Among non-URM women, exposure to same-gender pSTEM role models accounted for 2% of the variance in explicit STEM = male associations. Among URM men, exposure accounted for 11% of the variance in explicit STEM = male associations and 3% of explicit STEM = Asian/White associations. Finally, among non-URM men, exposure accounted for 7% of explicit STEM = Asian/White associations.
Hypothesis 2b: Relations between pSTEM stereotypes and pSTEM identity
Our analyses revealed that pSTEM stereotypical associations and pSTEM identity were related in many of the ways that we predicted (see Figures 1 and 2).
Implicit gender and race stereotypes significantly related to pSTEM implicit identity among all groups—men and women, URM and non-URM. Additionally, implicit stereotypes were related to explicit pSTEM identity in most cases. The exception was that implicit pSTEM = White/Asian stereotypes did not significantly relate to explicit pSTEM identity among men.
In contrast, explicit gender and race stereotypes were less frequently related to pSTEM identity. Also, these relations differed somewhat depending on whether explicit or implicit measures of identity were examined. First, explicit gender–pSTEM and race–pSTEM stereotypes predicted explicit pSTEM identity among non-URM women and men, but not among URM women and men. Second, explicit gender and race stereotypes were unrelated to implicit pSTEM identity, with one exception: Among URM men, explicitly stereotyping pSTEM as male was negatively related to implicit pSTEM identity.
These relations were moderated by race and gender. Among women, pSTEM = male associations were negatively related to explicit and implicit pSTEM identity, while among men, these relations were positive. These path differences were significant (implicit pSTEM identity: z = −6.55 to −5.64, ps < .001; explicit pSTEM identity: z = −4.73 to −3.78, ps < .01). Similarly, among URM students, implicit pSTEM = Asian/White associations were negatively related to pSTEM identity, while among non-URM students this association was positive. Once more, these path differences were significant (implicit pSTEM identity: z = −5.20 to 5.14, ps < .002; explicit pSTEM identity: z = −3.40 to 3.73, ps < .05).
Among URM women, stereotypes accounted for 14% of the variance in implicit pSTEM identity and 11% of the variance in explicit pSTEM identity after taking into account math grade. Among non-URM women, exposure to pSTEM implicit and explicit stereotypes about gender and race accounted for 16% of the variance in implicit pSTEM identity and 7% of the variance in explicit pSTEM identity. For URM men, race and gender stereotypes accounted for 20% of the variance in implicit pSTEM identity and 7% of the variance in explicit pSTEM identity. Finally, for non-URM men, stereotypes accounted for 14% of the variance in implicit pSTEM identity and 7% of the variance in explicit pSTEM identity.
Hypothesis 2c: Relations between pSTEM identity and pSTEM outcomes
Across all groups, explicit and implicit pSTEM identity were significantly related to pSTEM expectancy and value beliefs (see Figures 1 and 2). No group differences were hypothesized for relations between pSTEM identity and outcomes, and none were found; thus, all paths were set to be equal across groups. Among URM women, pSTEM implicit and explicit identity accounted for 33% of the variance in pSTEM expectancy beliefs and 19% of the variance in pSTEM value beliefs, after taking into account math grade. Among non-URM women, pSTEM implicit and explicit identity accounted for 27% of the variance in pSTEM expectancy beliefs and 22% of the variance in pSTEM value beliefs. For URM men, pSTEM implicit and explicit identity accounted for 28% of the variance in pSTEM expectancy beliefs and 21% of the variance in pSTEM value beliefs. Finally, among non-URM men, pSTEM identity accounted for 28% of the variance in pSTEM expectancy beliefs and 37% of the variance in pSTEM value beliefs.
Hypothesis 2d: Is pSTEM identity a mediator?
We additionally tested whether implicit pSTEM identity and explicit pSTEM identity served as mediators between implicit and explicit associations and expectancy–value beliefs. We found that for implicit pSTEM race and gender stereotypes, both pSTEM implicit and explicit identity frequently mediated the relation between stereotypes and expectancy–value beliefs across all groups (see Table S2 in the supplemental material). Regarding explicit race and gender stereotypes, we found that explicit pSTEM identity was a mediator among non-URM women and men but not among URM women and men. In other words, explicit pSTEM associations about gender and race related to expectancy and value beliefs primarily among Asian and White women and men. In contrast, implicit pSTEM associations about gender and race related to expectancy and value beliefs via pSTEM explicit and implicit identities across race and gender.
Testing Alternative Path Models
It is recommended that researchers test theoretically plausible alternative models along with the hypothesized model (Kline, 2016). As an alternative model, we flipped expectancy–value beliefs and pSTEM identity. In other words, we tested whether stereotyped beliefs directly predicted expectancy–value beliefs, and in turn predicted explicit and implicit STEM identity. The rest of the model stayed the same as the hypothesized model (with math grade controlled for in both models). According to indicators, this alternative model fit was adequate but not as good a fit as the hypothesized model, χ2(3120, N = 1,068) = 24912.74, TLI = 0.86, CFI = .87, SRMR = .12, RMSEA = .06, 95% CI [0.06, 0.06]. Modification indices recommended adding direct paths from gender–pSTEM and race–pSTEM associations to explicit and implicit identities, which thereby provided additional evidence that pSTEM identity mediated the relation between stereotyped associations and pSTEM motivational variables. However, implicit associations were frequently directly related to expectancy and value beliefs. Interestingly, they were significantly related across race and gender for the gender IAT (positively related to expectancy and value for men, negatively for women). Additionally, the race/ethnicity IAT was positively related to non-URM men’s value beliefs, and negatively related to URM women’s expectancy and value beliefs. Explicit race and gender stereotypes were only significantly related to non-URM women’s expectancy beliefs. Finally, expectancy and value beliefs significantly predicted implicit and explicit STEM identity for all groups.
Discussion
Our research builds upon our knowledge of gender- and race-related variations in pSTEM motivation in three ways. First, we simultaneously focused on both race and gender in relation to undergraduates’ pSTEM-related experiences, stereotypes, identities, and motivational beliefs. Our sample included over 1,000 undergraduates with similar numbers of women and men from URM and non-URM backgrounds. Second, we assessed students’ perceived gender- and race-based pSTEM role models via personal interactions or popular culture. Third, we included both explicit and implicit measures of gender–pSTEM and race–pSTEM stereotypes as well as pSTEM identity. As discussed in what follows, we found support for hypothesized average group differences in these measures as well as confirmation for many components in our proposed path model.
Hypothesis 1: Average Between-Group Differences Based on Gender and Race
As expected, we found that URM women reported significantly fewer same-gender and same-race role models in pSTEM than all other groups, while non-URM men reported significantly more same-gender and same-race role models. On average, URM women reported observing the fewest ingroup pSTEM role models. This finding underscores the need for greater diversity in portrayals of pSTEM professionals in popular media, and when exposing underrepresented students to pSTEM role models in classrooms and other settings.
Furthermore, students who were URM and women were significantly more likely to explicitly associate pSTEM with Asian/White people and men, respectively. This may be in part due to relatively fewer same-gender role models for both URM and non-URM women, and fewer same-race role models for URM women. Relatedly, it is possible that this measure reflected an awareness of real inequities in pSTEM representation in society. Explicit awareness of stereotypes or underrepresentation may not always negatively impact students’ identity; for example, when individuals hold positive identity beliefs (e.g., ethnic pride) about their ingroup, this may sometimes act as a buffer against the effects of discrimination (Butler-Barnes et al., 2018; Grindal & Nieri, 2015). This may be one reason why, despite having lower access to role models, URM women did not demonstrate significantly lower pSTEM identity and motivation relative to non-URM women. Instead, we found that both non-URM men and URM men had significantly higher STEM identity and motivational beliefs compared to non-URM women and URM women.
Both URM and non-URM women reported similar levels of pSTEM identity and motivational beliefs. This falls in line with prior work that found similar pSTEM motivational beliefs among women across race/ethnicity (Else-Quest et al., 2013), as well as research indicating URM women were less likely to hold gender stereotypes about pSTEM and more likely to major in pSTEM compared to non-URM women (O’Brien et al., 2015). Relatedly, despite non-URM men reporting significantly more role models in pSTEM than all other groups, non-URM men and URM men had similar pSTEM identity and motivational beliefs. The finding that despite fewer role models, URM women and men have similar STEM identities to non-URM women and men (respectively) may reflect the importance of ethnic pride and resilience seen in Black and Latinx communities. However, both non-URM and URM men had significantly higher average pSTEM identity and motivational beliefs than non-URM and URM women, perhaps reflecting persistent pSTEM gender stereotypes and bias in U.S. culture that is sometimes perpetuated within families in addition to classrooms (e.g., Musto, 2019; Starr & Simpkins, 2021).
Hypothesis 2: Relations Among pSTEM Role Models, Stereotypes, Identity, and Outcomes
In our second set of hypotheses, we proposed a path model linking observed gender- and race-based pSTEM role models with gender- and race-based pSTEM stereotypes, pSTEM identity, and pSTEM motivational beliefs. Moreover, we included separate implicit and explicit measures of stereotypes and identity. Furthermore, we postulated that pSTEM identity would mediate possible links between stereotyping and motivation. In the next sections, we discuss findings related to these hypotheses.
The potential impact of ingroup pSTEM role models
As hypothesized, gender- and race-based differences in pSTEM role models predicted the likelihood of students’ gender–pSTEM and race–pSTEM stereotypes, respectively. In turn, these stereotypes predicted pSTEM identity and motivation. More specifically, for women and URM individuals, observing same-gender and same-race role models in pSTEM predicted lower explicit stereotyping of pSTEM as a male or White/Asian domain, respectively. Also, experiencing same-gender role models was negatively associated with URM and non-URM women’s stereotyping of pSTEM as a male domain. Analogously, experiencing same-race role models was negatively associated with URM women’s and men’s stereotyping of pSTEM as a White/Asian domain; conversely, observing same-race role models was positively associated with White/Asian men’s racial stereotyping of pSTEM.
Our findings fit with prior research indicating that ingroup role model exposure was positively related to STEM belongingness or motivational beliefs among underrepresented groups (e.g., Casad et al., 2018; Chen & Moons, 2015; Cheryan et al., 2013; Johnson et al., 2019; Merritt et al., 2021; Riegle-Crumb et al., 2017; Shin et al., 2016; Stout et al., 2011). Seeing self-relevant role models may help individuals to discount stereotyped views about women and/or URM persons in pSTEM (i.e., “If you can see it, you can be it”). In turn, this may better allow them to view themselves as identifying with pSTEM (see Casad et al., 2018). Our pSTEM role model measure was somewhat distinct in its inclusion of observed same-gender and same-race role models in the media (e.g., TV) and personal relationships (e.g., teachers). Prior studies about STEM role models have largely been intervention studies focused on either gender or race, but not both (e.g., Casad et al., 2018; Lawner et al., 2019). Taking into account past and present role models, both in person and in the media, captures lifetime exposure.
The relations of same-race and same-gender role model exposure to lower explicit stereotyping was strongest among URM women. Thus, experiencing both same-gender and same-race role models may be especially beneficial for URM women. On average, women were significantly less likely to report same-gender role models, and URM people were significantly less likely to report same-race role models. However, URM women were the least likely to report same-gender and same-race role models. This may put URM women at risk because having fewer ingroup role models may affect their stereotyping, identity, and motivational beliefs. Our model found that, experiencing same-gender and same-race pSTEM role models was negatively related to endorsing gender and race explicit stereotypes about pSTEM. In turn, these beliefs predicted lower explicit and implicit pSTEM identity, and lower pSTEM motivational beliefs.
In contrast to URM women, non-URM men’s likelihood of observing pSTEM role models concordant with both their gender and race may strengthen their corresponding stereotypes of persons most likely represented in pSTEM fields. In this manner, non-URM men’s advantages in the pSTEM pipeline are reinforced. As our model further suggests, non-URM men may be more likely to hold implicit and explicit associations linking their ingroups with pSTEM. In turn, both implicit and explicit associations were linked to greater explicit and implicit identification with pSTEM, as well as stronger pSTEM motivational beliefs. In this manner, White and Asian men may experience a dual-identity advantage based on their combined gender and ethnicity/race.
pSTEM identity as a mediator between stereotypes and outcomes
Our model additionally indicated that pSTEM identity—viewing oneself as typical of persons in pSTEM—may act as a mediator linking stereotyping and motivational beliefs. When pSTEM is associated primarily with outgroups, students may be less likely to consider themselves as belonging in that field (e.g., Cundiff et al., 2013). If so, this may undermine their confidence and interest (i.e., expectancy–value beliefs) in pSTEM subjects; and over time, this may lead to declines in pSTEM persistence and achievement (Eccles & Wigfield, 2020; Seyranian et al., 2018).
The patterns indicated in our model are consistent with prior studies guided by balanced identity theory. According to the theory, motivation is greatest when individuals view achievement in a domain as congruent with their own stereotypes and ingroup identities (e.g., Cvencek et al., 2012; Smyth & Nosek, 2015; Starr & Leaper, 2019). In our study, students’ felt typicality with persons in pSTEM depended on whether they held pSTEM gender and race stereotypes that were congruent or incongruent with their own gender or race/ethnicity. When there was congruence, they indicated higher pSTEM expectancy and value beliefs. When there was incongruence, they showed lower motivational beliefs.
Whereas our hypothesized model was generally supported, we previously explained how the relations among the implicit and explicit measures differed in some ways between the URM and non-URM students in the SEM model. Implicit stereotypes regarding race and gender similarly predicted pSTEM implicit and explicit identity for both groups. However, explicit stereotypes regarding race and gender predicted pSTEM identity only for the non-URM group. This finding is consistent with prior research indicating that implicit stereotypes were more predictive of outcomes than explicit stereotypes (Cundiff et al., 2013; Dasgupta, 2011; Starr, 2018). Implicit measures may better capture individuals’ gender- and race-based stereotyped associations because they may pick up on stereotyped associations that people are either unaware of or unwilling to report explicitly (Dasgupta, 2004, 2009; Greenwald et al., 2002). Thus, implicit measures may be better than explicit stereotypes in predicting outcomes (e.g., Cvencek, Meltzoff, et al., 2021; Starr, 2018).
Regardless of students’ gender or URM status, pSTEM explicit and implicit identities were significantly related to expectancy and value beliefs. In many cases, identity mediated the relationship between stereotyped associations (especially implicit ones) about gender and race and pSTEM outcomes. In a similar manner, past research found STEM identity was a mediator between implicit gender–STEM associations and outcomes (Cundiff et al., 2013; Dunlap & Barth, 2019; Starr, 2018).
Practical Implications
On a positive note, many women and URM students reported observing pSTEM role models, and many students disavowed stereotypical racial and gender associations with pSTEM. Accordingly, we found that having same-gender and same-race role models was related to lower implicit and explicit stereotyped associations among women and URM students in our sample. This was especially true among URM women. Thus, one potential direction for future research and teachers in pSTEM is to develop interventions using same-gender and same-race role models or introduce diverse role models in classroom curricula (e.g., Johnson et al., 2019; Shin et al., 2016; also see Gladstone & Cimpian, 2021, for a review and recommendations). In addition, schools and universities can educate students about gender and racial bias in pSTEM (e.g., Farrell et al., 2020). However, researchers and educators should be careful in the design of any program. A recent meta-analysis found mixed results in interventions aimed at reducing various types of implicit bias (FitzGerald et al., 2019; also see Pietri et al., 2019, on the potential limitations of interventions focusing solely on bias awareness).
Limitations and Future Directions
We acknowledge some of our study’s limitations and recommend corresponding directions for future research. First, our findings are correlational. Whereas they suggest possible patterns of influence, these effects need to be tested in experimental (e.g., Pietri et al., 2020) and longitudinal research (e.g., Starr & Simpkins, 2021).
Second, our URM sample was constituted primarily of Latinx students, with relatively few Black or Indigenous participants. We expect the observed processes would generally extend to other URM groups. Nonetheless, it behooves future researchers to check whether there are meaningful differences among URM groups in the kinds of patterns observed here. Furthermore, our sample was drawn from psychology courses and only a third of the sample were pSTEM majors. Prior studies, though limited, suggest that STEM stereotypes and identity-related findings from predominantly non-STEM participants may generalize to STEM participants (e.g., Cundiff et al., 2013; O’Brien et al., 2015). However, prior research also suggests that passion for STEM may buffer some of the negative impacts of sexism in STEM for girls and women (Robnett & John, 2020). Thus, it is possible that underrepresented pSTEM majors’ pSTEM identity and motivational beliefs may be less impacted by stereotypes compared to non-pSTEM majors. Future studies might examine similar research questions in a diverse sample of pSTEM majors.
Third, we designed our implicit race–pSTEM measure to examine implicit associations between URM versus non-URM people and pSTEM. The measure acted as one would expect in the model (i.e., negative relations with URM people’s STEM identity and outcomes, positive with non-URM people’s STEM identity and outcomes), and its internal reliability was acceptable. Although there was variability in responses, the average student in our sample did not implicitly associate pSTEM with non-URM persons. One possible reason was that rather than separately test participants’ implicit associations of pSTEM with each race/ethnic group, we combined Asian and White into a non-URM group, and Black and Latinx into a URM group. A prior study found that children and adolescents were significantly more likely to implicitly associate Asian faces than White faces with math (Cvencek, Nasir, et al., 2015). Furthermore, Asian students are not monolithic, and some Asian ethnic groups (e.g., Filipinx) are underrepresented in STEM (Kang et al., 2021). Relatedly, our study did not examine specific intersectional identities and stereotypes based on race and gender, such as Asian women or Latinx men (see Jaxon et al., 2019). Examining these intersections of race and gender may deepen our understanding of their unique effects on students’ experiences and motivation (see Mays & Ghavami, 2018).
Fourth, explicit stereotypes about race and gender were strongly correlated—especially among URM students. Because prominent persons in pSTEM are both White/Asian and men, this was not surprising. The strong overlap among these measures may have contributed to explicit stereotypes not being as consistently related to identity measures among URM students. The implicit associations, however, were more consistently related to the identity measures. In this manner, the implicit measures were not redundant with the explicit measures, in contrast to some critiques (e.g., Schimmack, 2021; also see Kurdi et al., 2021). The implicit measures may have been less prone to social desirability biases than were the explicit stereotyping scales.
Finally, when looking at between-group differences, we found evidence for gender- and race-based variations in experienced role models but not in students’ identity or motivational beliefs. However, it is also important to note that other studies have found that racially minoritized women indicated higher threat in STEM when compared to other groups (Casad et al., 2019; Rainey et al., 2018). One reason for the difference in findings may be that although we examined implicit and explicit STEM identity, we did not measure experiences with racial or gender discrimination. Future studies might examine similar research questions about role models and pSTEM identity that additionally consider students’ experiences with gender and racial bias in pSTEM (e.g., Alliman-Brissett & Turner, 2010; Berry et al., 2011; Brown & Leaper, 2010; Leaper & Starr, 2019; Robnett, 2016; Rogers et al., 2021). Furthermore, future studies might examine other factors that promote students’ pSTEM identity and motivation, particularly in the absence of available role models. Knowing both what helps and what hinders students’ success will best guide our theoretical models and interventions.
Conclusion
Women and minoritized persons from Black, Latinx, and Indigenous backgrounds remain underrepresented in pSTEM relative to men and persons from White or Asian backgrounds (NSF, 2021). These gender and race/ethnic imbalances may be partly attributed to the stereotypes that pSTEM workers are White or Asian men (Cheryan et al., 2015). These factors can undermine students’ developing sense of belonging or identity in pSTEM, which in turn may diminish their motivational beliefs. When both gender- and race-related biases are taken into account, we posited that women from URM backgrounds may indicate the greatest disadvantage in outcomes, while men from non-URM backgrounds may indicate the greatest advantage. The present study lent support for most facets of our hypothesized model, while considering both gender and race in observed pSTEM role models and pSTEM stereotyped associations in relation to students’ pSTEM identity and expectancy–value beliefs. Moreover, in this model, we tested both implicit and explicit stereotypes and identity. In these ways, our research strengthens and builds upon prior theory and research addressing possible reasons for the perpetuation of women’s and minoritized persons’ underepresentation in pSTEM fields.
Supplemental Material
sj-docx-1-gpi-10.1177_13684302221128235 – Supplemental material for Undergraduates’ pSTEM identity and motivation in relation to gender- and race-based perceived representation, stereotyped beliefs, and implicit associations
Supplemental material, sj-docx-1-gpi-10.1177_13684302221128235 for Undergraduates’ pSTEM identity and motivation in relation to gender- and race-based perceived representation, stereotyped beliefs, and implicit associations by Christine R. Starr and Campbell Leaper in Group Processes & Intergroup Relations
Footnotes
Acknowledgements
The authors thank Doug Bonett for his helpful statistical advice.
Funding
The author(s) disclosed receipt of the following financial support for the research, authorship, and/or publication of this article: This research was supported in part by a National Science Foundation Graduate Research Fellowship to the first author (Grant No. 2014186774) and a Spencer Foundation grant (Grant No. 201900111) to the second author.
Supplemental material
Supplemental material for this article is available online.
References
Supplementary Material
Please find the following supplemental material available below.
For Open Access articles published under a Creative Commons License, all supplemental material carries the same license as the article it is associated with.
For non-Open Access articles published, all supplemental material carries a non-exclusive license, and permission requests for re-use of supplemental material or any part of supplemental material shall be sent directly to the copyright owner as specified in the copyright notice associated with the article.