
Abstract
This study focuses on the formation, quantification and morphology of retained austenite in the heat-affected zone (HAZ) of a thermomechanically controlled processed high-strength steel. Physical simulation using dilatometry combined with high-energy X-ray diffraction was employed for in situ phase quantification, while various electron microscopy methods were used for microstructural investigation. Compared to the initial state, which contained approximately 1% retained austenite, the content increased by 1.9% in the coarse-grained HAZ and by 3.9% in the intercritically reheated coarse-grained HAZ. Some of the formed retained austenite appears as stand-alone phase in both zones. However, the majority seems to be present within various types of martensite–austenite constituents.
Keywords
Introduction
The superior specific strength of high-strength steels makes them a key material in achieving both economic efficiency and sustainability. Over the past decades, various groups of high-strength steels have been developed, employing different approaches in chemical composition and processing routes. 1 A prominent example is the group of thermomechanically controlled processed (TMCP) high-strength steels, which are widely used in applications including shipbuilding, offshore structures, building constructions and bridges. 2 These steels are intentionally microalloyed with elements such as Nb and Ti to enable a controlled final rolling in the austenitic region without recrystallisation, followed by accelerated cooling to produce a fine-grained microstructure.2–4 As a result, TMCP steel plates with strength levels up to 1300 MPa and adequate toughness are available from various manufacturers. 5
In welding of such TMCP high-strength steels, the most critical area for potential failure is the heat-affected zone (HAZ). Within this zone, the originally fine-grained microstructure experiences locally varying peak temperatures and cooling rates, which can lead to significant microstructural changes.6,7 In single pass welding, the most sensitive region in the sense of reduced toughness is the coarse-grained (CG) HAZ. When multiple welding passes are used, the intercritically reheated (IC) CGHAZ is known to develop the most detrimental microstructure for toughness.8–11 Consequently, numerous studies are available dealing with the detailed investigation of the ICCGHAZ in multipass high-strength joints. Usually, martensite–austenite (MA) constituents which consist of untempered martensite and retained austenite (RA) are considered the reason for the low toughness in this region.11–13 Lee et al. 12 correlated the loss of toughness with the amount of MA constituents present. However, Davis et al. 11 observed that the presence of MA constituents is not always detrimental. Instead, the morphology, hardness and distribution of these microstructural features are the key factors contributing to embrittlement. 11 In the ICCGHAZ, MA constituents and the corresponding RA can already form during continuous cooling following the coarse-grain heating cycle.14–16 However, necklace-type MA constituents, which are known to significantly reduce toughness, develop along prior austenite grain (PAG) boundaries during the subsequent reheating to the intercritical temperature region between AC1 and AC3.17,18 Li et al. 18 investigated the effect of this subsequent reheating peak temperature on the microstructure-toughness relationship of a TMCP high-strength steel. They reported that an increased peak temperature results in a higher volume fraction of reverted austenite with a lower C enrichment, and vice versa. Since the stability of reverted austenite primarily depends on its C enrichment, this behaviour has a crucial influence on the decomposition of reverted austenite during final cooling and the resulting microstructural constituents. 18 Overall, there is no doubt that the ICCGHAZ in multipass high-strength steel joints is the most sensitive region for embrittlement of welded TMCP steels. As mentioned, the low impact toughness is generally attributed to the formation of MA constituents. However, little attention has been given to RA beyond its presence within MA constituents. To reliably and statistically analyse this phase, advanced techniques such as synchrotron radiation are required.19,20 Furthermore, the results are significantly depended on the investigation method and sample preparation.21–23
Due to the limited understanding of RA beyond its presence in MA constituents in the ICCGHAZ, the current study focuses on the quantification and morphology of RA in a physically simulated ICCGHAZ of a TMCP high-strength steel. The inspiration for this scientific approach and the choice of RA as the main focus was our recent paper, 20 which concluded that the amount of RA has been often underestimated in studies about high-strength steels and weld metals. This was demonstrated by using high-energy X-ray diffraction (HEXRD) and Rietveld refinement to quantify the RA contents and compare them with results from electron microscopy measurements. 20 The methodological approach in the present study is similar but involves physically simulating the ICCGHAZ utilising a dilatometry setup while simultaneously conducting HEXRD measurements. This enables the in situ observation of RA formation with the corresponding quantification by Rietveld refinement. To further examine the morphology of RA, both as stand-alone phase and as part of MA constituents, scanning electron microscopy (SEM), electron backscatter diffraction (EBSD), scanning transmission electron microscopy (STEM) and transmission Kikuchi diffraction (TKD) were applied.
Methods
Dilatometry testing and phase quantification
The investigated material is a 30 mm thick TMCP high-strength heavy plate with a fine-grained bainitic microstructure and a minimum yield strength of 700 MPa standardised according to EN 10149-2, 24 with the chemical composition listed in Table 1. The dilatometry specimens, with a length of 10 mm and a diameter of 5 mm, were taken from the heavy plate perpendicular to the rolling direction. The physical simulation was conducted on a dilatometry setup installed at the beamline P07b at the Deutsches Elektronen-Synchrotron (DESY) in Hamburg, Germany. 25 To simulate the CGHAZ, the specimen was heated at 100 °C/s to 1350 °C, held for 2 s, and cooled to room temperature at a cooling rate of 30 °C/s, corresponding to a t8/5 time of 10 s. For simulating the ICCGHAZ, the specimen was held for 10 s at 150 °C (simulating the interpass temperature) after the initial coarse-grain heating (same procedure as for the CGHAZ) and then reheated to 800 °C at a heating rate of 100 °C/s. It was held at this temperature for 2 s and cooled to room temperature at a cooling rate of 30 °C/s, as depict in Figure 1(a). Simultaneously with the dilatometry, HEXRD was performed using a 0.8 mm × 0.8 mm sized beam with an average photon energy of 87.1 keV, that is a wavelength of 0.0142347 nm. A PerkinElmer XRD 1621 area detector was used to detect the transmitted signal, with the detector distance (1540 mm) and the orientation calibrated using LaB6 standard powder. A schematic of the experimental setup is illustrated in Figure 1(b). The azimuthal integration of the 2D diffraction patterns was performed utilising the Python library PyFAI. 26 To quantify the RA phase content, Rietveld refinement was conducted using the open-source software Profex. 27 In the fully austenitic phase region, the diffraction patterns started to become spotty due to grain coarsening, making Rietveld refinement no longer reliable. Consequently, the RA content in this region was assumed to be 100%.
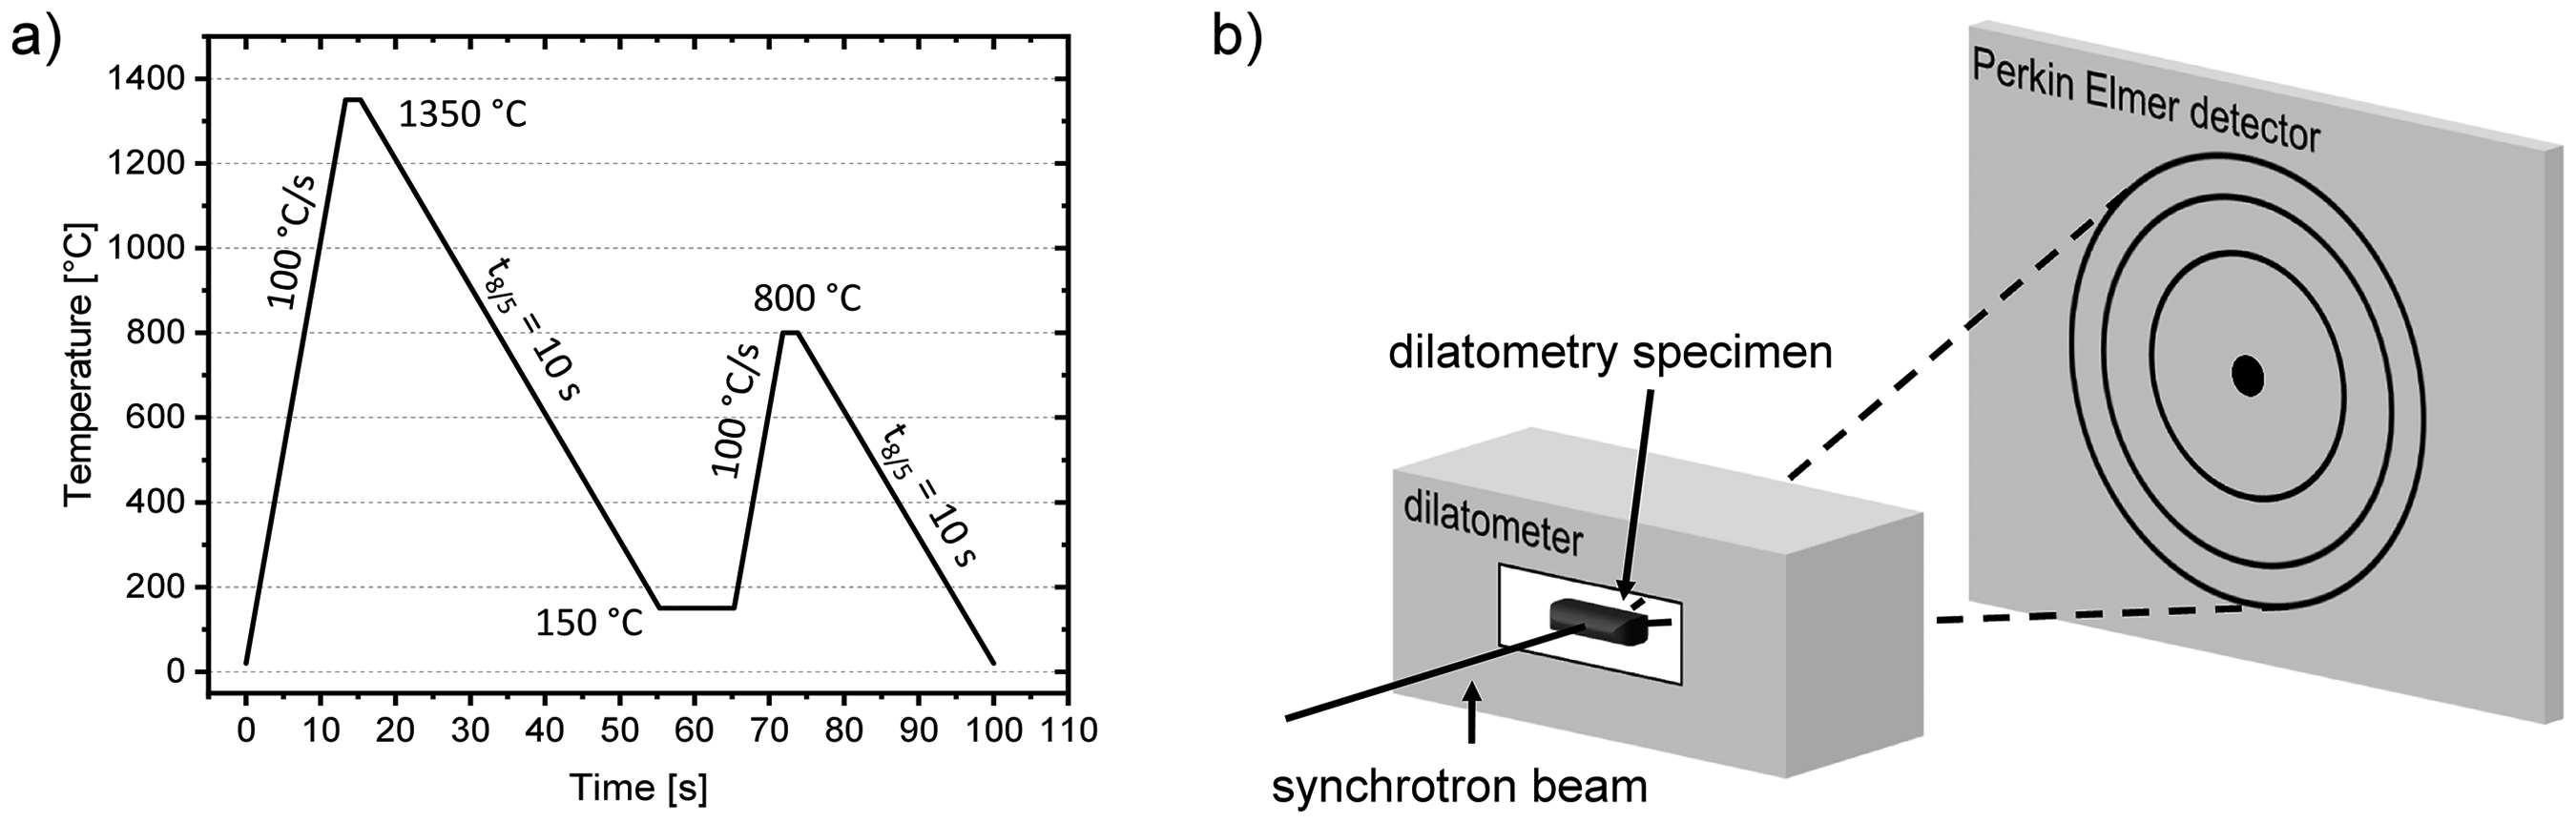
(a) Temperature profile of the physical simulation for the ICCGHAZ. (b) Schematic representation of the combined dilatometry and HEXRD setup.
Chemical composition of the TMCP high-strength heavy plate.

Microstructural investigation
The dilatometry specimens were cut in the middle and embedded with the resin Polyfast from Struers. After grinding and polishing with diamond suspensions down to 1 µm particle size, the specimens were etched with the etchant Nital (3% HNO3 with ethanol). SEM observations were conducted in a focussed ion beam (FIB) FEI Versa 3D DualBeam in the secondary electron contrast mode at an acceleration voltage of 10 kV. For the EBSD evaluation, the specimens were subjected to additional chemical–mechanical polishing using OPS from Struers. EBSD was conducted using the same microscope, equipped with an EDAX Hikari EBSD detector. The applied acceleration voltage was 20 kV and the step size for the low- and high-magnification images 100 nm and 50 nm, respectively. Furthermore, all measurements with a Confidence Index below 0.05 were cleaned using the ‘neighbour phase correlation’ clean-up function in the software EDAX OIM Analysis 8. High-angle grain boundaries with a misorientation angle greater than 15° are marked as black lines in the inverse pole figure (IPF) maps. The TEM lamella was prepared utilising FIB lift-out procedure and imaged with a FEI STEM detector at 30 kV in the FEI Versa 3D DualBeam. For the TKD measurements, the same detector and clean-up were applied as for the EBSD analysis. The acceleration voltage was 30 kV and the step size 20 nm.
Results
Formation of retained austenite
To first examine the sole effect of the coarse-grain heating cycle, Figure 2(a) shows the in situ RA formation during the physical simulation of the CGHAZ. The black line corresponds to the temperature profile, while the dashed green line indicates the RA content evaluated with HEXRD and Rietveld refinement. In the initial state of the TMCP steel, a RA content of 0.9% is present. Immediately before reaching the ferritic/austenitic phase region, the RA content decreases due to tempering at the highest possible temperature without austenitic phase transformation. After heating to 1350 °C and cooling to room temperature with a cooling rate of 30 °C/s, 2.8% RA remains stable (increase of 1.9% RA). The diffraction pattern and the corresponding Rietveld refinement of the final measurement, marked by the black dot in Figure 2(a), are shown in Figure 2(b), containing three austenite (γ) and three ferrite (α) peaks. The small unindexed peaks correspond to higher harmonics of the austenitic and ferritic reflections, which arise from the technical design of the P07b beamline at DESY, where the absence of additional optics results in this beam characteristic. However, these peaks do not indicate the presence of additional phases and can be simply excluded from Rietveld refinement without affecting the results.
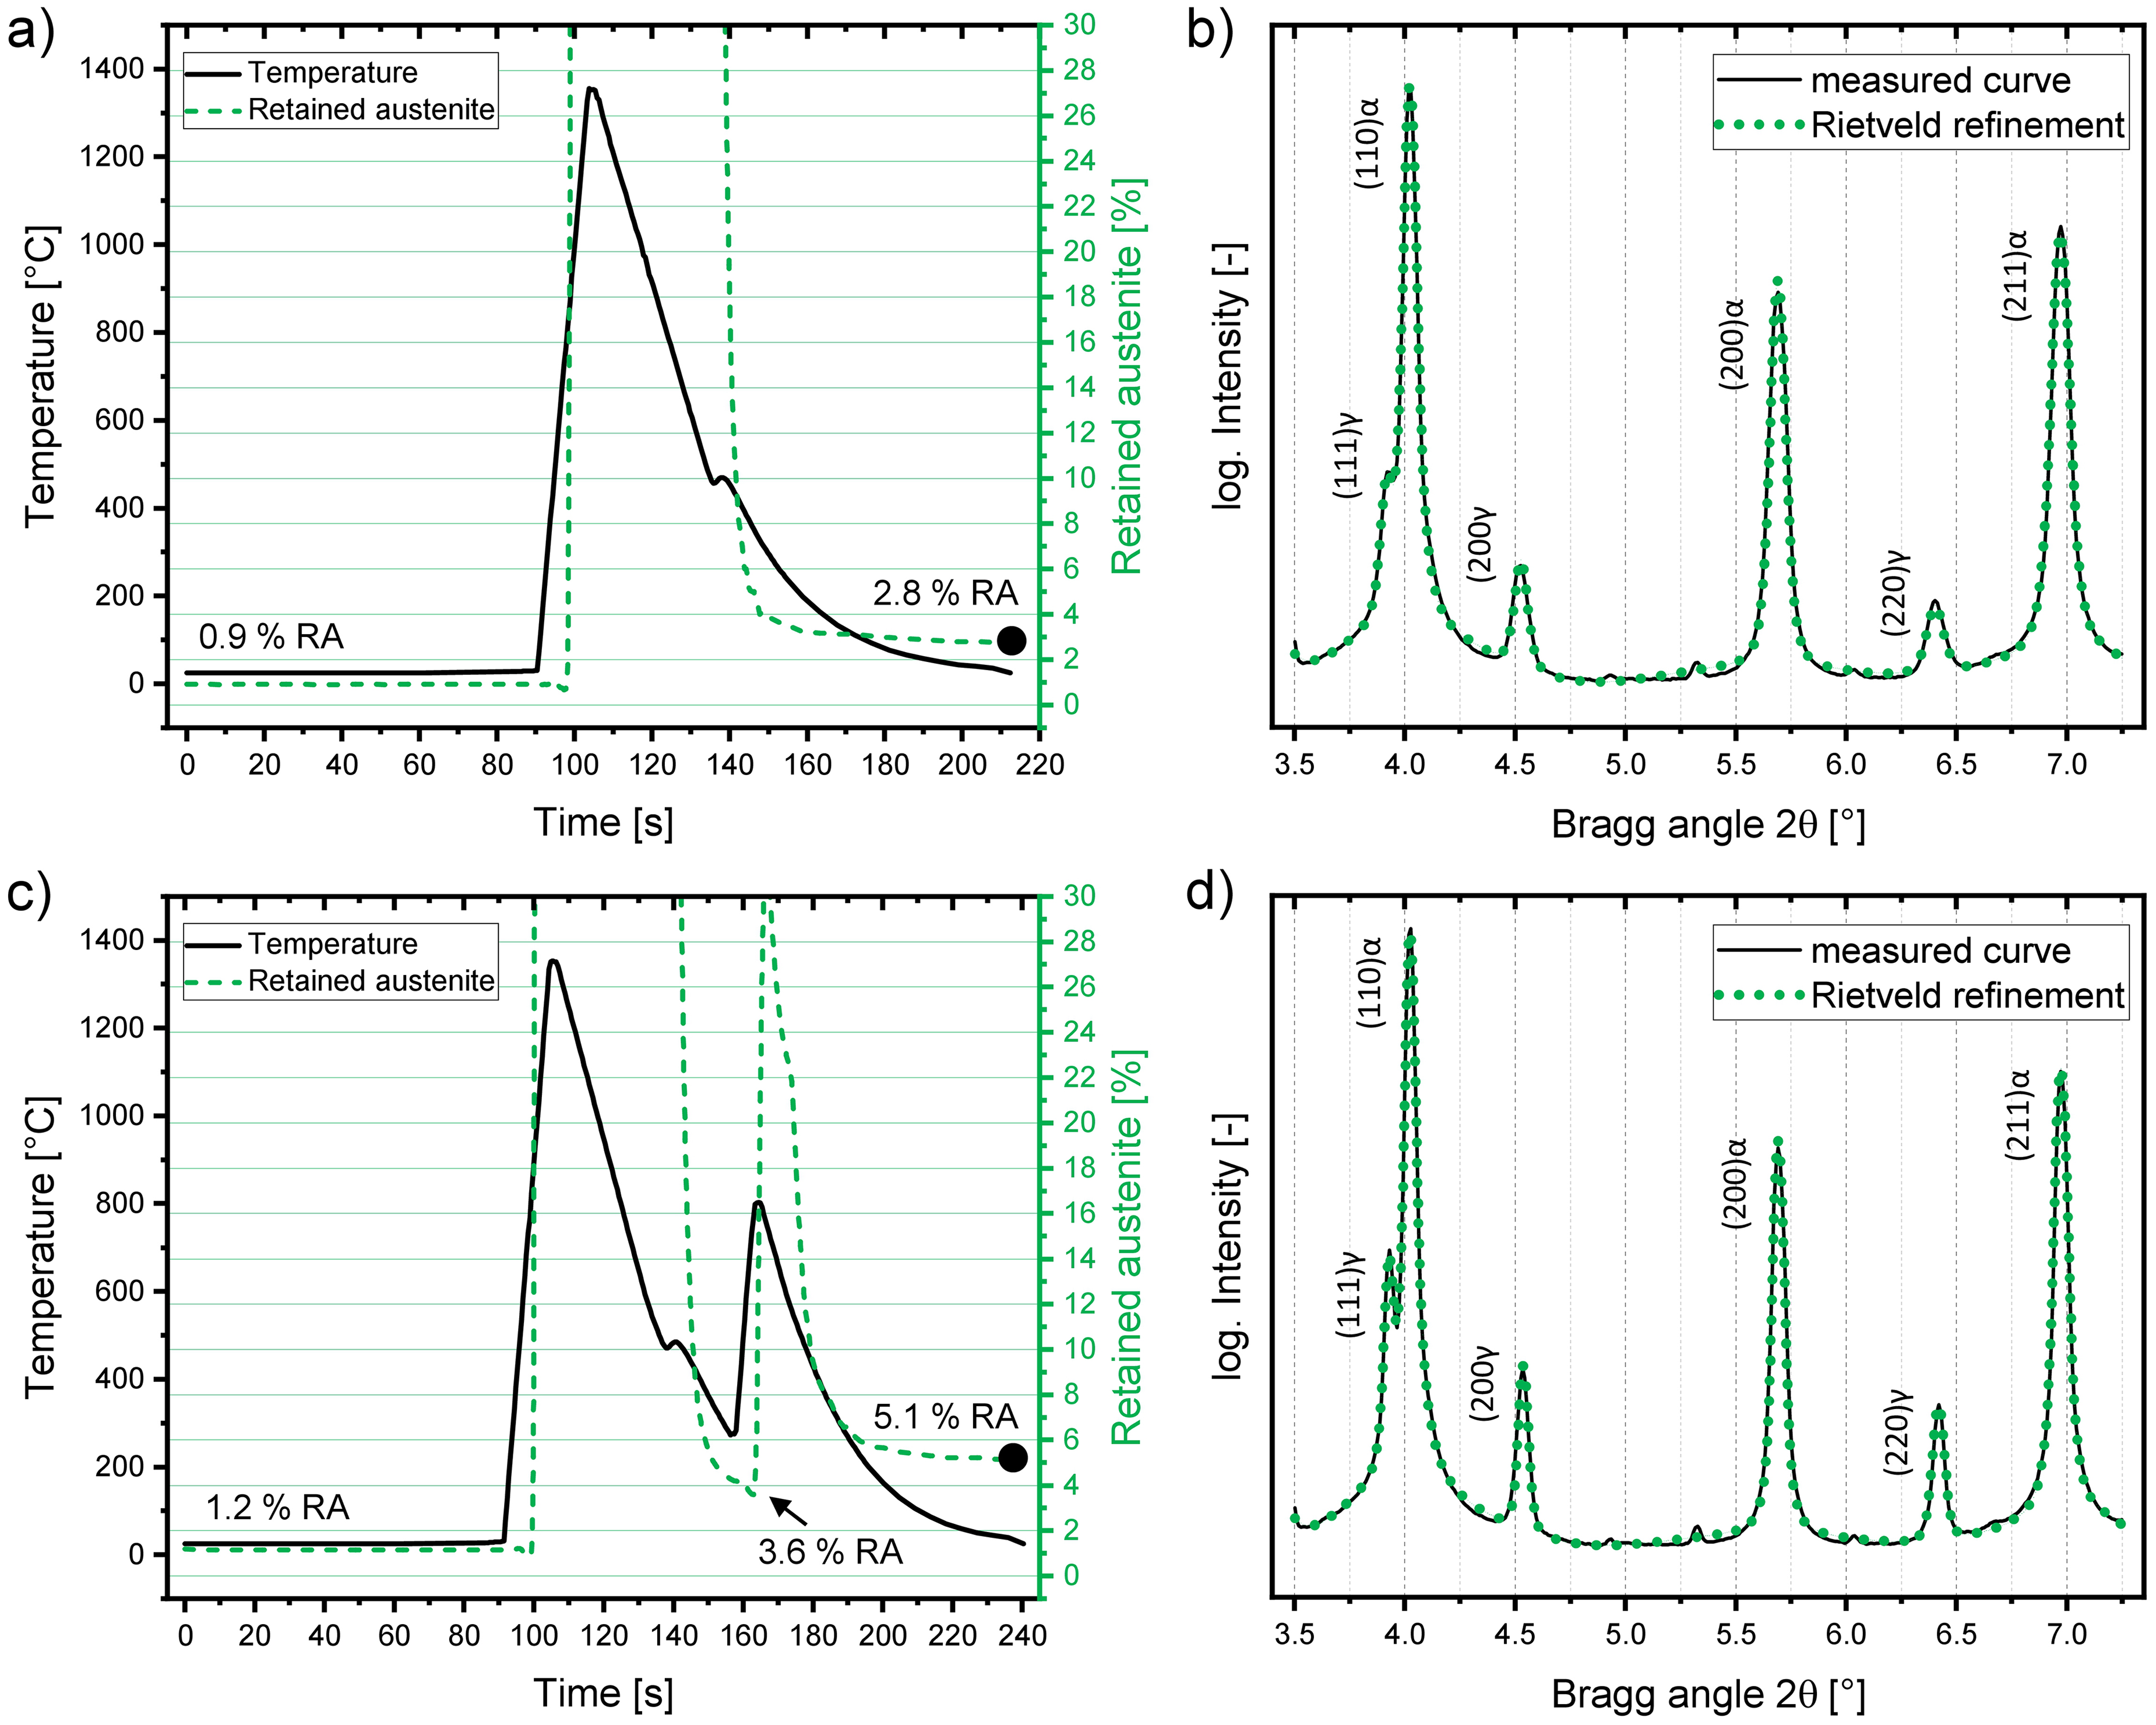
(a) Temperature profile and in situ RA content of the physically simulated CGHAZ. (b) Diffraction pattern and the corresponding Rietveld refinement of the final HEXRD measurement at room temperature, indicated by the black dot in (a). (c) Temperature profile and in situ RA content of the physically simulated ICCGHAZ. (d) Diffraction pattern and the corresponding Rietveld refinement of the final HEXRD measurement at room temperature, indicated by the black dot in (c).
The results of the in situ analysis of RA formation during the physical simulation of the ICCGHAZ are depicted in Figure 2(c). In the initial state the RA content is about 1.2%. After heating to 1350 °C and cooling to 270 °C with a cooling rate of 30 °C/s, the matrix becomes ferritic again with an increased amount of RA. Due to the heat of crystallisation, the intended temperature profile could not be fully followed, as seen by comparing Figures 1(a) and 2(c). The lowest RA value before intercritical reheating is 3.6%, immediately before reaching the ferritic/austenitic phase region. At 800 °C, approximately 30% austenite is present. After cooling to room temperature, 5.1% of RA remains stable. The diffraction pattern and Rietveld refinement of the last HEXRD measurement, marked by the black dot in Figure 2(c), are shown in Figure 2(d). Overall, these findings indicate that 3.9% RA is formed in the ICCGHAZ compared to the initial state of the TMCP steel. As mentioned before, an increase of about 1.9% is present in the CGHAZ. Consequently, it can be estimated that RA formation in the ICCGHAZ is equally influenced by coarse-grain heating and intercritical reheating.
Morphology of retained austenite
To reveal the microstructure, SEM images of the physically simulated CGHAZ and ICCGHAZ in regions containing PAG boundaries are shown in Figure 3(a) and (b), respectively. In this study, the term PAG always refers to the prior austenitic grains of the coarse-grain heating cycle. The CGHAZ is fully bainitic, with certain areas identifiable as lower bainite owing to the presence of carbides within the bainitic laths, 28 as observed in Figure 3(a). An increased amount of these carbides (typically cementite) would normally also be visible in the diffraction pattern in Figure 2(b), as reported in Ref. 19 However, the phase fraction appears to be too low to allow the detectability of the corresponding peaks with the selected HEXRD parameter set. In addition to these carbides, some elevated islands appear to be MA constituents, as highlighted in the inset in Figure 3(a). In the ICCGHAZ in Figure 3(b), necklace-type MA constituents are present along the PAG boundaries. In the inset of the necklace-type MA constituents in the upper right corner, auto-tempered carbides are detectable. The remaining matrix consists of a tempered bainitic microstructure with again several elevated island, which correspond to carbides and differently shaped MA constituents.
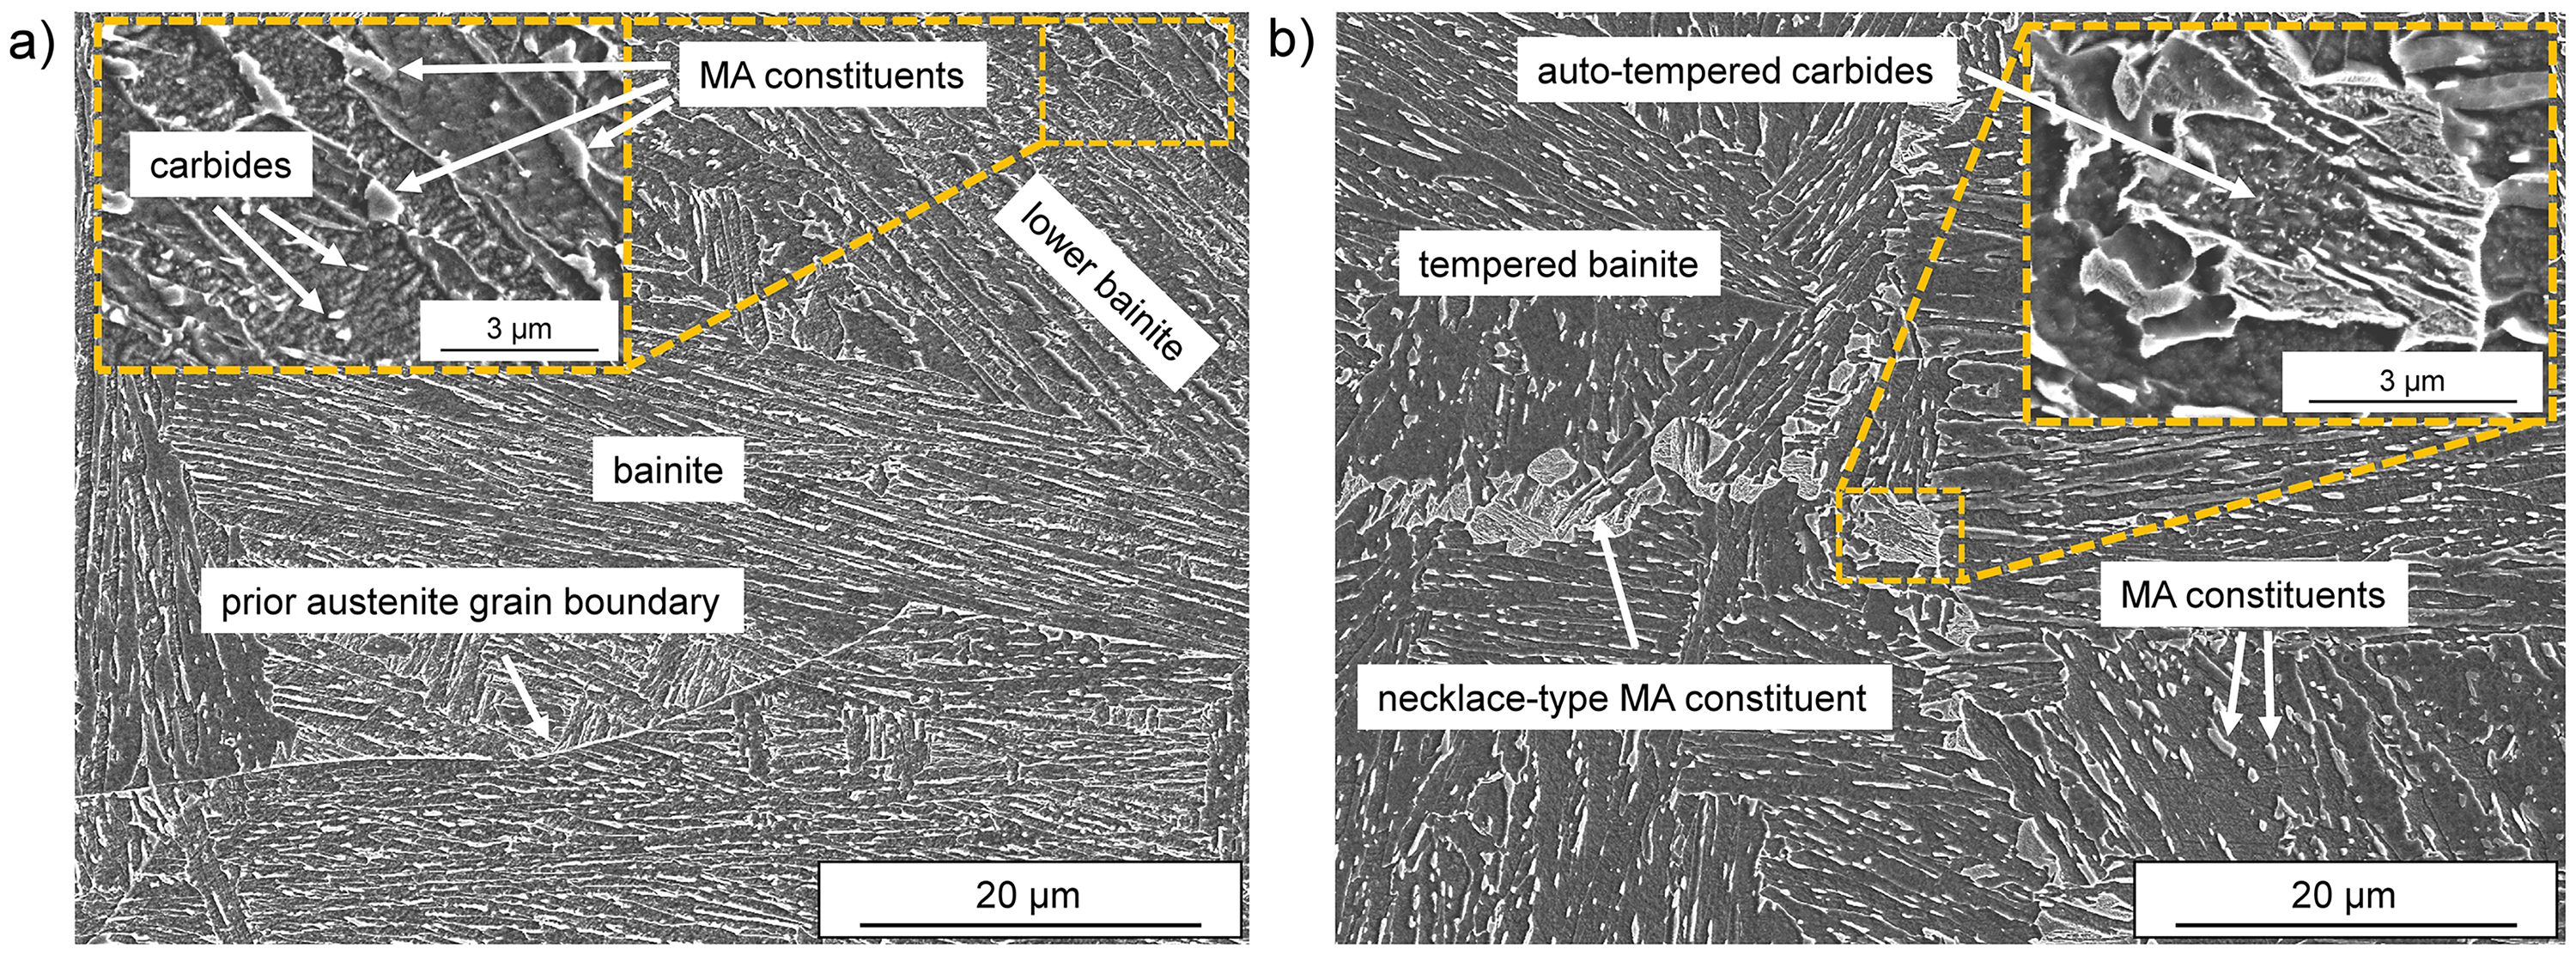
SEM image showing the nital-etched microstructure of the (a) CGHAZ and (b) ICCGHAZ. The areas marked by the orange dashed rectangles are shown enlarged in the corresponding insets.
Figure 4(a) shows the IPF map of the CGHAZ, containing a triple point of PAG boundaries. The region marked by the orange dashed rectangle is analysed in detail as IPF and phase map in Figure 4(b) and (c), respectively. About 0.3% RA was detected in this region by EBSD. The coarse RA islands, highlighted by the white rectangle, are located within the PAG. As visible in Figure 4(b), these islands are adjacent to low-angle grain boundaries, indicated by the slight change in the blue colour. Many of the remaining detectable RA regions are located at high-angle grain boundaries within the PAG. Figure 4(d) illustrates that the former PAG boundary regions (marked as region within the parallel yellow lines) are completely broken up in the ICCGHAZ caused by the formation of necklace-type MA constituents during the intercritical reheating. The previously sharp boundaries are now replaced by a bimodal distribution of coarse and fine grains. An area corresponding to the necklace-type MA constituent is highlighted by the black dashed rectangle in Figure 4(d) and further analysed as IPF map and phase map in Figure 4(e) and (f), respectively. This region contains 0.3% RA, primarily as stand-alone phase, as exemplified by the black rectangles. Furthermore, some agglomerations of fine grains are present within the necklace-type MA constituents as marked by the black circles. These agglomerations fit the morphology of massive-type MA constituents. 29 Only minor amounts of RA are detected in these MA constituents, although a locally elevated RA content would be expected. This is attributed to the limited detectability of RA in MA constituents at the current EBSD resolution, as discussed elsewhere. 20
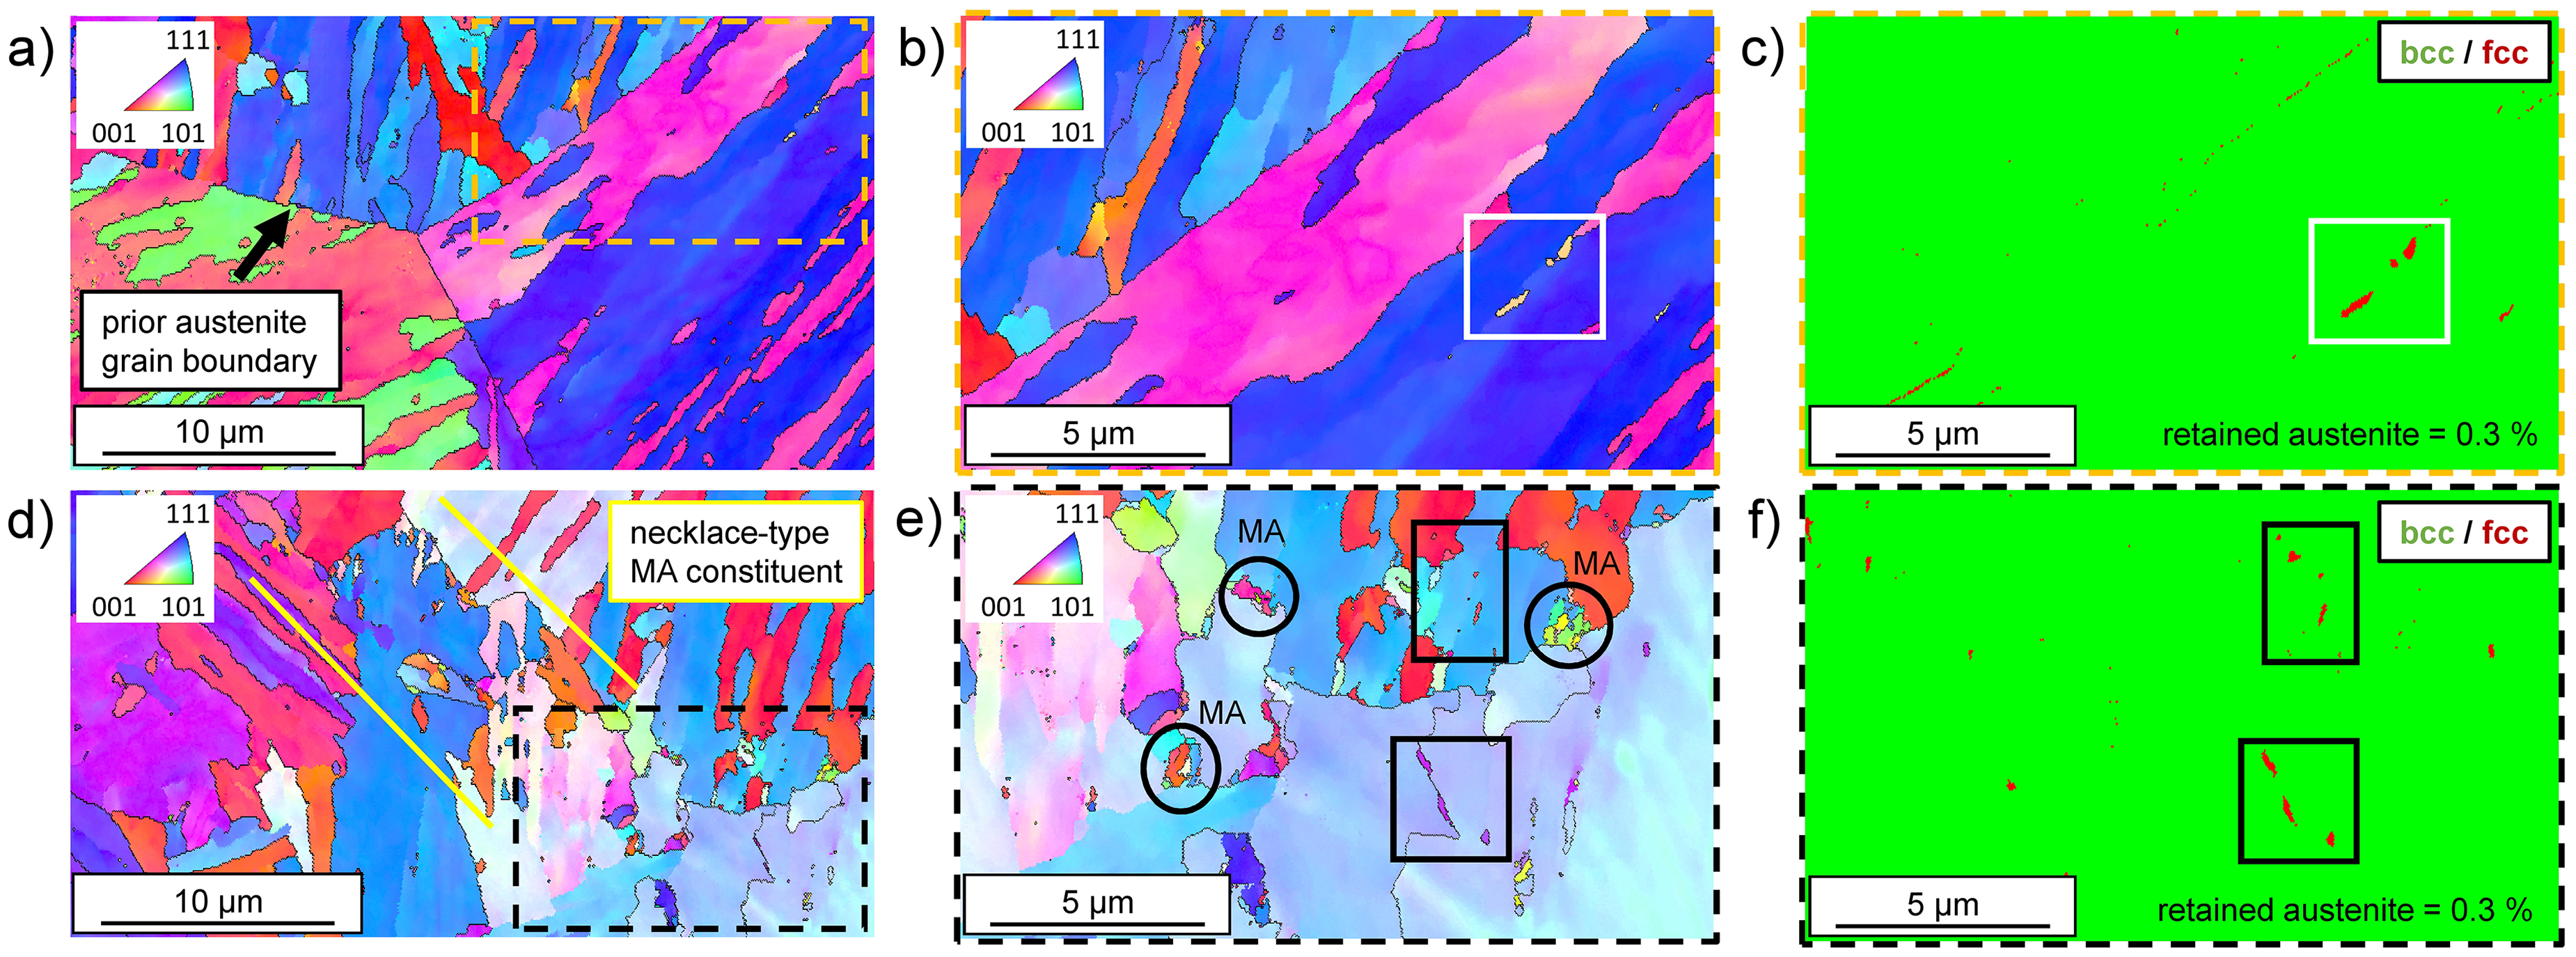
(a) IPF map of the physically simulated CGHAZ. (b) IPF map and (c) phase map showing a detailed analysis of the region highlighted by the orange dashed rectangle in (a). (d) IPF map of the physically simulated ICCGHAZ. (e) IPF map and (f) phase map showing a detailed analysis of the region highlighted by the black dashed rectangle in (d). The black and white circles and rectangles indicate positions containing RA and MA constituents.
Concluding the SEM and EBSD investigations, it can be stated that most of the elevated islands (with the exception of the small carbides) within the PAGs of both the CGHAZ and ICCGHAZ correspond to either stand-alone RA, or MA constituents. The necklace-type MA constituents in the ICCGHAZ consist of smaller MA constituents of different morphologies and stand-alone RA. To further analyse this, a TEM lamella was prepared from an elevated island at the boundary region of a necklace-type MA constituent in the ICCGHAZ, marked by the orange circle in Figure 5(a). The lift-out region is defined as a red dashed rectangle. In the bright field STEM image of this lamella in Figure 5(b), the boundary between the necklace-type MA constituent and the PAG matrix is clearly visible and marked with a white line. Furthermore, some auto-tempered carbides are present within the necklace-type MA constituent. The previously defined elevated island, marked again by the orange circle, can be observed in the upper left corner of the lamella and is surrounded by an area without any grain boundaries. As visible in Figure 5(c), this elevated island itself contains numerous small, barely detectable grains, which is characteristic for MA constituents due to large residual stresses and lattice distortions and the corresponding low quality of the diffraction patterns.30,31 This allows us to suggest that the majority of the elevated islands within the PAGs are considered to be small differently shaped MA constituents and marked as slender- or dot-type constituents in Figure 5(a). 32 Within the necklace-type MA constituent, the density of low- and high-angle grain boundaries is high. Moreover, small MA constituents, similar to the previously defined elevated island, are present. However, again, no reliably detectable RA is observed, as shown in the TKD phase map in Figure 5(d).
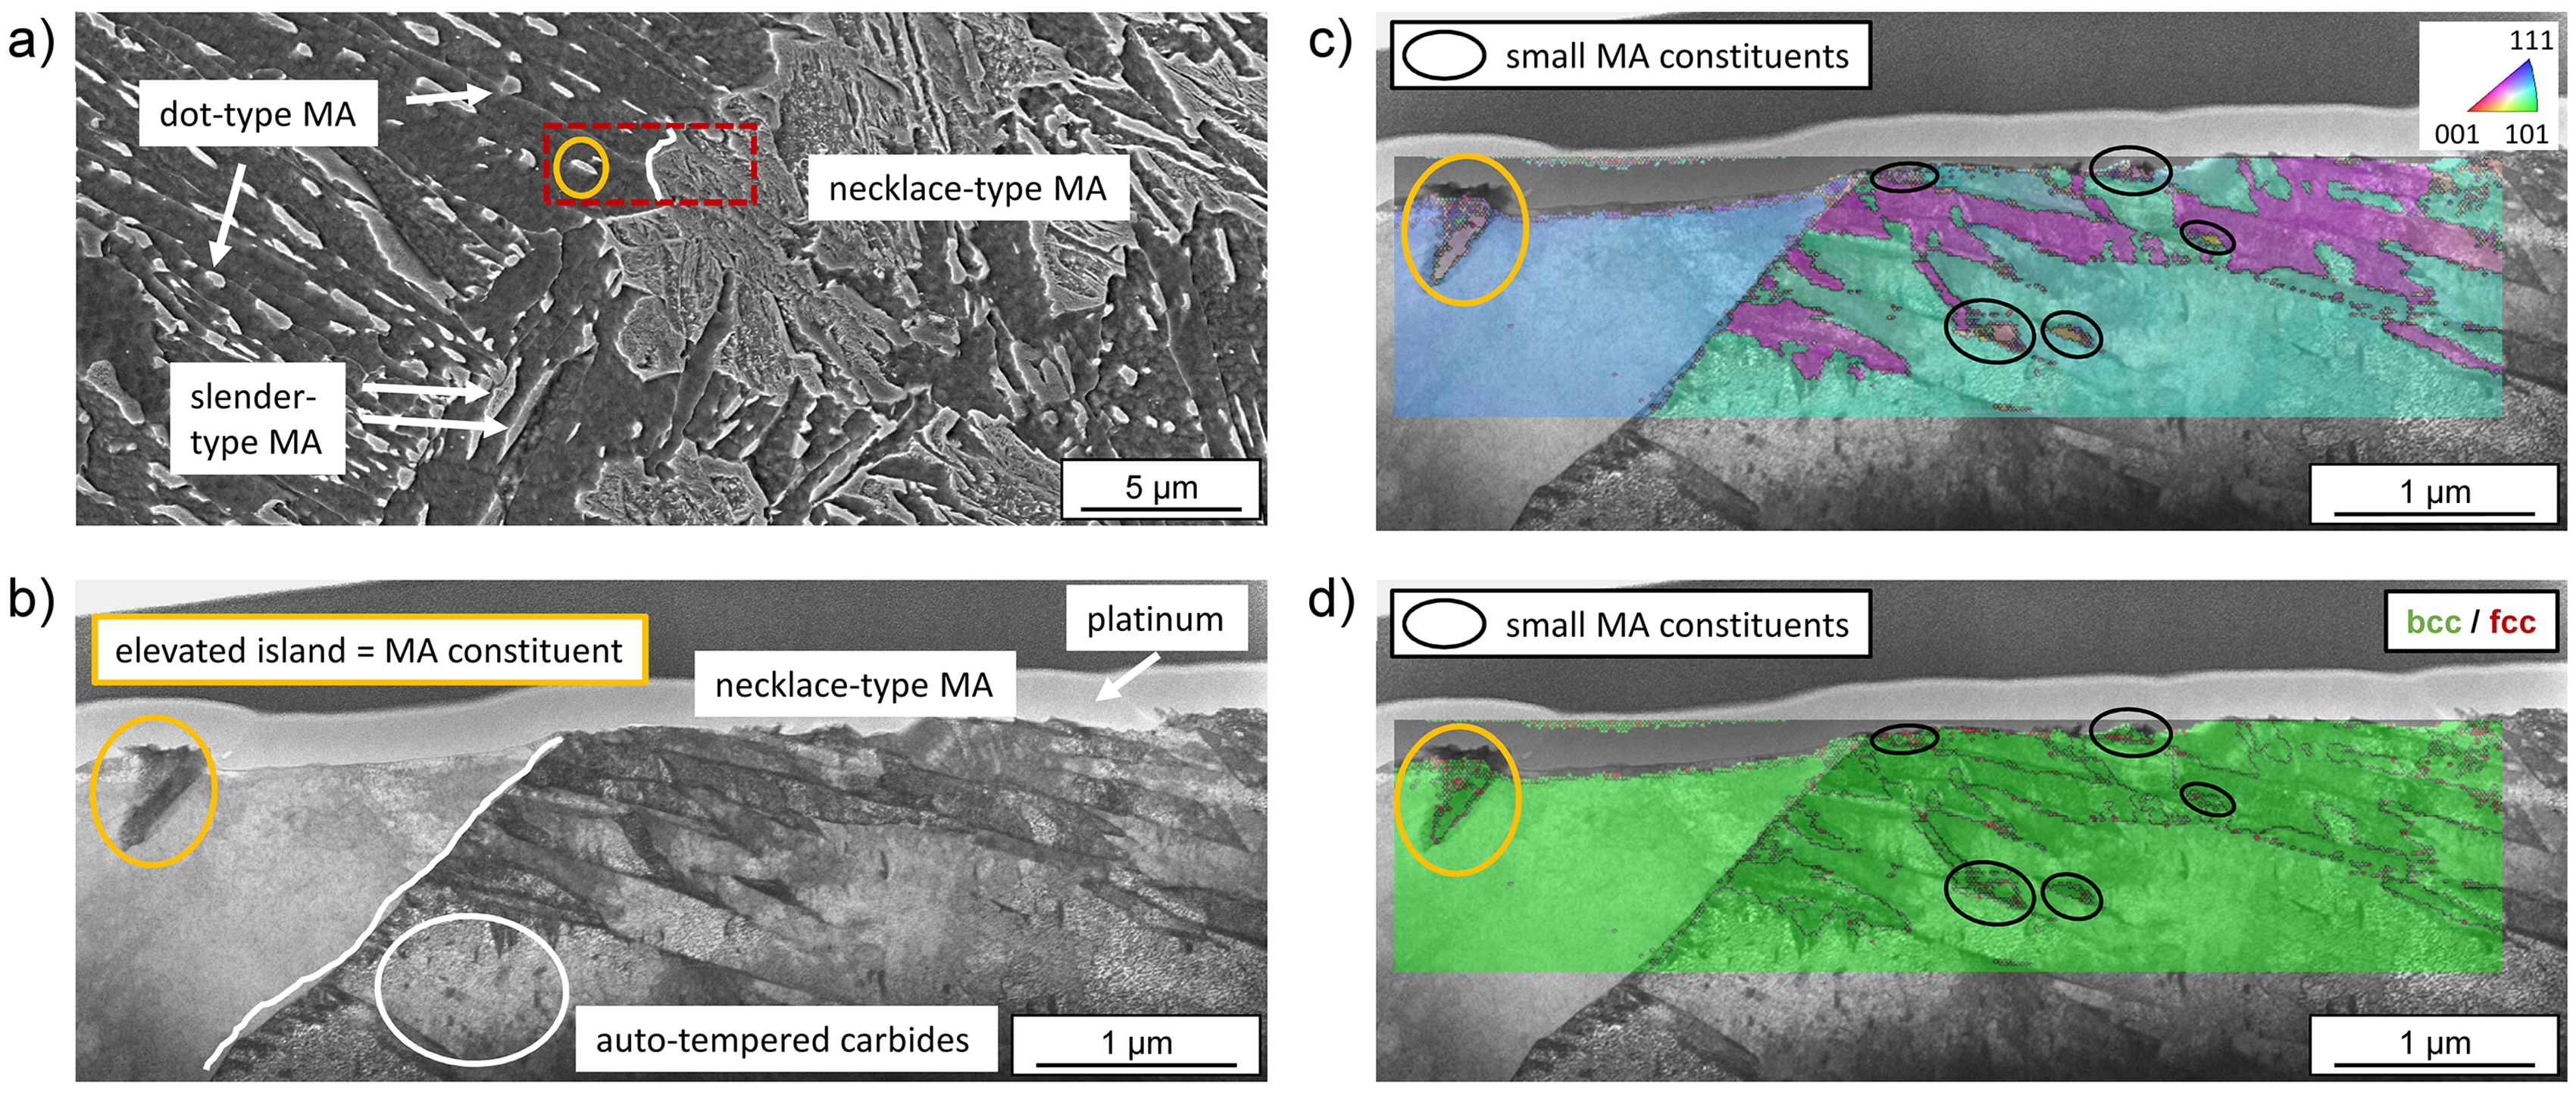
(a) SEM image of the ICCGHAZ containing different types of MA constituents. (b) Bright field STEM image of the region marked with the red dashed rectangle in (a), showing the border region of a necklace-type MA constituent. (c) STEM image overlaid with a TKD-IPF map. (d) STEM image overlaid with a TKD phase map.
Discussion
Quantification of retained austenite
As shown in the previous chapters, RA in MA constituents is barely detectable via EBSD and TKD. Furthermore, sample preparation and missing constraint in the surface region lead to RA transformation, resulting in a lack of this phase.21–23,33 This explains the strong deviation of RA content when comparing the EBSD results (0.3% at ICCGHAZ) with the HEXRD results (5.1% at ICCGHAZ). For a detailed explanation of this subject, however, the authors want to refer to our previous study. 20
Coarse-grained heat-affected zone
Figure 2(a) shows that 1.9% RA (increase from 0.9% to 2.8%) is formed during coarse-grain heating at 1350 °C, followed by cooling at 30 °C/s (t8/5 = 10 s). This increase in RA in the CGHAZ of TMCP high-strength steels has barely been mentioned or investigated in the existing literature. Solely, Ref. 34 provides a quantification of the RA content in such steels in different regions of the HAZ. However, the findings of that study do not align with the present results. While RA is observed in the base metal and the fine-grained HAZ via laboratory XRD, it is absent in the CGHAZ. Accordingly, even a decrease in RA content after coarse-grain heating is reported in Ref.. 34 In our present study, in contrast, the increase in the RA content from the initial state to the CGHAZ is clearly demonstrated with robust statistics. With the beam size of 0.8 mm × 0.8 mm and dilatometry samples with a diameter of 5 mm, the investigated region contains a volume of more than 3 mm3, a statistic that cannot be delivered by laboratory XRD or EBSD. Furthermore, due to the transmission mode of HEXRD, the main region investigated is the bulk of the sample rather than its surface. This excludes potential artefacts associated with the surface preparation procedure to influence the measurement results. 23
The open question now is the mechanism behind the increase in RA content in the CGHAZ of the TMCP high-strength steel used. One possible explanation is that the coarse grains offer fewer nucleation sites for the ferritic transformation, resulting in a delay and shift of the transformation onset towards longer times. 35 Thus, depending on the initial microstructure, a shift towards displacive microstructures, such as bainite and/or martensite can be triggered by coarser grains at equivalent cooling conditions, as demonstrated by several CCT diagram studies.36–38 This change in the microstructural constituents could then lead to different RA content levels. However, in the current study, the CGHAZ remains completely bainitic, with no martensitic regions. The possible effect of differences in the C-distribution behaviour on the stability of RA, arising from slight variations in bainite morphologies, is expected to be negligible.39,40 The high temperature during coarse-grain heating could also lead to a higher C content in solution (dissolution of, e.g. carbides) during austenitisation and, thus, stabilise more RA to room temperature. 41 Although, the C content in the current alloy is low, this effect could slightly contribute to the increase of RA in the CGHAZ. Another possible explanation for the rising content of RA would be an increased amount of MA constituents in the CGHAZ compared to the initial state. Such MA constituents are known to form in the CGHAZ and were also identified in the present study.14–16 However, a quantitative comparison of the RA content within these MA constituents relative to the initial state is missing in literature. This is likely due to the difficulty in reliably detecting both small and coarse MA constituents in a statistically meaningful way with methods such as EBSD, which can also reveal the phase morphology and composition. Furthermore, even if such quantification were possible, it would be difficult to detect RA in these MA constituents without high-resolution methods such as TEM, which are limited by low statistical representativeness.
Overall, an increase in the RA content from the initial state to the CGHAZ of the current TMCP high-strength steel can be confirmed. Based on the findings of the present study, the most plausible explanation for this phenomenon is the formation of MA constituents in the CGHAZ, which incorporate the RA.
Intercritically reheated coarse-grained heat-affected zone
Compared to the initial state, the RA content increased by 3.9% (from 1.2% to 5.1%) after the heating cycle for the ICCGHAZ. According to the previous chapter, 1.9% of this increase can be attributed to the coarse-grain heating cycle. Consequently, 2.0% of the RA forms during intercritical reheating. The RA that remains stable from the coarse-grain heating cycle appears to be located in MA constituents and as stand-alone phase within the PAGs, as the elevated islands from the CGHAZ still exist after intercritical reheating, see Figure 3. The main difference in the microstructures before and after intercritical reheating is the formation of necklace-type MA constituents along the PAG boundaries. As shown by the black rectangles and circles in Figures 4 and 5, these necklace-type MA constituents are themselves composed of smaller, variably shaped MA constituents as well as stand-alone RA. Consequently, the RA formed during intercritical reheating is expected in these regions. As was already the case in the CGHAZ, the stand-alone RA can be identified via Kikuchi patterns. The RA within the small MA constituents can be only anticipated due to insufficient resolution of both EBSD and TKD.
The formation of necklace-type MA constituents along the PAG boundaries following intercritical reheating is well documented in the literature.17,18,30 Their amount and morphology is attributed to the peak temperature of the secondary reheating in the intercritical region between AC1 and AC3.18,42,43 During this reheating process, C can segregate into the reverted austenite due to its higher solubility compared to the ferritic matrix.11,18,44 This leads to an increased C content within the formed MA constituents as confirmed by Li et al. 45 Consequently, the elevated C content in the necklace-type region can stabilise austenite as stand-alone phase and within MA constituents down to room temperature, leading to an increased amount of RA in the ICCGHAZ. This increase in RA, caused by the formation of additional MA constituents in the ICCGHAZ, further supports the assumption made in section ‘Coarse-grained heat-affected zone’ that the rise of the RA content in the CGHAZ is also driven by the increased presence of MA constituents.
Conclusions
The present study deals with the quantification, formation and morphology of RA in the CGHAZ and ICCGHAZ of a TMCP high-strength steel. Physical simulations were conducted using dilatometry, accompanied by simultaneous phase quantification through HEXRD and Rietveld refinement. The morphology of the microstructural constituents was analysed using SEM, EBSD, STEM and TKD. Derived from this analysis following conclusions can be drawn:
The in situ monitoring of the phase evolution revealed a substantial increase of 1.9% RA (from 0.9% to 2.8%) in the CGHAZ and 3.9% RA (from 1.2% to 5.1%) in the ICCGHAZ compared to the initial condition. Consequently, in the ICCGHAZ about half of the RA is already formed by the coarse-grain heating. Such high values of RA are rather unexpected in literature, since microscopy- and laboratory XRD-based analysis reveal significantly lower values, owing to limited resolution and sample preparation effects. In the CGHAZ, RA was observed only as stand-alone phase. However, numerous MA constituents were detected. Although RA could not be resolved within these constituents, their presence may explain the increase in RA during coarse-grain heating. In the ICCGHAZ, some of the RA from the coarse-grain heating still consists within the PAGs as stand-alone phase or as part of MA constituents. However, the newly formed RA from the intercritical reheating is located within the necklace-type MA constituents along the PAG boundaries. These necklace-type MA constituents, which are known to deteriorate toughness, exhibit a bimodal microstructure and consist both stand-alone RA and various types of further MA constituents.
The detailed experimental observation of the RA increase from the initial microstructural state of the TMCP high-strength steel to the CGHAZ and ICCGHAZ represents a significant contribution to the current state of the art, particularly because HEXRD provides high statistical reliability and is largely independent of sample preparation. Moreover, the present study is among the first to perform in situ quantification of RA during a physical simulation of the HAZ in high-strength steels.
Footnotes
Acknowledgements
The authors acknowledge DESY (Hamburg, Germany), a member of the Helmholz Association HGF, for the provision of experimental facilities. Parts of this research were carried out at PETRA III. Beamtime was allocated for proposal H-20010018. The authors would also like to thank Benjamin Seligmann and David Obersteiner for performing the synchrotron measurements and assisting with data evaluation.
Ethical approval
Not applicable.
Participant consent
Not applicable.
Author contributions
Daniel Schrittwieser did conceptualisation, methodology, investigation, writing – original draft, writing – review and editing, visualisation and project administration. Thomas Willidal did resources, writing – review and editing. Oleksandr Glushko did conceptualisation, writing – review and editing. Ronald Schnitzer performed conceptualisation, resources, supervision, writing – review and editing.
Funding
The authors received no financial support for the research, authorship and/or publication of this article.
Declaration of conflicting interests
The authors declared no potential conflicts of interest with respect to the research, authorship and/or publication of this article.
Data availability statement
Data will be made available on request.