
Abstract
Social mobility has become a key public policy issue across the Western world. But who do the upwardly and downwardly mobile vote for? Does their voting behaviour remain the same as their peers in their social origin class, or does it quickly assimilate to mimic the behaviour of others at their social destination? This article presents new, longitudinal evidence on this issue, documenting how the link between social origin, destination and political voting behaviour varies during adult life. We find individuals who move up the social ladder are more likely to vote Conservative than individuals who remain in the same social class as their parents. Overall, an individual’s social origin and social destination seem to be equally important for how they vote. Yet we find no evidence that social mobility is associated with political voting preferences per se; rather upwardly mobile individuals’ greater propensity to vote for the Conservatives is driven by the joint impact of their social origin and destination.
Introduction
Social mobility is a key public policy issue. In the United Kingdom, the empirical setting for this article, the Social Mobility Commission defines social mobility as ‘the link between a person’s occupation or income and the occupation or income of their parents’. More generally, improving the life-chances of young people from disadvantaged backgrounds has been towards the top of the political agenda for nearly two decades. It is an issue that has captured the imagination across the political spectrum, gaining broad support from both the political left and right. Indeed, as far back as 2004, Tony Blair spoke of creating an ‘opportunity society’ with the aim of ‘putting middle class aspirations in the hands of working-class families and their children to open up opportunity to the many and not the few’ (Wintour, 2004). Such sentiments have been echoed by recent Prime Minister Boris Johnson, who spoke about ‘smashing down’ barriers to social mobility, arguing that ‘we should be giving the poorest a chance to compete on an equal footing with the affluent bourgeoisie’ (Chorley, 2015). Despite much talk regarding social mobility and meritocracy over the last two decades, there is little evidence of the United Kingdom becoming a more socially fluid society.
For politicians, this must beg the question – how does social mobility feed into what happens at the polls? Who do the socially mobile end up voting for? On one hand, those who grow up poor but manage to break through the glass ceiling may stay close to their roots, including through their familial connections and childhood friends. Thus, despite becoming part of the professional class, they may remain closely connected to their working class background and early-life experiences – continuing to vote for stereotypical left-wing parties (e.g. Labour) as a result. Conversely, now they are part of the social elite, the upwardly mobile may have personal economic incentives to turn towards low-tax, small-state political parties (e.g. the Conservatives). Their political views may also be shaped by the changing composition of their peer group (at work and socially), their changing use of publicly funded services and experiences in the workplace (e.g. dealing with trade unions). Such countervailing forces may of course change during adult life, with closer connections to their working-class background when they are younger and first able to vote, followed by a gradual assimilation towards the voting behaviour of their destination (professional) class as they age. The central aim of this article is to offer new insight into such issues, providing the first longitudinal analysis of the link between social mobility and voting behaviour across the UK.
Why might social mobility be linked to voting behaviour?
Jaime-Castillo and Marques-Perales (2019) note three distinct forces are likely to lead social mobility to be linked to political preferences and behaviours. Importantly, each of these has different implications for the relationship between voting and mobility. The first is termed ‘acculturation’ but which may be broadly thought of as a process of assimilation. As socially mobile individuals move up or down the social ladder they go through a ‘re-socialisation’ process, where their views and opinions are increasingly shaped by their contemporary social class peers. This may occur due to ‘group think’, social pressures, or changing preferences. In particular, socially mobile individuals may alter their views in order to fit into their new social class. Another mechanism potentially at work is self-interest. Now that upwardly mobile individuals have climbed the social ladder, they are inclined to maximise their material rewards, and hence, turn towards lower tax, smaller state political parties (Benabou and Ok, 2001). Conversely, downwardly mobile individuals would have great incentive to vote for parties with a strong history of funding public services. Together, these factors mean that social destination should be a much stronger predictor of voting behaviour than socio-economic background. Moreover, as the assimilation process is unlikely to be instantaneous, the strength of this relationship is likely to increase over time. That is, the link between social origin and voting behaviour should decline during adulthood, while the association with social destination becomes stronger.
The second factor – early-life ‘socialisation’ – ventures a different perspective. Here, individuals’ views, beliefs and behaviours become strongly ingrained during childhood and adolescence, which then prove hard to shift. With respect to voting behaviour, family – particularly parents – is likely to be key. But the local community, peers and authority figures are also likely to be important as well. This results in intergenerational transmission of political views and voting behaviours from parents to children, which remain the dominant perspective of offspring throughout their adult life. Hence, according to early socialisation theory, social origin should be the dominant force driving voting behaviour, with a comparatively minor role of social destination. Moreover, if early socialisation of political attitudes is indeed key, one would anticipate the relative importance of social origin and destination to be largely fixed throughout adulthood.
Alternatively, the final theoretical force is that individuals may act as ‘status maximisers’, and thus most closely mimic the political views and behaviours of the most prestigious social class to which they have ever belonged. According to this theory, individuals yearn to be part of more prestigious social classes and will thus mimic their behaviours to maintain their identity. This is partly driven by Social Identity Theory (Jackson et al., 1996) and individuals’ resistance to accepting (negative) change (Brandt and Reyna, 2017). This then implies that the relative importance of social origin and destination is likely to vary between upwardly and downwardly mobile individuals. Specifically, upwardly mobile individuals will quickly assimilate their views and behaviours to those of their destination class, while those suffering downwards mobility will try to maintain their relationship – including political allegiance – with their origin class. Moreover, while the assimilation of those experiencing upwards mobility may be expected to occur quickly, any change in the views of downwardly mobile individuals is likely to occur over a prolonged period. Hence, one may anticipate such asymmetric behaviour across upwardly and downwardly mobile individuals to be most apparent during early adulthood, with this difference in the relative importance of social class origin and destination shrinking as they age.
Previous research
There have of course been previous studies into the link between social mobility, political preferences and voting behaviour – both in the UK and internationally. Consistent with acculturation theory, Paterson (2008: 428) found that ‘[social] destination is a stronger influence than origin’ in the UK, and that ‘this was not explained by early socialization, and hence that the influence of destination is probably because of adult assimilation into the class of destination’. He also found there to be an interaction between mobility and ability, in that ‘people who were upwardly mobile to the salariat and who were of above-average ability were much more influenced by the class of destination than people who were upwardly mobile and who were of below-average ability’. This is consistent with the Europe-wide analysis of Jaime-Castillo and Marques-Perales (2019) who noted that ‘newcomers tend to adapt their views to those of the destination class at early stages and that upward and downward mobility do not have distinctive effects on the formation of political preferences’ (p. 155). In other words, they also found evidence consistent with acculturation theory, rejecting the ‘status maximisation’ hypothesis.
In contrast, Clifford and Heath (1993) found there to be ‘asymmetrical mobility effects on political behaviour’ with ‘the downwardly mobile from the salariat being more likely to retain the voting patterns of their class of origin than are the upwardly mobile into the salariat’ (i.e. that the status maximisation hypothesis holds). Using data from across Western Europe and the United States, Weakliem (1992) tested the status maximisation hypothesis, concluding that his results ‘cast doubt on the claim that individual mobility favours the political right’. However, using data from across 14 Western democracies, Nieuwbeerta, de Graaf and Ultee (2000) find evidence consistent with acculturation theory, in that ‘the longer mobile persons are members of a certain class the more they are apt to show the typical voting behaviour of their destination class’ (i.e. that assimilation to their views of one’s destination class is a gradual process over time). More recently, McNeil and Haberstroh (2023) argue that social origins and social destinations were equally important in the United Kingdom’s Brexit referendum. They in turn suggest three possible reasons why social origin may matter – early social networks, early political socialisation of ‘the establishment’ against ‘the people’ and variation in resources from parents. Using data from the Netherlands, Daenekindt et al. (2018) find downwards social mobility to be linked with political distrust, speculating that ‘the downwardly mobile perceive their demise from a “blame the system” perspective, while the upwardly mobile perceive their success from a meritocratic perspective’.
Contribution and research questions
Although the aforementioned studies have made a significant contribution to our understanding of the link between social mobility and voting behaviour, there remain important gaps in the evidence base. A key issue is that much of the existing work has drawn on cross-sectional data, focusing on the link between social mobility and political preferences at one specific point in time (usually mid-adulthood). There is, however, a notable dearth of longitudinal analyses, investigating how the link between mobility and voting changes as people age. In other words, few existing studies have attempted to consider the extent that individuals’ views change as they progress in their careers and move upwards (or downwards) between different classes. This is important because – as noted earlier – one would imagine that the relationship between social mobility and voting may change during adulthood, depending on the extent that each of the three theoretical forces (acculturation, early socialisation and status maximisation) hold.
This article attempts to fill these gaps in the literature. Drawing on large-scale, nationally representative data from the UK (the 1970 British Cohort Study), we present new evidence on the link between relative social mobility and voting behaviour between the ages of 26 and 46. A key feature of these data is that they follow individuals from birth through to around 50 years old, recording individuals’ occupation and voting history at various points during adulthood (ages 26, 30, 34, 42, and 46). Thus, unlike previous studies, we undertake a detailed analysis of how the link between social mobility and voting behaviour changes as young people age. In doing so, we provide new empirical evidence as to whether the three factors described earlier (acculturation, early socialisation and status maximisation) drive the association between social mobility and voting in the UK. Thus, in summary, we address the following two key research questions:
RQ1. What matters more for how you vote: your social origin class or social destination? How does this change between early and mid-adulthood?
RQ2. How does the link between social mobility and political preferences change throughout adulthood?
Data and methodology
Background
Our empirical analysis makes use of longitudinal data from the 1970 British Cohort Study (BCS70), a nationally-representative sample of around 17,000 people born in Britain during a single week in 1970. Following the original birth survey, a further nine sweeps have taken place at ages 5, 10, 16, 26, 30, 34, 38, 42, and 46. From an original sample of 17,284, participants were followed up by parental interview and examinations at ages 5, 10, and 16, with self-completion and cohort member interviews taking place from the age 26 sweep onwards. As with all longitudinal studies, BCS70 has been subject to attrition and sample loss over time and, while some attempts have been made to construct response weights, these have largely been found not to improve the efficacy of analytical models using the 1970 BCS cohort (Mostafa and Wiggins, 2015). The present analysis includes participants with data on occupational status and voting preferences or behaviour in at least one sweep between the ages 26 and 46, in addition to data on parental social class when they were age 10. This represents an analytic sample of 10,245 complete cases (59% of the original birth sample). While we acknowledge the potential bias that such missingness may introduce, Supplemental Appendix C presents analysis using inverse probability weights constructed from wave 1 variables as a robustness check and finds no significant deviation from the main results presented below.
The macro picture for this cohort
The cohort we study were born in 1970 and would have thus progressed during adolescence during Thatcher’s years in power, during a time of widespread strikes and rising levels of income inequality. Their first opportunity to vote in a general election was 1992 (age 22) during John Major’s surprise win and subsequent 5 years in power. Their early- to mid-20s were thus characterised by a period of high interest rates and subsequent recession. The cohort would have been 27 when Tony Blair and New Labour won the 1997 landslide, as the Labour Party moved from the political left into the centre ground. They would have been in their late 30s at the time of the financial crash in 2008 and subsequent Great Recession. When celebrating their 40th birthday in 2010, the Conservatives returned to power, swiftly introducing an era of austerity and public spending cuts. Politically, the period since has seen the Labour Party move back towards the left and the Conservatives the right. It is hence clear that the political position of the UK’s two major political parties – along with the broader economic and social environment – has changed significantly over time.
Measurement of voting intentions
The age 26 sweep of BCS70, that took place in 1996, was the first point at which cohort members were old enough to vote in a general election. The survey asked participants ‘if there was a general election tomorrow, which political party would you vote for?’ Subsequent sweeps at age 30, 34, 42, and 46 substitute this question on voting intentions with one about voting behaviour: ‘Which party did you vote for at the last general election?’ Our analytical approach focuses on the extent to which social origin, destination and mobility are associated with voting preference and behaviour. In Britain, there are two main political parties, Labour and the Conservatives, which have between them received between 65% and 83% of the popular vote at general elections since 1992 (Pilling and Cracknell, 2021). While there have been periods where minor parties have attracted significant support – notably the Liberal Democrats in 2010 and, in Scotland, the Scottish National Party since 2015 – national elections in Great Britain are dominated by the Labour and Conservative Parties, aided by the first-past-the-post electoral system. Historically, the social bases of each of the main parties were broadly representative of the ‘working class’ (Labour) and the ‘middle class’ (Conservative). While some previous studies have employed a Labour/non-Labour dichotomy (Clifford and Heath, 1993), we recognise the underlying trend that social mobility, in absolute terms, has led to a greater proportion of people becoming middle class (Paterson, 2008). We therefore adopt the approach of other more recent research (Marshall, 2016; Wiggins et al., 2023), to assess the extent that mobility into or out of the middle class is associated with the likelihood to vote for the UK’s main right-of-centre party (the Conservatives). Our main variable of interest is hence a binary indicator of ‘voting Conservative’ (CON), taking a value of ‘1’ for participants who said they had (or would) vote for the Conservative Party, and ‘0’ for those reporting a preference for voting for another party or not voting at all.
Measurement of social class
Participants’ social origin and destination were classified using a condensed version of the Registrar-General’s Social Class (RGSC) schema, coded thus: ‘1’ – I (Professional occupations) or II (Managerial or Technical occupations); ‘2’ – IIINM (Skilled occupations – non-manual) ‘3’ – IIIM (Skilled occupations – manual); and ‘4’ – IV (Partly skilled occupations) or V (Unskilled occupations). This is a well-known measure of social class – based upon the pioneering work of Goldthorpe and colleagues – that has been widely used in previous research into social mobility. Social origin was derived from questions asked of their parents at the time of the age 10 sweep, with the higher of the status of their father or mother retained as the origin class. Social destination was derived using the same classification for participants at each of the five sweeps between ages 26 and 46.1
While measuring social class (and mobility) in this way, we also recognise that alternative class schema exist, each with their own strengths and limitations. For instance, Bergman and Joye (2005) reviewed six social stratification schema, including those developed or related to the work of Goldthorpe. They argue this schema is limited by its statistical rather than theoretical basis, that there is important heterogeneity within social classes and Goldthorpe’s rejection of there being a social class hierarchy. Connelly et al. (2016) performed a similar review, noting how some authors have criticised the Goldthorpe schema due to it downplaying the key role of hierarchy in social stratification. Savage (2016) discusses how this class schema ‘has not proved effective at highlighting increasing income differences’ (p. 64) arguing that its relevance to understanding increasing levels of income inequality unclear. In contrast, Evans (1992) found support for the division of occupations into service, intermediate and working classes, and that different methods of aggregation have only minor consequences for the validity of the schema. Follow-up work then illustrated the validity of Goldthorpe class schema for both men and women (Evans, 1996). Our decision to use this particular social class schema is due to its widespread previous use in research into social mobility.
Methodological approach
We adopt two parallel approaches in our analysis. In line with previous studies on the relationship between class and voting behaviour (e.g. Heath, 2015; Marshall, 2016), we implement a conventional logistic regression analysis. This approach consists of grouping participants according to their position of origin and position of destination. The 4 × 4 table implied by the levels of social class utilised in this analysis means that there will be 16 discrete trajectories of mobility. These can be included within a regression framework in the form of 15 dummy variables that may be compared to an ‘always advantaged’ immobile reference category (Van der Waal et al., 2017). Specifically, this model is specified as

where CON is a binary variable coded as 1 if the cohort member voted Conservative and 0 otherwise; and
The parameters of interest (
Estimates from an alternative logistic regression model specification are also presented where participants are assigned to one of three ‘mobility groups’ – upwards, downwards or immobile – while controlling for their social class origin. Formally, these logistic regression models are specified:

where Mobility is a set of two dummy variables indicating whether the individual experienced upwards mobility, downwards mobility or remained in the same social class group as their parents (reference group); and Origin is the social class background of the cohort member. The
There are, however, some notable limitations with such conventional regression approaches when assessing the relationship between social mobility and voting behaviour. As outlined by Steiber (2019),
the methodological challenge lies in the fact that indicators of mobility are linearly dependent on childhood SES and adult SES (this is similar to the challenge of disentangling age, period and cohort effects); hence not all three of these variables [mobility, social origin and social destination] can be tested simultaneously in linear models. (authors’ addition; pp. 1–2)
In order to counter this methodological limitation of conventional regression modelling, we employ Sobel’s (1981, 1985) diagonal reference models (DRM), which were designed to disentangle the effects of social origin, destination, and mobility. DRMs take advantage of a two-dimensional mobility matrix to model the value of the dependent variable of socially mobile individuals as a function of immobile individuals in the two associated social positions (Daenekindt et al., 2018). The baseline model is specified as
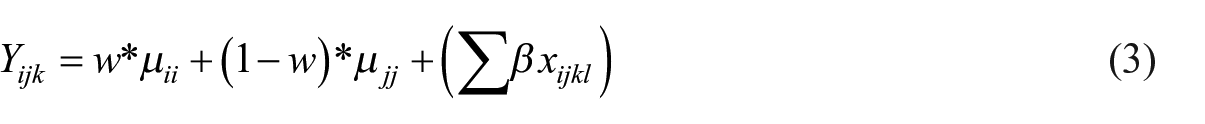
where Yijk is the value of the dependent variable in cell ij of the mobility matrix, which has k observations. Subscripts i and j refer to the position of origin and destination, respectively. This implies that μii is the estimated mean of Y in the diagonal cell in the row denoting the position of origin, while μjj is the estimated mean of Y in the diagonal cell in the column denoting the position of destination.
The parameter w is a weighting estimate, constrained to lie in the interval [0; 1], and represents an estimate of the strength of the effect of social origin relative to that of destination. Correspondingly, 1–w represents an estimate of the relative effect of social destination. A value of w = 0.5, hence, indicates that social origin and social destination exert the same influence on the dependent variable (e.g. voting Conservative). Combining the origin and destination effects in cell-specific intercepts allows us to additionally specify the effect of mobility within the same parsimonious model (Van der Waal et al., 2017), thus eliminating the specification problem alluded to above. The summation term Σβxijkl allows for the inclusion of control variables in the model. We include age at sweep as a control variable and again run separate models for males and females, allowing for the effect of social mobility to differ between men and women (given they experience different mobility chances, trajectories, and patterns of interaction with the labour market – for example, Payne and Abbott, 2005). Our analysis uses a binary dependent variable (CON), and so our DRM models incorporate a logistic regression approach, with separate models including dummies for upwards mobility and downwards mobility. This allows us to assess the independent effect of social mobility on voting for the Conservatives in one direction or the other. All models are run using the STATA drm package (Kaiser, 2018).
To examine the relative influence of social origin and destination on voting behaviour (RQ1) data from across the five sweeps of BCS70 (ages 26–46) are pooled and standard errors are clustered at the individual level. Separate models are subsequently run on each sweep – at ages 26, 30, 34, 42, and 46 − to assess how the link between social mobility and political preferences change during adulthood (RQ2).
We also conduct several sensitivity analyses to check the robustness of our findings, including the removal of non-voters from our analytic sample, and exploring how social mobility is linked to the propensity to vote. These are presented in the Supplemental Appendices.
Results
How are social origin, destination, and mobility linked to the chances of voting Conservative?
Table 1 begins by illustrating the percentage of Conservative votes among the BCS70 cohort members across the five survey sweeps, according to their social origin and social destination. Green shading indicates a greater propensity to vote for the Conservatives, while red shading indicates a greater probability to vote for another party or not to vote at all. It hence provides a first descriptive overview of whether individuals who move up or down the social ladder hold different political preferences from other (socially immobile) groups.
Percentage voting Conservative by social class of origin and destination.
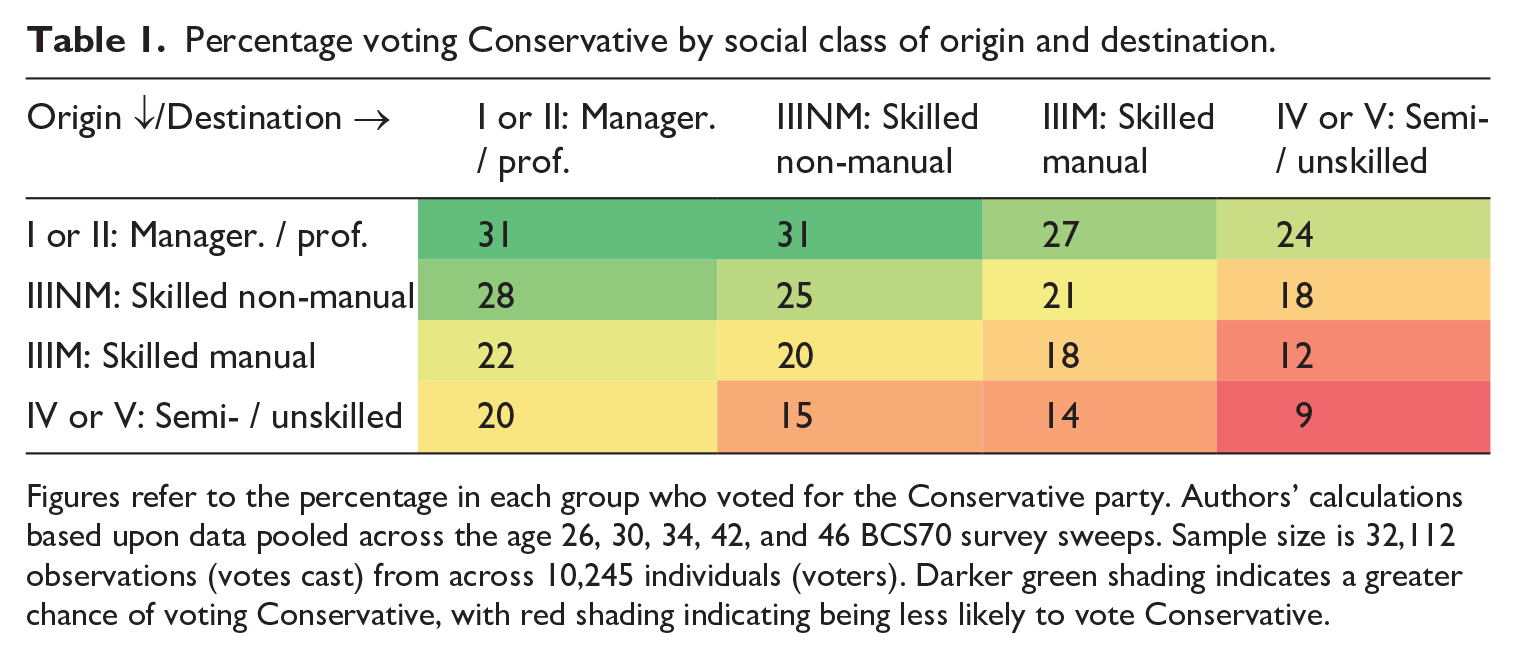
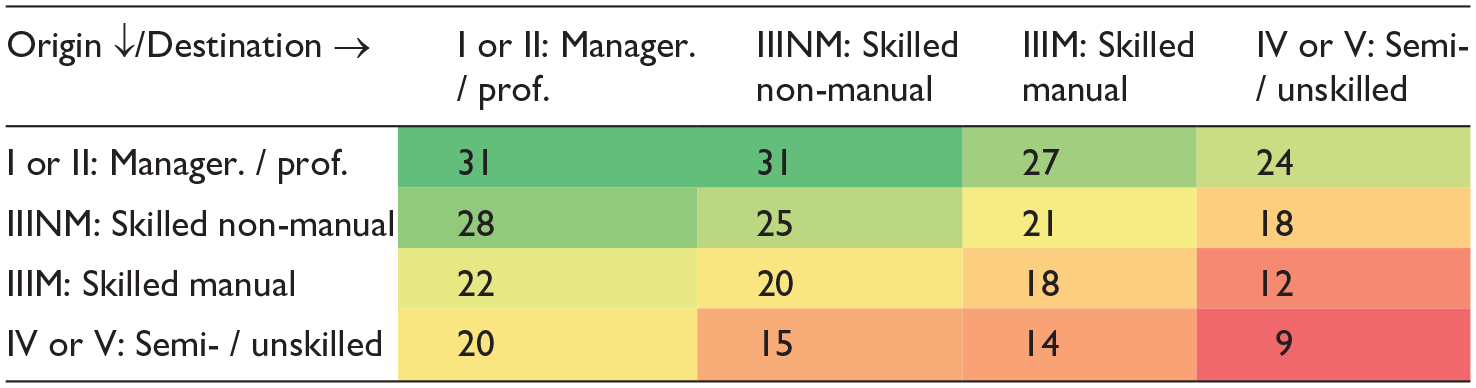
Figures refer to the percentage in each group who voted for the Conservative party. Authors’ calculations based upon data pooled across the age 26, 30, 34, 42, and 46 BCS70 survey sweeps. Sample size is 32,112 observations (votes cast) from across 10,245 individuals (voters). Darker green shading indicates a greater chance of voting Conservative, with red shading indicating being less likely to vote Conservative.
The pattern of the shading – starting in dark green in the top left cell before gradually moving to dark red in the bottom right cell – suggests that both social origin and destination are linked to voting for the Conservatives. In total, 31% of electoral votes by individuals from a managerial/professional family background go to Britain’s major centre-right party if they themselves go on to work in a managerial/professional job. This probability is notably lower − 24% – for those who are downwardly mobile from the managerial/professional class to the semi/unskilled class. Yet, the reverse holds true for those who experienced upwards mobility from a semi/unskilled social background. They have a one-in-five (20%) chance of voting for the Conservatives, compared to around a one-in-ten chance (9%) for their immobile peers who remain in a semi/unskilled occupation. It hence seems that both social origin and social destination are linked to how one votes in important national elections. These results are formalised in Table 2 where we present estimates from our logistic regression models. Estimates are now also presented separately by gender. The likelihood of voting Conservative differs for most social origin-destination combinations from the reference group (immobile individuals within class I or II). This holds true for both males and females, and suggests the pattern observed in Table 1 is unlikely to simply be due to sampling variation.
Logistic regression models predicting likelihood of voting Conservative, by social mobility groups.
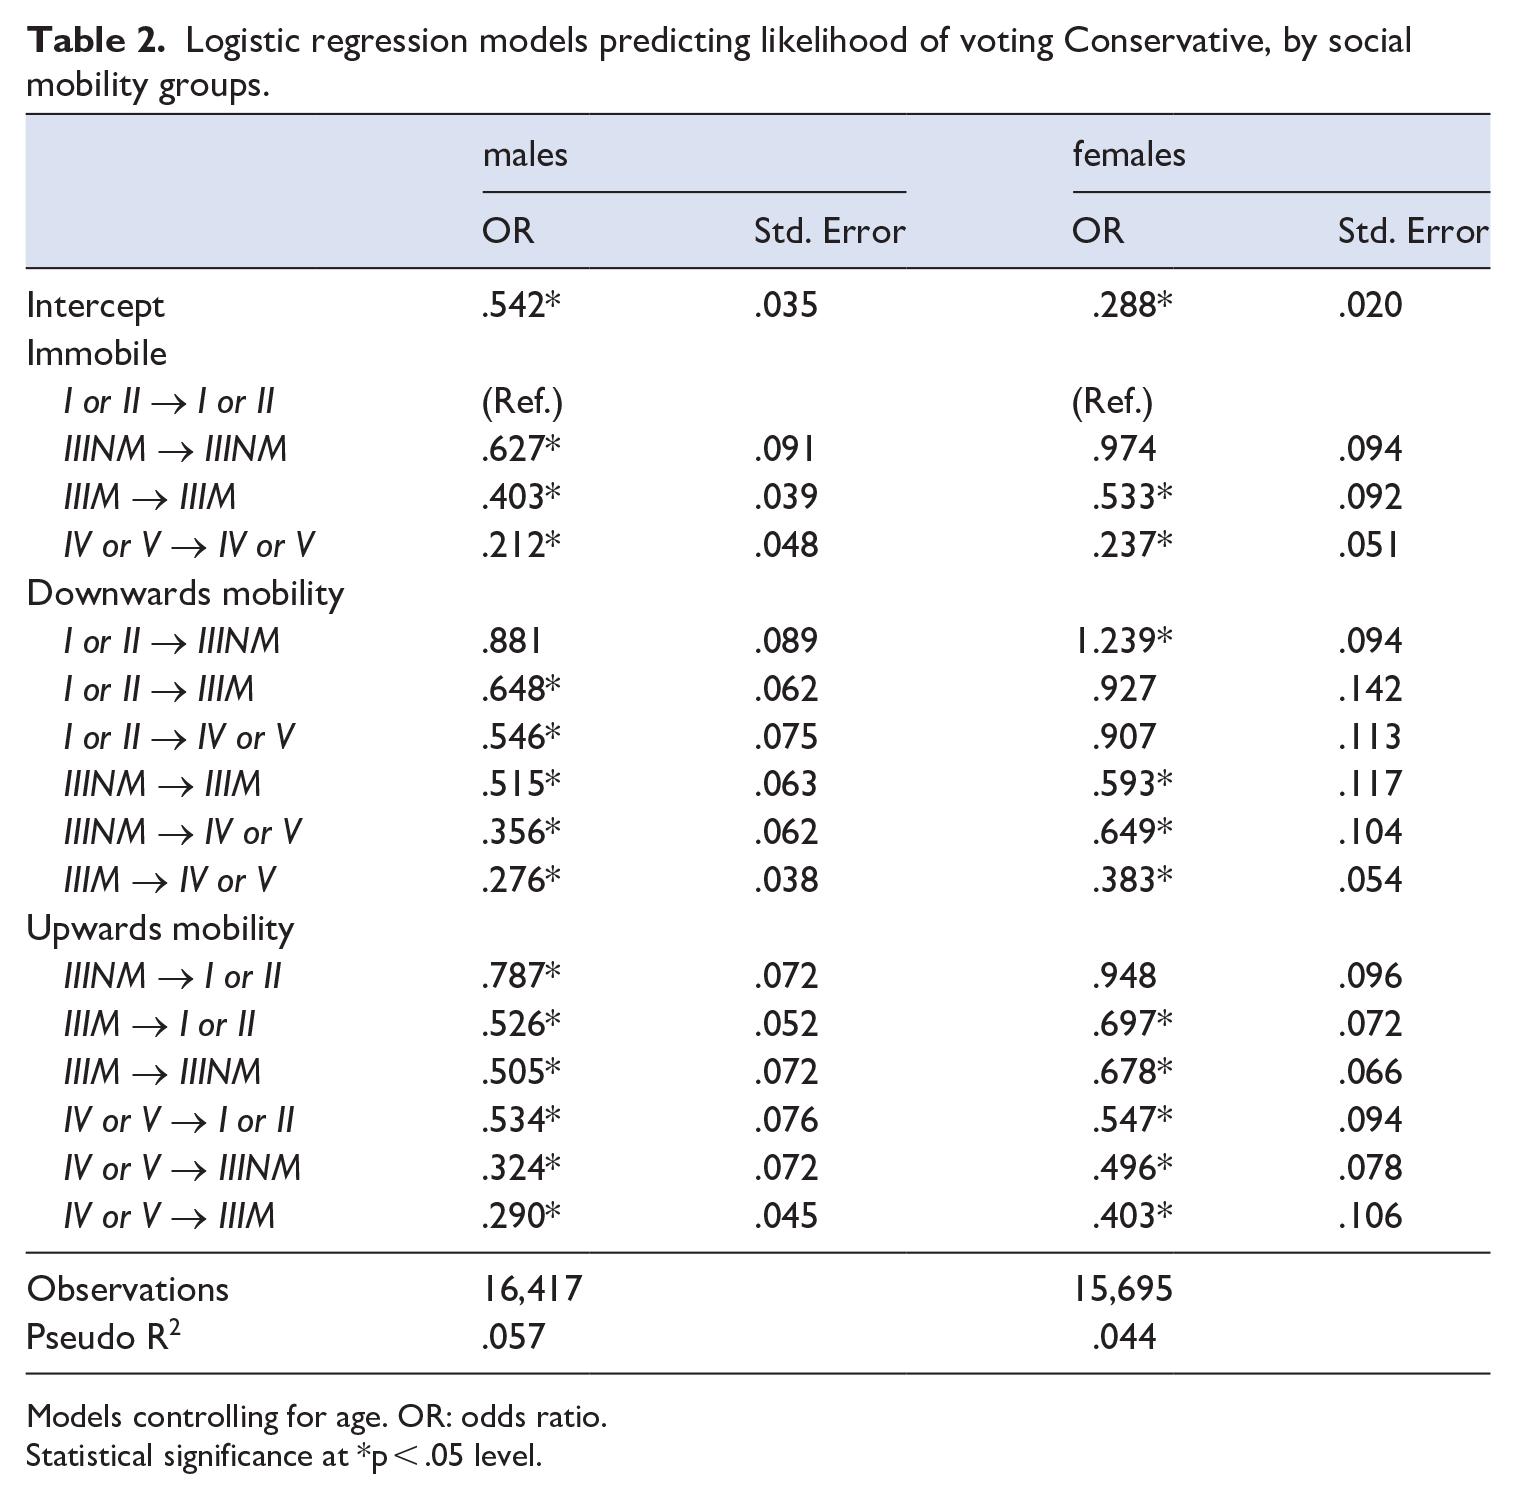
Models controlling for age. OR: odds ratio.
Statistical significance at *p < .05 level.
To further interpret the magnitude of the differences reported in Table 2, we turn to Figure 1. This presents a set of predicted probabilities based on the results from this logistic regression model. Specifically, Figure 1 is divided into four separate social origin groups. The bars within these four social origin groups then depict the percentage voting Conservative for those ending in each social destination. The amber bars indicate where individuals have been upwardly mobile, the blue bars immobile and the red bars to downwards mobility.
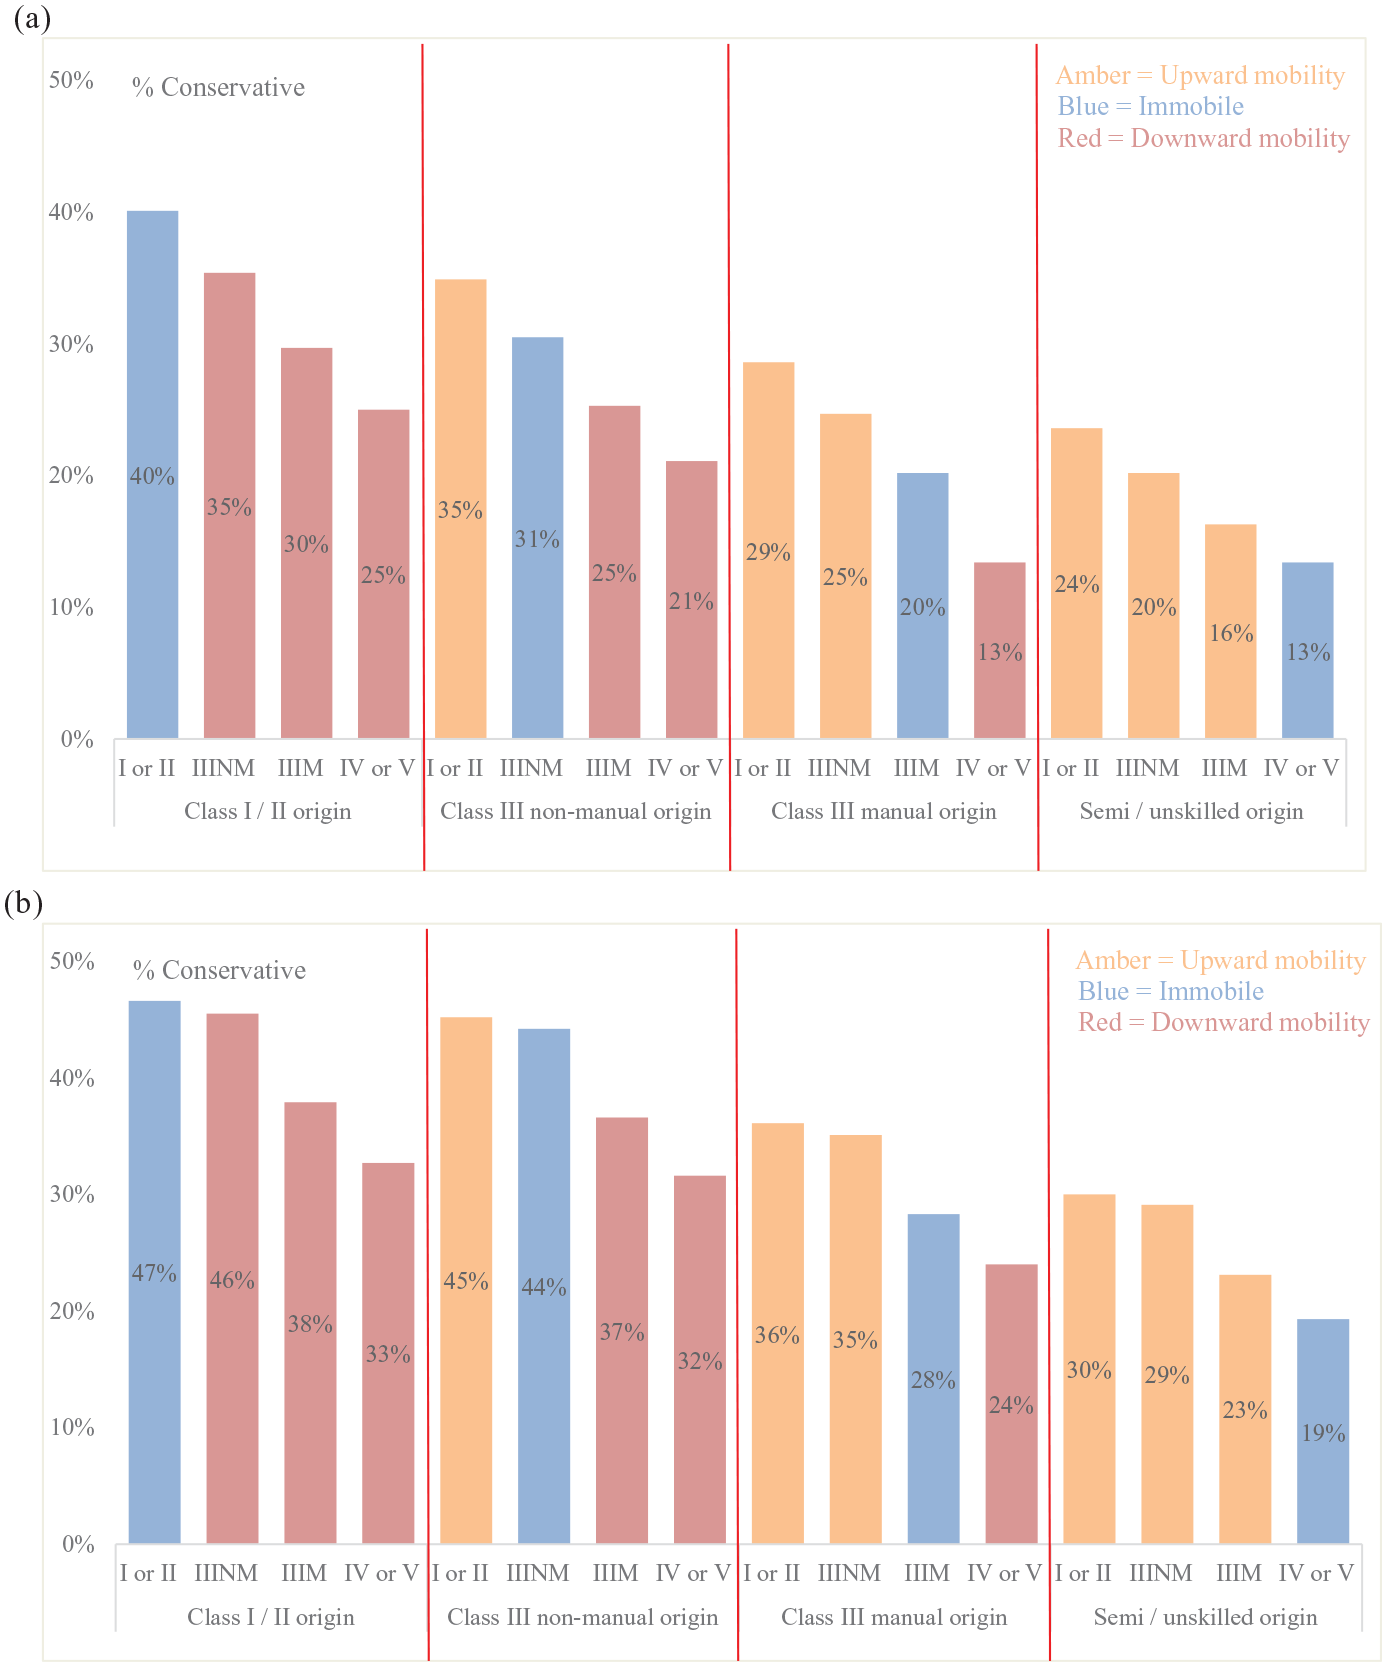
Predicted probabilities for voting Conservative by social class origin and destination. (a) Men. (b) Women.
Starting with men, within each panel, we see a clear pattern where the green bars tend to be higher than the neighbouring blue bars, which are in turn taller than the neighbouring amber bars. This illustrates how – for individuals from the same family background (social origin) – the upwardly mobile are more likely to vote for the Conservatives than individuals who remain in the same social class as their parents (blue), who in turn are more likely to vote Conservative than individuals who experience downwards mobility (red). More generally, one can see that social origin has a clear link with political preferences by the fact the height of the bars generally declines as one moves from the lefthand most panel (managerial/professional origin) to the bars on the right (semi/unskilled origin). Yet, social destination clearly matters as well, given how within each of the ‘social origin’ panels, the bars get progressively shorter when moving from left (managerial/professional destination) to right (semi/unskilled destination). The same broad pattern emerges for women as well, though perhaps with a less stark difference in voting patterns between those whose social destinations are the I/II versus III non-manual groups.
Overall, we find that the odds of voting Conservative are around 1.3 times higher for upwardly mobile individuals than for those who remain in the same social class as their parents. In contrast, for men, the odds of a downwardly mobile individual voting Conservative are only around 0.7 times that of a socially immobile individual. Interestingly, the link between downwards mobility and voting Conservative does not reach statistical significance for women. Formally, these results are presented in Table 3.
Logistic regression models predicting likelihood to vote Conservative differentiating between immobile, downwards and upwards mobility while controlling for origin class.
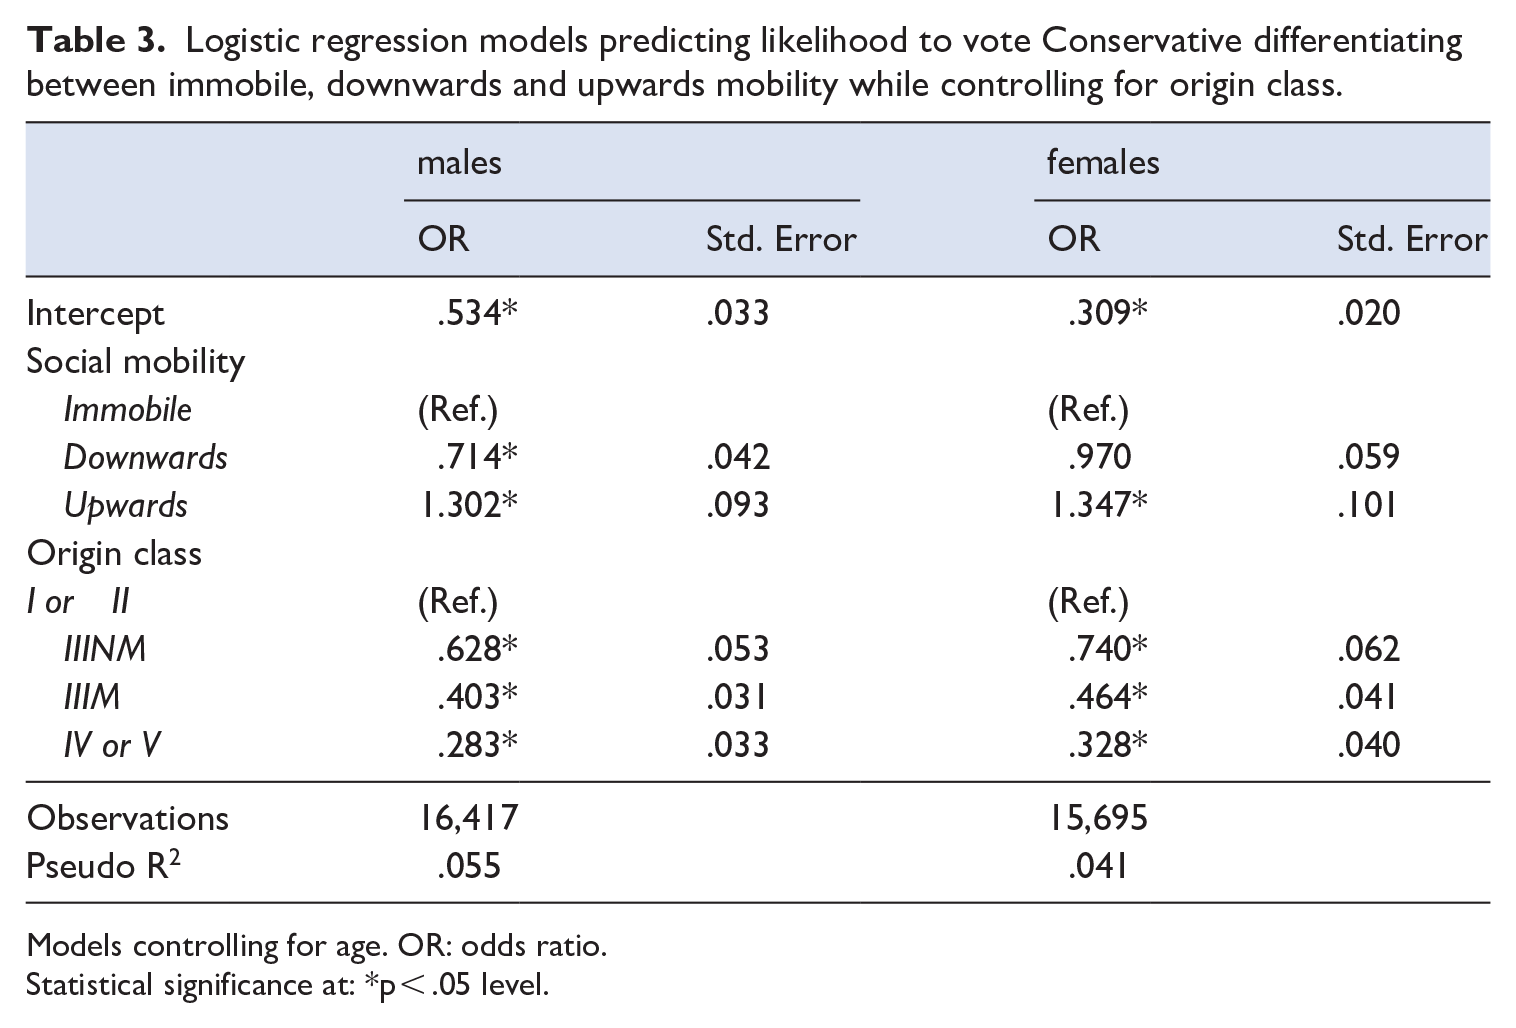
Models controlling for age. OR: odds ratio.
Statistical significance at: *p < .05 level.
Finally, to conclude this sub-section, we present estimates from our DRMs. These have two key advantages over the analyses presented above: (1) they allow us to formally compare the relative importance (‘weights’) of social origin and destination on the propensity to vote Conservative and (2) they allow us to examine whether there is an independent effect of social mobility on voting Conservative – over and above the effect of social origin and destination. These results can be found in Table 4.
Logistic Diagonal Reference Models (DRMs) predicting likelihood to vote Conservative based on origin and destination class including effect of downwards and upwards mobility.
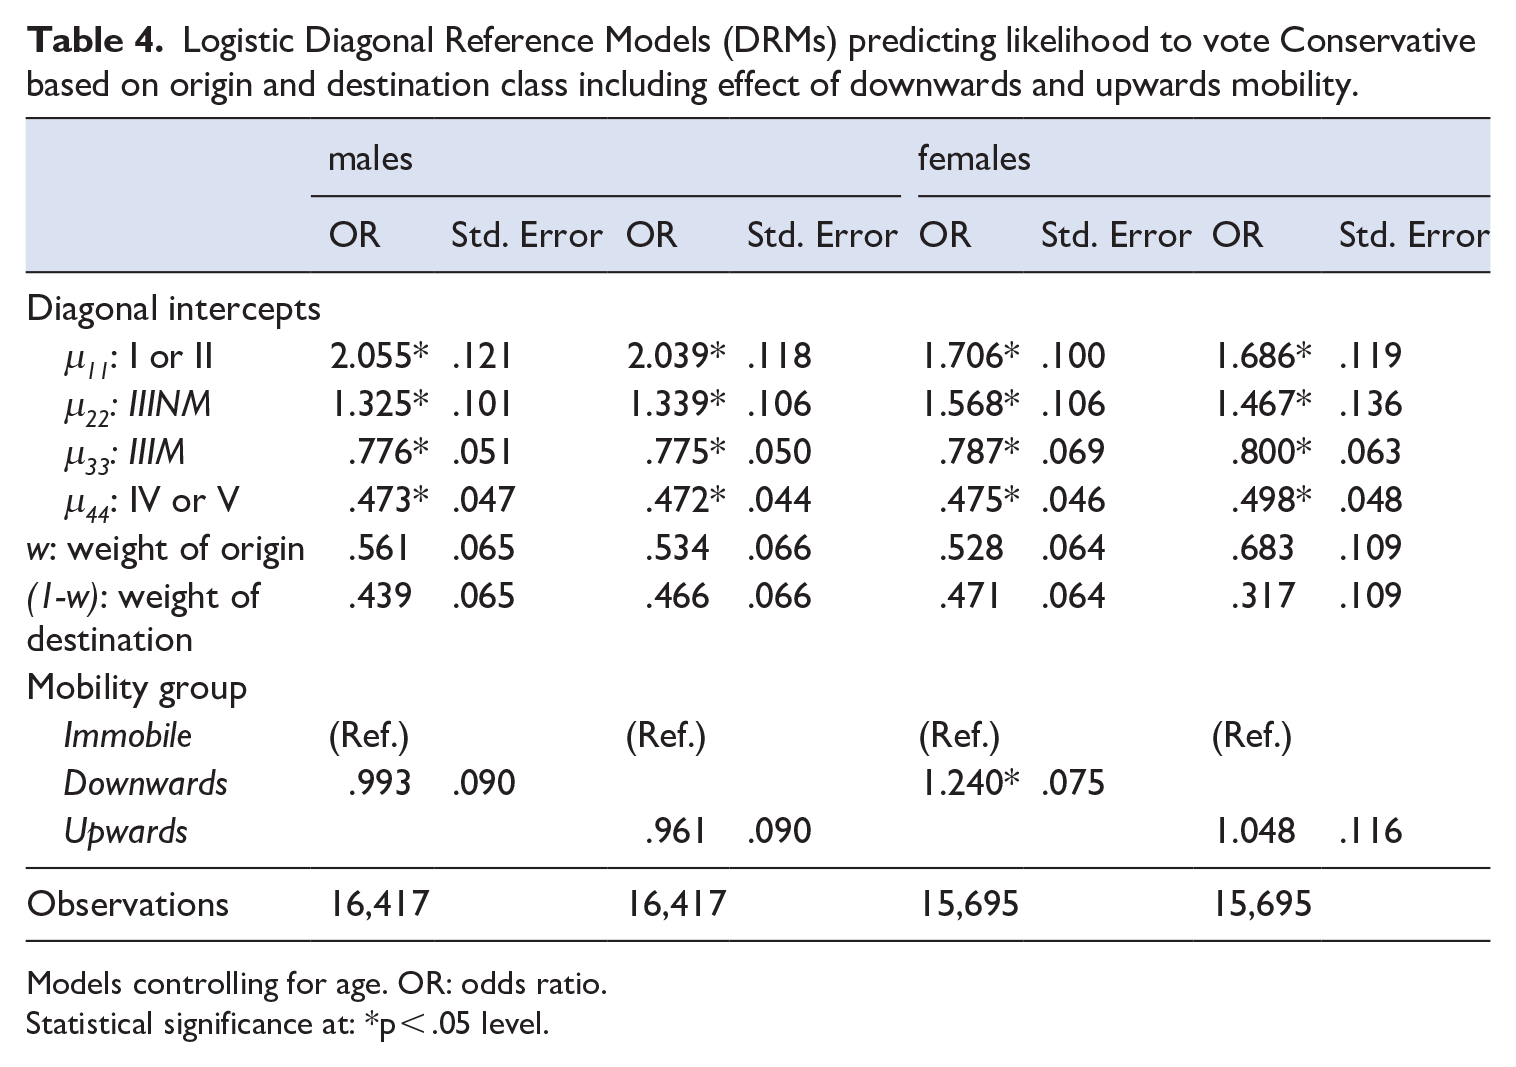
Models controlling for age. OR: odds ratio.
Statistical significance at: *p < .05 level.
There are three key points of note. First, in general, social origin and destination appear equally important for whether an individual votes for the Conservative Party; the estimated weight of each is never significantly different from 0.5 (equal importance) at the five percent level. Second, for men, there is no evidence that mobility per se has an impact on how they vote; the estimated odds ratios sit very close to one. Thus, for men, the results reported in Tables 1–3 seem to be driven by the role their social origins and destinations play in determining how they vote, rather than the fact they have managed to move up (or down) the social classes per se. Finally, a different result emerges for women, for whom downwards mobility seems to be independently linked with how they vote. Specifically, the act of falling down the social classes is linked to women being more likely to support the Conservative Party (odds ratio; OR = 1.24). However, no link is found between upwards mobility and voting for either women or men.
How does the link between social origin, destination, mobility and voting Conservative change during adulthood?
We now turn to our findings of how social origin, destination, and mobility are linked to voting for the Conservatives across different ages. To begin, Table 5 presents estimates from logistic regression models where we examine the odds of voting Conservative at different ages for upwardly and downwardly mobile individuals (relative to the socially immobile reference group). These results are based on the full sample including both men and women; separate estimates by gender are reported in Supplemental Appendix B.
Logistic regression models predicting likelihood to vote Conservative at different ages, differentiating between immobile, downwards and upwards mobility while controlling for origin class.
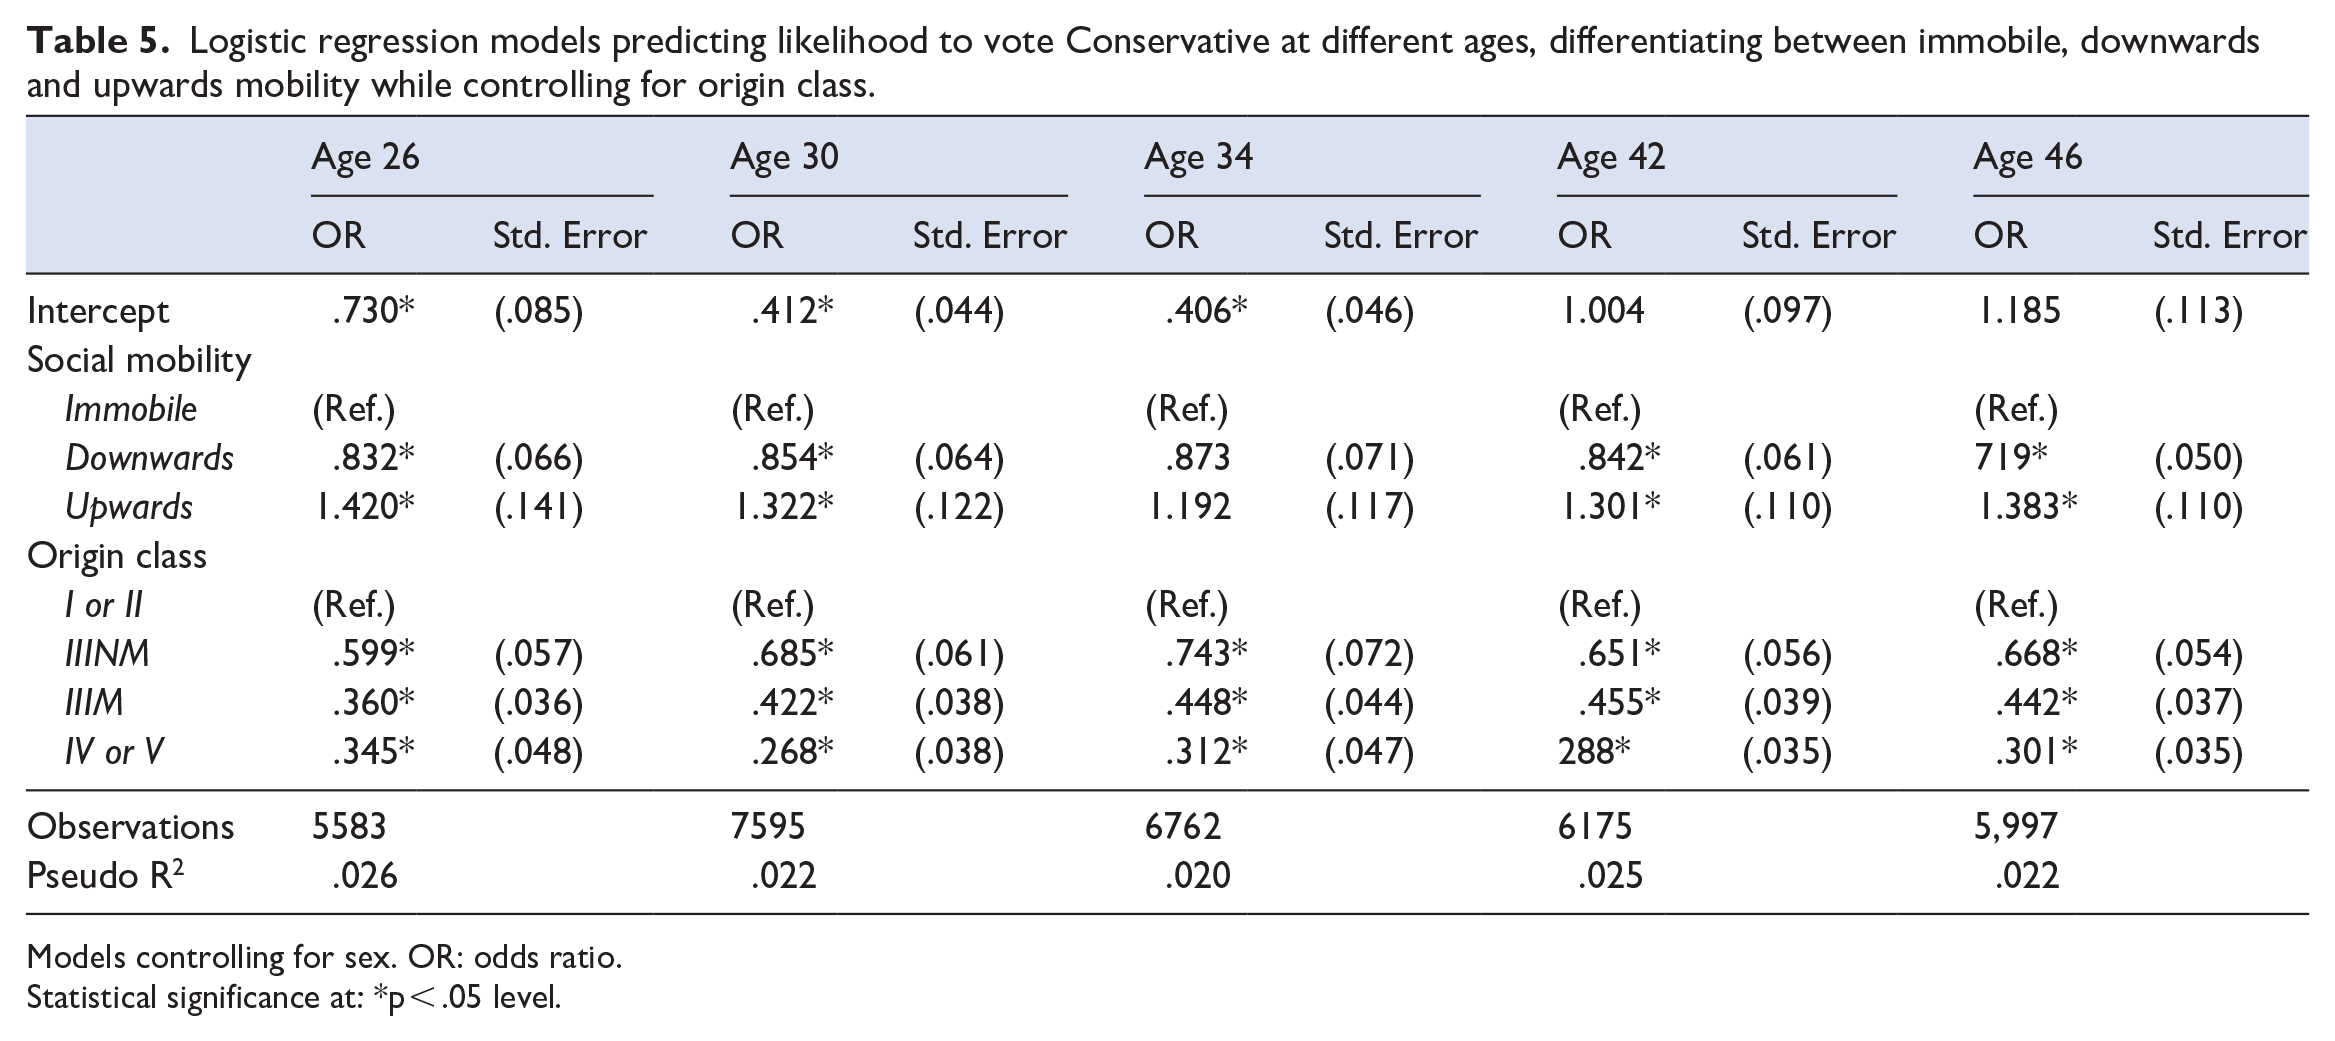
Models controlling for sex. OR: odds ratio.
Statistical significance at: *p < .05 level.
The estimates further confirm that upwardly mobile individuals are more likely to vote Conservative than immobile individuals, while downwardly mobile individuals are less likely to vote for this political party. Yet, no clear evidence emerges that the strength of this association increases or decreases as individuals age. For instance, the odds ratio for the upwardly mobile group typically sits around 1.3, with estimates at all ages never significantly different from this value. Likewise, the odds ratio for the downwardly mobile group typically sits around 0.8 at all ages, with only the most recent data point (age 46) being notably lower (OR = 0.72). This is when cohort members voted in the 2015 general election – following a period of austerity and severe public spending cuts – which could plausibly be related to this finding (i.e. it may be reflecting a ‘period’ rather than an ‘age’ effect). Alternatively, it is worth noting that the previous sweeps were conducted during a time of historically low electoral support for the Conservatives, while they won the election in 2015. Interestingly, the results presented by gender in Supplemental Appendix B suggest that the stronger the link between downwards mobility and being less likely to vote Conservative at age 46 (2015 general election) is being driven by men rather than women. Nevertheless, overall, Table 5 suggests that the link between social mobility and voting for the Conservative does not change much by age.
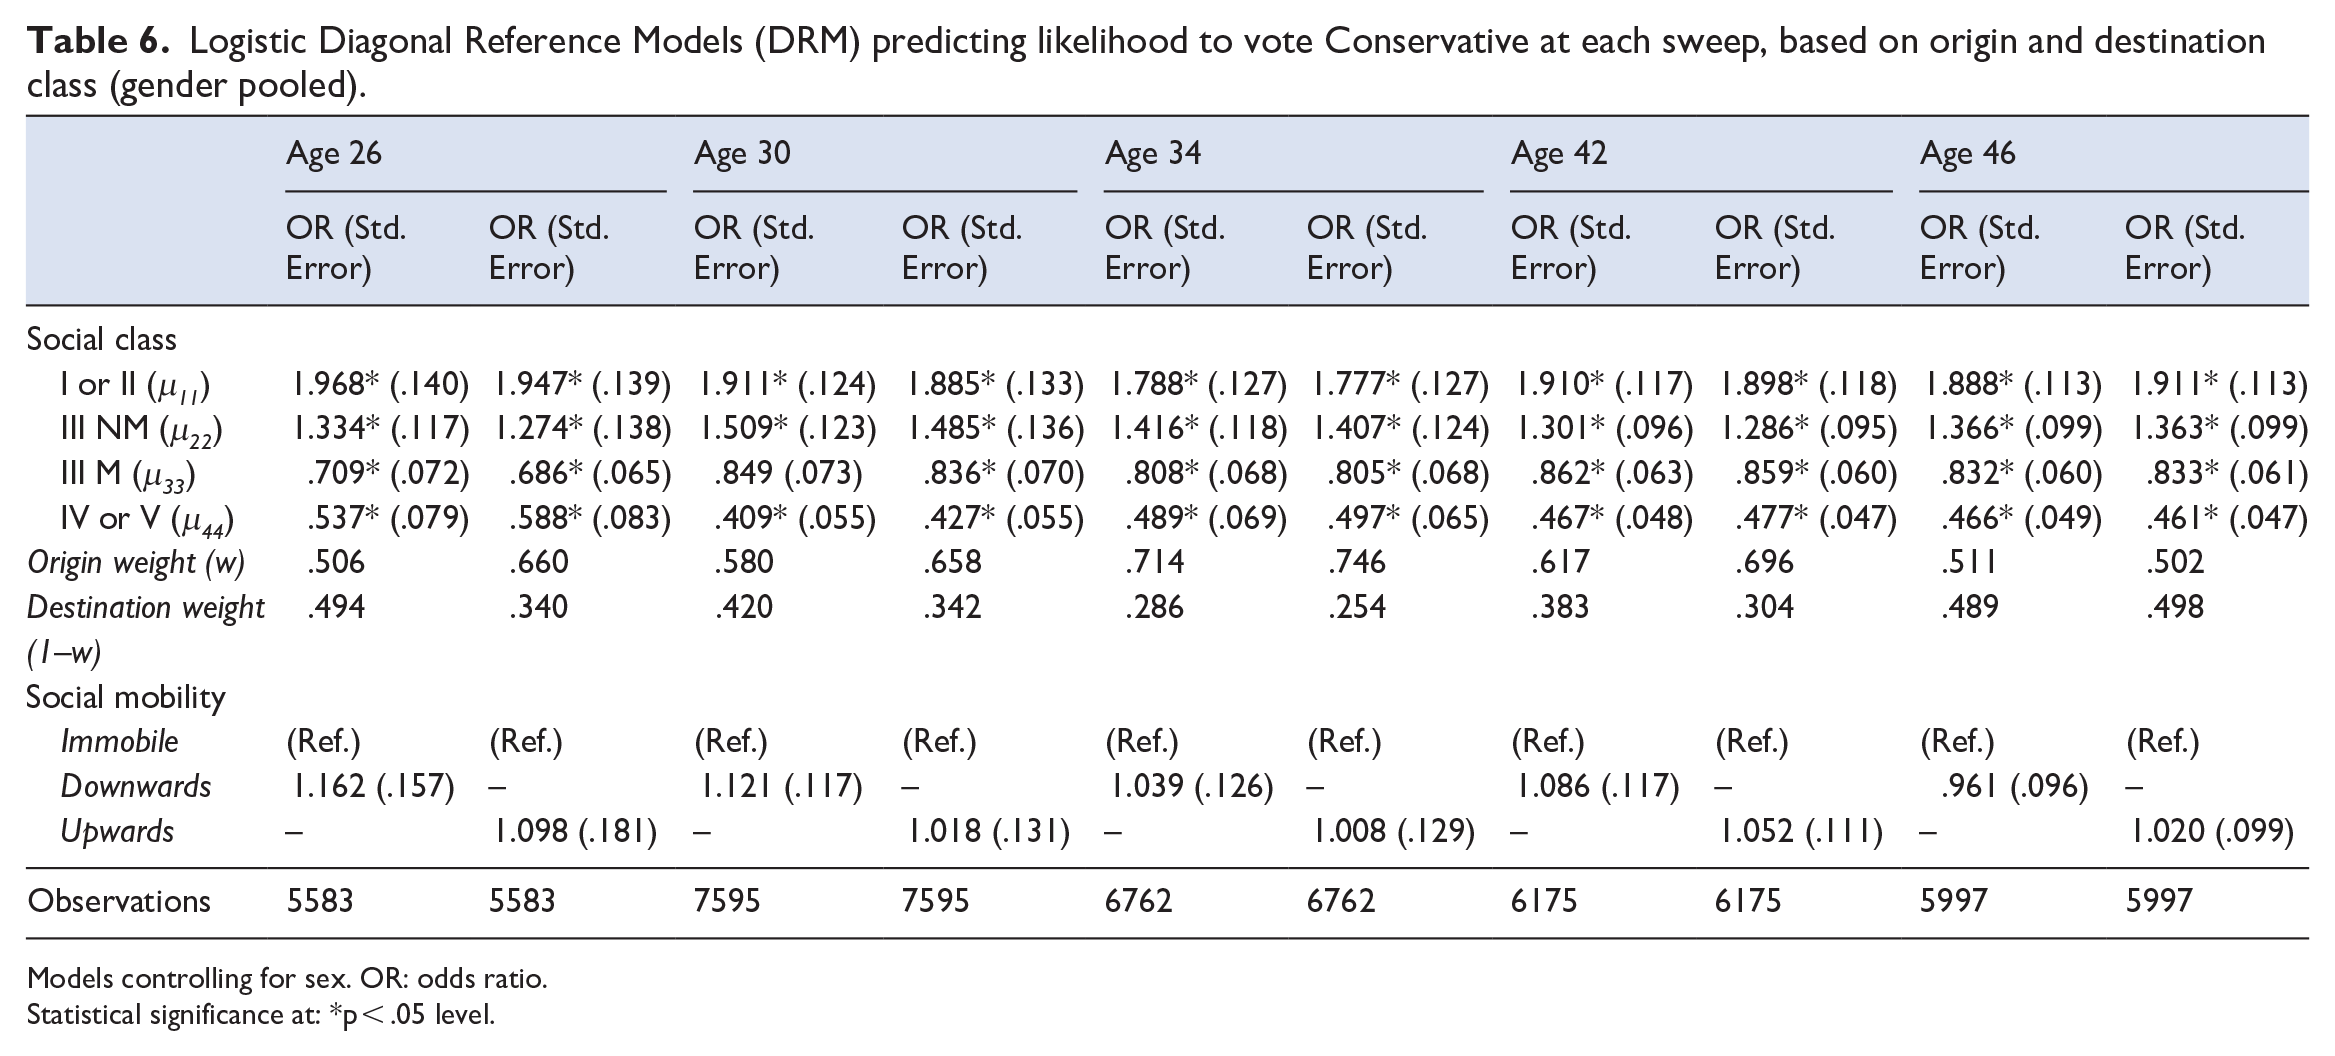
Table 6 turns to estimates from our DRMs across the five timepoints. These pool data for men and women to maximise the sample size. This provides a consistent picture that neither upwards nor downwards mobility is independently related to voting Conservative at any age, over and above the effects of social origin and destination. The estimated odds ratios are all between 1.0 and 1.1, and never statistically significant at the 5% level. This of course also means that, by implication, there is no evidence that the effects of mobility on voting changes through adulthood.
Logistic Diagonal Reference Models (DRM) predicting likelihood to vote Conservative at each sweep, based on origin and destination class (gender pooled).
Models controlling for sex. OR: odds ratio.
Statistical significance at: *p < .05 level.
To conclude, Figure 2 – in conjunction with Table 6 – illustrates the ‘weight’ social origin has on the decision to vote Conservative at the five ages. Figures closer to one indicate social origin is more important than social destination, with the horizontal line
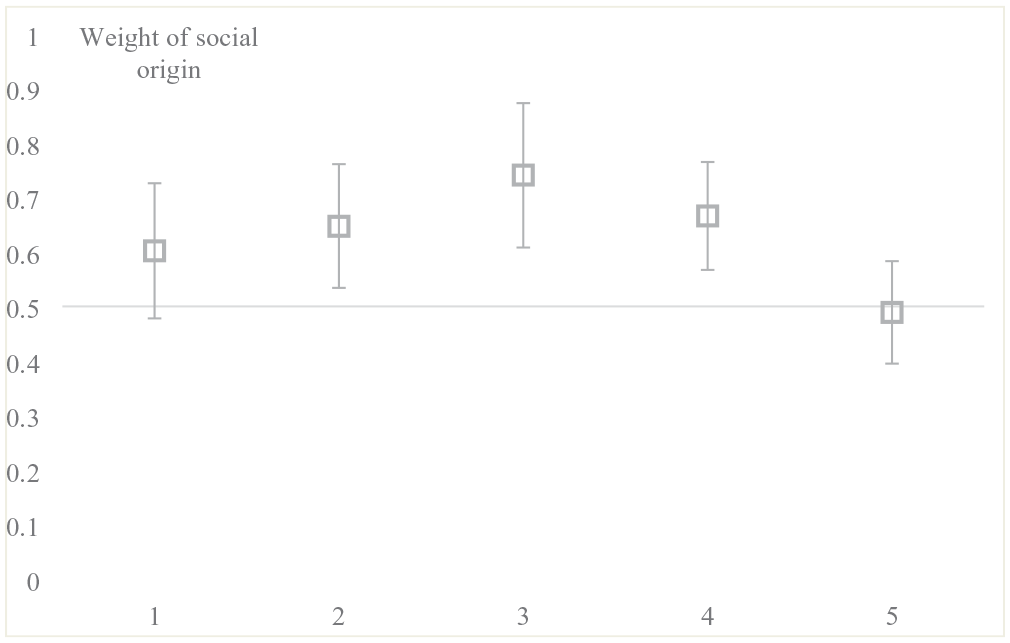
Graph of origin weights (w), by sweep.
at 0.5 illustrating where they carry equal weight. Interestingly, social origin is consistently as important – and sometimes more important – than social destination. It carried most weight in the age 34 survey sweep, referring to voting in the 2001 general election. At this point, social origin carried 75% weight in the decision to vote Conservative. In contrast, in the age 46 survey (which asked about voting in the 2015 general election) social origin and destination were equally important. As Figure 2 thus illustrates, there are tentative signs of a quadratic relationship emerging, with the weight of social origin on the decision to vote Conservative increasing between ages 26 and 34, before declining again through to age 46. Careful interpretation of this result is needed, however, as it is based on just five timepoints, and could be driven by a combination of age, period or cohort effects. Supplemental Appendix B does suggest, however, that a similar relationship between age and the weight of social origin holds for both men and women.
Discussion
Our results provide several intriguing insights. There is clear evidence that individuals with higher status class origins and/or destinations are more likely to vote for the Conservative Party. Moreover, after controlling for social origin, upwardly mobile individuals are around 1.3 times more likely to vote Conservative than their immobile peers. Downwardly mobile men are significantly less likely to vote in this way, while this does not appear to hold true for women. The use of diagonal reference models allows us to examine whether it is social origin or destination that is driving this effect and, while there is some evidence to suggest the influence of one’s social origin is greater than that of their destination, this difference is not statistically significant. According to Jaime-Castillo and Marques-Perales’ (2019) schema greater influence of social origins over destination implies the predominance of ‘early-life socialisation’ theory whereby individuals’ voting preferences arise through the intergenerational transmission of views and attitudes. Our findings do not definitively support this view. In fact, we find evidence consistent with the ‘status maximisation’, at least with respect to the voting behaviour of women. Over and above the effect of social origin and destination, women who are downwardly mobile are slightly more likely to vote Conservative than those who are immobile, maintaining some of the voting behaviour of the class from which they have moved.
Our analysis looking at within-individual change throughout adulthood offers further evidence for the link between social mobility and propensity to vote Conservative. Again, asymmetrical mobility patterns are observed with upwardly mobile individuals significantly more likely – and the downwardly mobile less likely – to vote for the centre-right party compared to those who are socially immobile. It may be expected that within-individual changes in social class position have relatively smaller effects on individuals’ voting behaviour compared to intergenerational effects. Young people may move into and out of lower status employment throughout early adulthood before attaining their ‘final’ social class destination, and earlier ‘destinations’ might not be indicative of their social origin as defined by their parental social class position. Nonetheless, longitudinal analysis of within-individual change can provide a further opportunity to examine the mechanism by which social mobility might affect upon voting behaviour. Theories of ‘acculturation’ predict a reduction in the link between social origin and voting over time. However, our findings indicate that social origin is consistently as important – and sometimes more important – than destination across all timepoints included in the analysis. Indeed, even by age 46, we find no significant difference between the influence of social origin and destination on individuals’ propensity to vote Conservative. On this basis, we reject the ‘acculturation’ thesis in this context.
We cannot, however, definitively state that it is instead one’s early-life experiences that drive the link between social class mobility and voting preferences. At age 26, we see no significant difference between origin and destination effects on voting. As noted earlier, there may be considerable instability in young people’s labour market position in early adulthood before social ‘destination’ becomes more settled. We also find no significant difference between origin and destination effects when individuals should have become more-firmly established in their class position at age 46. Social origins appear to have greatest influence on one’s voting behaviour at ages 30, 34, and 42 for this cohort of individuals, while it is not immediately apparent why this might be the case. ‘Early-life socialisation’ theory anticipates that the relative importance of origin and destination would be largely fixed throughout adulthood. However, we tentatively observe the emergence of a quadratic relationship, where the effect of social origin on likelihood to vote Conservative increases between ages 26 and 34 before declining in later mid-adulthood. If true, this would clearly contradict what the early-life socialisation hypothesis predicts.
We can also reject the notion that social mobility per se is responsible for within-individual changes in propensity to vote Conservative – no independent effect of upwards or downwards mobility above and beyond origin and destination class position is observed. This appears to contradict the third theoretical position – that individuals are ‘status maximisers’ who seek to vote in line with more prestigious social classes. However, we observe some evidence of asymmetric behaviour between those who are mobile into and out of higher social classes. While not attaining statistical significance at any age, odds ratios indicate a greater propensity to vote Conservative for those experiencing downwards mobility, with this being marginally greater at young ages. This is consistent with the theory of ‘status maximisation’, though does not provide strong enough evidence to definitively support this position.
Conclusions and future research
Three findings of this research are of key importance and merit further investigation. First, we have observed the persistence of the influence of social origin on voting behaviour, which continues to exert at least as much effect as one’s destination social class. Second, this effect of social origin appears to peak in one’s 30s, while it is comparatively less influential in early adulthood, when one’s social class ‘destination’ is less likely to have become permanent, and in later mid-adulthood, perhaps once an individual has had sufficient time to assimilate more fully to their social-class destination. Whether and why the effect of social origin is greatest in between these life stages is clearly relevant to understanding on what basis these young adults vote for a political party. Further longitudinal research is needed however to disentangle whether this is due to age, period, or cohort effects.
Finally, there is greatest evidence to support ‘status maximisation’ among women, who continue to be more likely to vote Conservative, in line with members of the higher social class position out of which they have been downwardly mobile. To what extent this effect is gendered and whether it is a result of cohort, age or period effects represents a further important direction for future research.
Limitations
There are six limitations that are important to highlight. First, our analysis looking at the link between social origin, destination, mobility and voting Conservative over time it restricted to five timepoints. Although these cover a 20-year time horizon, there are too few data points to formally estimate how the relationship between these factors change with age. Second, our analysis is based on a single cohort of individuals born in 1970. It is thus not possible to disentangle age, period, and cohort effects. For instance, the strength of the link between social origin, destination, and voting Conservative is likely to be related to who leads the party (and their policies) at that time. Third, our analysis focuses on who votes Conservative rather than political views. Exploring how such views are linked to social mobility – including how this relationship changes with age – is an important issue for future research to address.
Fourth, as noted when introducing the BCS70 data in the section ‘Data and methodology’, our results pertain to one particular birth cohort in the UK who faced a particular set of economic, cultural and political circumstances at key points in their lives. Future work, exploring similarities and differences from other cohorts who faced different macro environments, is an area ripe for future research. Fifth, while missing data do not appear substantively to affect our findings, we acknowledge that our main analysis is based on longitudinal cohort data and subject to attrition over time. We thus acknowledge the possibility that results may be biased and further investigation is warranted to assess how non-response is correlated with social class and political behaviour. Finally, as an observational study, our estimates refer to conditional associations rather than establishing cause and effect.
Supplemental Material
sj-docx-1-sro-10.1177_13607804241229009 – Supplemental material for Who Do the Socially Mobile Vote For? A Longitudinal Analysis of Intergenerational Mobility and Political Preferences
Supplemental material, sj-docx-1-sro-10.1177_13607804241229009 for Who Do the Socially Mobile Vote For? A Longitudinal Analysis of Intergenerational Mobility and Political Preferences by John Jerrim and Neil Kaye in Sociological Research Online
Footnotes
Declaration of conflicting interests
The author(s) declared no potential conflicts of interest with respect to the research, authorship, and/or publication of this article.
Funding
The author(s) received no financial support for the research, authorship, and/or publication of this article.
Supplemental material
Supplemental material for this article is available online.
Notes
Author biographies
References
Supplementary Material
Please find the following supplemental material available below.
For Open Access articles published under a Creative Commons License, all supplemental material carries the same license as the article it is associated with.
For non-Open Access articles published, all supplemental material carries a non-exclusive license, and permission requests for re-use of supplemental material or any part of supplemental material shall be sent directly to the copyright owner as specified in the copyright notice associated with the article.