
Abstract
Background
The COVID-19 pandemic has created an urgent need for effective therapeutic agents. The SARS-CoV-2 Main Protease (Mpro) plays a crucial role in viral replication and immune evasion, making it a key target for drug development. While several studies have explored Mpro inhibition, identifying FDA-approved drugs with potential efficacy remains a critical research focus.
Purpose
This study aims to identify FDA-approved drugs that could inhibit SARS-CoV-2 Mpro. Using computational screening, we seek compounds that share structural similarities with a known co-crystallized ligand (PRD_002214) and exhibit strong binding affinity to the enzyme, providing viable candidates for COVID-19 treatment.
Research Design
A systematic in silico approach was used, screening 3009 FDA-approved drugs. The initial screening focused on structural similarity to PRD_002214 (PDB ID: 6LU7), followed by molecular docking studies to predict binding affinity. Promising compounds were further analyzed through molecular dynamics (MD) simulations to evaluate their stability and interactions with Mpro over 100 ns.
Study Sample
Of the 3009 FDA-approved drugs screened, 74 were selected for initial evaluation. After refinement, 28 compounds underwent docking analysis, with eight showing strong binding potential to Mpro.
Analysis
Molecular docking assessed the binding affinity and interaction of the selected compounds with Mpro. MD simulations were conducted on the top compound, Atazanavir, to study its dynamic interactions. MM-GBSA, PLIP, and PCAT analyses were used to validate binding affinity and interactions.
Results
Eight compounds, including Carfilzomib, Atazanavir, Darunavir, and others, exhibited promising binding affinities. Among them, Atazanavir showed the highest binding strength and was selected for further MD simulation studies. These simulations revealed that Atazanavir forms stable interactions with Mpro, demonstrating favorable binding and dynamic stability. The binding affinity was further confirmed through MM-GBSA, PLIP, and PCAT analyses, supporting Atazanavir's potential as an effective Mpro inhibitor.
Conclusions
In silico results suggest that Atazanavir is a promising candidate for targeting SARS-CoV-2 Mpro, with strong binding affinity and dynamic stability. These findings support its potential as a lead compound for further preclinical and clinical testing, though in vitro and in vivo validation are needed to confirm its therapeutic efficacy against COVID-19.
Keywords
Introduction
As of May 2024, the World Health Organization reported 774 million confirmed cases of SARS-CoV-2 infection and nearly seven million fatalities, painting a sombre picture of the ongoing crisis. These alarming statistics underscore the immediate and pressing need for concerted efforts from the global scientific community to combat the virus and protect human health.
The usual drug discovery process is excessively expensive and time-consuming, typically taking 12 years to complete the discovery of a new drug, with average costs reaching 2.6 billion USD. 1 On the other hand, drug repurposing could be a very effective process in developing molecules or drugs indicated for new biological uses. It has the advantage of reducing the drug discovery timeline, as any existing compound already demonstrates a good safety profile in humans.2,3 Consequently, there is no requirement for conducting Phase I clinical trials as part of the process. 4 The drug repurposing strategy was applied successfully and severally in the revelation of anti-cancer, 5 COVID-19, 6 anti-inflammatory, 7 antibacterial, 8 antiparasitic, 9 and antiviral 10 drugs.
Fortunately, recent advancements in computational methodologies offer a promising tool for accelerating the drug discovery process.11,12 In the past 20 years, In Silico virtual screening, a method employing computer algorithms to forecast the biological activity of compounds by analysing their chemical structures and their expected biological activities has surged in popularity. This includes rational drug design,13,14 molecular docking, 15 molecular dynamics (MD) simulations, 16 pharmacophore studies, 17 structure similarity assessments, 18 molecular fingerprinting techniques, 19 quantitative structure-activity relationship (QSAR) analyses, 20 homology modelling, 21 as well as molecular modelling. 22
Against COVID-19, our research team utilized computational techniques in the pursuit of potential treatments. Specifically, we aim to screen a diverse array of natural compounds including a set of 310 natural antiviral metabolites,23–27 4924 African natural metabolites,28–30 5956 traditional Chinese medicine metabolites 31 as well as 3009 FDA-approved drugs32–35 for their ability to inhibit key SARS-CoV-2 proteins. By targeting these pivotal viral enzymes, we aim to find new treatments that can slow down the virus and lessen the strain on healthcare systems worldwide. Through interdisciplinary collaboration and innovative approaches, we are committed to making meaningful contributions to the ongoing battle against the COVID-19 pandemic.
In this work, a collection of 3009 FDA-approved drugs
36
has been screened using different computational methods to select the most potent SARS-CoV-2 main protease, Mpro, inhibitors. The utilized methods included molecular structures similarity and fingerprint studies against the co-crystallized ligand ( Chemical structure of the co-crystallized ligand (
Results and discussion
Filter using fingerprints
Fingerprint similarity analysis of 74 FDA-approved drugs with the highest similarity to

Molecular similarity
Although the molecular similarity study shares the in Silico nature and ligand comparison foundation with the molecular fingerprints study, it differs in its methodology. This study involves the comprehensive description and comparison of the entire structures of both the reference compound and the compounds under examination. It employs descriptors of steric, topological, electronic, and physical properties, contrasting with the molecular fingerprints study, which concentrates on atomic descriptors within fragments, atoms, or substructures.
48
To execute the molecular similarity study, 74 FDA-approved drugs demonstrating the highest similarity based on the molecular fingerprints study were chosen. These drugs were compared to The results of the molecular similarity analysis conducted between The names, codes, and structural features of 28 FDA-approved drugs that exhibit similarities with Twenty-eight compounds with good molecular similarity with the co-crystallized ligand (


Docking studies
In the current study, docking was inescapable as it is the only computational method capable of predicting the exact binding between the examined members and COVID-19 main protease (PDB ID: 6LU7). However, the docking process is prone to error and requires proper validation. So, the co-crystallized ligand (
(A) 3D, (B) 2D of (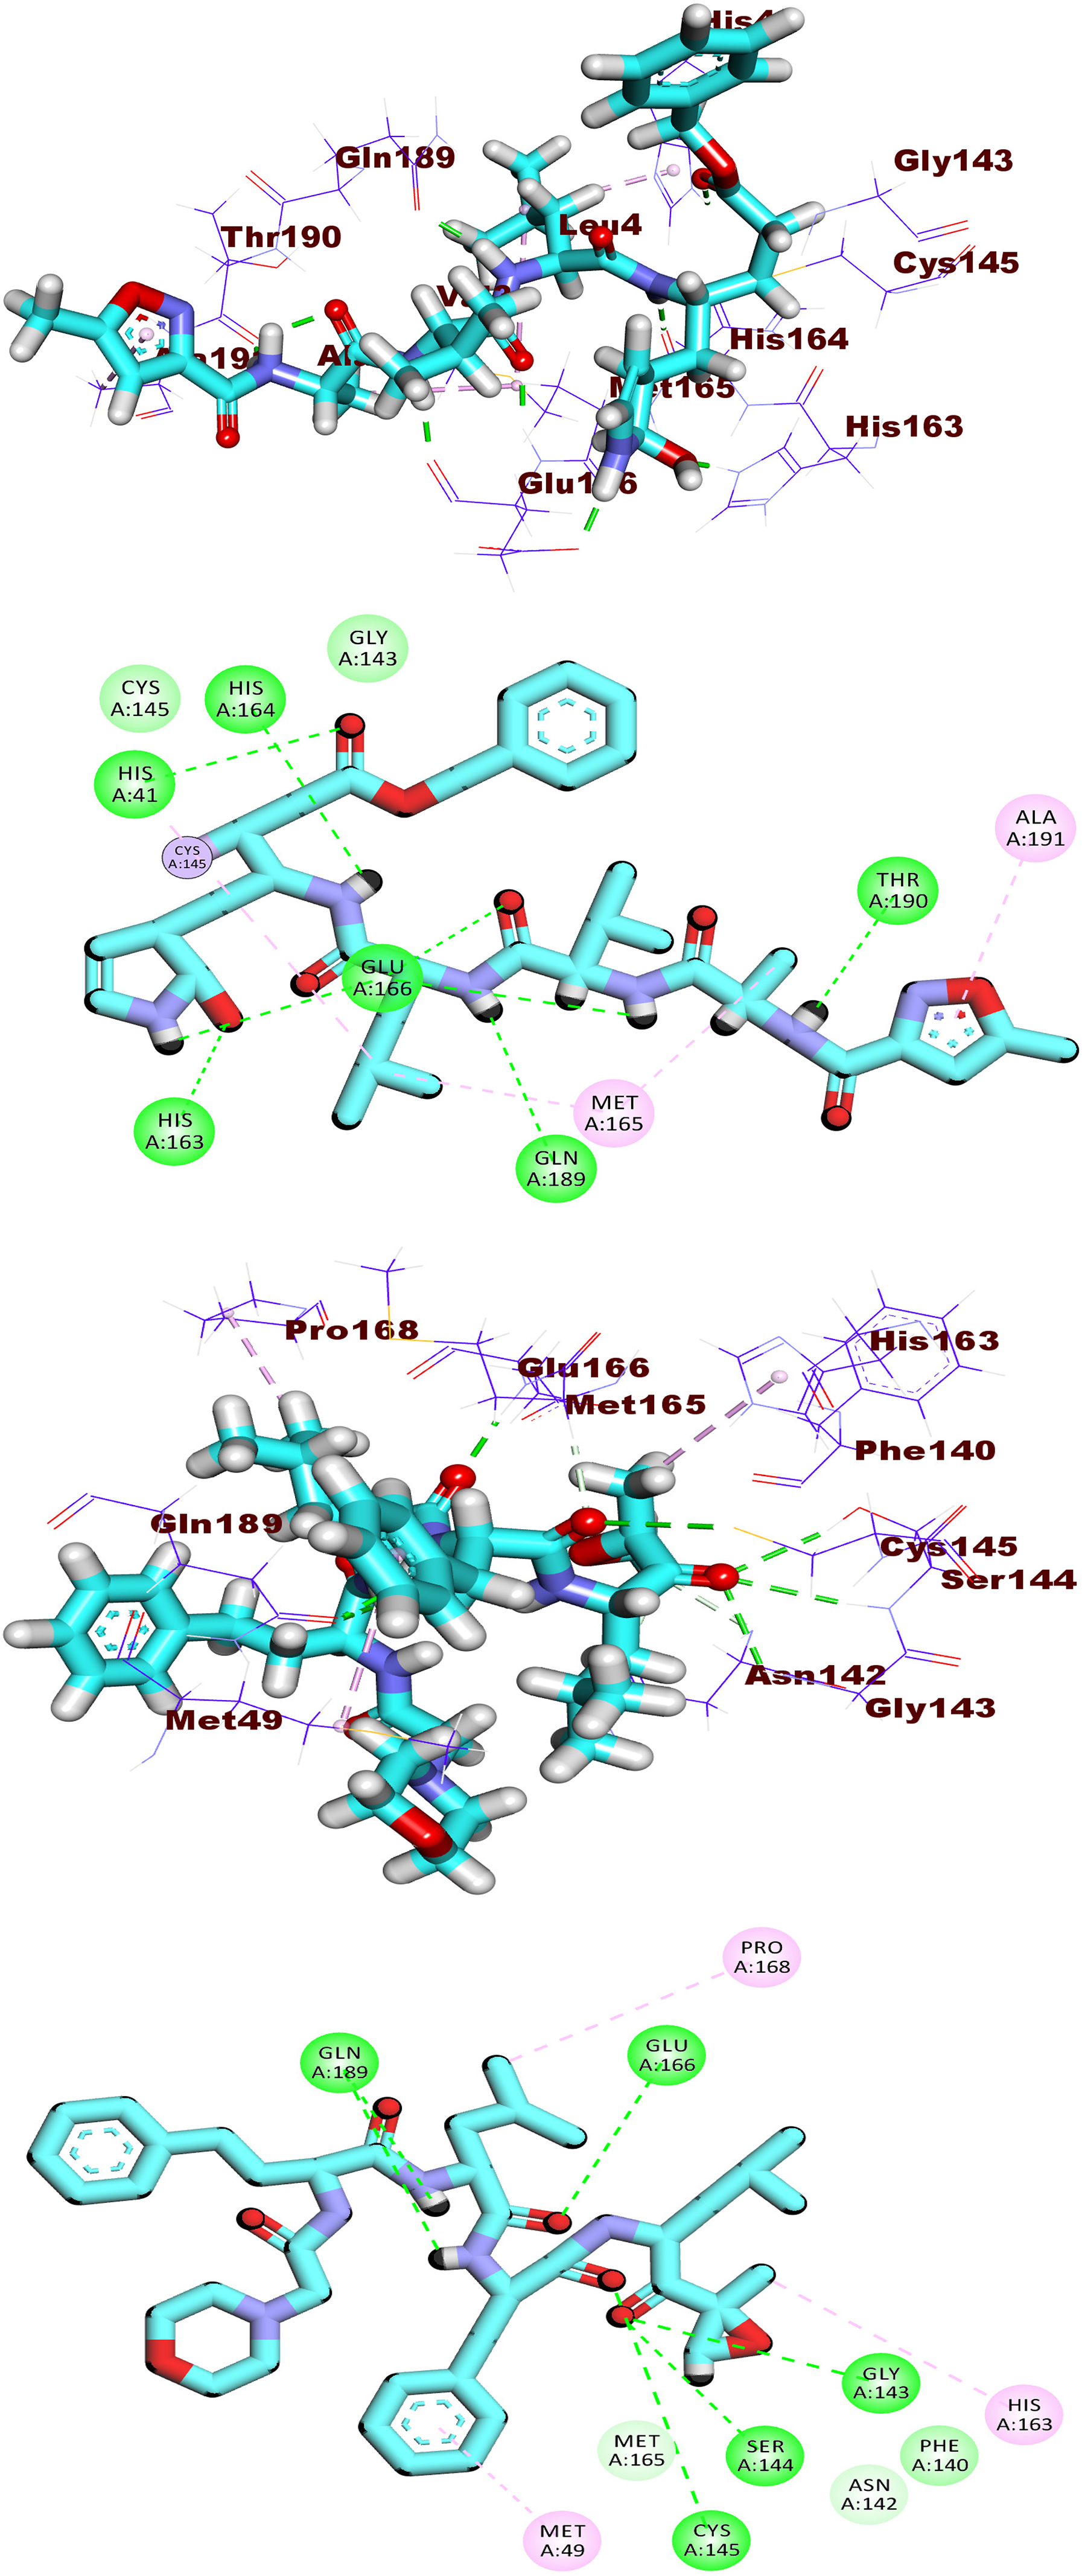
The calculated ∆G (binding free energies) of the tested compounds and co-crystallized ligand against COVID-19 main protease (∆G in Kcal/mol).

As shown in Figure 5, compound (A) 3D binding mode of compound 
A closer look at compound
The proposed binding mode of (A) 3D binding mode of compound 
Respecting the docking results of (A) 3D binding mode of compound 
MD simulations
Both the distance between Atazanavir’s centre of mass and the centre of mass of the Mpro and the structure of the holo Mpro become stable either from the start of the simulation or after 20 ns. The apo Mpro protein (blue) shows a stable RMSD average with a value of 2.1 Å during the first 40 nanoseconds. After that, the RMSD values start to fluctuate and increase in two steps. From 45 ns to around 80 ns, it shows an average of 3.3 Å then it increases again to an average of around 5 Å during the last 15 ns. On the other hand, the holo Mpro protein (red) displays a constant trend after the first 20 ns of the simulation, keeping a value of around 3 Å on average (Figure 8(A)). The RMSD of Atazanavir shows two states during the simulation. After having an average of 5.8 Å for the first 25 nanoseconds, it jumps up to a maximum of 14 Å then it fluctuates from 30 to 45 ns before stabilizing around an average of 9.6 Å (Figure 8(B1)). These changes in the RMSD values result from a conformational adjustment of Atazanavir within the binding pocket, indicating a dynamic binding process before stabilization. As seen in Figure 8(B2), a comparison of Atazanavir’s conformation at 6 ns (green sticks) with those at 40 ns (cyan sticks) and 65 ns (magenta sticks) reveals notable positional shifts, reflecting its structural accommodation within the Mpro active site. This reorientation likely allows Atazanavir to optimize its interactions, enhancing binding stability over time. These adjustments in binding orientation highlight Atazanavir’s flexibility and suggest a gradual establishment of a stable, energetically favourable conformation by the end of the simulation. MD simulations analyses related to the Atazanavir-Mpro complex trajectory. (A) RMSD values from the trajectory for the Mpro protein, (B1) The Atazanavir’s RMSD values, (B2) A comparison between the Atazanavir conformation at 6 ns (green sticks) with 40 ns (cyan sticks) and 6 ns with 65 ns (magenta sticks), (C) radius of gyration for the Mpro protein, (D) SASA for the Mpro protein, (E) change in the number of hydrogen bonds for the Mpro protein, (F) RMSF for the Mpro protein, (G) distance from the centre of mass of Atazanavir and Mpro protein. Blue and red lines represent the Mpro protein in apo and holo forms, respectively.
As can be seen in Figure 8(C) (RoG), and Figure 8(D) (SASA), the apo Mpro system and the holo Mpro system have nearly the same average during the first 40 ns. After that, the apo Mpro protein shows a slight increase in both the RoG (around 0.5 Å increase) and SASA (around 500 Å2) values. Figure 8(E) indicates that the apo and holo Mpro systems have a virtually similar amount of H-bonds on average (70 bonds). In addition, the oscillations of the C-alpha atoms in the apo Mpro protein show nearly always a higher value than the corresponding RMSF of the holo Mpro protein (Figure 8(F)). In general, this suggests that the binding of Atazanavir may have a stabilizing effect on the Mpro protein structure. Interstingly, Atazanavir maintains a consistent average separation from the Mpro protein’s centre of mass, approximately 22.6 Å, which indicates a relatively stable interaction throughout the simulation (Figure 8(G)). This steady distance suggests that, despite conformational adjustments within the binding site, Atazanavir does not drift significantly from its initial binding region. Such stability in spatial positioning relative to the protein’s centre of mass supports the idea of a sustained, reliable binding mode, which could contribute to its effectiveness as an inhibitor by maintaining close and continuous interactions with the active site residues of Mpro.
Molecular mechanics-generalized born surface area (MM-GBSA) calculations
MM-GBSA technique was utilized to estimate the binding free energies of the Atazanavir- Mpro complex. MM-GBSA combines molecular mechanics energy terms, solvation-free energies, and surface area contributions to assess the overall stability and affinity of the examined Atazanavir-Mpro interaction. It is commonly employed in drug discovery and computational biology to predict and optimize ligand binding affinities.
50
Figure 9 shows the various components of the predicted binding free energy estimated using the MM-GBSA technique. A moderate interaction may be derived from the fact that the binding energy of the Atazanavir molecule is −26.16 kcal/mol, indicating a moderate interaction between the two entities. Van der Waals interactions seem to be more important than electrostatic interactions in influencing binding stability (−37.65 Kcal/Mol versus −11 Kcal/Mol). Using decomposition analysis, we were able to measure the contributions of amino acids that are within 1 nm of the Atazanavir molecule (Figure 10). Met49 (−1.92 Kcal/Mol), Met165 (−1.41 Kcal/Mol), and Gln189 (−3.15 Kcal/Mol) are amino acids that are within 1 nm and contribute more than −1 Kcal/Mol. Various energetic components of MM-GBSA along with their respective values, with bars representing the standard deviations. Binding free energy decomposition of the Mpro-Atazanavir complex.

Protein-ligand interaction fingerprints (ProLIF) calculations
ProLIF is a computational method that used in this research as a molecular modelling tool to analyse and characterize the Mpro-Atazanavir complex interactions. ProLIF generated fingerprints or descriptors that encoded information about the types and spatial arrangements of interactions between the Mpro-Atazanavir complex. These fingerprints provide valuable insights into the binding mode, affinity, and selectivity of the Atazanavir complex, aiding in the understanding of interaction and binding. According to the ProLIF library results, five amino acids were discovered to have a higher than 71% incidence of hydrophobic interaction. His41 (78.9 %), Met49 (94.6 %), Met165 (94.7 %), Pro168 (71.1 %), and Gln189 (96.6 %) are the most prevalent amino acids that interact with the Atazanavir molecule. Figure 11 illustrates the amino acids involved, the nature of interactions with Atazanavir, and their frequency throughout the entire simulation period, as analysed using the ProLIF Python library. The amino acids involved, the nature of interactions with the Mpro-Atazanavir complex.
Protein-ligand interaction profiler (PLIP) calculations
PLIP was used to identify and characterize different types of interactions between Mpro and Atazanavir, such as hydrogen bonds, hydrophobic contacts, pi-stacking interactions, and salt bridges. PLIP helps researchers to understand the structural basis of ligand binding and to predict the binding affinity and specificity of protein-ligand complexes. As Figure 12 shows, four different clusters were obtained by the PLIP exhibiting the 3D binding interactions as . pse files from the representative frames obtained from TTClust and their 3D interactions (hydrophobic interactions and H-bonds) with the Mpro-Atazanavir complex. The four representative clusters derived from TTClust and their three-dimensional interactions with the Mpro-Atazanavir complex. Hydrophobic interactions are represented by grey dashed lines, hydrogen bonds by blue solid lines, Atazanavir by orange sticks, and amino acids of the Mpro protein by blue sticks.
Principal component analysis trajectory (PCAT) calculations
PCAT was utilized to analyse and visualize the collective motions of atoms in the Mpro-Atazanavir complex. PCAT reduces the dimensionality of the trajectory data by identifying the principal components of motion, which are the major modes of structural variation in the Mpro-Atazanavir complex. By projecting the trajectory onto these principal components, PCAT enables the identification of key conformational changes, transitions, and dynamic behaviours of the Mpro-Atazanavir complex. The size of the reduced subspace was determined using the scree plot, the distribution of the eigenvectors, and the variance maintained with new eigenvectors (cumulative sum), as stated in the methods section. The slope seems to level off around the second PC as shown in the scree plot. The first eigenvector alone accounted for around 63 % of the total variance, whereas the sum of the first three eigenvectors accounted for over 75% of the whole variance (Figure 13). It was shown that the distribution of the first three PCs did not follow a Gaussian pattern (Figure 14). Therefore, we chose the top three eigenvectors to represent the reduced subspace. The variation in eigenvalues as the number of eigenvectors increases (depicted by the blue line). Additionally, the cumulative variance preserved by these eigenvectors (represented by the red line). The distribution of the first 10 eigenvectors.

The cosine content was determined for both the apo and holo Mpro simulations, allowing an assessment of the degree of randomness shown by the behaviour of the first 10 eigenvectors. Except for the first principal component of the apo protein, which attained a value of 0.23, the cosine content of the first 10 eigenvectors in both the apo and holo proteins was less than 0.2. (Figure 15). The Root Mean Square Inner Product (RMSIP) shows that the similarity between the two subspaces (the first three eigenvectors) is 26.3 %, indicating that there is a considerable difference between the two trajectories. Furthermore, the RMSIP found that the C matrices of apo and holo proteins are only 34.4 % comparable, suggesting that the sampling was different in both systems. The cosine content values of the first 10 eigenvectors for both trajectories.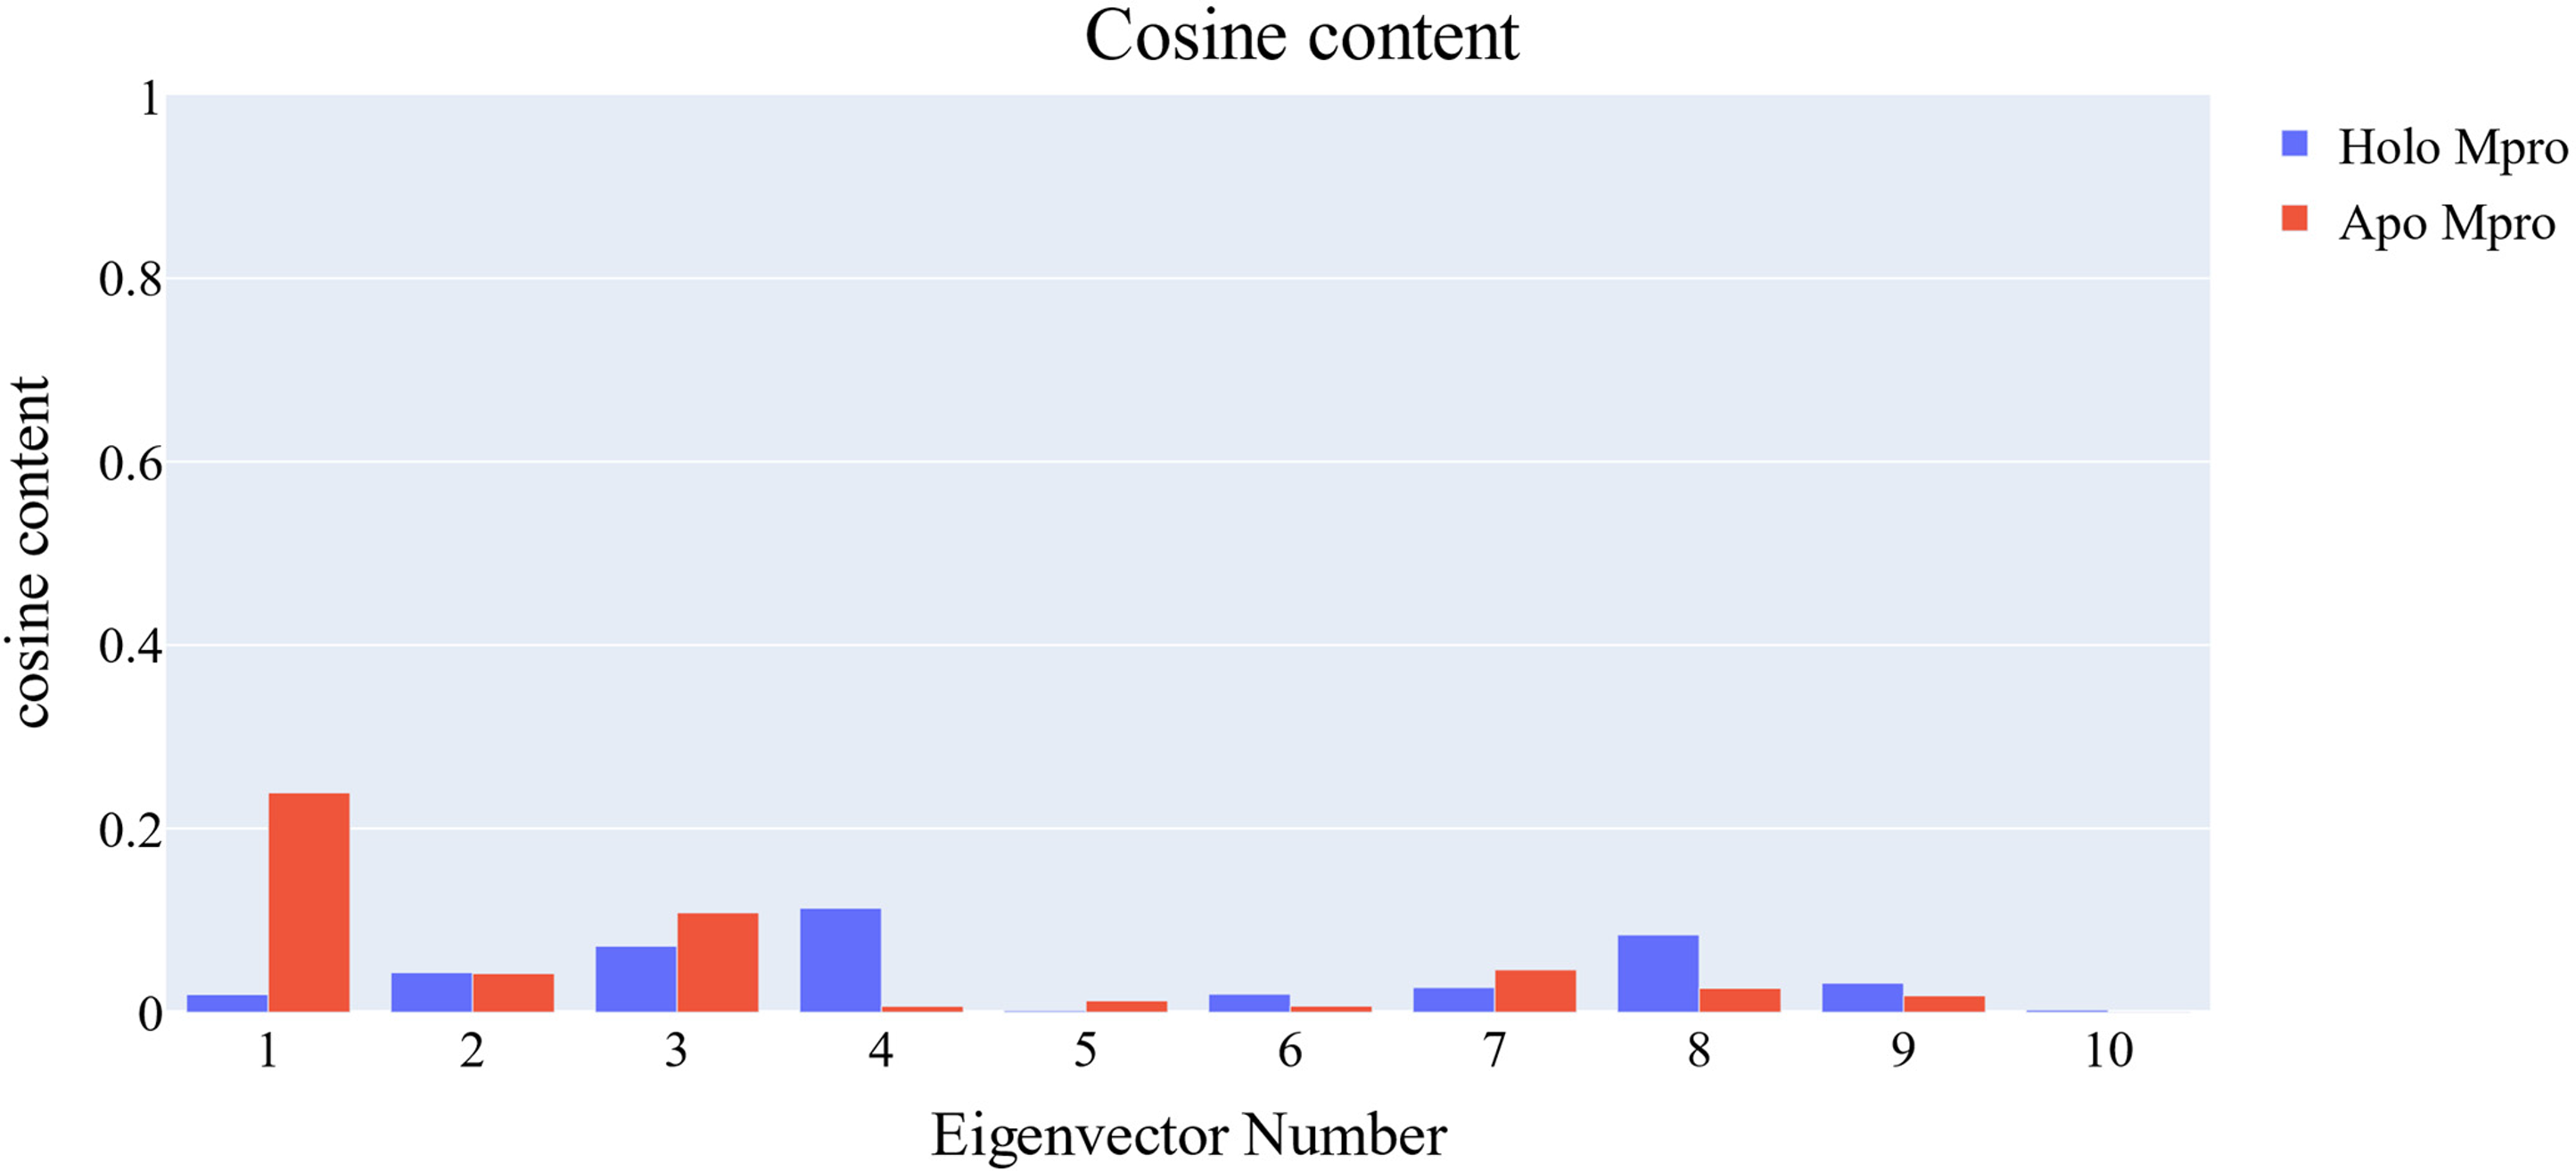
Figure 16 illustrates the results of projecting each trajectory onto the first three eigenvectors of the new C matrix. In each of these graphs, the larger dot represents the average structure of the corresponding trajectory. Figure 16(A), a projection on the first two eigenvectors, shows that the two trajectories have nearly identical average structures and that the frames reflect distinctive sampling with just a little degree of overlap at the start of the simulation (pale red and white dots). Furthermore, as compared to the apo protein, the sampling of the holo protein trajectory suggests more similar frames for all of the simulation time. Figure 16(B) shows that there is a minor overlap between the two trajectories and that their average structures are comparable. Furthermore, throughout the simulation, the frames of the holo system (shown by red dots) continued to exhibit a clustering tendency similar to that exhibited in Figure 9. The apo protein, on the other hand, has a high degree of variation between its frames. Similarly, the projection on the second and third eigenvectors, shown in Figure 16(C), follows the same pattern as the previous projections, with the apo protein exhibiting a considerable disparity between its frames and the holo protein exhibiting closely clustered frames. The projections of each trajectory; (A) the first two, (B) the first and third, (C) the second and third eigenvectors.
Porcupine diagrams, employed in Figure 17(A) and (C), provide a detailed depiction of the dynamics dictated by the first three eigenvectors. In these diagrams, amino acids crucial to the binding pocket are distinguished by a blue colouration. Particularly noteworthy is the observation that within the apo Mpro structure (depicted in a green cartoon representation), these blue amino acids undergo substantial motion, ultimately leading to the closure of the binding pocket evident in both the first and second principal components (PCs) as illustrated in Figure 17(A) and (B). Similarly, while examining the holo protein (depicted in a red cartoon representation), it becomes apparent that its amino acids undergo similar motions, albeit with diminished magnitudes. Interestingly, the analysis of the third PC (Figure 17(C)) unveils a distinct behaviour: while the motion of the apo protein tends to close the pocket, the holo protein’s motion prompts the pocket to open, suggesting a nuanced interplay between protein dynamics and ligand binding states. The porcupine figures of each of the first three eigenvectors (A) shows the first PC, (B) shows the second PC, and (C) shows the third PC) for both systems. Green cartoon: apo Mpro trajectory, red cartoon: holo Mpro trajectory. Blue cartoon: amino acids lining the binding pocket.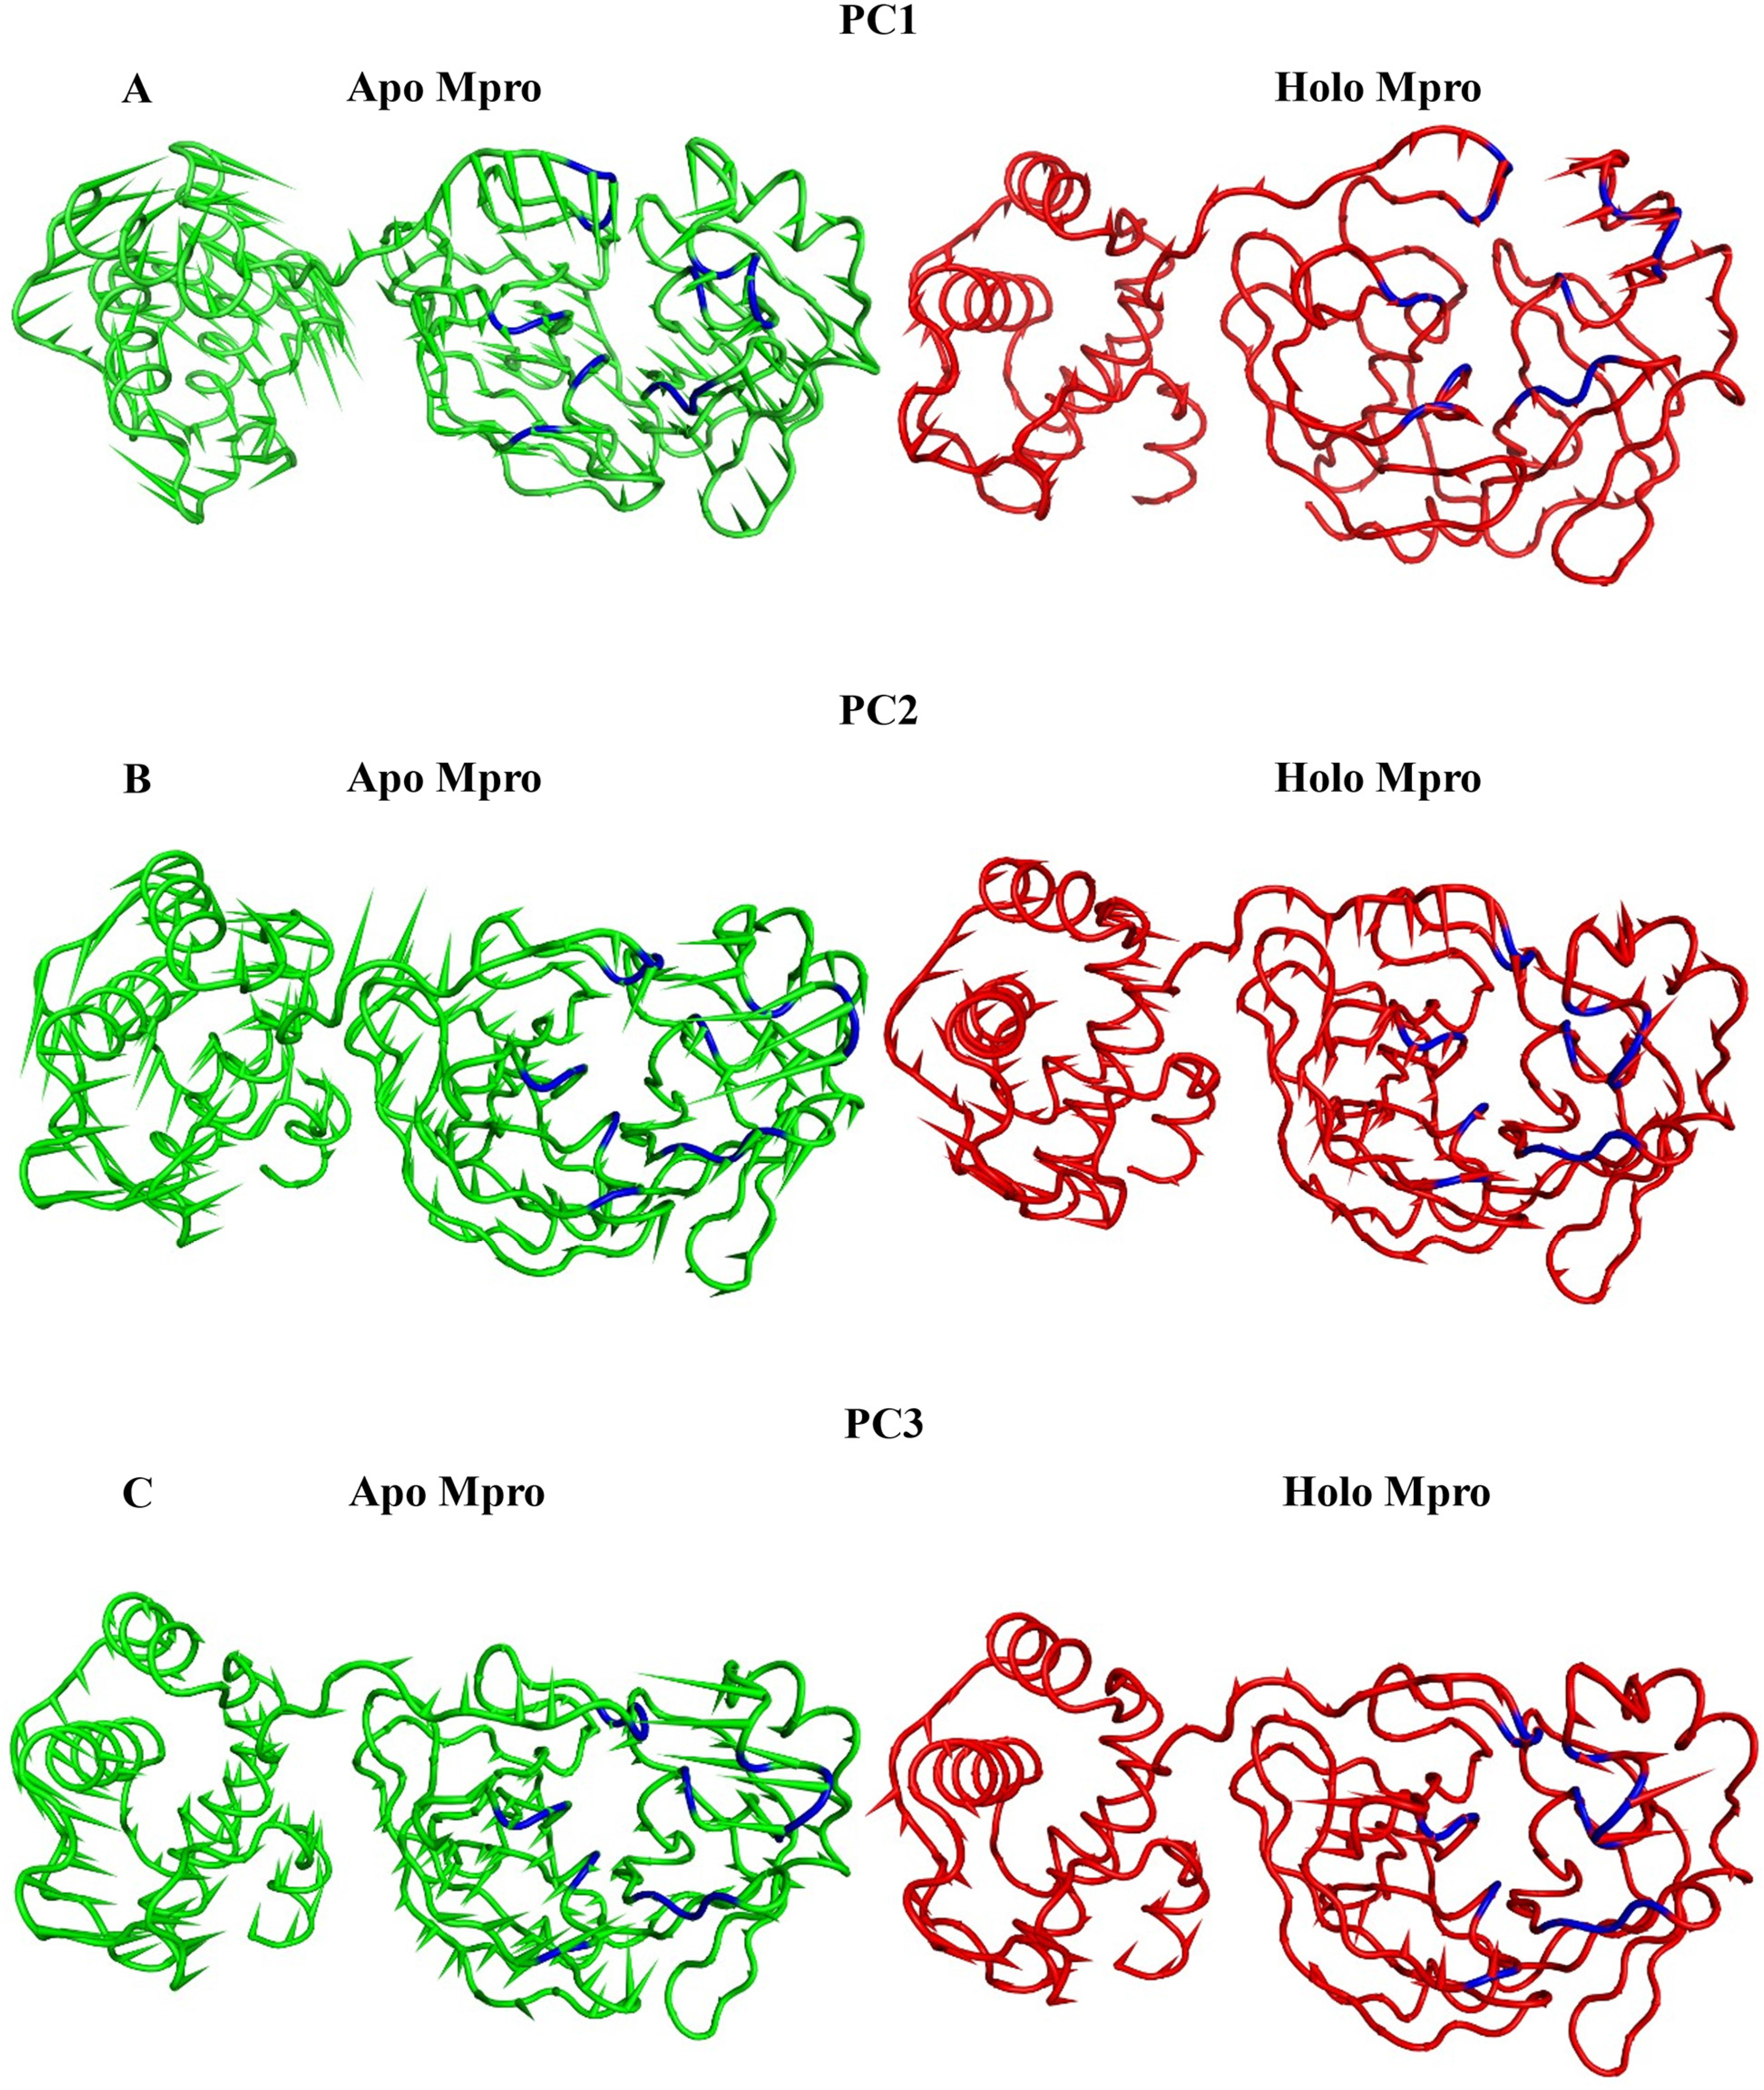
While our computational findings provide promising insights into the binding stability and potential inhibitory activity of Atazanavir against SARS-CoV-2 Mpro, experimental validation is essential. Future in vitro and in vivo studies will be necessary to confirm the efficacy, specificity, and safety of these inhibitors under physiological conditions. Such studies will provide a deeper understanding of pharmacokinetics, potential off-target effects, and therapeutic viability, ultimately advancing Atazanavir towards clinical application.
However, Atazanavir has shown promise as a SARS-CoV-2 inhibitor, aligning with studies that support its potential for repurposing in COVID-19 treatment. Previous research demonstrates that Atazanavir effectively inhibited the viral replication in both cell-based assays and animal models. 51 In combination with ritonavir, Atazanavir not only reduces SARS-CoV-2 replication in vitro but also diminishes virus-induced inflammatory responses, specifically interleukin-6 and TNF-α levels, in human lung cell lines. 52 Additionally, recent work using mouse models has shown that Atazanavir provides partial protection against SARS-CoV-2 challenge, suggesting its activity may extend across different viral variants. 53 These findings strengthen our study’s implications by situating Atazanavir as a promising Mpro inhibitor, meriting further exploration in clinical settings to fully validate its antiviral efficacy against SARS-CoV-2.
Materials and method
Molecular fingerprint studies
Discovery Studio 4.0 software was employed to analyse the molecular fingerprint between 3009 FDA-approved drugs and PRD_002214, as previously outlined. 54 Default atomic parameters, including the number of charges, halogen atoms, aromatic rings, hydrogen-bond acceptors and donors, as well as positive and negative ionizable atoms, were determined. Additionally, hybridization and ALogP were assessed to identify compounds with the closest resemblance. The methodology section in the Supplemental data offers a comprehensive explanation of the applied approach, providing detailed descriptions of the procedures utilized.
Structural similarity studies
Discovery Studio 4.0 software was utilized to analyse the molecular similarities between 74 selected FDA-approved drugs and PRD_002214, as detailed previously.55,56 Default molecular properties, including the number of rotatable bonds, rings, aromatic rings, hydrogen-bond donors and acceptors, along with ALog p, molecular weight, and MFPSA, were employed to identify the most similar compounds. The methodology section in the Supplemental data offers a comprehensive explanation of the applied approach, providing detailed descriptions of the procedures utilized.
Docking studies
Using the Discovery Studio software,57,58 docking studies against the SARS-CoV-2 Mpro (PDB ID: 6LU7) were conducted, with the co-crystallized ligand (PRD_002214) serving as a reference drug to guide the investigation. The methodology section in the Supplemental data provides a detailed description of the approach employed, outlining the procedures in depth. During the docking process, PRD_002214 was virtually docked into the Mpro active site protein, allowing assessment of its binding affinity and orientation. Utilizing a known and experimentally verified ligand as a reference provided insights into the potential interactions and binding modes of the most similar 28 compounds selected from the similarity study. The methodology section in the Supplemental data offers a comprehensive explanation of the applied approach, providing detailed descriptions of the procedures utilized.
Molecular dynamics simulations
To analyse the Mpro-Atazanavir complex’s stability and structural changes between the apo and holo forms, we conducted a 100 ns unbiased MD simulation in GROMACS 2021.59–61 Input files were prepared using the CHARMM-GUI server, 62 solvating the docked complex and apo protein in a 9.7 nm cube with TIP3P water and 0.154 M NaCl ions. Equilibration was performed to reach 310 K and 1 atm using the NVT and NPT ensembles. During production, temperature and pressure were maintained, and trajectory data was collected at 0.1 ns intervals. 63 Analysis involved RMSD calculations, hydrogen-bond measurements, and interaction analysis. The methodology section in the Supplemental data offers a comprehensive explanation of the applied approach, providing detailed descriptions of the procedures utilized.
MM-GBSA calculations
We calculated the ligand’s binding energy of the Mpro-Atazanavir complex using the MM-GBSA method with the gmx_MMPBSA program. 64 Additionally, decomposition analysis was conducted to determine the contribution of amino acids interacting within 1 nm of Atazanavir. The ionic strength was maintained at 0.154 M, and the solvation method (igb) was set to 5. Internal and external dielectric constants were set to 1.0 and 78.5, respectively. The methodology section in the Supplemental data offers a comprehensive explanation of the applied approach, providing detailed descriptions of the procedures utilized.
ProLIF calculations
The trajectory of the Mpro -Atazanavir complex underwent clustering via TTclust, a method used to group similar conformations within a molecular dynamics trajectory. This process identifies distinct conformational states by analysing the structural similarity of frames throughout the simulation. By clustering the trajectory, representative frames were extracted for each cluster, providing snapshots that encapsulate the diverse structural dynamics and conformational transitions of the Mpro -Atazanavir complex. 65 The methodology section in the Supplemental data offers a comprehensive explanation of the applied approach, providing detailed descriptions of the procedures utilized.
PLIP calculations
The PLIP was utilized to analyse these frames for the quantity and types of the Mpro-Atazanavir interactions. The resulting data was saved in a .pse file format, which can be visualized using PyMol. 66 The methodology section in the Supplemental data offers a comprehensive explanation of the applied approach, providing detailed descriptions of the procedures utilized.
PCAT calculations
PCA of MD trajectory atom mass-weighted covariance matrix (C) unveils system motion coordination. We focused on alpha carbon mobility in the Mpro protein, excluding terminal amino acids from Phe8 to Cys300. Alignment to the last frame of equilibrium stages served as the reference frame. PCA identifies eigenvectors capturing atomic motions, with eigenvalues indicating motion magnitude decreasing with eigenvector index. GROMACS tools, gmx covar and gmx anaeig, were used for C matrix diagonalization and analysis. 67 Determination of essential subspace principal components involved cumulative sum of eigenvalues, scree plot analysis, and examination of eigenvector distribution. The methodology section in the Supplemental data offers a comprehensive explanation of the applied approach, providing detailed descriptions of the procedures utilized.
Conclusion
Our comprehensive in Silico screening and molecular dynamics simulations have yielded promising results in identifying potential candidates for repurposing FDA-approved drugs to target the Main Protease of SARS-CoV-2. Among the compounds investigated, Carfilzomib, Atazanavir, Darunavir, Monomethyl auristatin E, Telaprevir, Nelfinavir, Aliskiren, and Fosinopril exhibited robust binding affinity and favourable interactions, indicating their potential as therapeutic agents against COVID-19. Atazanavir emerged as a particularly promising candidate, showing strong binding affinity and stability in MD simulations, along with positive interactions in MM-GBSA, PLIP, and PCAT analyses. These findings align with previously reported in vitro activities of Atazanavir and further provide new insights into its molecular-level activity, enhancing our understanding of its inhibitory potential.
Supplemental Material
Supplemental Material - Repurposing FDA-approved drugs for COVID-19: targeting the main protease through multi-phase in silico approach
Supplemental Material for Repurposing FDA-approved drugs for COVID-19: targeting the main protease through multi-phase in silico approach by Ahmed M Metwaly, Eslam B Elkaeed, Aisha A Alsfouk, Ibrahim M Ibrahim, Hazem Elkady and Ibrahim H Eissa in Antiviral Therapy.
Footnotes
Acknowledgements
The authors would like to thank AlMaarefa University, Riyadh, Saudi Arabia, for supporting this research.
Declaration of conflicting interests
The author(s) declared no potential conflicts of interest with respect to the research, authorship, and/or publication of this article.
Funding
The author(s) disclosed receipt of the following financial support for the research, authorship, and/or publication of this article: This research was funded by Princess Nourah bint Abdulrahman University Researchers Supporting Project number (PNURSP2024R116), Princess Nourah bint Abdulrahman University, Riyadh, Saudi Arabia.
Supplemental Material
Supplemental material for this article is available online.
References
Supplementary Material
Please find the following supplemental material available below.
For Open Access articles published under a Creative Commons License, all supplemental material carries the same license as the article it is associated with.
For non-Open Access articles published, all supplemental material carries a non-exclusive license, and permission requests for re-use of supplemental material or any part of supplemental material shall be sent directly to the copyright owner as specified in the copyright notice associated with the article.