
Abstract
This article questions the degrees of objectification and materialization of theory in material culture studies. It does so by examining the transformations and travelings of human waste diagrams, from a critique of economic externalities in sub-Saharan Africa to a tool of nonsewered sanitation planning in Southeast Asia, particularly in Indonesia: How can a theory become a scientific object but it rarely matters (e.g. turning into matters of concern/care and transforming into material artifacts)? This article firstly follows the moments in the 1990s to 2000s when a waste theory based on an accounting of flows and leakages of excrement and money was objectified as new knowledge abstracted from postcolonial cities in Western Africa, where the sewer network coverage is very low or non-existent. It then continues with what happened when the diagram's latest version—Shit Flow Diagram—was translated from English to Indonesian and its components were applied, adapted, and ignored in Indonesia and a new element in the diagram, the chain, was introduced and became a synecdoche of the waste theory. It concludes with a reflection on the limit of diagrams and the salient operation of erasure in the objectification of waste theory therein.
Introduction
Jakarta, 2016: When the ethnographer met Iman Utomo, an environmental engineer who has been working as a fecal management consultant, they were chatting about a project the latter was part of, the English-to-Indonesian translation of a diagram, the Shit Flow Diagram (SFD, see Figure 1). On his laptop screen, he showed an Excel sheet of the diagram with its five components, from the production of fresh fecal waste to the safe reuse or disposal of composted matters (see Figure 2). After the pilot study in two Indonesian cities in 2014 (Nisaa and Hajrah, 2018), he recalled there was a debate on the extent to which increasing the promotion of septic tank cleaning can be effective in minimizing leakage and preventing undesignated or even illegal final sewage disposals. The experts hoped as he felt at that time, that the diagram could be the impulse to accelerate the construction of sewage infrastructures.
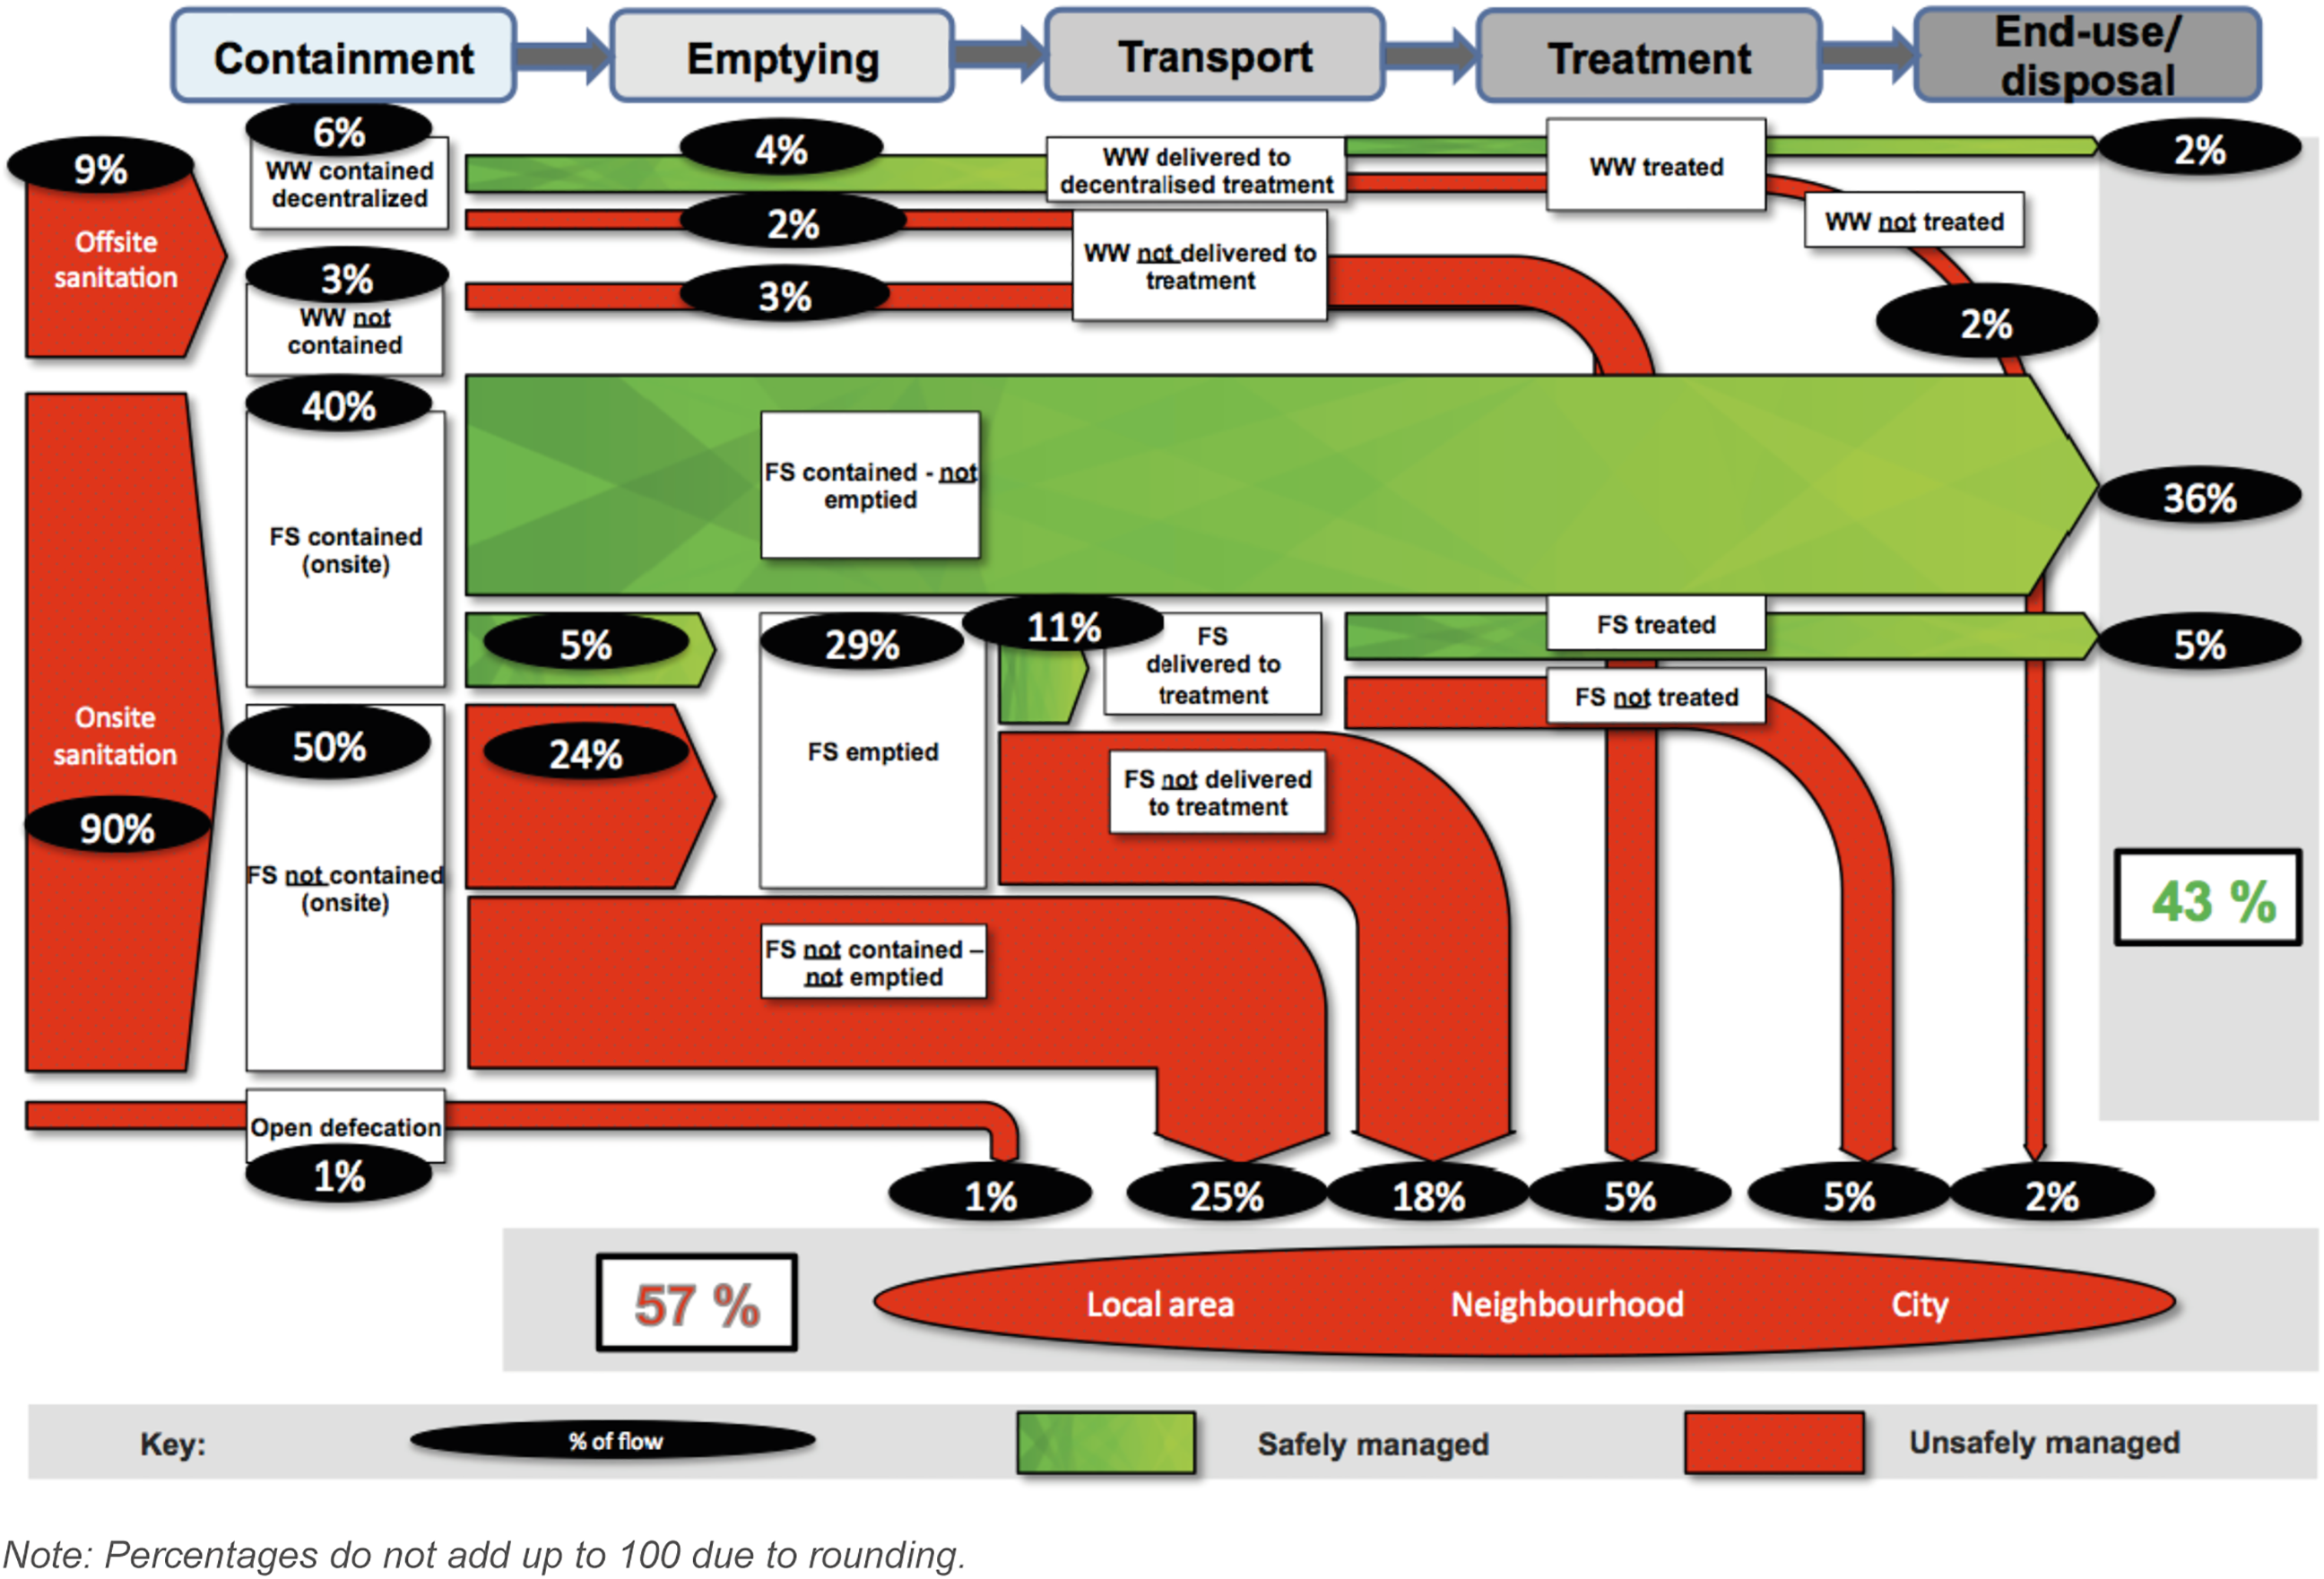
A sample of SFD (Brandes et al., 2015). SFD: Shit Flow Diagram.
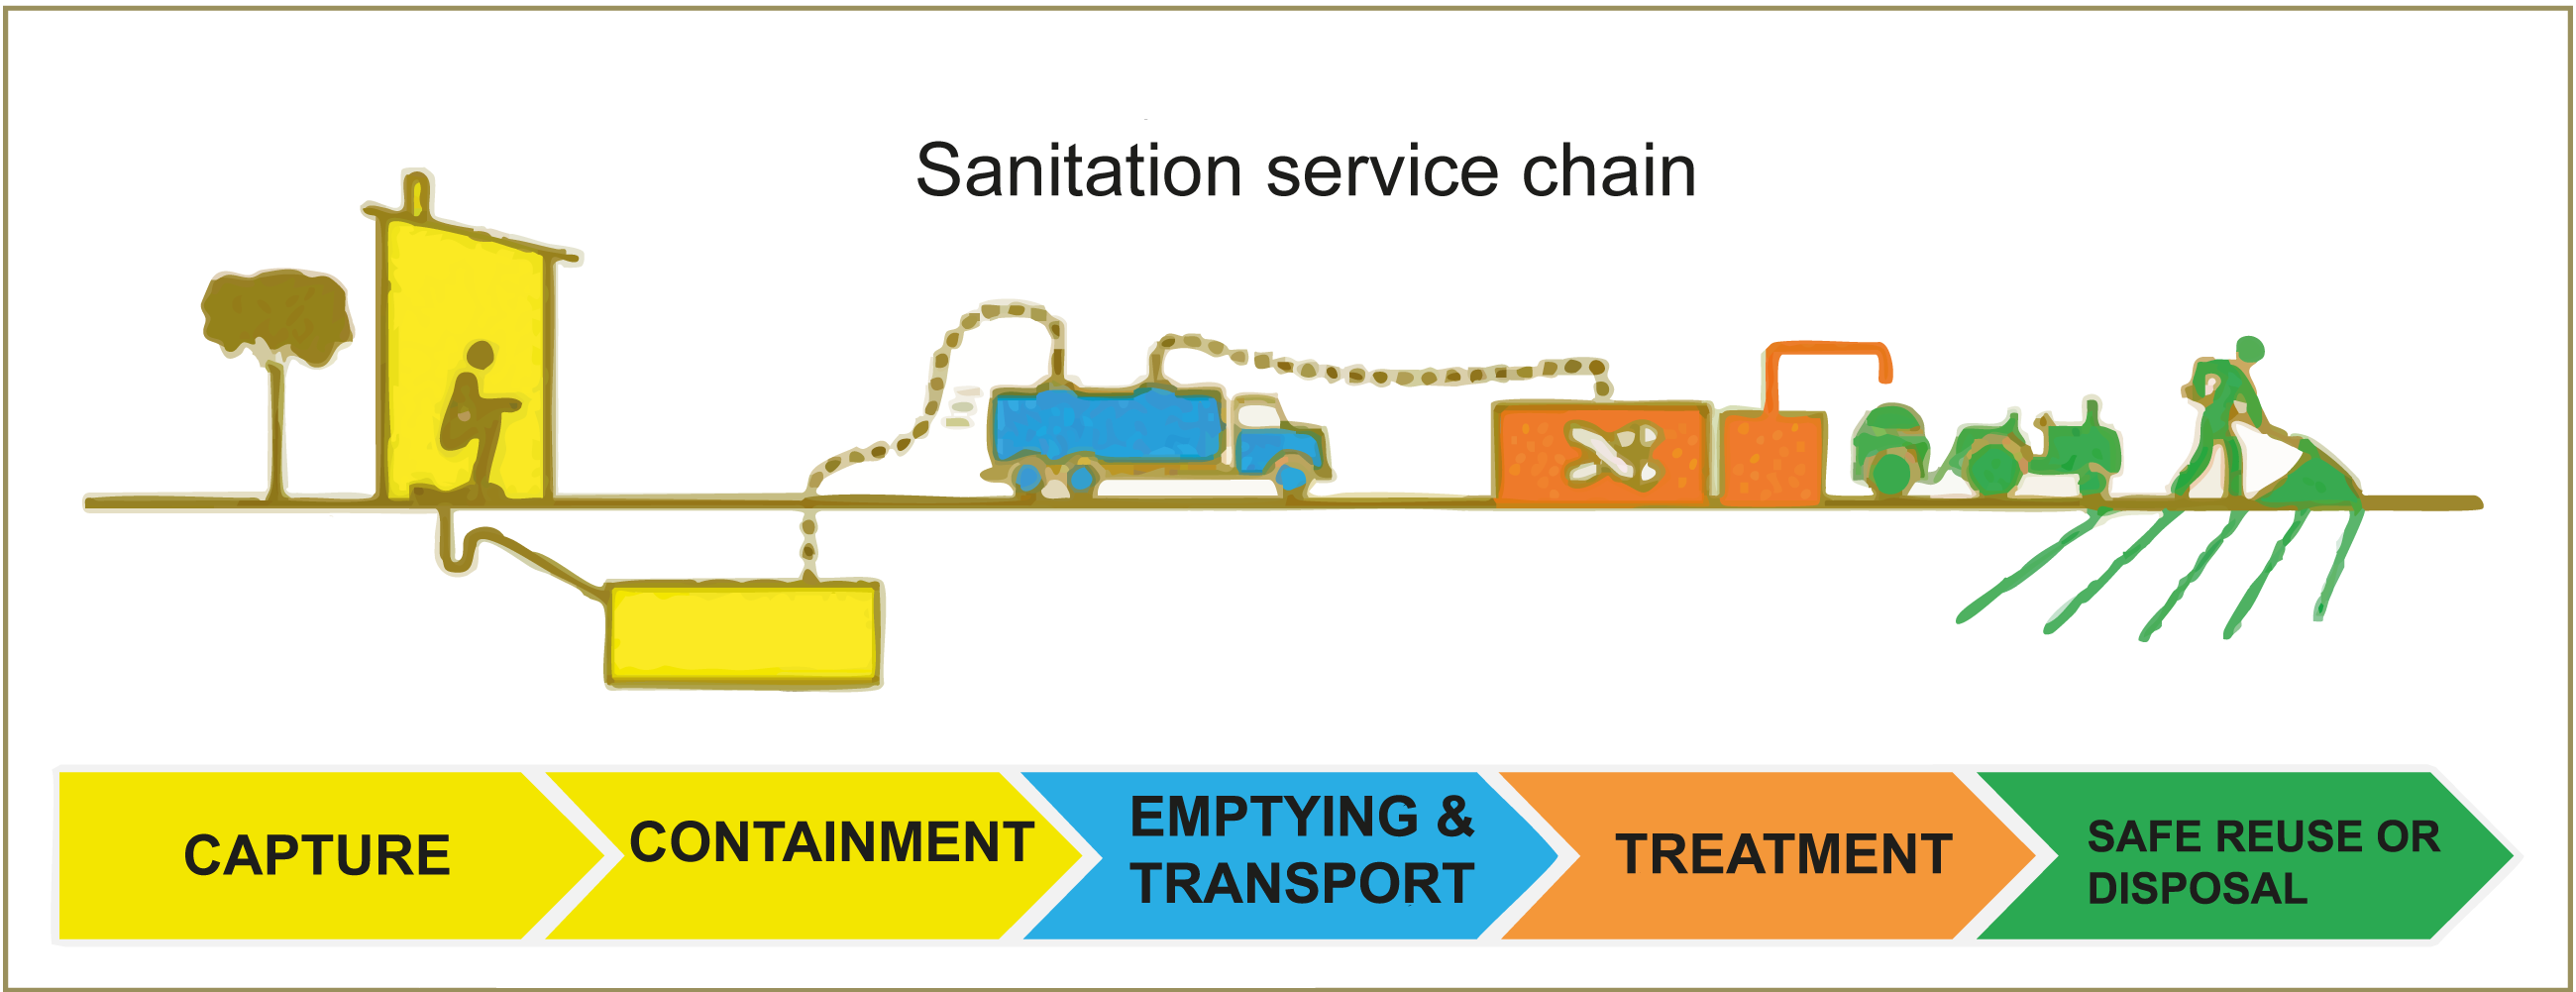
Sanitation service chain (Sandford, 2015).
Berlin, 2022: The ethnographer met Dian Apriadi, a final year doctoral candidate in Domestic Water Economy (Siedlungswasserwirtschaft) at Technical University of Berlin, and she showed her dissertation, a prototype of an online app for decision making of nonsewer sanitation technology options. She insisted multiple times that it was easier to convince policymakers to build drinking water than sewage infrastructures since it was quite straightforward to stress out that “water is life” (cf. Muehlebach, 2023) but the same logic did not necessarily apply for dirty water albeit its vitality was acknowledged. That is why she designed the app for the valuation of sanitation infrastructures.
The diagram is a key theoretical component for her doctoral project; the same five steps of the SFD were incorporated into her app whose goal was to estimate the different financial scenarios for various technological options.
Within those 6 years, the diagram has been traveling and transforming, from a tool of international development to an epistemic element in academic works, and yet, she cautioned, they did not necessarily translate into a substantial materialization of the required infrastructures. In 2021, indeed there was the inauguration of a new sewage treatment plant for Jakarta but the service area remained tiny, covering only the Central Business District area. In 2022, as a statistical reference, the “appropriate” (layak) 1 sanitation access has increased in a decade, from 55% of population in 2010 to 80% in 2021 (Bisnis.com, 2022). This statistic, she added, is actually pale in comparison to the only 7% of population who have access to safe sanitation and it has been growing very slowly. Another way to read this statistics is that in almost a decade there is surely a significant increase of construction projects related to fecal sludge management but mostly not in the form of built infrastructures and most sewage in underground tanks still leak somewhere.
How can the diagram become popular in the expert communities? As the diagram spreads, what does it actually do? This article follows the prehistory of SFD and the key actors who were intimately involved in the progenitive diagrams before it is widely known today in the networks of water and sanitation development experts, particularly those who are connected in the network of Gates Foundation (Water, Sanitation, and Hygiene Section led by Doulaye Kone), Fecal Sludge Management Alliance (also funded by GF, the office is in the Netherlands and ended in 2024), and Sustainable Sanitation Alliance (whose secretariat is at the German Development Corporation, Gesellschaft für Internationale Zusammenarbeit, Bonn). To do so, the article surveys fundamental transformations of diagrams of human waste flow from the early 1990s in Africa to contemporary Indonesia. It will give a context of the paradigm shift in “waste theory” (Bell, 2019) brought by the SFD and its precursors, as well as the involved experts who were involved in the transformation of the diagrams, from a critique of an economic theory to a popular tool in environmental engineering and policymaking.
Theory matters
A theory may dazzle and enchant the readers, but in what ways might one find out to what extent it is efficacious, entails material effects to a reality, and materializes a desired result as intended in theory? This article joins the discussion on the repositioning of theory in material culture studies. It moves away from the studies of theories as an object to be problematized (Binkley, 2000; Rose, 2011) and instead concentrates on the problems of various objectifications of theory (Palmer, 1998; Miyazaki, 2005). The discussion stems from Hirokazu Miyazaki's intervention in the debates between Daniel Miller (2002, 2005b) and Michel Callon (2005) on the spectacular convergence and distance between economic theory and economic realities. Miyazaki (2005:174) suggests that, instead of always focusing on the spectacular, ethnographic studies should be sensitive to “mundane forms of deployment” of theory. The focus should then be directed not merely to what extent certain theories may be relevant or not in material culture studies but more importantly in what ways that they materialize and have material effects through various objectifications, historical processes in the materialization of discrete objects, ranging from artifacts such as papers and computers to images and institutions, Theories and States (Miller, 2005a:10).
Following such line of thinking, there are similarities and differences between Miyazaki's study and this article. The fundamental similarity is the attention to details of how theories are operationalized in a mundane manner. This article also similarly focuses on experts who create a foundation or even take part in transforming knoweldge from the abstract into the concrete: where Miyazaki's (2013) longitudinal research on Japanese financial market professionals brought the speculator and philanthropist George Soros’ (1994) theory of reflexivity as a point of reference, this article departs from the economist Dale Whittington's (1989, 1993a, 1993b) critique of the economic theory which suggested the unprofitability of waste management business, and follows environmental engineers who take it to criticize the infrastructure ideal of centralized sewage system as the ultimate way to manage human wastes in cities. The routes through which the knowledge travels, of course, differ. Where Miyazaki saw an objectification of finance theory in a major Japanese securities firm as new knowledge that comes from the United States, the objectifications of waste theory in human waste diagrams took place in a different circuit of knowledge, from sub-Saharan Africa to Southeast Asia, brokered by research and development organizations, traveling through international cooperation and public administration channels.
This article also differs not only in terms of empirical materials but also in terms of theorizing, namely, in paying attention to the difference between objectification and materialization, unlike Miyazaki's where the two were used interchangeably. Although both terms similarly point at the societal problems of modernity and industrialization which are irreducible to capitalism, objectification stresses on consumption as a social practice by which objects and subjects are co-created (Miller, 1997), whereas materialization emphasizes on the difficulties and uncertainties in the creation of a new object since it can be undone and thus dematerialize (Murphy, 2006). In other words, while objectification takes objects for granted as its theoretical project, materialization hesitates and asks for an examination of how they are made to matter.
To do so, this article offers an empirical case of how certain experts used diagrams and theory contained in them to materialize sewage infrastructures. They were a group of human fecal waste experts used diagrams to objectify a waste theory against what was formerly imagined and believed by Euroamerican sanitary engineers, namely, that most sewage should flow within piped networks, sanitation services are laden with externalities and thus need to be subsidized by the state. They aspire to objectify a new theory viz-a-viz the diagrams and materialize a different reality. The human waste diagrams contain such a theory of waste; they show that in African and Asian cities, most excrements are scattered on and leaking to the streets, water canals, soils, ponds, and other spaces. They also argue that sanitation service providers have already made a profitable business, criticizing the theory of economic externalities.
Diagram as machine
One can differentiate the concept of diagram, as a learning machine or an abstract machine; each has a specific relation to history (Schmidt-Burkhardt, 2011). As a learning machine, a diagram acts as a visual information system that summarizes and illustrates certain histories through which one can chart her/his/their position in such historical cartography. By retracing the conceptual genealogy of “zero waste” and rearranging it into a diagrammatic timeline, for instance, one can observe that waste management is at the same time regime maintenance, as exemplified by the origin of the concept in Nazi Regime in which the individuals who sorted out and recycled waste during the authoritarian ruling period, they also maintained the Empire (Berg, 2015). The elements of this regime can irradiate and leak to other times and places beyond its original historical period.
In contrast, an abstract machine aims neither to be the subject of history nor to survey history. In this regard, a diagram is an experimental site of constitutive contestation. To Gilles Deleuze (1988), it is an abstract machine that exposes what have been missing from Michel Foucault's fascination of diagram in and as a property of modern societies. Deleuze (1988: 36) instead looks up to how the indigenous societies can transparently show “microrelations … between forces or the particular strategies … which, far from destroying these larger unities, actually compose them.” By forces, he meant the anthropological gift and counter-gift.
Diagram displays how relations between these forces constitute power in a relatively flat ontology: “not above’ but within the very tissue of the assemblages they produce” (1988: 37). These assemblages are concrete, in the forms of schools, workshops, barracks, also clinics and prisons. Despite the diagram displays relations, nevertheless, it does not mean that the function is purely representational. It infrastructures a prototype of new reality and truth.
The SFD, its predecessors, and its various versions are variations of such an abstract machine. They show an unwanted reality and an inconvenient truth that most vital wastes in Jakarta and many other cities leak into soil, groundwater, river, and any permeable nook and cranny. Implicit in the diagrams is an instructive model of an alternate future in which most wastes circulate safely within the networks. The diagrams want to make a new history, “by unmaking preceding realities and significations, constituting hundreds of points of emergence, unexpected conjunctions or improbable continuums” (Deleuze, 1988: 35).
In imagining and objectifying different circulations of wastewater (cf. Hoag, 2022), these experts contested the relations between theory and realities, the materialization of the former and the abstraction of the latter. The theory can be objectified in the form of diagrams but the objectification may not necessarily entail a substantial material effect anytime soon (i.e. fecal coliforms will still contaminate most rivers and groundwaters). Nor did the (fecal) matters become a matter of concern for the most urban residents in cities where they are living the everyday reality of infrastructural deficiency. The theory may be taught in education spaces and is used as a reference for achieving future targets, but for the time being until the next years, or even decades, the reality of sewage leakages and coliform pollution will likely be here to stay. Consequently there should be a different degree of efficacy in the materialization of a theory: some may materialize, matter, and last; others may not. If one would like to find out about the efficacy of a theory and its materialization, one needs to survey the modes and routes of circulation of the objects.
Out of Africa
Until the early 1990s, the schematic diagrams of human waste flow in the departments of civil and environmental engineering in Euroamerican universities were essentially developed from technical drawings, plans, and sections of scaled maps (see Figure 3). Both wastes and bodies themselves are absent in these diagrams. The Western engineers believed that sewage ought to circulate within networks of pipes and channels before they arrive at the Wastewater Treatment Plant (WWTP), wetland, septage treatment plant, or other forms of purification installations. Pipes and underground sewerages shall lie beneath all cities, covering all from the center to the periphery—that was the engineers’ theory. But this paradigm shifts since the 1990s and it began from Africa.
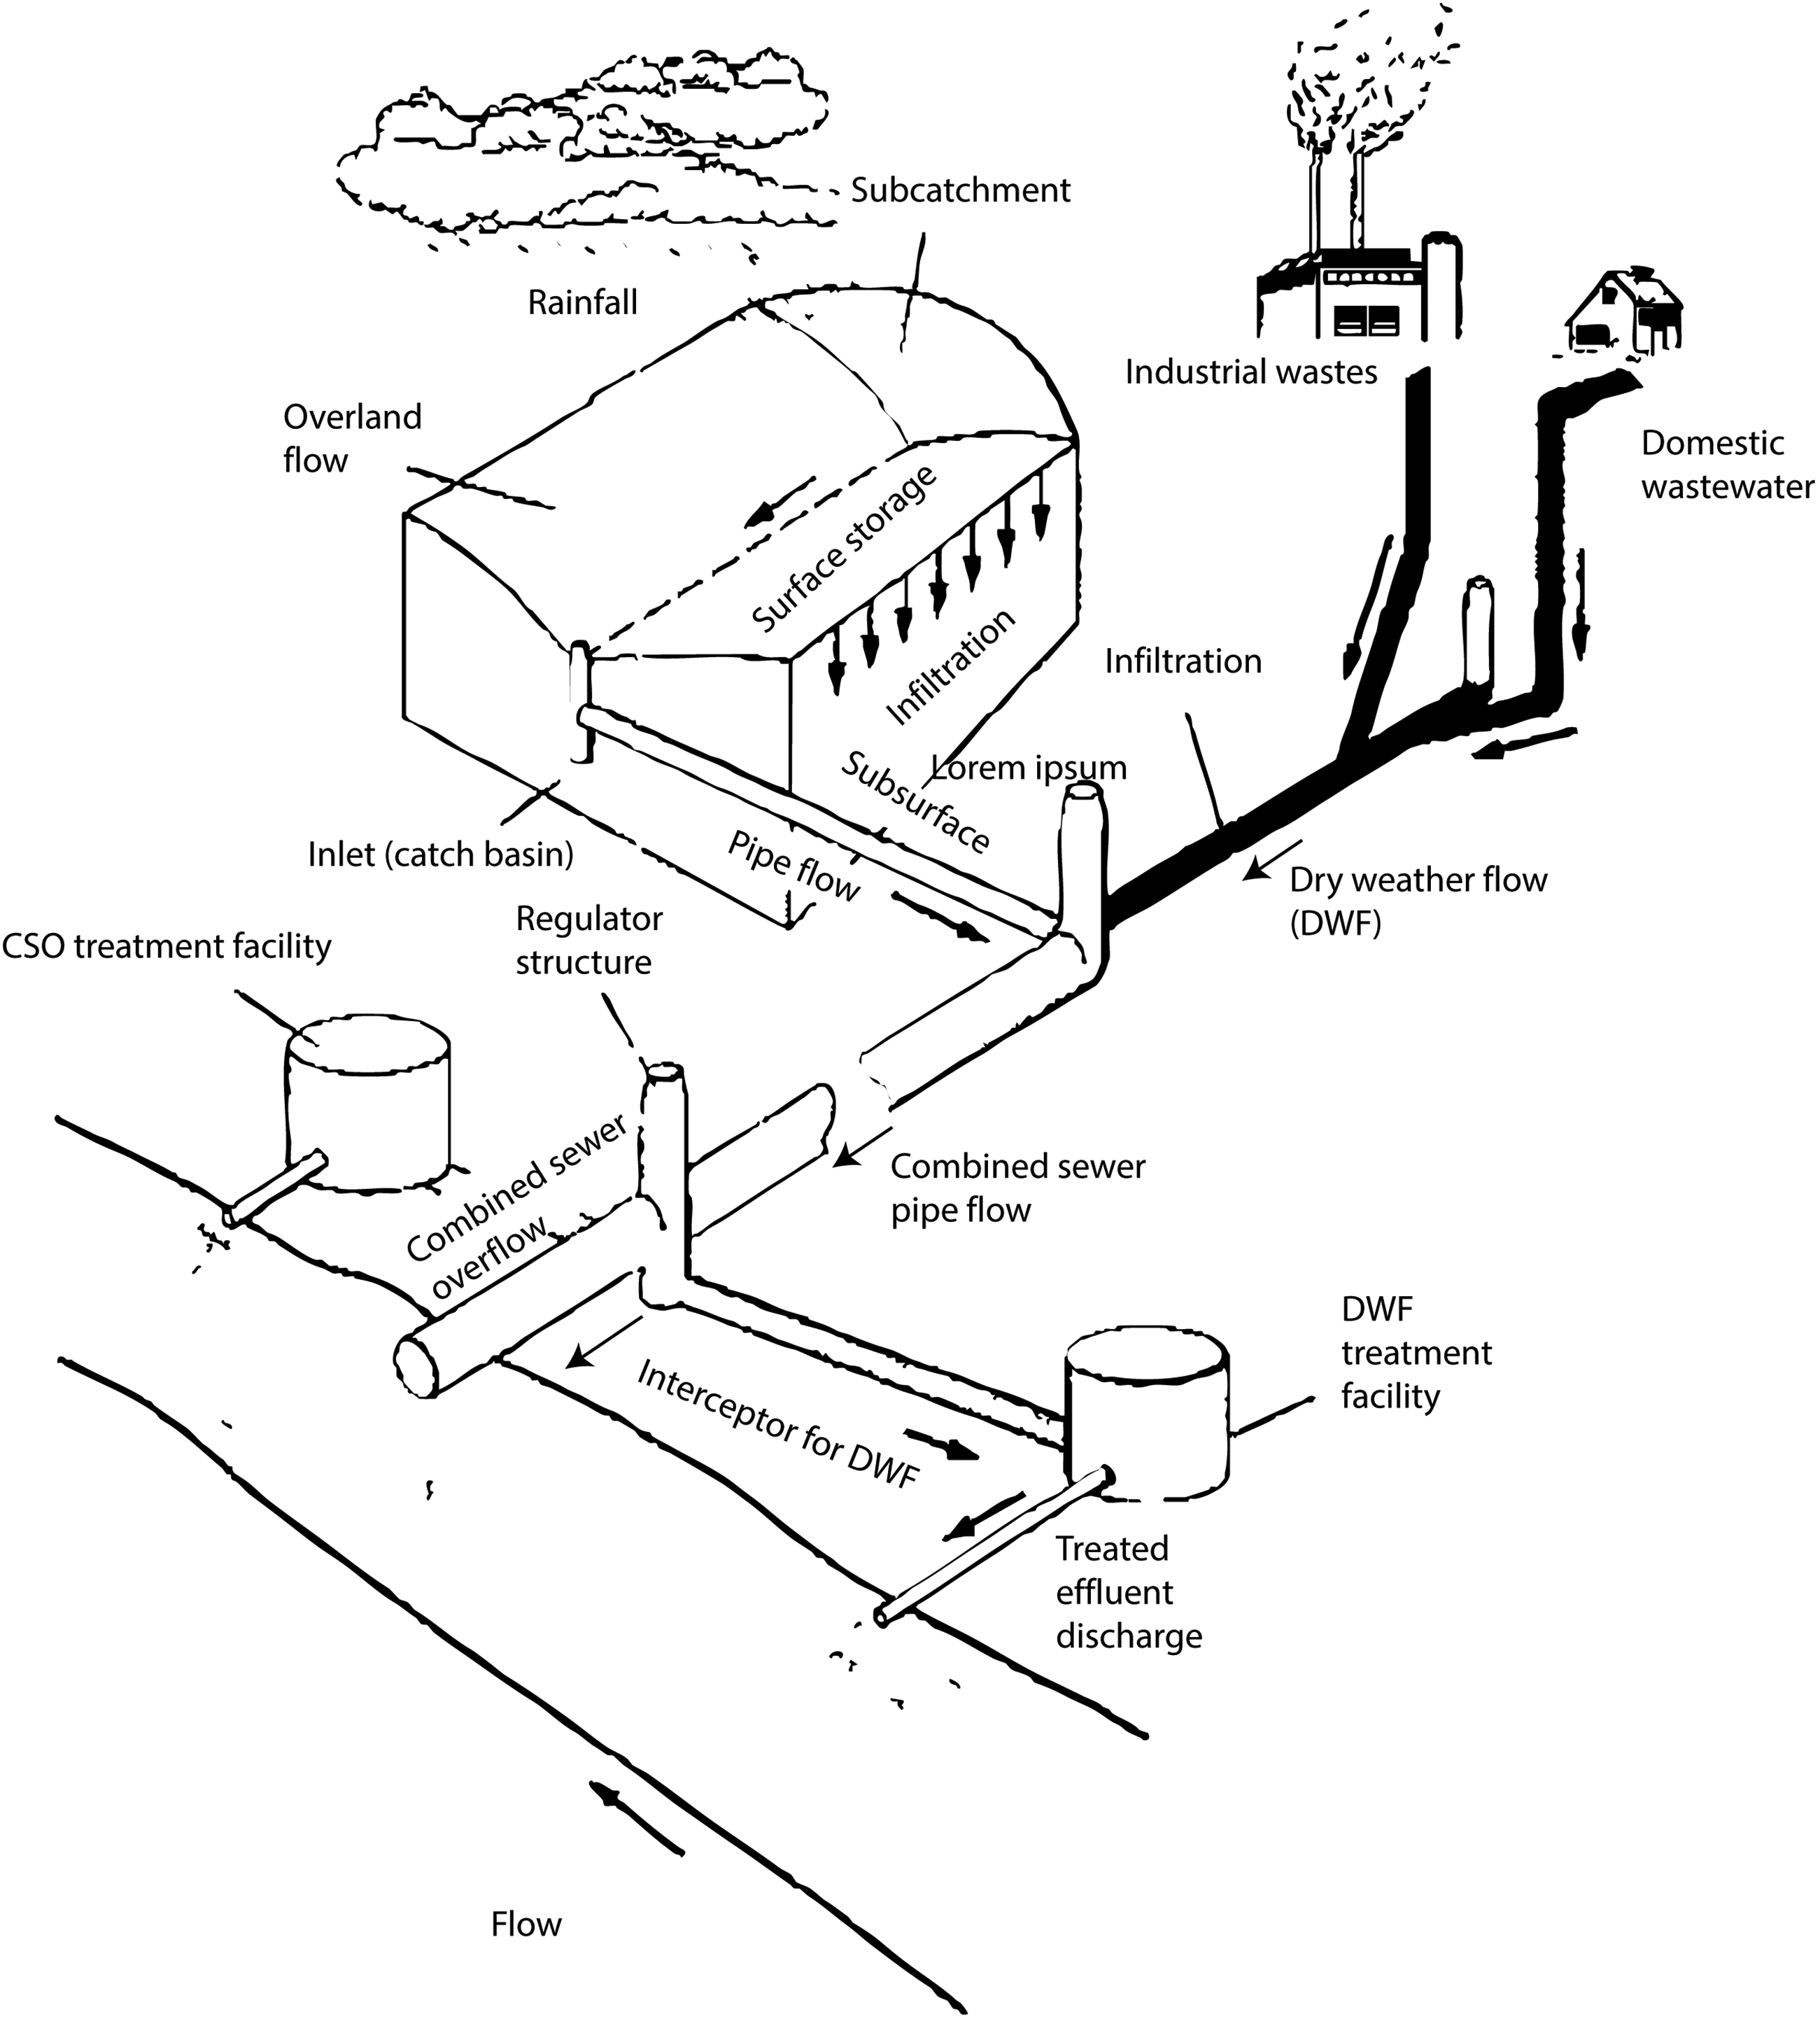
A drawing example of an engineering section (Tchobanoglous, 1991).
A trained economist, Dale Whittington and his colleagues (1993a, 1993b) from the University of North Carolina were commissioned by the World Bank in 1989 to survey the flows of water, waste, and money in Ghana, following the prediction that the rapid postwar population growth would be concentrated in the Southern cities, where the wastewater infrastructures were already lacking and the fiscal budget was limited. This is not the first study that investigated the state of urban sanitation in Africa, of course. A decade before that, an African civil engineer Kenneth Iwugo (1979) in partnership with World Bank experts had done research in Ghana studying multiple factors affecting the application and improvement of sanitation infrastructures in relation to public health in Africa. In comparison to the forerunner study, however, the survey in 1989 is exceptional because, other than the almost quadrupled size of the samples, it explicitly and instructively asked future planners and engineers to conduct field studies to account for the actual user demand. From this survey, Whittington and his colleagues formulated a prototypical diagram for estimating the flow of money and waste beyond engineering formulas for the ideal of centralized wastewater treatment plants (see Figure 4). “Most engineers in the United States and Europe visualized waste moving out of the city through sewage pipes and wastewater treatment. It's a very simple image. They didn't imagine the waste if there's no sewage collection system. Perhaps they thought it would be carted out of the city, like in China, with carts, or trucks or something. In fact, that was really not what was going on in Kumasi. Most of it was staying in the city. Very little was leaving.” (Interview with Dale Whittington, 2020)
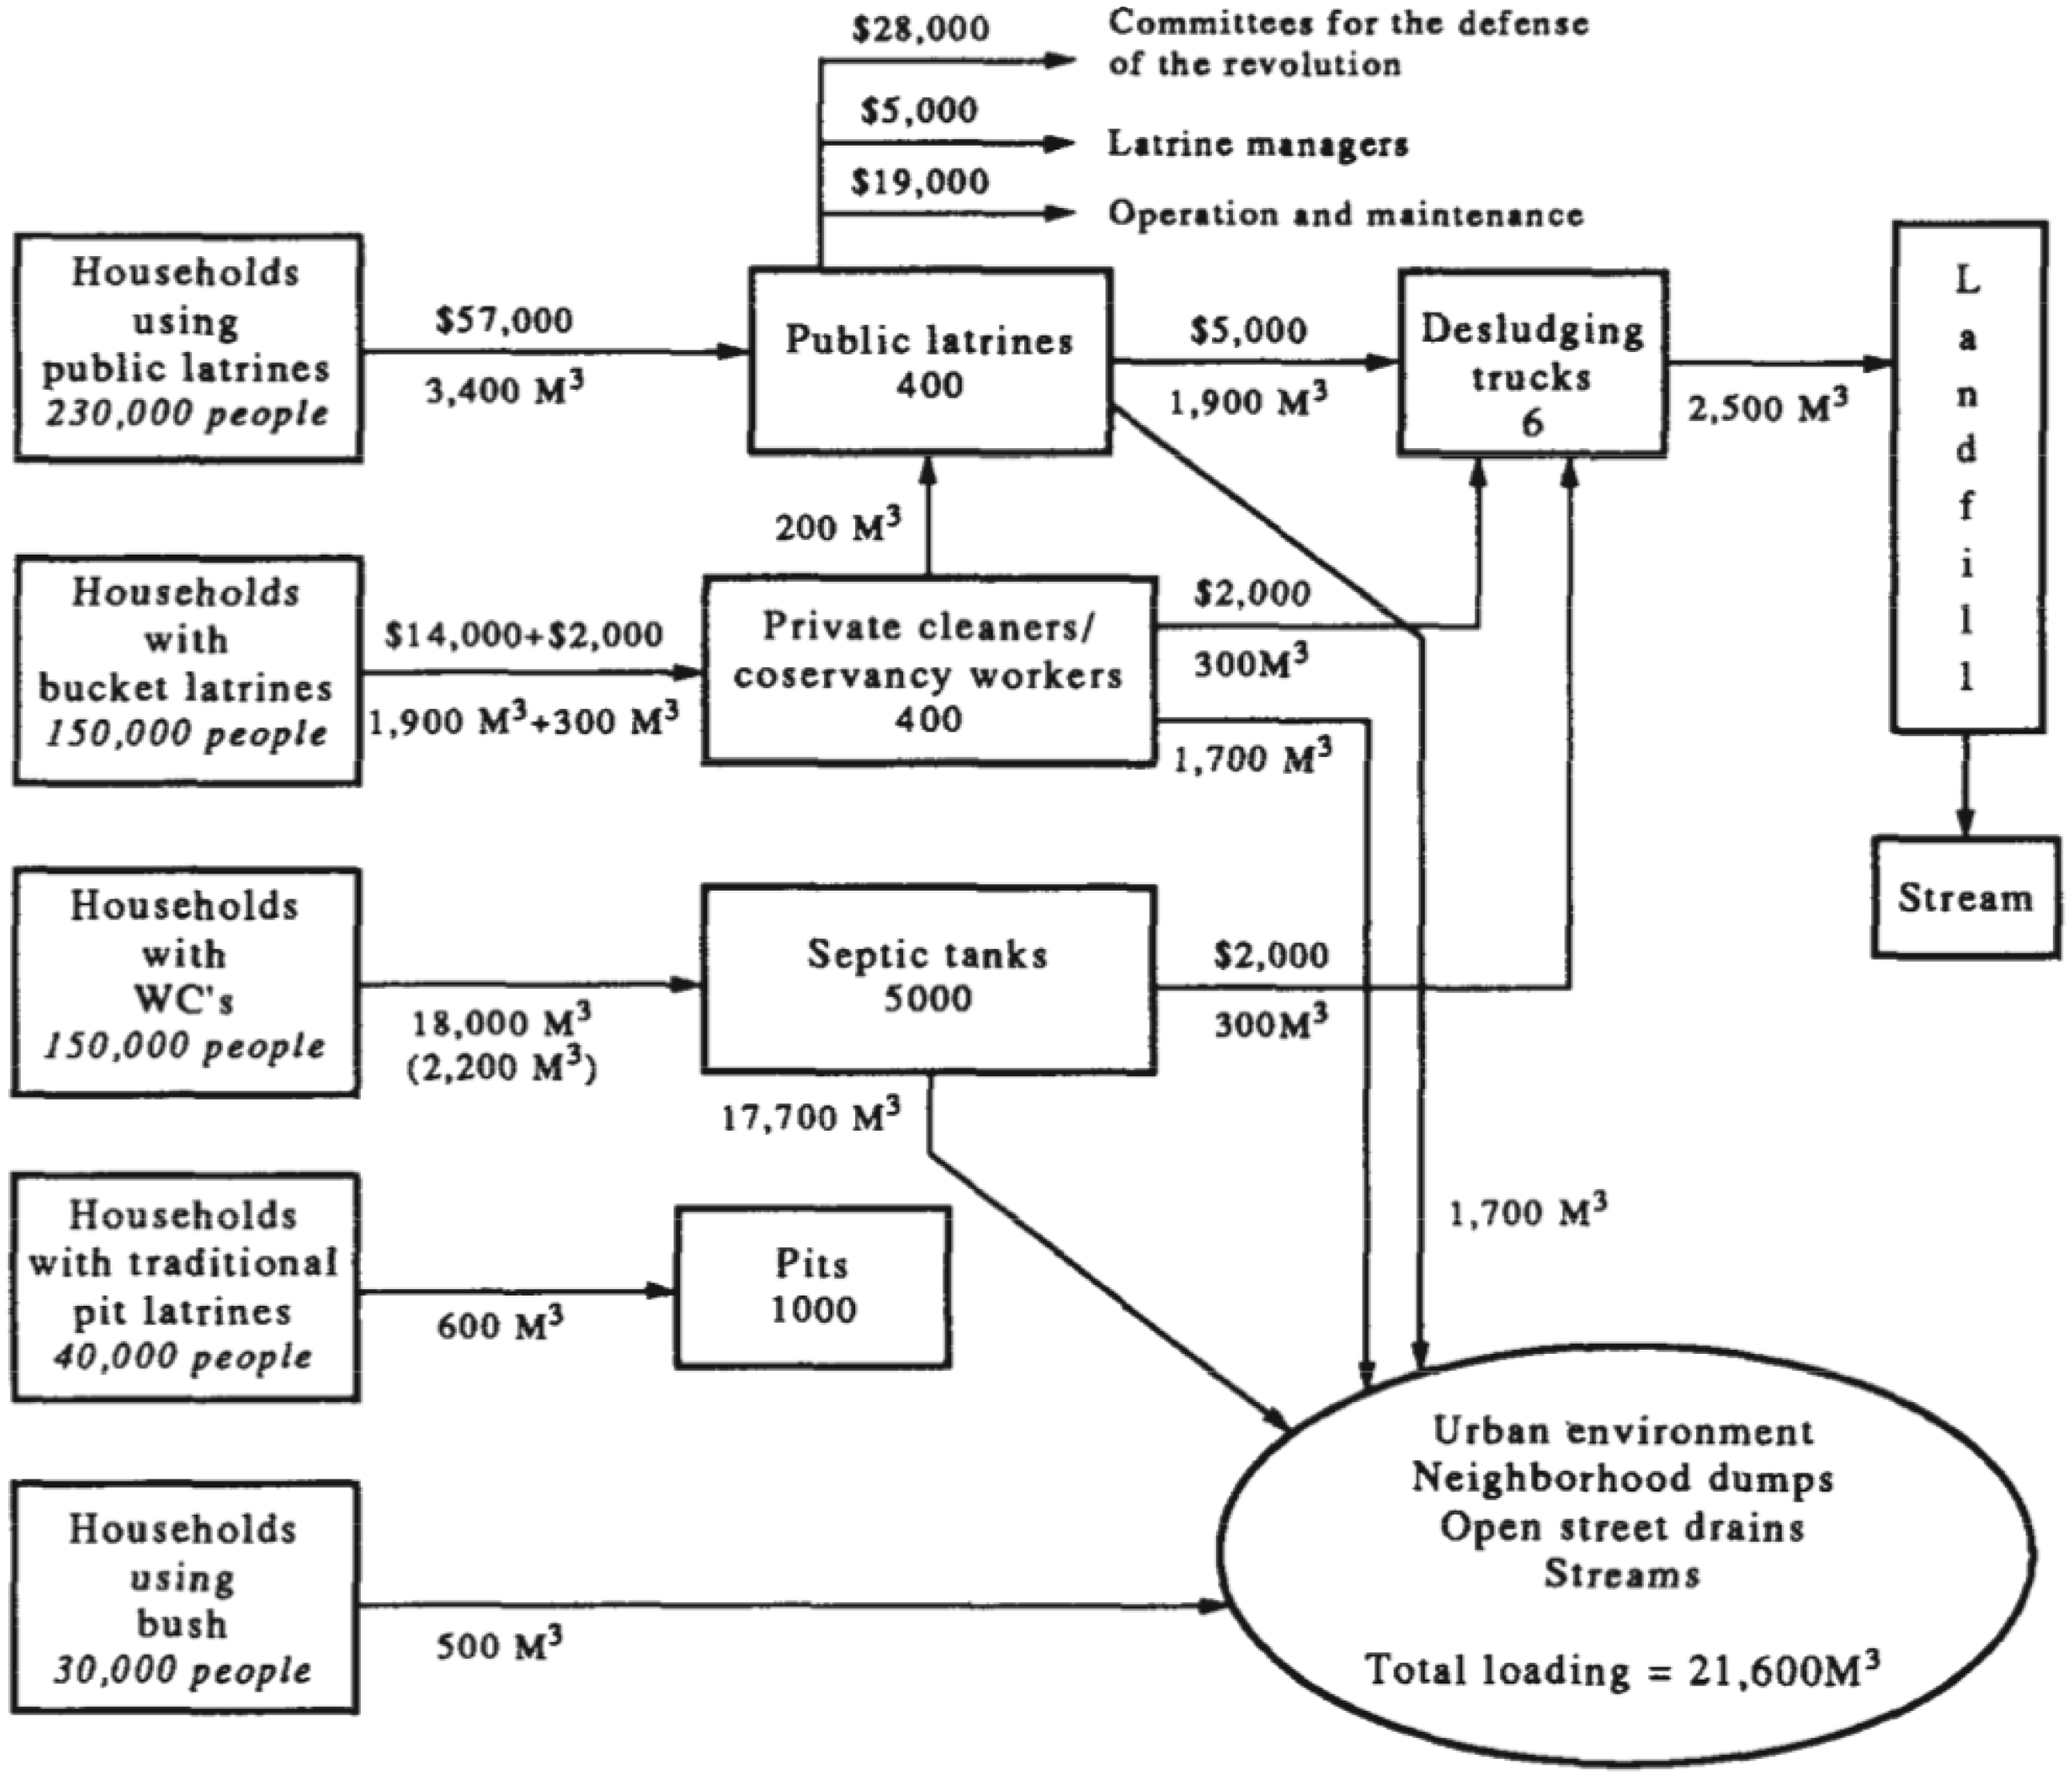
Kumasi human waste flow diagram (Whittington, 1993b).
Here Whittington made an interesting relation between a material reality and a possible imaginary of Western engineers who inhabit cities where most households are already connected to the sewerage network. Had they grew up in African cities, so would Whittington argue, the engineers could have thought differently about the existence of nonsewered sewage management. His study in Kumasi also revealed a different reality as predicted by externalities theory; nonsewered sanitation can be a profitable business, “instead of sanitation services being subsidized by the public sector as the theory of externalities would suggest, the public centers are actually serving as ‘profit centers’” (Whittington et al., 1993: 745).
The World Bank afterwards funded an expansion of a similar study and commissioned a consulting company led by Bernard Collignon and Marc Vézina (2000) to study 10 independent water and sanitation providers in Africa. From this point on, the diagram only showed the flow of waste but not the money anymore. The results of the financial survey were still available in the form of tables, graphs, and bar-charts in different places in their report, but not as lines and numbers in the diagram anymore. Why? Perhaps it is because the reality depicted in the diagrams is already recognized at this point of the development of the waste theory; it is already crystal clear that the independent providers in those African cities dominate the sewage management business, and not large formal corporations. The diagram does not need to convince anyone anymore that “the money is there.” It also made a breakthrough not only in making clear how much money might be involved in the management but also in showing where the wastes flow, covering the spatial spectrum from the city center to peri-urban areas and differentiating them socioeconomically according to household incomes and building types. In the same period, the Swiss development research center, SANDEC (Sanitation at Developing Countries) at EAWAG (Eidgenössische Anstalt für Wasserversorgung, Abwasserreinigung und Gewässerschutz, the Swiss Institute for Water Supply, Wastewater Treatment, and Prevention of Water Pollution), compiled typologies of sanitation systems, also largely based on African case studies (Tilley et al., 2008). The generic units that later on would constitute the SFD were firstly proposed in this compendium.
After Whittington's impulse in the 1990s, there is one central figure in the transformation of these diagrams into the SFD in the 2000s. Growing up in Ivory Coast, the neighbor of Ghana, Doulaye Kone completed his doctoral degree in environmental engineering at École Polytechnique Fédérale de Lausanne. He was left with a puzzle, not unlike what Whittington has noticed: most of his fellow engineers in Euroamerican universities imagined that there would be sewers everywhere and it would contain, again, mostly, if not only, wastewater. But where Whittington co-wrote papers to make this point, Kone would like to further shake this prevailing paradigm by targeting the professional association of water management experts, the International Water Association (IWA). He then invited experts in nonsewer sanitation to write papers and present them in the 2004 Specialist Group Conference of International Water Association (IWA), the largest organization for scholars of water studies. They miraculously and successfully attracted nine experts from Argentina, Vietnam, Nepal, Cameroon, Burkina Faso, and Switzerland who shared the esprit de corps. But at the end of the conference, none of their works were published by the IWA because at that time there were no evaluators in the association who had the experience of studying nonsewered sanitation. From this point on, he changed his tactic (Kone and Strauss, 2004). He started to identify and join policy groups and advocate that the majority of the urban residents in sub-Saharan Africa were living in nonsewer conditions and it may represent other regions too, where humans living close to and surrounded by fecal matters. With the support of several organizations in 2006, he successfully organized the embryonic gathering event for on-site sanitation, the International Faecal Sludge Management Policy Symposium and Workshop in Dakar (Strauss et al., 2003).
But the SFD was not yet born. Almost. In that period, Kone took some stints as a lecturer in Switzerland and the Netherlands, left academia, worked as policy manager in the African Water Association in 2009, and eventually was recruited by the Gates Foundation in 2011. He was able to translate the complexity of nonsewer sanitation system into a compact call for a paradigm shift for the philanthropic organization's board, asserted that fecal sludge's “market potential is ignored and has not yet been extensively assessed,” (Kone, 2010) and got the Foundation's enduring and sizable support. Kone expanded the empirical studies of sanitation market, not anymore based on a case study from a single country but on multiple continents. These studies contribute to the creation of nonsewered sanitation networks, which later on explicitly differentiated fecal sludge from wastewater, and objectified it as a distinct matter (Velkushanova et al., 2021). “Before I joined the Gates Foundation, a lot of knowledge came from a single case study from a country. When I joined the Gates Foundation, I had an opportunity to do a global study and pull all this together. So we did a study in thirty cities, ten countries—three cities per country. Five countries in Africa, five countries in Asia, and we pulled together this data, which was about how entrepreneurs are working along the value chain. Who is emptying the pit latrine, septic tank? How far do they take it? How much money do they earn? Who are the most successful one? What are their performance indicators, financially? I discovered that entrepreneurs made around twenty thousand to one million dollars a year.” (Interview with Doulaye Kone, 2020)
Scott took a maternity leave toward her graduation in 2011, and when she got back to work as a consultant, she was surprised that there was a big momentum in the development of the diagram. It sat in contrast with the cottage industry of nonsewer sanitation before that year. “The group interested in urban (nonsewer) sanitation in the years leading up to 2010 was very small, and therefore very influential. The route was very, very tight and very few people knew about it. The chain was not there,” she said (Interview with Philippa Scott, 2020). What she meant is, since the knowledge brought by the waste theory was only known by a small group of experts, the idea of “sanitation value chain” was largely unknown at that time. Though the diagram might seem conceptually too simplistic and lacking complexity (Scott and Cotton, 2020), within the next years it became popular tool for water and sanitation development experts. “A brilliant tool for writing reports for donors. A good tool for advocacy work. Before, if I am trying to get the attention of a Mayor and I have ten minutes of his time, and you have to start at the point of “sanitation isn't just sewers"—which is a terrible point to start for anyone who has never thought about that. Within ten minutes, because that's what you got, to get from absolute fundamentals, we need to start thinking about where all the shits in your city are going because it has these impacts, economically, health, environment, and beautification. To get to that story arc, we can now do with SFD in ten minutes. Even if I am not standing there with a SFD, because I have the clarity of thought, I have got the numbers in my head, and I can deliver it. Before that kind of visualization, that was like a six-page, ten-page reports. Now you can sell it that quickly.” (Interview with Philippa Scott, 2020)
Entering Indonesia
After the birth and growth of human waste diagrams in Africa, the SFD entered Indonesia through two pilot studies in Jakarta and Balikpapan in 2016. Iman Utomo was hired by Maraita Listyasari, a former state planner who then worked in the World Bank, to translate the SFD from English to Indonesian. At that time, he got the raw form of the diagram in the forms of a template of Excel sheet and a PowerPoint with a graphic generator. Afterwards they gave the translated version, how-to guideline, and additional tool to the Ministry of Public Works so that the government can use, revise, ad redevelop it. The chain was adopted by the Ministry of Interior and the Ministry of Public Works in Indonesia as a national policy reference in the so-called minimum service standard and to calculate new infrastructural targets of safely managed sanitation for the next 5 years. A layperson can even see well the resemblance of the drawing in the document of the Ministry of Public Works with the sanitation service chain of SFD (Figure 5).
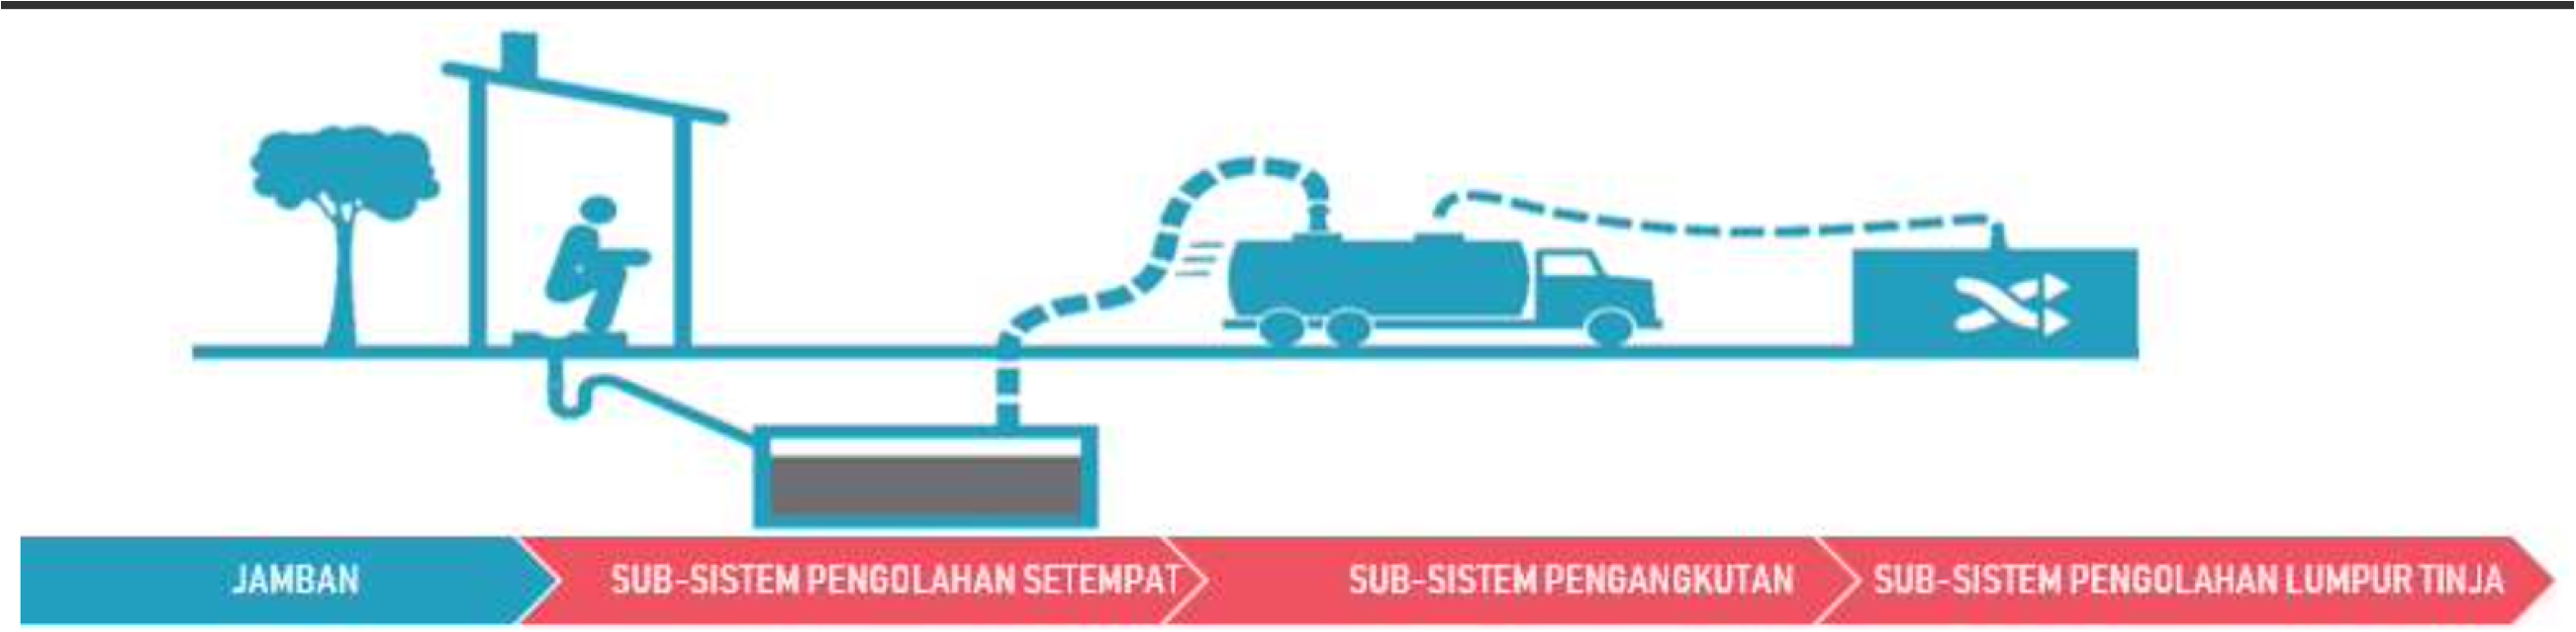
The adoption of SFD in the Technical Standard of the Ministry of Public Works of Indonesia ( Ministry of Public Works and Housing, 2018 ).
Such a partial adoption, Iman reflected, created troubles for the local governments because they have to do the extra works to provide the necessary data to feed the diagram. Many local governments rejected the targets because they thought, “we already have this and that target, and these targets were not yet achieved, why do you have to add yet another new target?” Some of them tried to recalculate, but their calculation method needed to be corrected. Others did the correct calculation, but they did not want to show a bad result. Still, some accepted the numbers as they were.
Iman thought the SFD afterwards could trigger rapid construction of wastewater infrastructures or at least use the calculation techniques in the diagram. But no. It is mainly used for planning and institutional purposes. When he lobbied the policymakers, they often used the diagram to reflect upon their personal experiences or their families and friends on the quality of fecal waste facilities in their houses. But that's it. Their reflexive gesture might not always translate into action, nevertheless, because there are many government expenses and safe sewage management is only one of them, one that does not give a quick return. The plan might perpetually stay as a plan.
In the same period, a US-funded project, the Urban Sanitation Development Program (USDP) developed another instrument using the sanitation service chain, a component of the diagram. They rebranded it into tampilan rantai layanan (service chain preview) as an alternative calculation tool. Despite its failure to materialize concrete sewage infrastructures, the diagram achieves a certain degree of popularity among Indonesian experts. Iman recalled that one can see the chain here and there in different meetings and presentation. An element of the human waste diagrams, the chain, becomes a synecdoche. It can stand for the diagram to the extent that one might mistake it for the diagram itself. The moment when a part (the chain) was taken as the whole and considered to be materialization enough resonates well with Alfred Whitehead's (1929) notion of “fallacy of misplaced concreteness,” the modernist tendency to take knowledge and epistemic objects as equivalent to reality.
The gradual objectification of the chain has radically changed what is understood today as the flow. The chain becomes an object in itself, achieving a classificatory generalization and abstraction (Bowker and Star, 2000). It integrates knowledge and gives the diagrams’ users a route from the humans’ orifices to the final disposal site and/or potential sites where the wastes might leak, and vice versa. Such an integrative function of the sanitation service chain may seem similar with Bruno Latour's (1999) chain. In one essay (Latour, 1999: 24-79) in Pandora's Hope, he recounted his experience of following and observing a group of scientists—a botanist, two pedologists, and a geomorphologist—in a section of Amazon forest near Boa Vista, Brazil. They went on a field expedition to look for an answer to a puzzle: at the edge of a forest and savanna, which one was expanding, the former or the latter? After sampling and analyzing various specimens, the scientists wrote a report stating that the forest was advancing and transforming the surrounding soils of the savanna. Between fieldwork and the final paper, Latour argued, there is the chain of transformation, translation, and mediation that converts the plants and soil into inscriptions, texts and numbers that register the traces of truth in the forest. This chain, he asserted, has two properties: reversible and has no limit at either end. By reversible, he meant that, as long as the chain is not interrupted, one can travel backwards and forwards from the things or phenomena in the world (in his case, samples of soils and plants) to the words in scientific paper and discover an integrity through and through. You shall see truth along the way unless the circuit is somehow broken or disrupted. Accordingly, the two ends of the chain, world and words, should be able to be extended indefinitely. The soil, for example, can be taken as a starting point to inquire further into the forest, whereas the scientific paper can be cited, responded, criticized, and turned into yet another paper. It should be, theoretically.
That being said, unlike Latour's chain, as mentioned by Iman, the sanitation chain has a limit at its ends. To find out what and where the limit is, one needs to trace the channels through which the diagrams travel and the effects of such traveling. The SFD and other human waste diagrams are unique in that one can examine how diagrams might materialize an idea with a certain degree of immediacy. Almost all studies of diagrams are about how they can act as an instrument to transfer knowledge (Latour, 1986; Griesemer, 1991; Baigrie, 1996; Coopmans et al., 2014; Van Leeuwen, 2016; Spankie, 2019). They are pedagogical and scholarly. However, in those studies one cannot observe the direct sociomaterial effects of diagrams and how they co-constitute society. It does not mean that scientific diagrams do not shape society and thus reality. They do. They do so through different routes, namely, through the creation of facts and artifacts from the laboratory as well as knowledge exchanges in educational spaces. Unlike these diagrams, the SFD traverses not only universities but more widely through the channels of public administration. It becomes an object that travels from one office to another, one workshop to another, one document to another, before it may be considered as a budget item that would receive a funding allocation for materializing it in the form of construction projects.
The traveling of diagrams in those channels makes it visible that a diagram is not only a drawing, but an assemblage of manuals, calculations, meetings, decision making, implementations, evaluations, maintenances, and so on. Tania Li (2011) for instance showed a glimpse of how government officials used diagrams, together with maps, charts, and lists, taped on the walls of Indonesian village meeting halls where development planning meetings usually took place. It is to a considerable extent similar to Hannah Knox’ (2020) description of how diagrams were mobilized in mapping and shaping social groups (e.g. doers, brains, enthusiasts, activists, figurehead, moneypenny, and oracle) who shall be involved in the city of Manchester's plan to reduce carbon emissions and tackle climate change. The diagrams and the accompanying devices mold a group of humans into a coherent object with shared histories, geographies, and statistical tendencies. They are governmental practices and tools that render society technical. Likewise, the SFD is not primarily meant to educate experts but to give them an impulse to reshape themselves and society.
Indeed when the ethnographer formally interviewed Iman Utomo a couple of weeks after he got the new position of Fecal Sludge Management Specialist, he was invited to give a talk for the master students of Water and Sanitation Infrastructure Management. Some of these students worked in water and wastewater companies. But it was just one day among many days in his job. Other than sitting in front of the computer, most of his days were spent with government officials, ex-government officials who worked as consultants for the World Bank and other international organizations, and technical onsultants. A diagrammatic ambassador, Iman dispersed the SFD knowledge through his network. The network is not merely a dense connection of friends, colleagues, and different forms of personal relationships. It has a reflexive quality in the sense that the people and the diagrammatic assemblage “internally generate the effects of their own reality by reflecting on themselves” (Riles, 2000: 3).
But elegiacally it seems that a reflexivity is insufficient to generate a substantial material change. The diagram has never triggered a rapid construction of sanitary infrastructures, most urban residents in Indonesia are still not connected to a piped sewer and instead rely on leaky underground tanks. That is a material reality of fecal waste management in Indonesia.
The diagram makers, of course, intended that the human waste diagrams would have an effect on the reality of the makers, readers, and users. Yet, as they travel through the channels of public administration, they become bureaucratically entangled and the wastes of the body are quantified, reduced into data. The vitality of waste is expressed in numbers and figures. Policymakers do not discuss waste per se anymore. They work with and can only be accountable when they follow certain quantitative standards and references. Despite the inevitability of datafication of life and the audit culture in our reflexive society (Ruckenstein and Schüll, 2017), we still can question how far the diagrams can be extended. The diagrams travel from the ministries of the central government to the provinces and municipalities who are in charge of translating them into local plans and actions, the construction of safe and adequate sanitation facilities, but mostly the plan stays a plan. There is the limit of the diagrams. The visualizations in the diagrams mostly remain as visualizations, the plan a plan, the theory a theory.
Conclusion
In the end, the development-oriented infrastructural plans for human waste removal in Indonesia are thwarted on two fronts: first, the diagrams that are intended to be implemented in infrastructure fail to materialize as infrastructure because they are often things in themselves, that is, the diagram is materialization enough for some stakeholders, and second, that the diagrams are thwarted by the theory of waste (and human sociality and infrastructure) that does not fully correspond to the Indonesian context, where the SFD, specifically, is treated as an additional administrative burden by many stakeholders. That is the limit of the diagrams. And it also perhaps indicates a limit of today's theory (Helmreich, 2015). It has been able to a considerable extent objectify the waste theory but it ends at the hand of the bureaucrats and policymakers who may or in many instances unfortunately fail to translate them into built infrastructure projects. The vital waste theory in the diagrams is consumed widely by experts and successfully objectified but only to a lesser extent materialized; it thus mostly remains a shadow, 2 an unrealized matter.
The diagram alone is not that powerful. It is not a vehicle that can transport itself by itself. There are diagrammatic ambassadors (Kaiser, 2019). Iman Utomo is one of them. He and the other ambassadors have actively promoted the use of the diagram through extended personal contact and circulation of people and remade it along the way. As one version of the diagram changed hands, some parts gained more attention while others disappeared. The diagrams mutate. They are plastic and become useful precisely when they can be molded and reshaped. Yet, despite their plasticity, as surveyed in this article, there is a salient operation of erasure in the diagrams.
For about two decades under consideration, the human waste diagrams underwent a series of formal erasures, turning them into a minimalist look suitable for marketing and advocacy at the same time. The abstraction of these precursors into the diagram involves a stripping of numbers, a linearization, a reduction of arrows and boxes, and a generalization of basic steps in nonsewerage sanitation management. As the early versions transform into the final version, the objectifications shift from disorder/representation to order/idealisation (Moretti, 2005). Inscription and erasure are indeed a character of diagrammatic thinking and practice (Englemann et al., 2019). But, through erasure, both as a practice and an ideal, the diagrams actually become more complicated than they look because they are not mere description. By removing certain numbers and lines and arrows, actually, diagram makers smuggle relations between the diagrams’ elements to be intuited by the readers. Under erasure functions not as a destructive but as a constitutive operation (Reddy, 2018); the diagrams become a call to imagine and to enact with the diagrammatists a certain version of a world, a projection of what universe could, should, and would be from their perspective (Gaskins, 2021), a world where the value of nonsewer economy and nonstate providers is properly accounted, a different future history of wastewater (cf. Ballestero, 2019). The diagram makers are winning the readers over by losing specific components and making it more abstract than its predecessors.
A part of “poetics of infrastructure” (Larkin, 2013), erasure objectifies the waste theory by creating a subliminal effect for the readers and disrupting the proper relationship between propreté (cleanliness) and proprieté (property) (Kim, 2022). The diagram creators strategically create a particular diagrammatic language that exists in the third space, a limbo between “seeing” and “saying” that your bodily waste is there, in front of your eyes and spoken through your mouth. It stimulates a reflexivity, an awareness of the stream of consciousness, the drive to name things, to translate and make sense of them in our microcosm (Scanlon and Gansterer, 2021). There is an “imaginary moment” when viewers of a visual representation collapse the distinction between the representational and the nonrepresentational (Stjernfelt, 2007). When you look at a diagram, there is an abstract, if metaphysical operation through which your imaginary body enters and explores the diagram. This is not that surprising since vital wastes in the studies of material culture are indeed specific in that they involve disembodiment, the process of detaching them from the body, often through routine bodily techniques (Guitard, 2017). What the diagrams do is to visualize this process at least twice: first from the corporeal body to the imaginary body, and then second when the imaginary vital waste is released and circulated outside of the body. Such layered esthetic operations could subtly evoke the colloquial difference between trash (which is produced outside of the body) and bodily waste (which is produced directly from the body or it could be the case that it was once part of the body but then disembodied).
Despite the general erasure and their fascinating charm, the diagrams eventually objectify by means of obscuring the fieldwork process and locals’ lived worlds (Bird-David, 2019). The readers do not know the intersectionality of the matters in the diagram; from what gender, race and class the wastes do they belong; from which space that they come from; who actually do the very manual labor of touching, moving, and removing living wastes and the lingering toxic health risk (Blanchette, 2019). As we have seen from the diagrammatists’ accounts, the diagram has a specific African origin and it would look different had it based on another terrain with another cleaning habit and different embedded values. Diagram is good to think with. But it needs extra works to fit in with the extremely varied and fine-grained local details. In the end, although in reality the ordering of bodily waste in the diagrams implies collective social ordering to manage waste and prevent pollution, they might look flat and rather preserve a “fecal blindness” (Kim, 2022), a denial to deal with the specificity of fecal matters.
This article nevertheless has showcased the life stories of experts who have experimented with diagrams to represent and visualize the vitality of human waste. The diagrams contain bits and pieces of their theory of life vis-à-vis waste theory. Where anthropologists such as Eduardo Kohn (2013) and Tim Ingold (2011) define what life is by borrowing theories from philosophers, this article rather retraces the "ethno-theories of life“ (Pitrou, 2015:89) imbued by the experts in the human waste diagrams. Instead of only theorising, it asks how theories objectify knowledge and the extent to which they have material effects through the intertwinement of life and technology (Coupaye and Pitrou, 2018).
Footnotes
Acknowledgements
The author thanks Iman Utomo for sharing his experiences during and beyond fieldwork. The author acknowledges the immense contribution of two anonymous reviewers who have generously provide their valuable suggestions.
Declaration of conflicting interests
The author declared no potential conflicts of interest with respect to the research, authorship, and/or publication of this article.
Funding
The author received no financial support for the research, authorship, and/or publication of this article.
Notes
Author biography
Indrawan Prabaharyaka is a researcher working at the Institute of European Ethnology, Humboldt University of Berlin. He is part of a research consortium, Collaborative Research Center 1265 “Re-Figuration of Spaces,” where he studies the application of climatology in urban planning in the City of Stuttgart. An advocate of applied anthropology, he is one of the founders of Labtek Apung, a transdisciplinary collective that brings together architecture, art, chemistry, environmental engineering, and ethnology.