
Abstract
Women differ from men in many health indicators. We tested the extent to which such differences can be explained by gender constructs in a representative Canadian cohort (N = 2423). Institutionalized gender (education, income) and seven gender domains (e.g., perceived discrimination, work strain, caregiver strain) were assessed in their association with scales assessing health and well-being, and in several self-reported health conditions. Women reported higher rates of poor mental and physical health, depressive symptoms, stress, and major depressive disorder, while men reported more cardiovascular risk factors, heart disease, stroke, and type 2 diabetes. Gender variables (in particular, perceived discrimination, caregiver strain, and low income) fully explained negative health indicators in women and strongly contributed to those in men. Social support and preparedness to take risks were protective factors. Findings suggest substantial contributions of gender variables in health disparities between women and men, highlighting modifiable prevention and intervention targets.
Introduction
Sex and gender are important determinants in human health. “Sex” refers to biological characteristics of women and men, while “gender” denotes characteristics that are constructed by social norms and expectations (World Health Organization, 2024). Biological differences between males and females of many species such as those tied to the X or Y chromosomes (Schurz et al., 2019), or hormonal differences (Kaur and Werstuck, 2021) can significantly impact morbidity, mortality, disease course, and treatment responses (Mauvais-Jarvis et al., 2020), underscoring the importance of sex-inclusive research. However, biological sex and gender are difficult to separate in humans considering that many psychosocial differences between men and women continue to persist, creating uncertainty about solely biological interpretations of sex differences in human health. Gender is tied to many intersectional factors like income (Grotti and Scherer, 2016), education (Bertocchi and Bozzano, 2020), or caregiving and work obligations (Lee et al., 2015), and it is pertinent to measure these factors systematically to address long-standing gender biases in health research (Upchurch, 2020). Unlike biological sex, such psychosocial variables, be they unique or shared between genders, can be changed, offering public health targets to improve outcomes for all people (Bartz et al., 2020).
Gender constructs are evolving and require contemporary assessment tools. For example, past decades have shown considerable societal changes for women in taking on active roles outside of the home, with substantially fewer changes for men, accompanied by weakening of gender stereotypes for women and relative stability for men (Croft et al., 2015). Differences between men and women in stereotypically feminine traits (“gentle,”“affectionate,” etc.) have similarly diminished over past decades, while masculine traits (“analytical,”“aggressive”) have not (Bhatia and Bhatia, 2021). Thus, to evaluate relationships between gender and health indicators, it is important to use contemporary gender assessment tools.
The Stanford Gender-Related Variables for Health Research (SGVHR) questionnaire was recently developed for this purpose and assesses gender on seven domains with potential health relevance: perceived Discrimination, Work Strain, Caregiver Strain, Risk Taking, Social Support, Emotional Intelligence, and Independence (Nielsen et al., 2021). Relationships between these gender dimensions and a few self-reported health variables were also probed: Health-related quality of life (general health, physical/mental health, activity limitations), smoking/vaping, binge drinking, and overweight. Discrimination and Caregiver Strain, which were elevated in women compared to men, were tied most consistently to poor health in Nielsen et al. (2021). While we recently replicated the factor structure of this scale (Abdel-sayyed et al., 2025), the health relevance of the survey needs clarification, including with validated clinical scales. For example, the men in Nielsen et al.’s (2021) cohorts overall reported lower well-being than the women. Yet a large body of literature suggests that women’s self-reported health—especially in mental health indicators (Otten et al., 2021)—is often lower compared to men (Boerma et al., 2016). Elevated prevalence of stress, mood, and affective disorders in women are particularly well-documented (Afifi, 2007). Apart from biological differences (e.g. hormonal (Li and Graham, 2017), neuroanatomical (Bangasser and Cuarenta, 2021)), disadvantageous gender roles, expectations, and sociodemographic factors in women likely have an impact (Christiansen and Berke, 2020). Conversely, men are often more likely than women to report substance use (Keyes et al., 2008), and cardiovascular conditions, with growing evidence for interaction effects between biological sex and gender in cardiovascular disease risk and course (Connelly et al., 2021). The sensitivity of the SGVHR to substance abuse and cardiovascular health has not been examined.
Thus, we focused on health variables and conditions with known differences in prevalence between women and men (Mauvais-Jarvis et al., 2020) to test the health relevance of the SGVHR gender dimensions, along with institutionalized gender (income and education). Our working hypothesis was that women would show higher rates of stress and affective symptoms, whereas men would show higher rates of substance use. Based on Nielsen et al.’s (2021) previous findings, we expected that the SGVHR gender dimensions, in particular Discrimination and Caregiver Strain, would substantially modify these relationships and may also extend to physical health indicators such as cardiovascular health.
Methods
This study received institutional ethics approval and was conducted in accordance with the Declaration of Helsinki.
Participants
Participants were recruited from several different locations across Canada through Qualtrics XM panel recruitment service using a stratified convenience sampling method to ensure national probability samples with geographic and demographic representativeness (Boas et al., 2020). Requesting equal quotas of men and women (while allowing for respondents with other gender designations), a representative distribution of 2527 adult (18+ years of age) respondents residing in Canada was recruited. After data cleaning and removal of fraudulent, incomplete, or otherwise uninterpretable datasets, a total of 2445 participants remained (see Supplemental Figure 1). Since only 22 participants identified as gender minorities (e.g. non-binary), data from individuals who did not identify as men or women were excluded from subsequent analyses, leaving 2423 participants (women = 1223, men = 1200). See Abdel-sayyed et al. (2025) for additional details.
Measures
The survey included sociodemographic questions, the SGVHR, and a series of health-related screenings and questions.
Sociodemographic questions
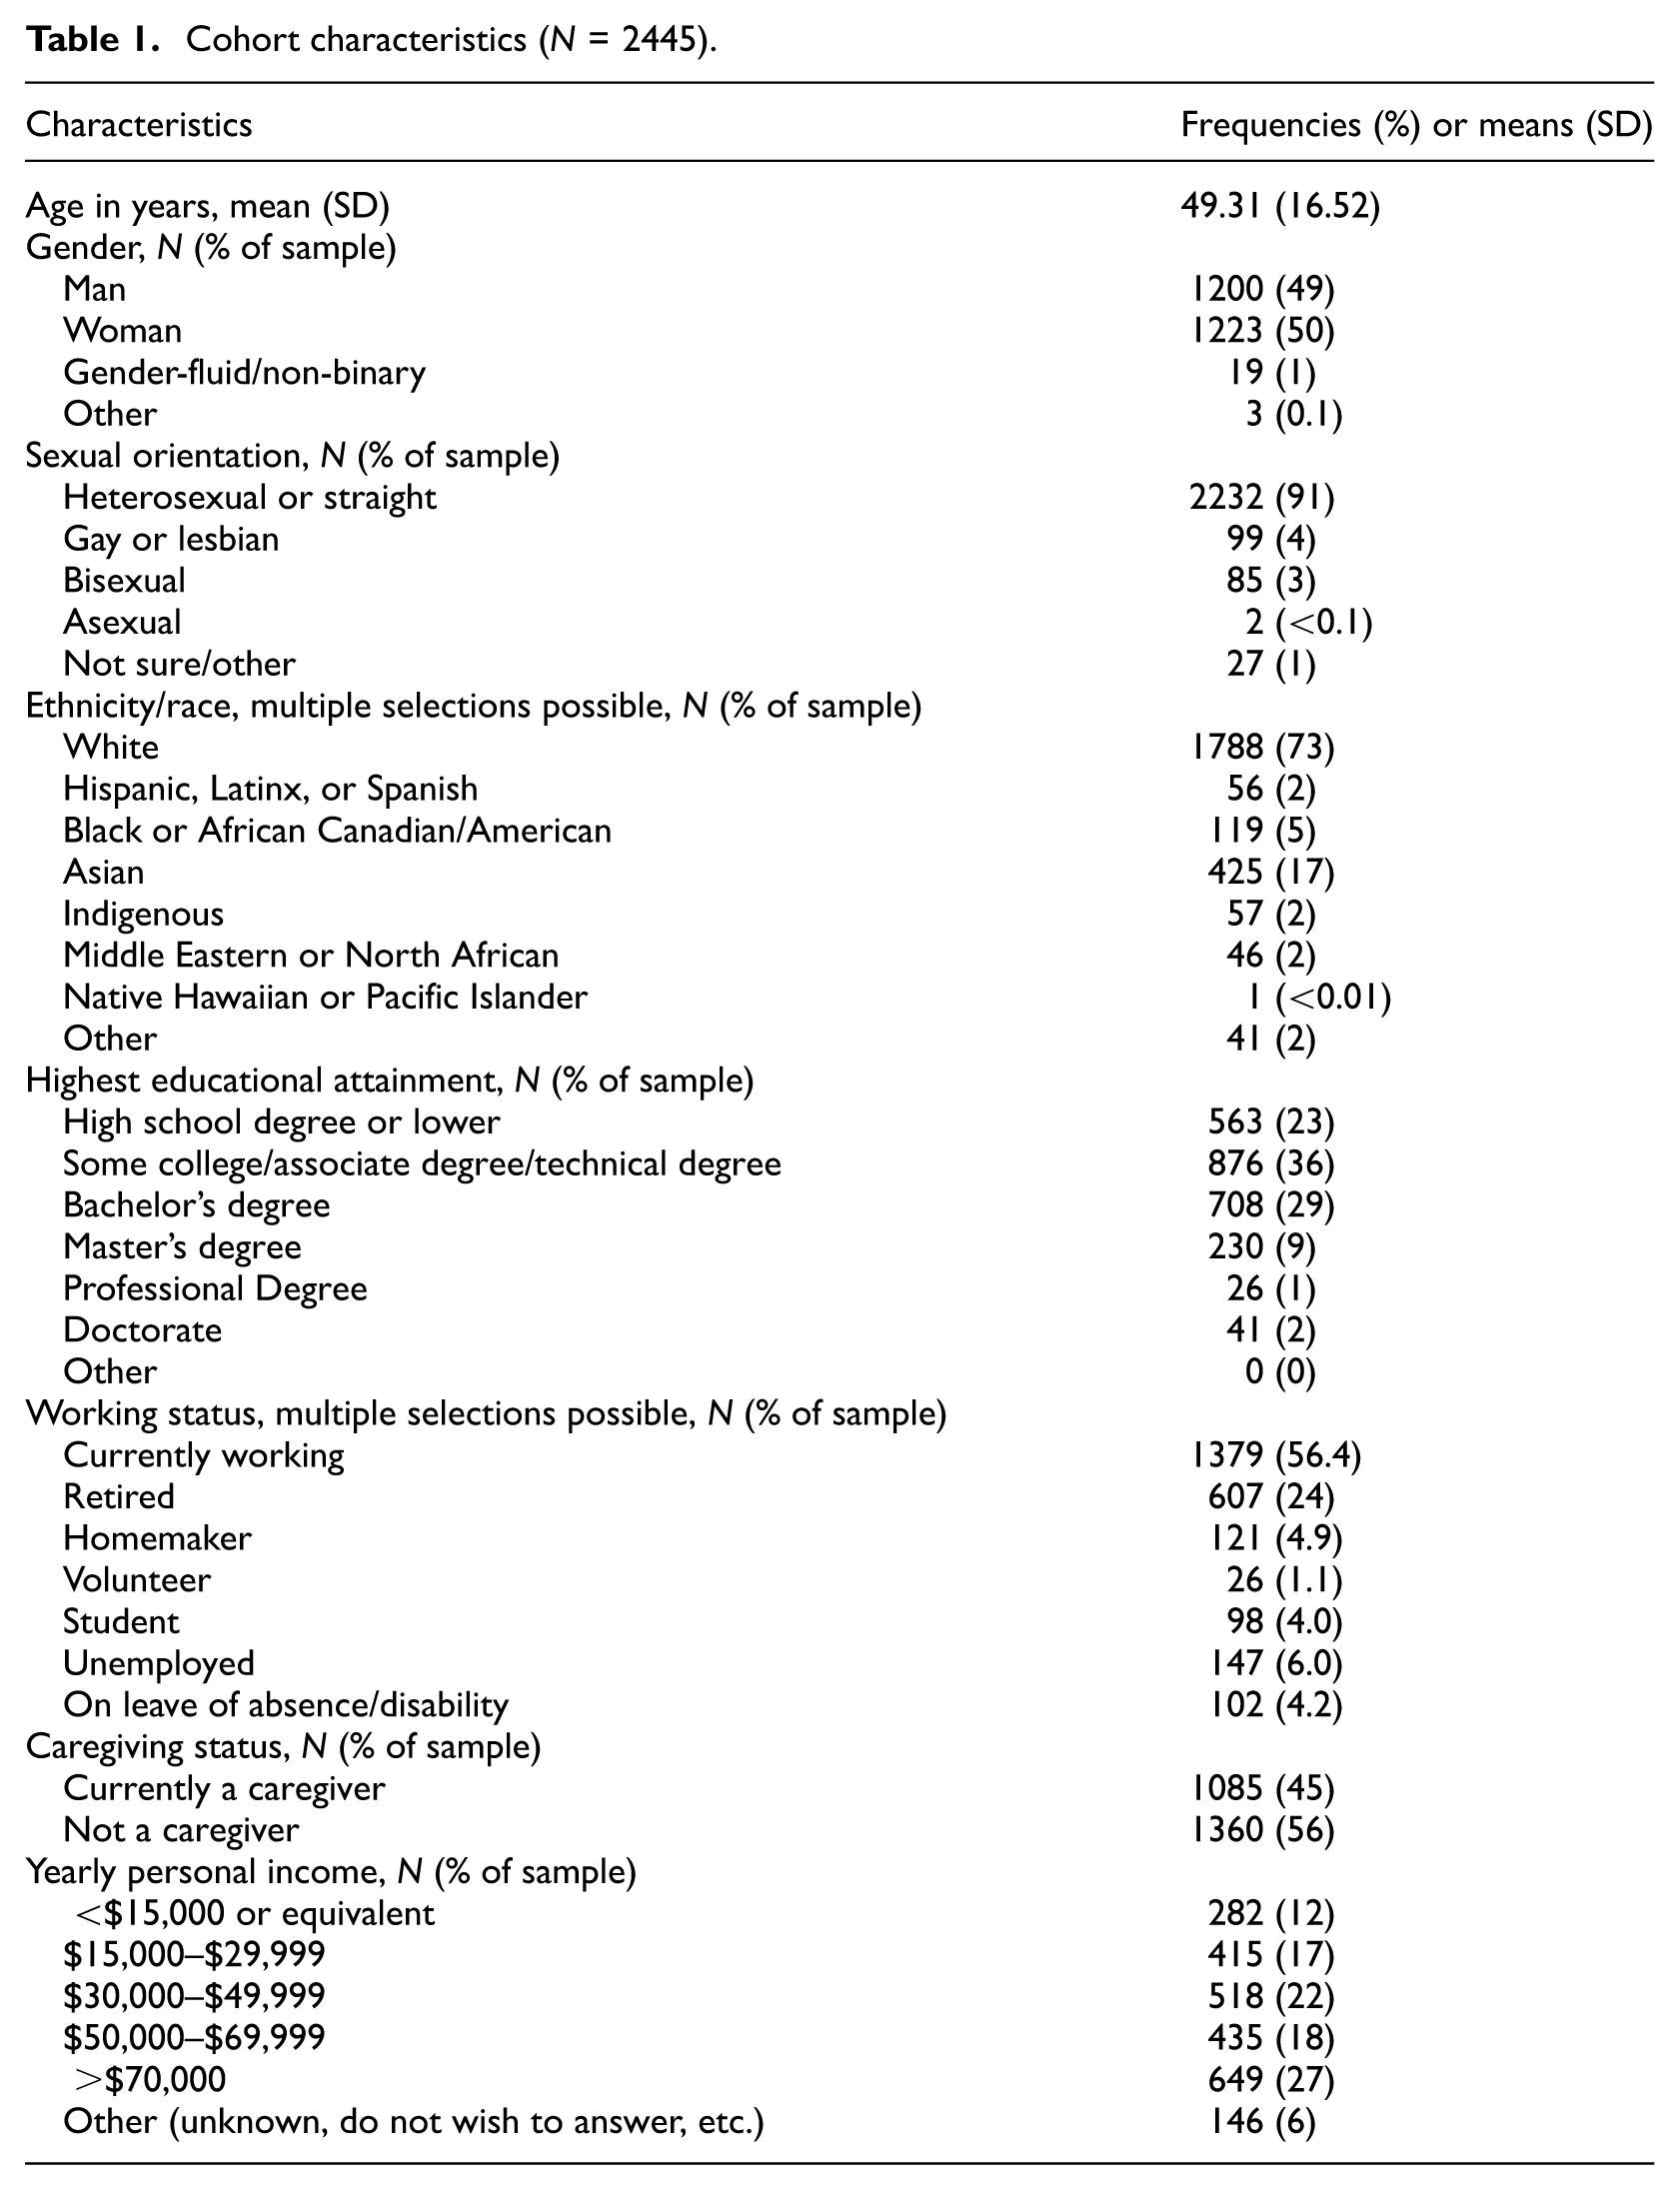
We included questions to ascertain age, gender, sexual orientation, ethnicity/race, highest educational attainment, employment status, caregiving status, and yearly personal income. An overview of this cohort’s sociodemographic characteristics is provided in Table 1.
Cohort characteristics (N = 2445).
Gender: Stanford Gender-Related Variables for Health Research (SGVHR)
The SGVHR (Nielsen et al., 2021) is a 25-item self-report survey and conceptualizes gender as a multimodal construct. Scale construction was based on extensive literature review, factor analytical reduction, and validation in multiple cohorts, arriving at an assessment of gender on seven dimensions, using 23 items with 5-point Likert scales and two items querying time estimates for weekly work and caregiving activities: The 6-item Discrimination subscale (in this cohort, Cronbach’s α = 0.92) measures frequency of gender-based unfair treatment (example: “Because of your gender, how often have you felt discriminated against when getting hired?”). The 5-item Work-Strain subscale assesses emotional and physical demands related to work (“How often do you feel emotionally exhausted from your work activities?,”α = 0.90). The 4-tem Caregiver-Strain subscale measures the negative impacts of unpaid long-term caregiving (“In the past year, how often did you feel physically exhausted because of your caretaking responsibilities?,”α = 0.89). Risk-Taking gages a person’s propensity for taking risks on 3 items (“How prepared are you to take risks when making financial decisions?,”α = 0.81). Social Support has two items evaluating the availability of social support (“In the past year, how often did you have someone to help you with daily chores?,”α = 0.74). Emotional Intelligence measures a person’s ability to recognize and use their emotions in problem-solving with 3 items (“How often do you talk to your friends about your problems?,”α = 0.65). The 2-item Independence subscale assesses how much a person values being independent (“How important is it for you to solve your problems on your own?,”α = 0.73). Scores in each of the SGVHR items were first z-scaled and then summarized into the seven subscales.
Health-Related Quality of Life Core Module (CDC HRQoL-4)
We assessed self-rated health using the four items from this module querying perceived general health, along with recent (past 30 days) physical health, mental health, and activity limitations. Answers in general health were dichotomized to represent general health as fair or poor (reference = 0) or good, very good, or excellent (1). Due to the severe skewness of days-per-month estimates, dichotomization of these three HRQoL-4 items is common (Dumas et al., 2020; Wilkins et al., 2018), and was also performed by Nielsen et al. (2021) to identify individuals affected by meaningful levels of distress or limitations. We followed this approach and used the common dichotomization threshold of 14+ days to reflect “poor” physical or mental health, or extensive activity limitations (coded as 1), compared to “good” health (13 days or less, coded as 0).
Alcohol Use Disorders Identification Test Consumption (AUDIT-C) and Drug Abuse Screening Test (DAST-10)
To assess alcohol consumption, the three-question AUDIT-C (Bush et al., 1998) was used, with scores ranging from 0 to 12. Scores were dichotomized as 4 or more indicating potentially problematic alcohol consumption for men, and scores of 3 or more for women. To assess substance abuse in the past 12 months we used the 10-question DAST-10 (Skinner, 1982) with scores ranging from 0 to 10, indicating presence and severity of substance use. Outcomes in the DAST-10 were dichotomized to represent positive indicators of substance use at scores of 3 or above (“moderate level” of substance use).
Patient-Health Questionnaire (PHQ-2) and Perceived Stress Scale (PSS-4)
The two-item PHQ-2 is the short version of the PHQ-9 (Kroenke et al., 2003). It assesses low mood and anhedonia as core symptoms of depression within the past 2 weeks (example: “Over the last 2 weeks, how often have you been bothered by the following problems? Little interest or pleasure in doing things.” Answers range from 0: “not at all” to 3: “nearly every day”). PHQ-2 totals range from 0 to 6 and were dichotomized at the clinical threshold of 3 or above indicating a high likelihood of depression (Kroenke et al., 2003). The four-item PSS-4 is the short version of the Perceived Stress Scale which measures the frequency and severity of perceived stressors within the past month (Cohen et al., 1983; example: “In the last month, how often have you felt that you were unable to control the important things in your life?” Answers range from 0: “never” to 4 “very often”). Total PSS-4 scores range from 0 to 16. The PSS-4 has no clinical threshold, but considering 8 points as 50% of the scale’s maximum score we dichotomized the PSS-4 total to indicate high stress at 8 or more points following previous studies (Campbell et al., 2020; Giovenco et al., 2022).
Health-related variables and conditions
A number of health-relevant variables and conditions with potential differences between men and women (Mauvais-Jarvis et al., 2020) were queried. These included weight and height to calculate body-mass index (BMI = kg/m2), dichotomized as scores of 30 and above indicating obesity versus scores below 30 indicating non-obese BMI. Blood pressure, cholesterol, and fasting glucose levels were probed and dichotomized as positive (“high” responses) or negative indicators (“low” and “I don’t know” responses). Cigarette smoking was queried as average cigarettes smoked/day and years of smoking, dichotomized into a single score for any indication of past or present cigarette smoking. Specific health conditions were queried with “yes,”“no,”“I don’t know,”“do not wish to answer” as response options: Major depressive disorder, type-2 diabetes, heart disease, stroke, chronic obstructive pulmonary disease (COPD), cancers, Alzheimer’s disease, influenza, kidney diseases. Endorsement was coded as “1,” all other responses were coded “0”.
Statistical analyses
The institutionalized gender variables education and personal income were simplified into three categories and dummy-coded. This categorization resulted in 1334 individuals in the educational attainment reference group (less than a bachelor’s degree), 666 individuals with a bachelor’s degree, and 227 individuals with postsecondary education. A total of 146 participants did not report an income such that the final numbers within income brackets were 686 individuals that reported ≤$29,999 personal income per year, 514 individuals with $30,000–$69,99, and 1077 individuals with $70,000 or more personal income per year.
We first conducted univariate comparisons between men and women using χ2-tests for dichotomous variables or t-tests for continuous variables (SGVHR dimensions). Health variables that showed univariate differences between men and women were then further tested with hierarchical logistic regressions, conducted on 2277 participants (1127 women, 1150 men) without imputing missing values in income. To reduce the number of analyses, we summarized high blood pressure, high cholesterol, high blood glucose, or smoking as cardiovascular risk factors (CVR), coded as “1” for positive indications for any one of these four variables and “0” if none of them were endorsed. Furthermore, we summarized heart disease and stroke as cardiovascular diseases (CVD), again coded as “1” if either were endorsed and “0” for negative responses in both.
We tested two models for each health indicator: Simple models included age and being a woman (vs man = 0). In the complete models, we added the SGVHR, income, and educational attainment in a second predictor block. Analyses were repeated in women and men separately to test if the gender variables in block 2 contributed similarly or differently to health in women than in men. Bonferroni-corrections were applied to correct for the number of models we tested. All statistical analyses were carried out with SPSS v.29 (IBM SPSS Statistics, 2023).
Results
Cohort characteristics are summarized in Table 1. We obtained data from 1200 men (49%), 1223 women (50%), and 22 participants who identified as gender-fluid, non-binary, or another gender. The cohort was middle-aged (mean age = 49.31 years, SD = 16.52) and predominantly “White” with heterosexual orientation. The majority’s (59%) highest educational attainment fell below a bachelor’s degree, and 45% reported an annual income of at least CAD $30,000. Over half of the cohort (56.79%) reported they are currently working, 24% reported being retired, and almost half (45%) reported having some caregiving responsibilities.
We tested univariate differences in health variables comparing women (N =1223) with men (N = 1200), omitting the small number of individuals identifying as gender-fluid/non-binary or another gender. Compared to men, women reported more problems with physical health, mental health, and activity limitations, depressive symptoms (PHQ-2), stress (PSS-4), and rates of major depressive disorder (all p’s < 0.05). Conversely, men reported higher rates of type 2 diabetes, cardiovascular diseases (heart disease, stroke), and cardiovascular risk factors (high blood pressure, high cholesterol, high blood glucose, and smoking). Apart from these nine health indicators, none of the other variables showed univariate differences between women and men (Supplemental Table S2 for statistical details).
We then followed up with nine hierarchical logistic regressions, one for each health indicator that had shown differences between men and women, probing effects of age and being a woman in simple models first, and then adding the SGVHR, income, and education in block 2 in the complete models. Note that most of the predictors in block 2 differed between women and men in the expected directions, that is, to the disadvantage of women compared to men (Supplemental Figure 2). As shown in Table 2, all simple models (block 1) were significant, explaining between 1% (activity limitations) and 14% (PSS-4) of the variance in the health indicators. However, including the SGVHR and institutionalized gender variables in the second block increased the variance explanation substantially, ranging from 9.8% (type 2 diabetes) to 27% (PSS-4) and all final models were significant after Bonferroni-correction by a factor of nine.
Hierarchical logistic regressions (N = 2277) on nine health indicators that showed univariate differences between men and women (cf. Table S2).
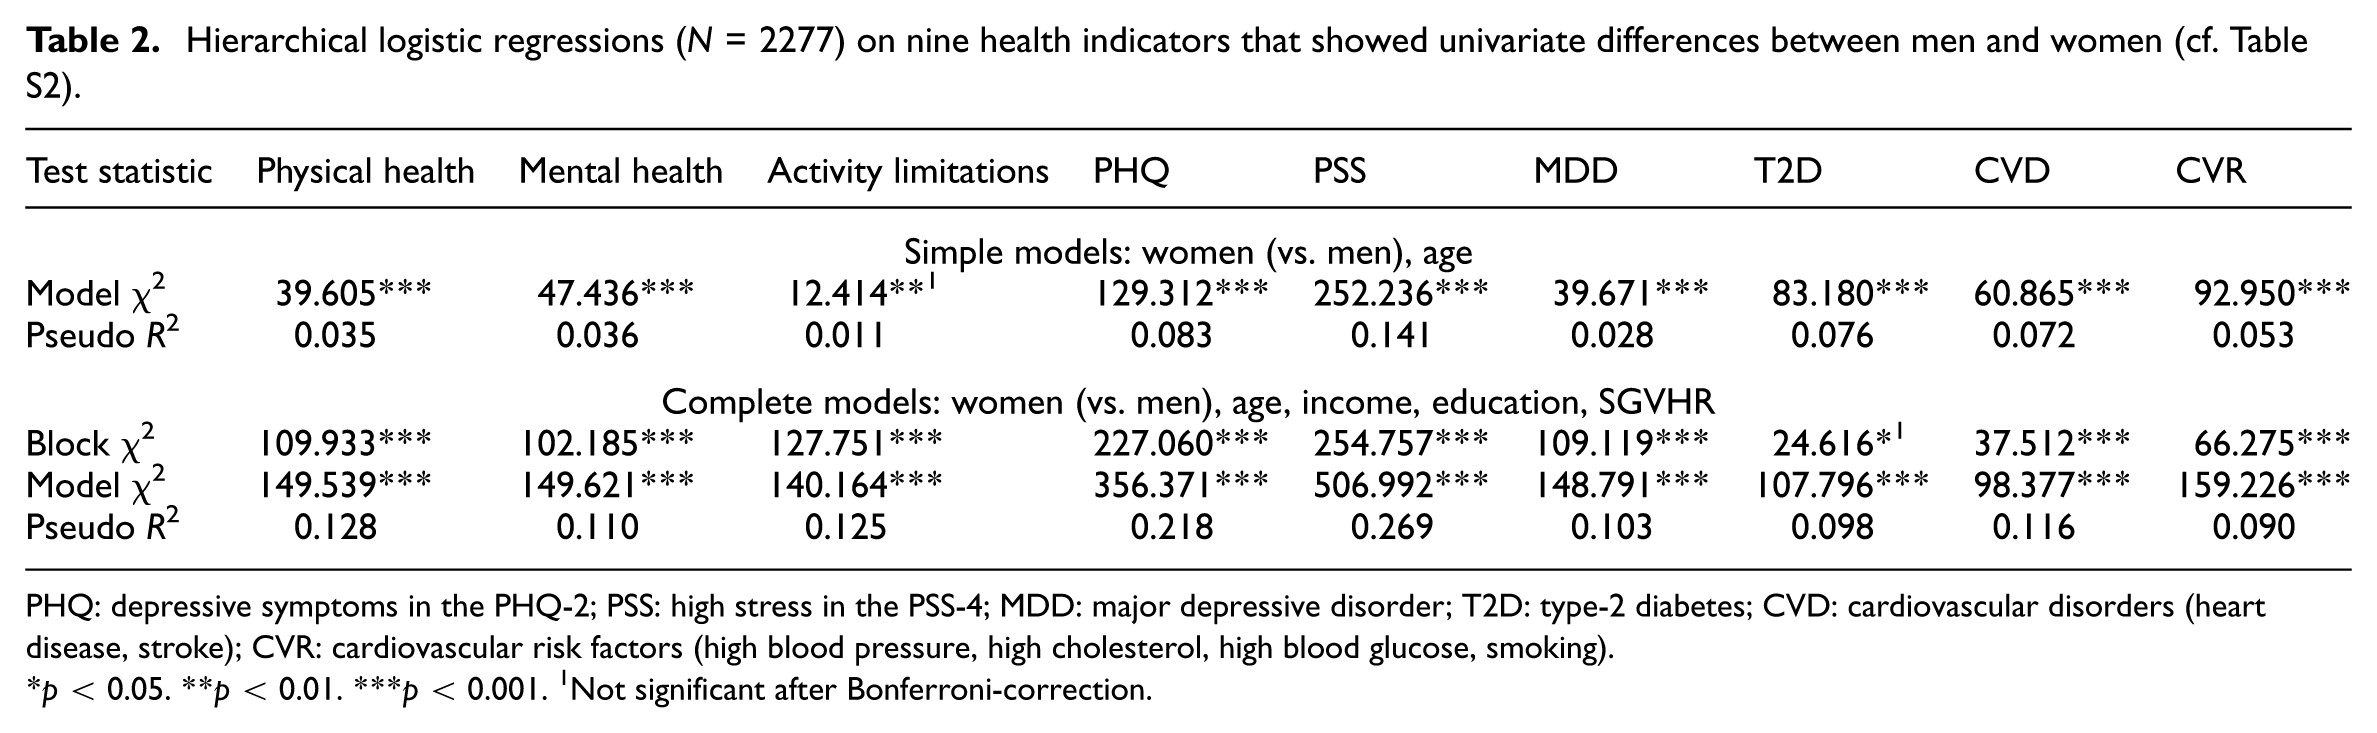
PHQ: depressive symptoms in the PHQ-2; PSS: high stress in the PSS-4; MDD: major depressive disorder; T2D: type-2 diabetes; CVD: cardiovascular disorders (heart disease, stroke); CVR: cardiovascular risk factors (high blood pressure, high cholesterol, high blood glucose, smoking).
p < 0.05. **p < 0.01. ***p < 0.001. 1Not significant after Bonferroni-correction.
The direction and magnitude of the odds-ratios for each predictor and the negative health indicators are illustrated in Figure 1(a). Being a woman was no longer related to any of the health variables that had shown univariate disadvantages in women (physical health, mental health, activity limitations, depressive symptoms, stress, and major depressive disorder). These were better explained by the gender variables in block 2 (SGVHR, education, income). Of the three health variables that had shown univariate disadvantages in men, the odds for cardiovascular diseases and cardiovascular risk factors (but not type-2 diabetes) were still elevated in men in the complete models.
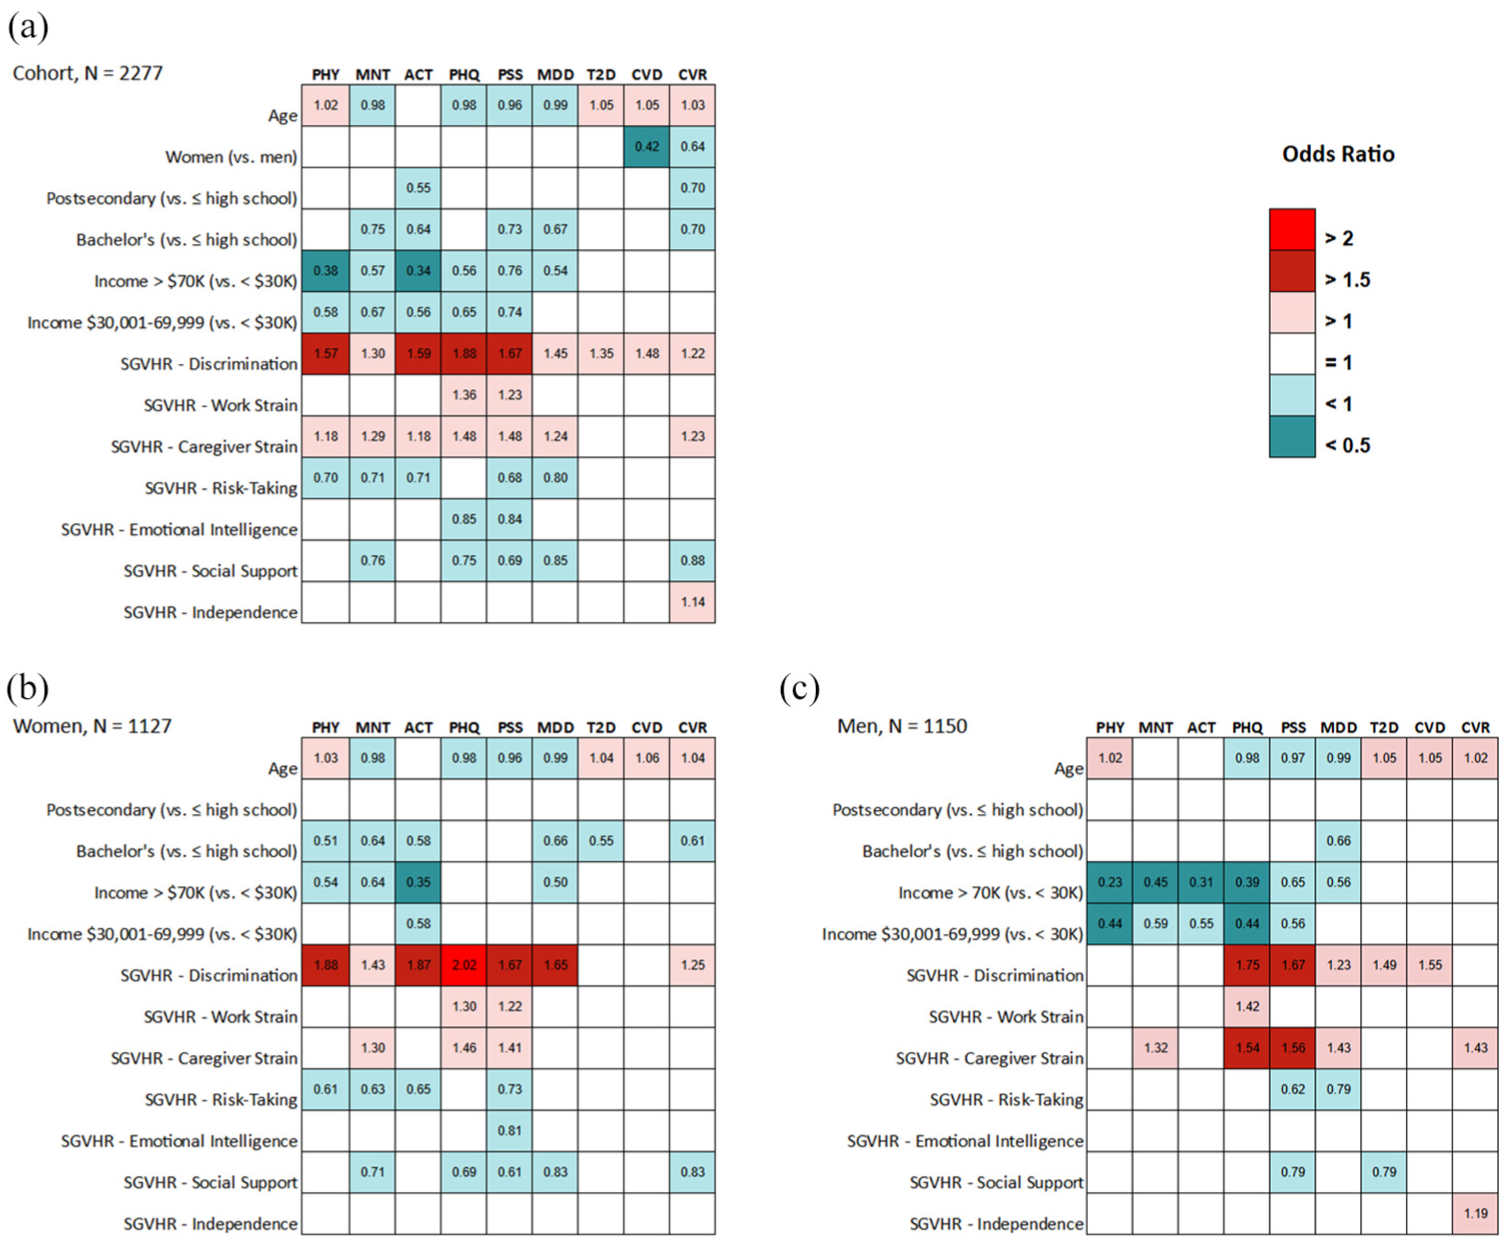
Significant odds-ratios of the complete models from Table 2. (a) All participants (b) Women, (c) Men. See Supplemental Materials for all odds ratios and their 95%-confidence intervals.
Within block 2, higher educational attainment and higher personal income reduced the odds for almost all health variables, with up to 66% reduced odds for activity limitations in participants in the highest (compared to lowest) income bracket.
Among the SGVHR variables, higher scores in perceived Discrimination were the most important and predicted all nine adverse health variables, followed by Caregiver Strain, which was linked to seven variables. The strongest relationships with the SGVHR were seen in some of the mental health variables. For example, perceived Discrimination increased the odds for depressive symptoms in the PHQ-9 by 88%, and high stress in the PSS-4 by 67%. These two mental health indicators interacted also with Caregiver Strain, each associated with 48% increased odds, and were the only two outcomes interacting with Work Strain (36% increased odds of depressive symptoms, 23% increased odds of high stress, respectively).
Inspecting the outcomes in women (Figure 1(b)) and men (Figure 1(c)) separately, many of the outcomes were similar, but with some variations (see Supplemental Tables for additional details). For example, perceived Discrimination most consistently increased the odds of adverse health, especially stress and depressive symptoms, in both women and men but interacted with self-reported poor health/activity limitations only in women, and with type-2 diabetes/cardiovascular conditions only in men. Particularly for men, Caregiver Strain increased, and higher income decreased the odds for negative health indicators, compared to more widespread positive relationships between health and higher education levels, Social Support, and Risk-Taking in women.
Discussion
In this Canadian cohort, women reported lower health-related quality of life, more stress, depressive symptoms, and higher rates of major depressive disorder than men. Men reported higher rates of cardiovascular risk factors (high blood pressure, high cholesterol, high blood glucose, and smoking), cardiovascular diseases (heart disease, stroke), and type 2 diabetes. Many of these differences were better explained by the assessed gender variables in the SGVHR, along with education and income. Our findings suggest that these gendered variables are critical in understanding health risks, emphasizing the potential benefits of modifying these factors as part of healthcare and prevention.
Education and income interacted with health in the expected ways, with higher levels reducing the odds of negative indicators. Relationships with educational attainment were more pronounced for women; relationships with income were evident in multiple health indicators for women and men, but more pronounced in men. For example, only in men, higher income significantly reduced the odds of stress and depressive symptoms.
Among the SGVHR variables, perceived Discrimination played a particularly important role and was negatively related to all health variables. Gender-based discrimination is a well-described risk factor for mental and physical well-being (Hackett et al., 2019), and similar effects have been documented for racial (Kirkinis et al., 2021), body weight (Gerend et al., 2023), workplace (Xu and Chopik, 2020), or socioeconomic (Angerer et al., 2019) discrimination. The adverse effects of perceived discrimination on health are multifactorial, including systemic biases in health resource allocation and access (Krieger, 2020), trust in healthcare providers (Hong et al., 2018), and disengagement from available healthcare resources (Burgess et al., 2008). Perceived discrimination has been robustly linked to stress (Pascoe and Richman, 2009), and the perpetuated psychological trauma resulting from long-term discrimination (Kirkinis et al., 2021) can lead to chronic overactivation of the hypothalamic-pituitary-adrenal (HPA) axis, the body’s stress response system. This affects multiple downstream metabolic and inflammatory pathways, which can later manifest as physical or mental health problems. Indeed, multiple forms of discrimination have been associated with HPA axis overactivity (Busse et al., 2017), also raising the likelihood of engaging in maladaptive stress coping strategies (Crockett et al., 2018). Thus, in addition to the direct physiological effects of chronic stress caused by discrimination, participation in unhealthy behaviors and non-participation in healthy behaviors are more likely with higher perceived discrimination.
The odds of reporting cardiovascular diseases were reduced by 58% and the odds of cardiovascular risk factors were reduced by 36% in women compared to men, and these simple differences persisted in the complete models (see Figure 1(a)). Nevertheless, Discrimination, Caregiver Strain, and less so, Independence significantly increased the odds, while Social Support and higher education decreased the odds, with some variation between women and men (cf. Figure 1(b)): Discrimination increased the odds of cardiovascular diseases in men and of cardiovascular risk factors in women. Social Support and higher education decreased the odds of cardiovascular risk factors only in women. Conversely, higher Caregiver Strain and Independence increased the odds of cardiovascular risk factors only in men.
Cardiovascular disease has historically been considered a disease of men, and current prevalence rates still show higher rates in men than in women across all ages (Martin et al., 2024). Biological factors play a role in these differences, for example, higher average visceral fat in men than women (Nakamura et al., 1994) and so do differences in lifestyle and stress coping (Chumaeva et al., 2009). However, gender biases in diagnosis, treatment, and prevention of cardiovascular risk factors and diseases are likely also reflected in our results. For example, cardiovascular conditions in women are underdiagnosed, with treatment delays or under-treatment compared to men with similar or more severe symptoms (Todorov et al., 2021). Such biases may also contribute to women underrecognizing their own risk for cardiovascular disease, and missing or misinterpreting their symptoms (Smith et al., 2018). Thus, the robustly higher rates of cardiovascular conditions and risk factors we observed in men here are likely a combination of biological, personal, and societal factors. With increasing recognition of the complex interplay between sex and gender in cardiovascular health (Regitz-Zagrosek and Gebhard, 2023), our study also pointed to important nuances in which of the assessed gender-related variables were important, in the entire cohort as well as particularly in women or in men. Similar to previous findings predominantly from studies of racial discrimination (Panza et al., 2019), higher perceived Discrimination elevated the odds of cardiovascular risk factors (in women) and diseases (in men). Bachelors-level education reduced the odds of cardiovascular risk factors by 30% in the entire cohort, particularly in women. This resembles previous metanalytical findings (Backholer et al., 2017) where lower education increased the risk for coronary heart disease in women and men, but women with the lowest education were at a 24%–31% excess risk compared to men at the same low education levels. Higher Caregiver Strain increased the odds of cardiovascular risk factors, and this was particularly evident in men, adding to the limited cardiovascular health literature on this variable (Lambrias et al., 2023). Generally, caregiver strain has robust relationships to stress and mental health (Kayaalp et al., 2021) as replicated in our findings. We can only speculate about why Caregiver Strain interacted more strongly with men’s health here. Taking on caregiving responsibilities could mark a reversal of traditional male gender roles (Montgomery and Kosloski, 2009) and a loss of previous identities with shifts in power and authority (Kim and Moen, 2002). Caregiver Strain in men, if reported, could then reflect a combination of factors that interact more strongly with health, a hypothesis that should be tested in future studies.
Some unexpected findings were also observed and will be briefly discussed in the following. Higher scores in the Independence subscale increased the odds of cardiovascular risk factors (in men) and higher scores in the Risk-Taking subscale of the SGVHR decreased the odds of several negative health indicators. We suggest that the content and wording of these subscales may have contributed to these outcomes. As described in the Methods section, most of the SGVHR subscales ask participants to estimate the frequency of specific behaviors or experiences. However, Risk-Taking inquires how “prepared” someone feels about engaging in risky activities (“How prepared are you to take risks when making financial decisions?”) and Independence asks about how “important” someone’s personal independence is to them (“How important is it for you to solve your problems on your own?”). Women showed markedly lower Risk-Taking scores than men (Figure S2C), which emphasizes the gender-relevance of this subscale and may reflect higher risk aversion in women than men (Dawson, 2023). However, feeling highly prepared to take on risks in various scenarios, rather than actually engaging in risky activities could also reflect optimism, with positive implications for some health indicators (Rozanski et al., 2019), and perhaps specifically so for women. Furthermore, based on previous findings (Keyes et al., 2008; Mauvais-Jarvis et al., 2020), we expected higher rates of alcohol and substance use in men than women, but because no differences emerged in the univariate outcomes, relationships with the gender variables were not further probed. However, addictions may still show positive relationships with Risk-Taking and should be examined in future studies.
Some limitations of the current study should be mentioned. First, we did not inquire about our participants’ sex at birth but asked them to identify as men, women, or another gender. Although gender identity closely matched sex at birth in similar studies that assessed both (e.g. >98% concordance in Nielsen et al., 2021), this shortcoming should be considered when interpreting the differences between women and men in this study. Furthermore, very few participants identified as gender-fluid/non-binary, precluding a meaningful subgroup analysis of these individuals. Future targeted studies should focus on understanding the health relevance of gendered variables specifically in individuals who do not identify as women or men, as well as in otherwise more diverse populations than a predominantly white cohort of heterosexual individuals. Finally, based on limited distributional ranges in many of the health scales and to compare outcomes with those on presence/absence of health conditions, we dichotomized the scores on the health scales. Even though we followed previous studies in this practice and used available clinical cut-off scores to motivate this choice, scores on these scales may also be analyzed with linear regressions. Such a re-analysis of the PSS-4 (in the entire cohort) can be found in the Supplemental Material, with similar outcomes to the present logistic regression results.
Conclusions
In addition to biological sex, gender is now well recognized as a critical determinant of human health and many health-related differences between women and men may be driven by gender, representing potentially modifiable public health targets. Our findings demonstrate the potential this approach holds, with the most compelling example that the initial disadvantages in mental and physical health we observed in women relative to men were fully explained by gender variables. To assess health-relevant gender variables in a climate of evolving perceptions of gender, novel validated assessment tools like the SGVHR are needed. Our findings suggest that among the assessed gender facets in this tool, perceived Discrimination, Caregiver Strain, followed by Work Strain might be the most promising dimensions associated with health risks. Their assessment should be targeted to develop and optimize interventions promoting optimal health for all individuals.
Supplemental Material
sj-docx-1-hpq-10.1177_13591053251341188 – Supplemental material for Gender predictors of adverse health
Supplemental material, sj-docx-1-hpq-10.1177_13591053251341188 for Gender predictors of adverse health by Yousef Jallad, Ahmed Abdel-sayyed, Tarek Turk, Kim Ngan Hoang, Lujie Xu and Esther Fujiwara in Journal of Health Psychology
Footnotes
Acknowledgements
We would like to acknowledge Sasha Kanevets for her help with data cleaning.
Data sharing statement
Declaration of conflicting interests
The authors declared no potential conflicts of interest with respect to the research, authorship, and/or publication of this article.
Funding
The authors disclosed receipt of the following financial support for the research, authorship, and/or publication of this article: This study was supported by the Canadian Institutes of Health Research. FRN 201803.
Ethics approval
This study received ethics approval from the University of Alberta Research Ethics Board (Pro00086704: “Gender Roles and Health”).
Informed consent
All participants provided informed consent prior to data collection. Participation was voluntary, and participants could withdraw at any time without penalty.
Consent to publication
All participants consented to the publication of de-identified findings from this research.
Supplemental material
Supplemental material for this article is available online.
References
Supplementary Material
Please find the following supplemental material available below.
For Open Access articles published under a Creative Commons License, all supplemental material carries the same license as the article it is associated with.
For non-Open Access articles published, all supplemental material carries a non-exclusive license, and permission requests for re-use of supplemental material or any part of supplemental material shall be sent directly to the copyright owner as specified in the copyright notice associated with the article.