
Abstract
Controversy exists over the use of brief Big Five scales in health studies. We investigated links between an ultra-brief measure, the Big Five Inventory-10, and mortality in the General Social Survey. The Agreeableness scale was associated with elevated mortality risk (hazard ratio = 1.26, p = .017). This effect was attributable to the reversed-scored item “Tends to find fault with others,” so that greater fault-finding predicted lower mortality risk. The Conscientiousness scale approached meta-analytic estimates, which were not precise enough for significance. Those seeking Big Five measurement in health studies should be aware that the Big Five Inventory-10 may yield unusual results.
Increasing interest in the health outcomes of the Big Five personality traits has led many large survey studies to adopt brief versions of Big Five scales. Because questionnaire space is scarce, personality researchers have been forced to abbreviate scales (Rammstedt and Beierlein, 2014). A meta-analysis of epidemiologic studies using brief scales (from 4 to 7 items per Big Five dimension) reproduced the most robust finding in the personality and health literature—the tendency for individual scoring higher on Conscientiousness to live longer (Jokela et al., 2013; cf. Strickhouser et al., 2017).
While the aforementioned finding suggests that health-related personality variance has been retained by most brief Conscientiousness scales, the broader literature has also sometimes shown reduced mortality risk associated with other Big Five trait domains, including lower Neuroticism and higher Extraversion (Chapman et al., 2011). Findings for these traits, using brief scales, have been quite variable (Jokela et al., 2013). This variability, along with smaller Conscientiousness effect sizes than are sometimes observed with longer measures, has led to criticism that brief measures do not fully or reliably capture Big Five content domains associated with health and longevity (Weiss and Costa, 2014).
One peculiar health psychology finding with brief Big Five measures pertains to the behavior of brief Agreeableness scales in epidemiologic studies. Of four US population samples, higher Agreeableness was associated with greater demographic-adjusted mortality risk in two separate studies (the Midlife Development in the United States [MIDUS] and Health and Retirement Study [HRS] cohorts; Jokela et al., 2013). Both used the same brief measure of Agreeableness, a five-item trait adjective scale from the Midlife Development Inventory (MIDI), which appears to sample primarily the tender-mindedness and altruism facets. The third and fourth US studies, the Wisconsin Longitudinal Study (WLS), and WLS Sibling Sample (WLS-S), using a version of the Big Five Inventory (BFI) with roughly six items per scale, showed small, non-significantly elevated mortality risk and significantly decreased mortality risk, respectively (Jokela et al., 2013).
Since then, mortality follow-up of another US cohort has been completed, employing an even briefer version of the Big Five. This scale, the Big Five Inventory (BFI-10; Rammstedt and John, 2007), uses only two items per factor. We examined demographic-adjusted mortality associations using the BFI-10, with a particular interest in (a) how closely estimates mirror those of other brief scales in US cohorts and (b) whether the counterintuitive elevation in mortality risk associated with Agreeableness in some US studies was apparent.
Methods
Participants and procedures
The General Social Survey (GSS) has been conducted roughly every 2 years since the 1970s by the National Opinion Research Corporation (NORC), with the purpose of measuring public opinion and attitudes across a variety of social issues. The GSS utilizes a national probability sample of non-institutionalized US adults and phone-based data collection. In 2006, approximately one-third of the sample (N = 1518) was randomly selected to receive the BFI-10. A total of 1461 participants with complete data on demographic factors and Big Five scales were included in analyses. Age ranged from 18 to 96, with a mean/standard deviation (M (SD)) of 45.8 (16.1) years, and the M (SD) for years of education was 13.1 (3.2). Females comprised 52.8 percent of the sample and individuals of minority race/ethnicity (primarily Black/African American and Hispanic ethnicity) 31.5 percent. Mortality follow-up of the GSS samples has been conducted in two waves over the last 6 years, with the second wave completed in late 2016 and producing data through 2014 for this sample. Follow-up was conducted through the National Death Index (NDI) and is described in detail elsewhere (Muennig et al., 2011). Mortality data were available for all individuals in the present analysis (approximately 170 decedents), who contributed a total of 11,218 person-years of follow-up time. This death rate (roughly 11%) is comparable to, or in some cases exceeds those of other US population studies (MIDUS, HRS, WLS, Wisconsin Longitudinal Study Sibling Sample) in Jokela et al.’s (2013) meta-analysis.
Measures
Demographics
Demographic factors including age, gender, race/ethnicity, and education were assessed via self-report and included as control variables in the present analysis.
Personality
The BFI-10 was developed by selecting two items from each scale of the full-length (44-item) BFI meeting several criteria such as high factor loadings, in samples of US and German college students and US dog owners (Rammstedt and John, 2007). Its reported correlations with full-length scales range from .74 to .89. Cronbach’s alpha has been argued to be misleading for brief scales (Rammstedt & Beierlein, 2014), given its emphasis on length, and is not reported in the development paper, where reliability assessed by 6-week test-retest correlation averaged .75. In the present sample, the correlations between scale item-pairs, which can be seen as split-half reliabilities, were .38 for neuroticism, .31 for extraversion, .21 for openness, .12 for agreeableness, and .27 for conscientiousness.
Statistical analysis
Preliminary, unadjusted models revealed essentially similar findings to demographic-adjusted models, so the latter are presented. BFI scores and education were converted to z-scores to facilitate the interpretation of parameter estimates. Associations between BFI scales and all-cause mortality were examined with Cox proportional hazards models, using attained age as the time scale with delayed entry (i.e. individuals enter the risk set at their baseline age in 2006). In observational cohort studies, this method has the advantage of providing a natural survival time metric coinciding with chronological age, while simultaneously controlling for age (Thiebbaut & Benichou, 2004). Age-adjustment models using follow-up time since baseline produced nearly identical results. Model diagnostics and specification tests were examined for all models (e.g. proportional hazards assessment), with GSS sampling weights used in all analyses. As a point of reference to compare the BFI-10 estimates, we also computed meta-analytic estimates of the hazard ratios (HRs) and their 95 percent confidence intervals (95% CIs) for the brief measures from the four US samples (two from the WLS) reported in Jokela et al. (2013).
Results
Table 1 shows results for demographic-adjusted models featuring each BFI-10 scale separately, and all together. In either case, only Agreeableness was significantly associated with mortality. A 1-SD increase in Agreeableness was associated with a 26 percent increase in mortality risk in the model including all Big Five scales. With the exception of Agreeableness, none of the estimates differed from the meta-analytic short form HRs reported by Jokela et al. (2013), which in the US studies are HR (95% confidence interval (CI)) 1.03 (0.95, 1.10) for Neuroticism, 0.93 (0.85, 1.01) for Extraversion, 1.02 (0.97, 1.07) for Openness, 1.04 (.92, 1.15) for Agreeableness, and 0.89 (0.79, 0.98) for Conscientiousness. 1 The Agreeableness effect in this study not only exceeded this meta-analytic average but rivaled that of the largest single-study effect reported there, that of the MIDI in the MIDUS study (HR = 1.19, 95% CI = 1.04, 1.37), and exceeded the effect of the MIDI in HRS (1.09, 95% CI = 1.01, 1.17). In this study, the racial/ethnic disparity in mortality was evident in a 50 percent risk increase for minorities (i.e. HR = 1.50), while the gender gap in mortality risk corresponded to a 43 percent (1/.7 = 1.43) increase in mortality risk for men. Thus, the 26 percent increase in risk associated with a 1-SD increase in Agreeableness is roughly half of the racial/ethnic disparity and about 60 percent as large as the gender gap in mortality.
Demographic-adjusted associations between brief Big Five scales and health outcomes.
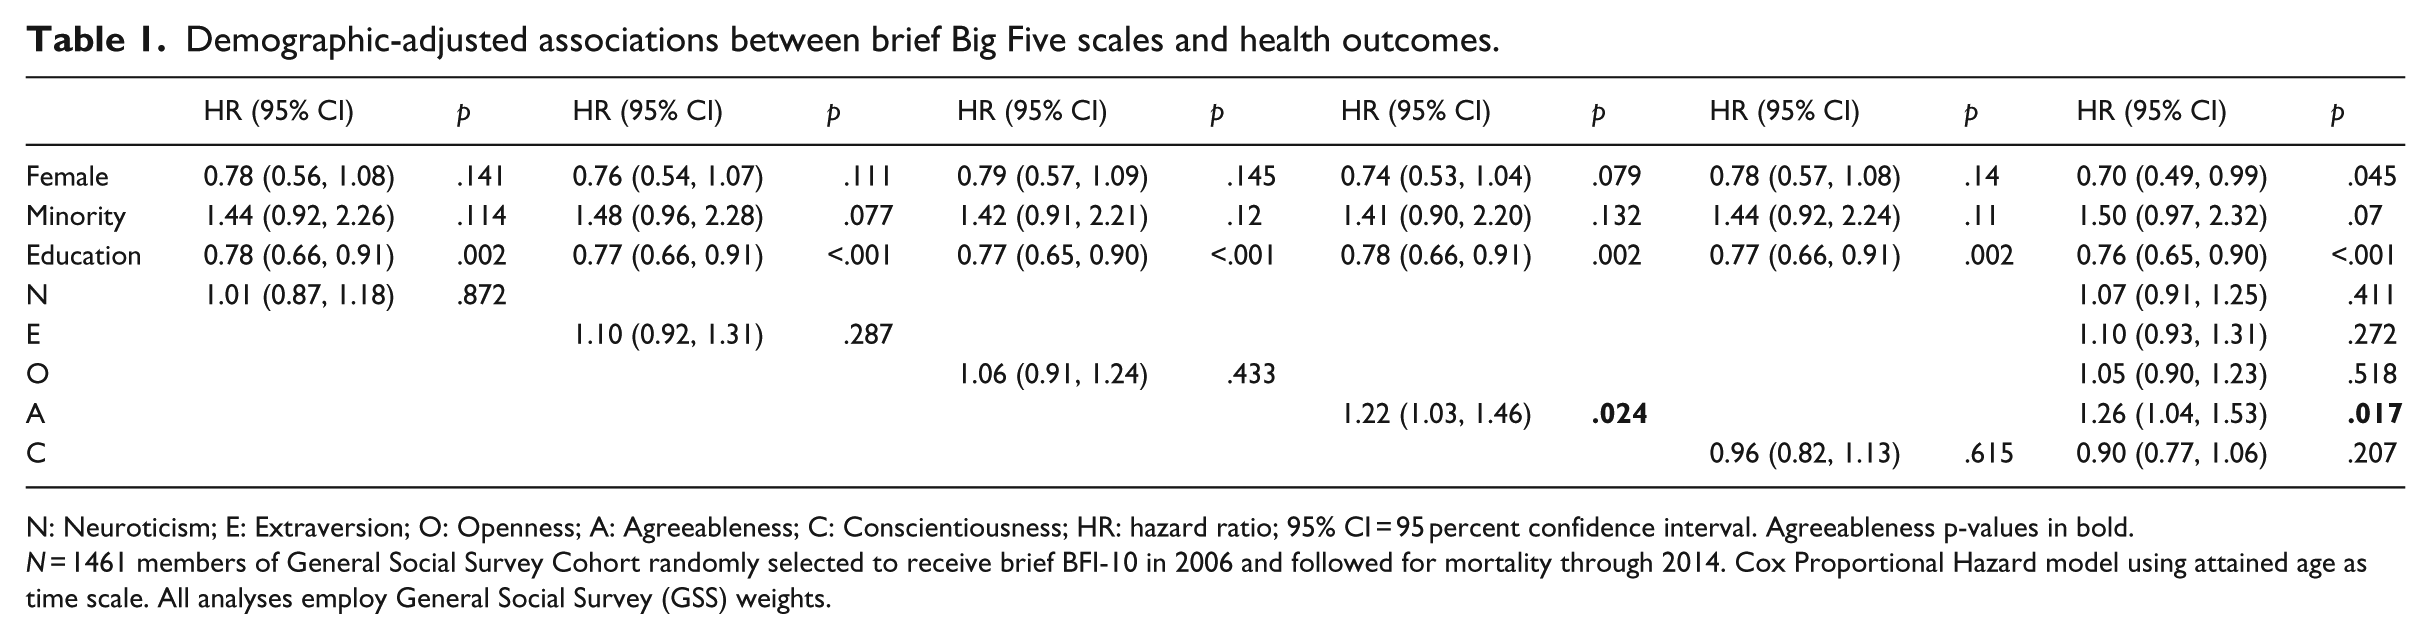
N: Neuroticism; E: Extraversion; O: Openness; A: Agreeableness; C: Conscientiousness; HR: hazard ratio; 95% CI = 95 percent confidence interval. Agreeableness p-values in bold.
N = 1461 members of General Social Survey Cohort randomly selected to receive brief BFI-10 in 2006 and followed for mortality through 2014. Cox Proportional Hazard model using attained age as time scale. All analyses employ General Social Survey (GSS) weights.
Adjustment for different combinations of BFI-10 scales did not eliminate this association, and no interactions were observed across gender, age, education, or race/ethnicity. However, the scale effect appeared to be entirely due to one of the two items: “I see myself as someone who finds fault with others” (reversed scored; p = .007, HR (95% CI) for 1 SD = 1.28 (1.07, 1.54)). 2
Discussion
We examined the associations of an ultra-brief Big Five measure, the BFI-10, with all-cause mortality in a representative US population sample. Results for the Neuroticism, Extraversion, and Openness scales were generally consistent with the effect sizes for these traits from other brief scales (4–7 items per Big Five factor) in the United States (Jokela et al., 2013). Those brief scales on average show protective effects for Conscientiousness, with meta-analytic HRs in the high 0.8’s (Jokela). In this study, the Conscientiousness effect (HR = 0.9) was essentially comparable to other brief scales in US studies with similar mortality rates (HR = 0.89), though non-significant. A similar point estimate with greater standard error under similar conditions might represent greater measurement error for the BFI-10 Conscientiousness scale. One central conclusion of this study is, then, that the BFI-10 may capture relevant variance of Conscientiousness, the most health-relevant Big Five domain, but at the cost of reduced measurement precision.
The second central finding concerns the BFI-10 Agreeableness scale, higher scores on which were associated with greater mortality risk. This finding is not commonly reported in the literature on personality and mortality using full-length Agreeableness scales, and may be an artifact of over-abbreviation of the Agreeableness scale on the BFI-10. Agreeableness is generally considered an adaptive trait, and the harmonious interpersonal relationships sought by agreeable individuals would, intuitively, be expected to confer the health benefits of positive social relations and social support. The elevated mortality risk ratio here (HR = 1.26 for a 1-SD increase) rivals or exceeds “longer” abbreviated scales (i.e. the five-item MIDI Agreeableness scale). Furthermore, the BFI-10 Agreeableness items were not strong correlated, with only one driving increased mortality risk. That item (reversed scored to assess Agreeableness) asked participants to report the degree to which they “find fault with others.” Thus, those reporting that they often criticized others lived longer.
One possibility is that this item taps aspects of other traits such as confidence or perceptiveness that might provide health benefits. In longer Agreeableness scales, its effects would be overpowered by other items. The BFI-29, which has a six-item Agreeableness scale subsuming these two BFI-10 items, showed null or protective effects in two other US studies (Jokela et al., 2013). The MIDI scale trends in this direction as noted above. Such results point toward a poorly understood phenomenon in personality and health, characterized by indicators thought to represent positive characteristics but which confer long-term mortality risks for unknown reasons.
In their totality, these findings suggest a note of caution for researchers seeking a brief Big Five measure for epidemiologic studies. The BFI-10 may capture as much as two-thirds, or as little as half the variance of the full Big Five domains, if its full version is taken as a gold standard. While its Conscientiousness scale appears to approximate a well-known association in the personality and health literature, its Agreeableness scale produces a rather quixotic one, bearing out warnings about over-abbreviation of personality measures in health research (Weiss and Costa, 2014). Similar admonitions have been issued over the BFI-10 in the World Values Survey (Ludeke and Larsen, 2017).
Strengths of our study included a nationally representative sample, higher mortality incidence than prior US studies of this sort, estimation strategy mirroring prior comparator studies, and isolation of individual item effects. Comparisons to international samples are unknown, however. As well, while all-cause mortality is the final common endpoint of many health problems, the BFI-10 may or may not be sensitive to other specific health outcomes.
In conclusion, as large cohort studies grow more prevalent and seek to assess the Big Five as part of their standard battery, researchers—many of whom may not be psychologists or psychometricians—should be aware that the BFI-10 may be sub-optimal for their purposes. It is difficult, if not impossible, to get “something for nothing” in psychometrics. Thus, if survey space is limited to 10 items for personality, perhaps two 5-item scales or a single 10-item scale is a better choice, if the measurement targets are complex, multi-dimensional constructs like the Big Five. The totality of human personality is arguably as complex as the totality of health, and similarly comprehensive assessment is needed. Alternatively, the pretense of measuring the Big Five—which is a comprehensive taxonomy of traits—should be abandoned, replaced by the understanding that some (often ambiguous) fragment(s) of these domains have been glimpsed, at best through a glass darkly. The interpretation of results should proceed based on the facets, or specific traits, that a brief scale reflects—not the entire Big Five name for which it is named—unless compelling evidence is present that the scale effectively samples the content of the entire broad domain. Otherwise, the field faces a pandemonium of different scales with differing facet coverage producing different findings, but all bearing the same name—the “jingle-jangle” fallacy that the Big Five was originally devised to remediate. Possibly, some novel statistical approaches might be devised to better extract health-relevant information from the item set, or simulation-based sensitivity analyses deployed to quantify the results of omitting relevant trait information.
Footnotes
Declaration of Conflicting Interests
The author(s) declared no potential conflicts of interest with respect to the research, authorship, and/or publication of this article.
Funding
The author(s) disclosed receipt of the following financial support for the research, authorship, and/or publication of this article: This research was supported by a grant from the National Institute on Aging (R01AG044588) awarded to B.P.C.