
Abstract
Background:
Renal artery stenosis (RAS) reflects more widespread atherosclerosis deposition and is associated with high morbidity and mortality. According to the guidelines, a discrepancy in the size of the kidneys of over 15 mm found in an ultrasound should initiate the RAS diagnostic algorithm. This study aims to find the optimal threshold for renal asymmetry that better reflects the frequency of a significantly abnormal renal-aortic ratio (RAR), justifying further RAS diagnostic workup, than the currently used cut-off of 15 mm difference in renal diameters.
Methods:
The analysis included 1175 patients (mean age: 52 years, IQR: 38–66, men/women: 597/578) who underwent Doppler ultrasonography screening of renal arteries with recorded kidney size and RAR calculation. Ultrasound features of RAS were defined as a RAR greater than 3.5 or signs of renal artery occlusion. Receiver operating characteristic (ROC) curves were created and analyzed for absolute differences in kidney size and abnormal RAR. We calculated the area under the curve (AUC) and optimal cut-off values for sensitivity and specificity analysis.
Results:
The final analysis included 169 patients with a significant difference in renal dimension. RAS features were met in 61 patients. According to ROC curve analysis, the optimal index of renal asymmetry was 12 mm. The sensitivity and specificity for this method were 82.0% and 83.3%, respectively, and AUC was 86.3%.
Conclusion:
Changing the definition of a significant difference in kidney size from 15 mm to 12 mm increases sensitivity and specificity for abnormal RAR and this finding may accelerate the diagnosis of RAS.
Background
Renal artery stenosis (RAS) is a relatively common disease and has a wide range of presentations and comorbid risk burden in patients. However, the decision to investigate for RAS requires an individualized approach, which is essential for mortality and morbidity benefit in this high-risk population. The presence of a high-grade lesion in the renal artery (RAS above 75%) places a patient in an especially high-risk group. What is particularly important is that ischemic kidney damage secondary to RAS is time-dependent. 1 It is associated with progressing fibrosis, nephron loss, and deteriorating kidney function. 2 Early recognition of significant RAS may improve outcomes and preserve renal function in patients. Therefore, it is clinically significant to identify patients with RAS early. However, these patients present in a variety of clinical scenarios. In practice, many are identified by incidental findings during imaging studies. Renal ultrasonography is the most frequently ordered screening imaging test in patients with hypertension or kidney disease. However, it is often an anatomic test with a simple renal size assessment. In many centers, the initial contribution of the renal ultrasound to RAS diagnosis is kidney asymmetry. Currently, most guidelines state a difference greater than 15 mm as significant for RAS (Table 1).3–6 However, there is a paucity of data supporting this threshold.
Kidney asymmetry in different guidelines.
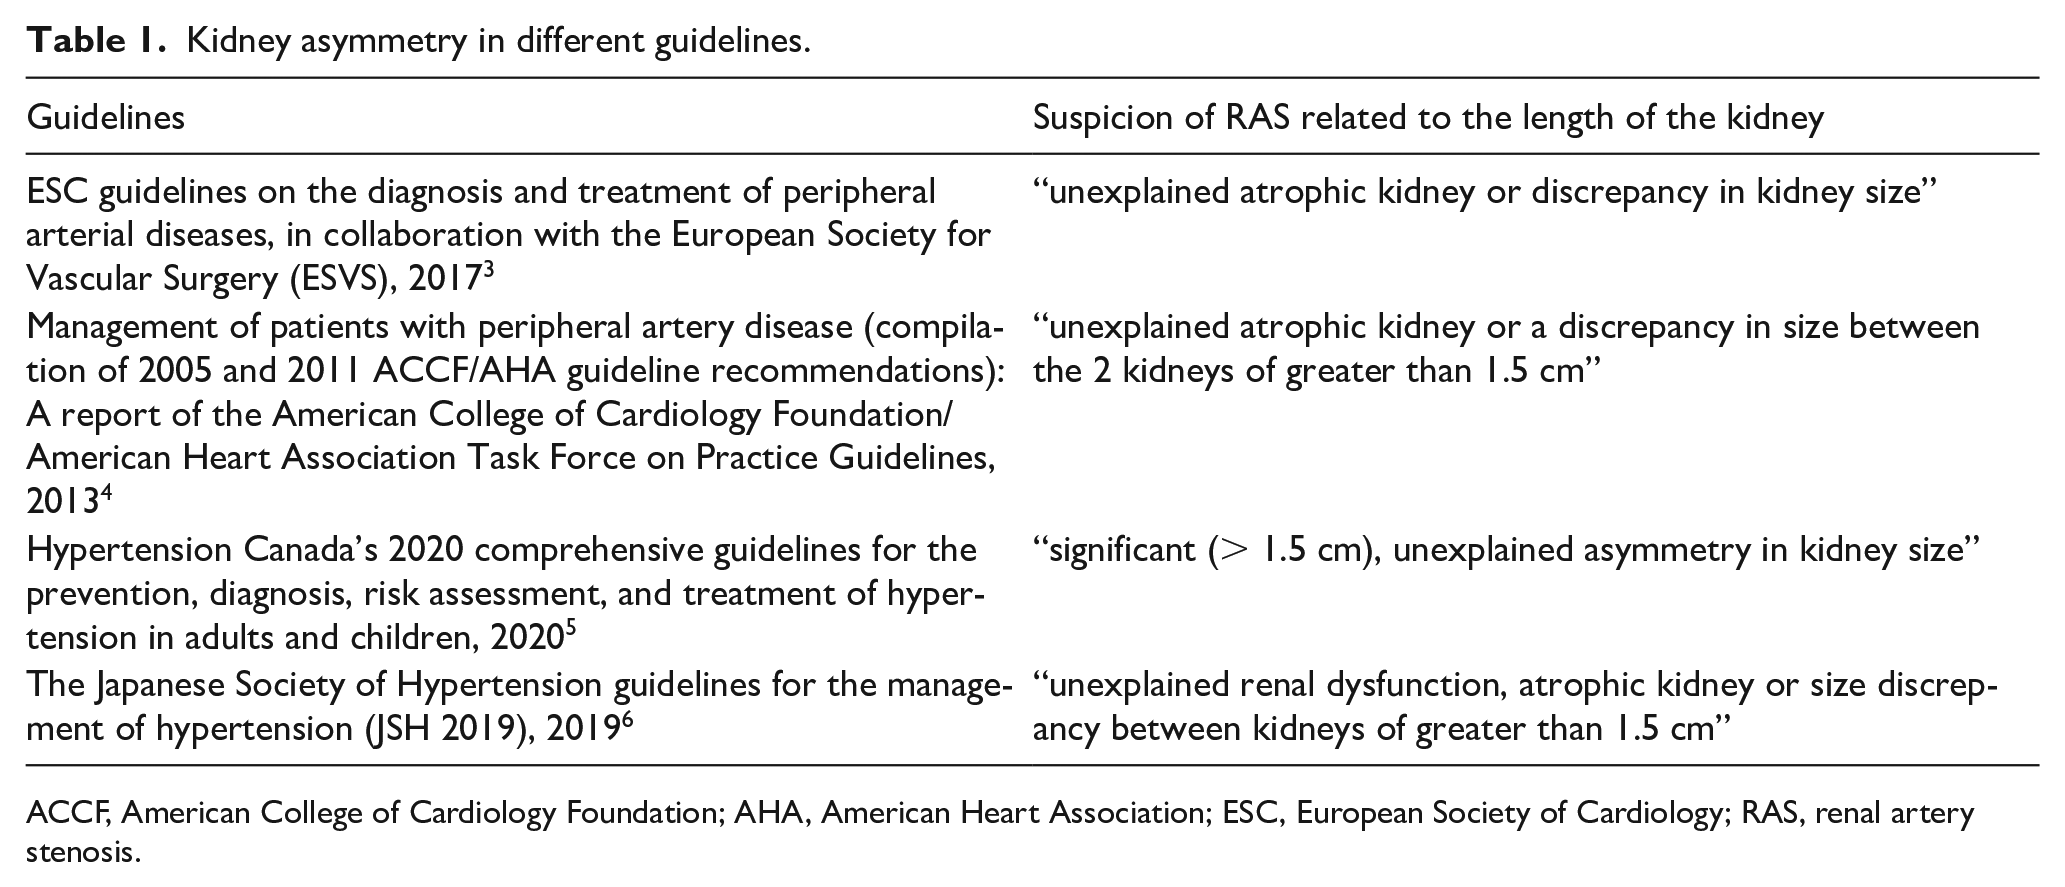
ACCF, American College of Cardiology Foundation; AHA, American Heart Association; ESC, European Society of Cardiology; RAS, renal artery stenosis.
The study aimed to find the optimal threshold for renal asymmetry that better reflects the frequency of a significantly abnormal renal-aortic ratio (RAR), justifying further RAS diagnostic workup, than the currently used cut-off of 15 mm difference in renal diameters.
Methods
All consecutive patients (n= 2177) who underwent Doppler ultrasonography (DU), from January 3, 2005 to December 22, 2008, in a tertiary care, university hospital, were initially screened for the study. After comprehensive retrospective DU data analysis, the final study included all patients with two kidneys appropriately visualized by ultrasound. We excluded the studies in patients with kidney agenesis, patients after nephrectomy, studies without recorded kidney length, and studies performed after percutaneous transluminal renal angioplasty or studies in patients with nonatherosclerotic arterial disease (Figure 1). The RAR values were not used for aortic velocities below 40 cm/second or above 100 cm/second.
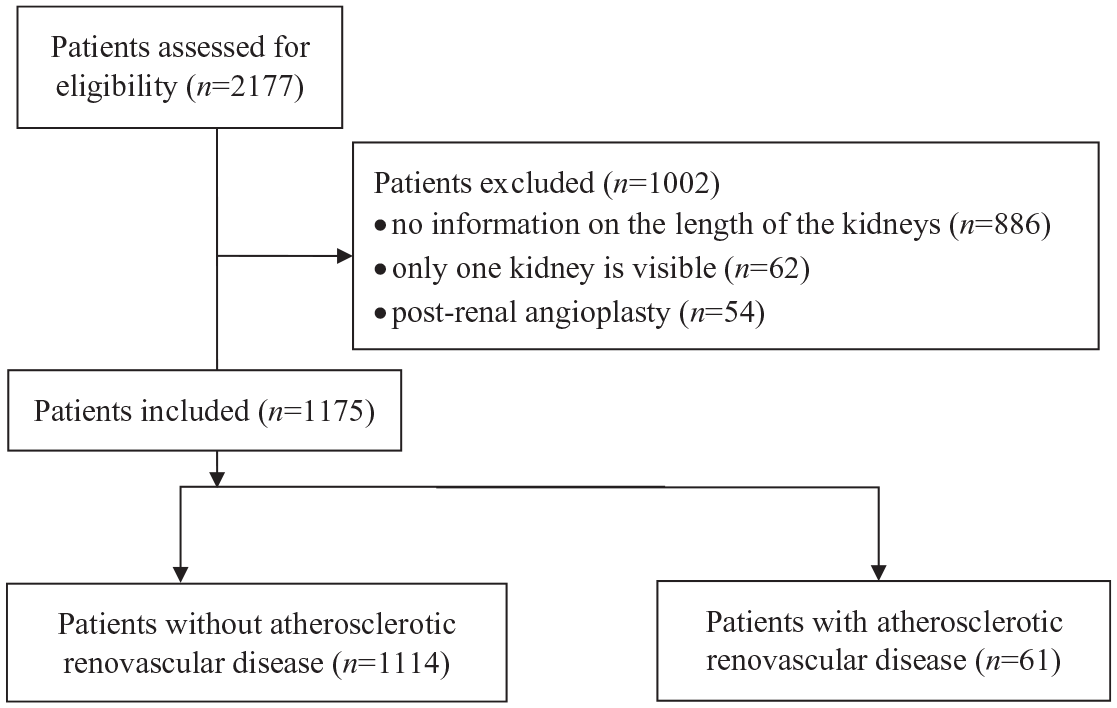
Patient selection for the study.
As an initial threshold, we used a difference of more than 15 mm between the kidneys. All eligible patients had results of RAR measured during the DU examination. Patients identified as cohorts with suspected RAS included those with a RAR greater than 3.5 or signs of renal artery obstruction on DU.
DU examination was performed and interpreted by radiology specialists. HDI-3000 (ATL Ultrasound, Bothell, WA, USA) was used, with low-frequency 2- to 4-MHz curved linear phase array transducers. Every effort was made to use a Doppler angle of lower than or equal to 60° to provide consistency in Doppler velocity measurements. Doppler sampling and velocity waveforms were obtained from the proximal, middle, and distal renal arteries. The RAR was calculated by dividing the highest peak systolic velocity (PSV) in the renal artery by the PSV in the aorta. Renal artery occlusion was diagnosed when there was no flow signal in the renal artery. From the lateral approach, the length of each kidney was measured with B-mode imaging. The absolute difference was the difference in the length of the longer kidney to the shorter kidney, given in mm. The relative difference in kidney size (relative difference in kidney length, RDKL) was calculated as the ratio of the length of the longer kidney to the shorter kidney. The Bioethics Committee at the Medical University of Warsaw approved the study (statement no. KBO/40/11).
Statistical analysis
All results were evaluated for normality of distributions with the Kolmogorov–Smirnov test. The mean age, kidney length, and parameters from the Doppler study were compared by the Mann–Whitney test due to abnormal distribution. Because of abnormal distribution, IQR, as a measure of dispersion of data, was used instead of SD. Quantitative variables were analyzed using the chi-squared test for all groups. Receiver operating characteristic (ROC) curves were used to compare kidney length with the RAR index to assess the optimal relationship between the parameters. All statistical processing was performed with the R package (R-core Team, R Foundation for Statistical Computing, Vienna, Austria), and ROC curves were calculated with the package pROC, using DeLong’s methods.
Results
Final analysis involved 1175 patients meeting the inclusion criteria (mean age: 52 years; IQR: 38–66; men/women: 597/578). A significant renal asymmetry greater than 15 mm was identified in 169 patients (men/women: 77/92). An abnormal RAR (> 3.5) was found in 61 patients (men/women: 23/38). Both significant kidney asymmetry and a RAR > 3.5 were observed in 44 patients. The patients’ characteristics are presented in Table 2. These results allowed the calculation of the parameters for the presence of an abnormal RAR for renal asymmetry greater than 15 mm, as: sensitivity of 72.1% (men/women: 78.3%/64.8%) and specificity of 88.8% (men/women: 89.7%/87.8%).
Characteristics of the studied group.
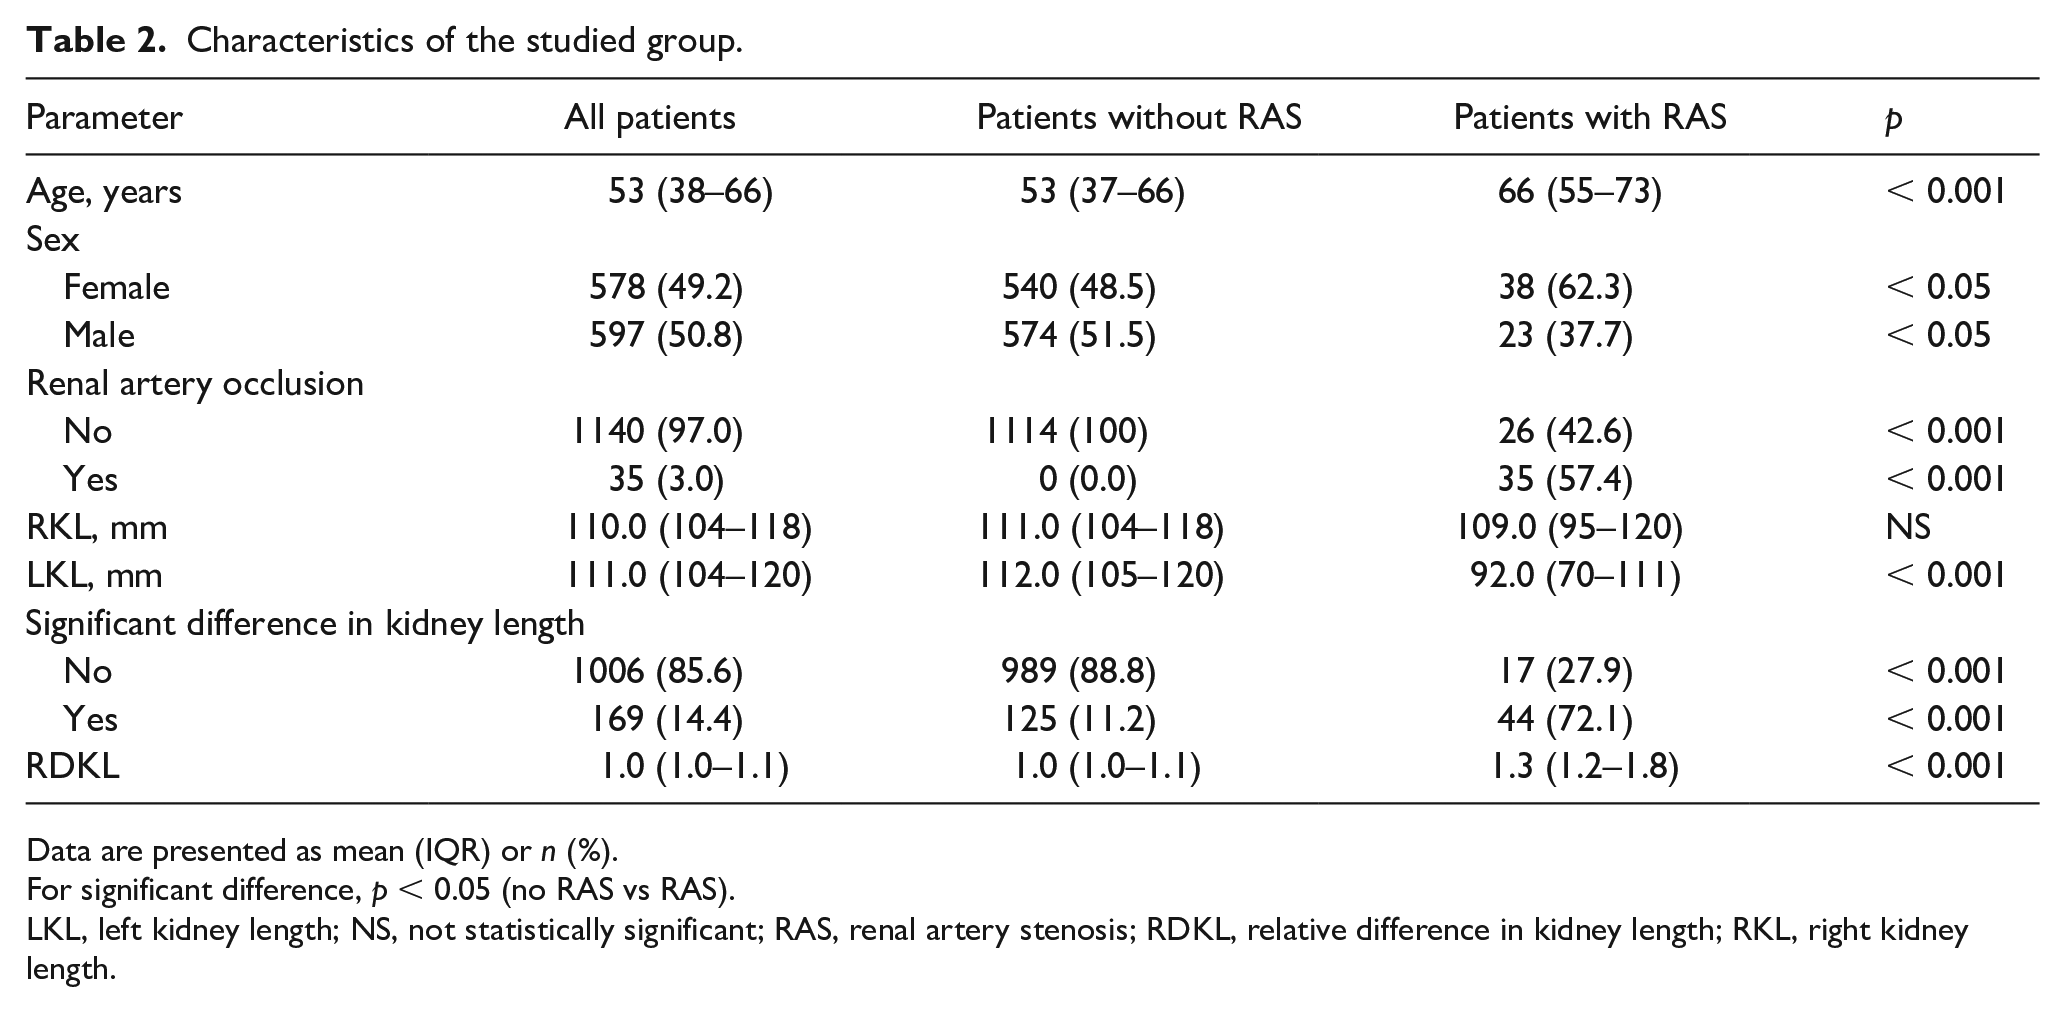
For significant difference, p < 0.05 (no RAS vs RAS).
LKL, left kidney length; NS, not statistically significant; RAS, renal artery stenosis; RDKL, relative difference in kidney length; RKL, right kidney length.
According to the ROC curve analysis, the optimal index of renal asymmetry was 11.5 mm and the AUC was 86.3% (Figure 2). Sensitivity and specificity for the cut-off set equal to or greater than 12 mm were 82.0% (men/women: 82.6%/81.6%) and 83.3% (men/women: 83.5%/83.2%), respectively.
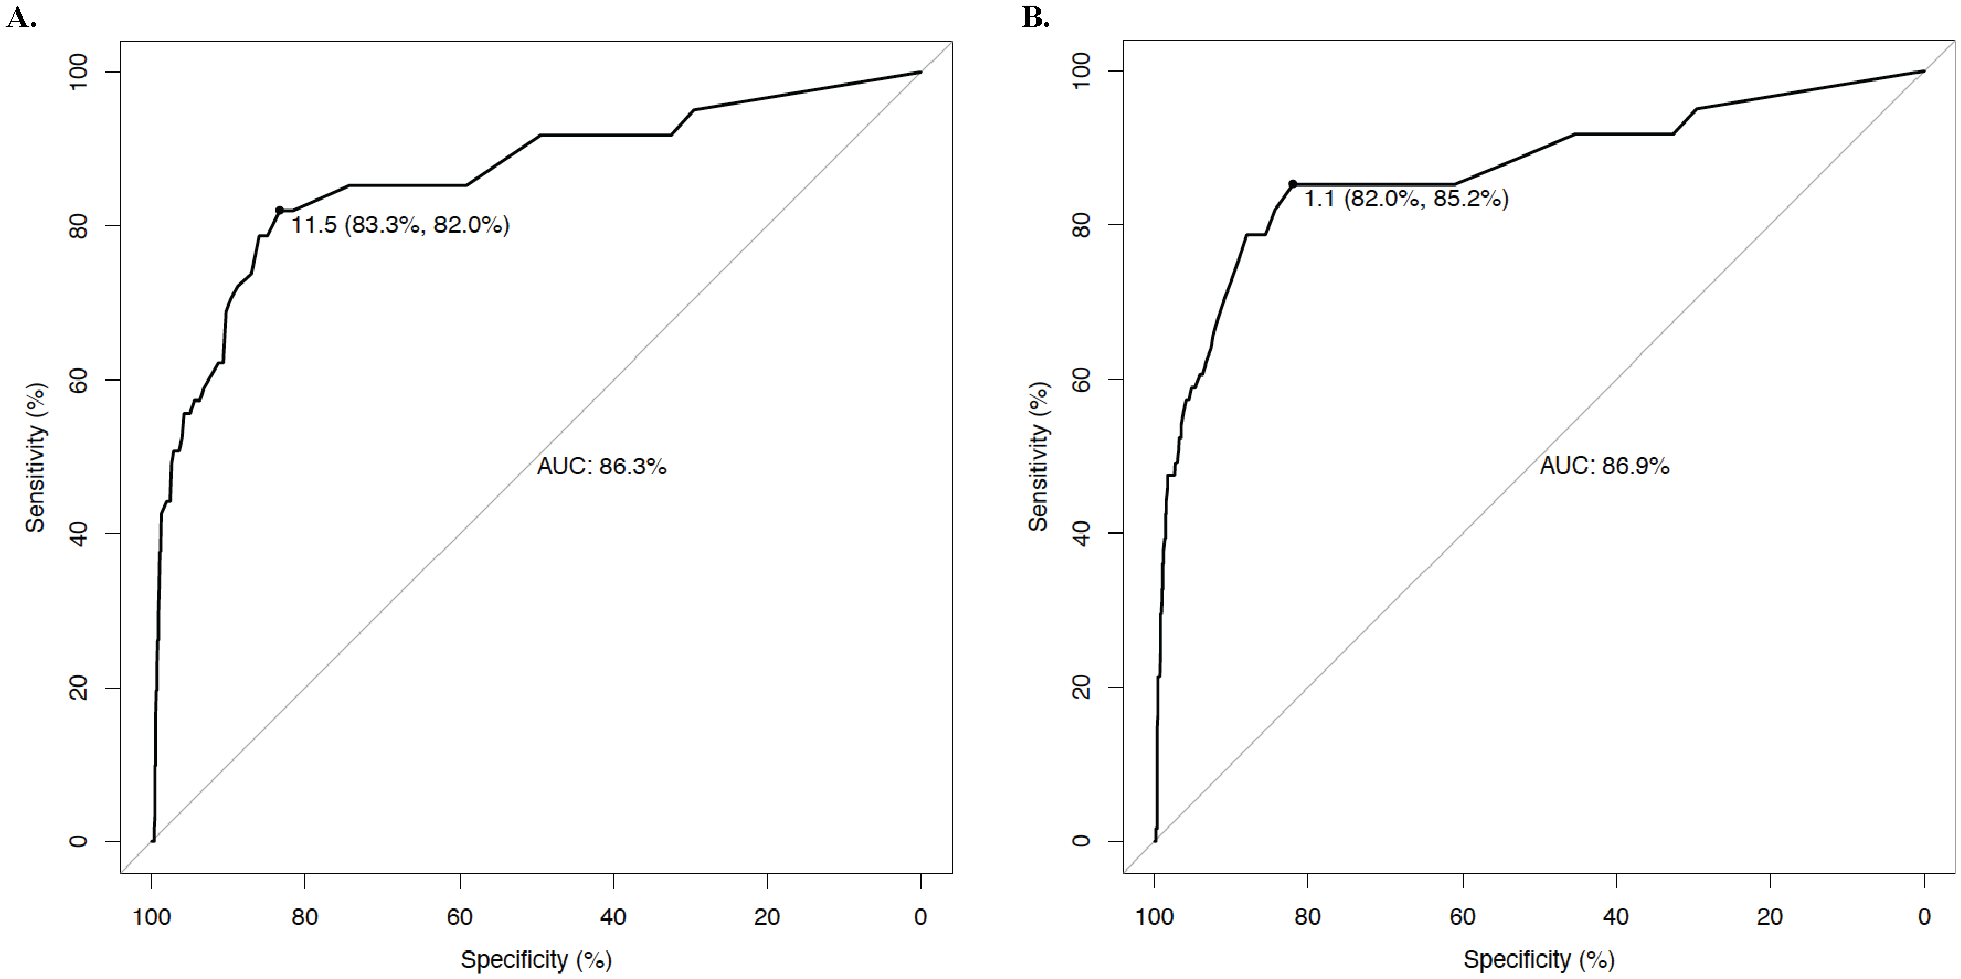
Receiver operating characteristic curve for difference in the kidney length
Analysis of the ROC curve for a relative difference in renal size, showed the optimal index of renal asymmetry as 1.1, which was characterized by better performance at a higher AUC of 86.9% (p < 0.01), when compared to the absolute difference (Figure 2).
This ratio of renal length showed a higher sensitivity of 85.2% (men/women: 84.2%/87.0%) with a lower specificity of 82.0% (men/women: 81.1%/82.8%) in RAS diagnosis.
Discussion
Patients with RAS are characterized by high cardiovascular morbidity and mortality.7 –13 RAS is the leading cause of secondary hypertension and may result in resistant hypertension, unexplained, progressive renal failure, recurrent congestive heart failure, and flash pulmonary edema.14,15 The presence of even hemodynamically nonsignificant RAS is an indicator of systemic atherosclerotic changes in vital organs and an important cardiovascular risk factor, especially for stroke. 12
The prevalence of RAS ranges between 10% and 40% in patients with severe or refractory hypertension.16,17 RAS is often suspected for the first time when there is kidney asymmetry on imaging studies. The renal size assessment is a routine part of an abdominal ultrasound. 18 Most retrospective and prospective studies confirmed a reduction in the renal length on the side of the narrowed renal artery.19 –22 RAS is associated with a reduction of blood flow and perfusion pressure to a kidney, which leads to a plethora of compensatory and adverse mechanisms. 23 These mechanisms have systemic effects, including increasing sympathetic nerve activity, sodium retention, arterial vasoconstriction, and activation of inflammatory pathways.24,25 Renal ischemia is a direct consequence of renal hypoperfusion, which leads to the activation of inflammatory cytokines, disturbed microcirculation, and local reactive oxygen species production.23,26,27 Structural damage to the renal arterioles is often associated with distal cholesterol embolism. 2 However, adverse changes are activated mostly with significant luminal obstruction, in the range above 70% narrowing of the renal artery lumen. Reduction in kidney size of more than 10 mm was observed during at least a 12-month follow-up in most RAS studies. Therefore, kidney asymmetry can be the first sign of RAS in imaging studies. The diminishing size of a kidney with a narrowed renal artery has been observed in prospective studies based on arteriography19,20 and DU.22,28,29 However, the difference in the size between kidneys may be difficult to assess. The other kidney is not always a reliable reference. It also bears the consequences of systemic atherosclerotic disease, hypertension, and chronic kidney disease.30 –34
In practice, a significant size discrepancy between kidneys warrants further evaluation for RAS, and the first-line test for RAS screening is DU, which allows a RAR calculation. RAR is a proportion of the PSV in the renal artery to the abdominal aorta. For screening, DU is a safe, inexpensive, and widely available imaging technique, characterized by relatively high sensitivity (85–94%) and specificity (81–92%) for RAS diagnosis.35 –38 Among patients with a RAR below 3.5, significant RAS is highly unlikely. A RAR above 3.5 strongly correlates with above 60% RAS on invasive angiography. 36 However, a RAR above 3.5 requires further confirmatory imaging tests, usually computed tomography angiography (CTA) or magnetic resonance angiography (MRA).
Most guidelines specify renal asymmetry larger than 15 mm as significant.4 –6 However, the European Society of Cardiology (ESC) ‘guidelines on the diagnosis and treatment of peripheral arterial diseases’ do not indicate a threshold for renal asymmetry. 3 Nevertheless, the assumed threshold is mostly based on experts’ opinions.
However, it is important to remember other factors that affect kidney size, including age, sex, body mass index,34,39 –41 and coexisting diseases. They include diabetes, 42 polycystic kidney disease, 43 glomerulonephritis, and interstitial and lupus nephritis. 44 Assessment of the effect of RAS on kidney size should include other causes of unilateral kidney atrophy or kidney asymmetry. Therefore, obstructive and postinfectious uropathy, renal infarction, radiation nephropathy, and congenital hypoplasia should be excluded.45 –48 These concomitant diseases can influence renal asymmetry interpretation in patients.
The physiological asymmetry of the kidneys, with the left kidney being usually longer in most healthy people, is another significant factor when assessing kidneys. However, the average difference shown in studies varies and depends on the population. In some cases, the difference is not significant, whereas in others it can reach nearly 10 mm.41,49 –52 In our study, there was no significant difference in kidney length in the group of patients without RAS.
It is necessary to encourage further randomized clinical studies (RCTs) assessing the influence of renal asymmetry on the frequency of the diagnosis of RAS, based on the noninvasive reference imaging methods, including CTA and MRA. These methods reliably detect accessory renal arteries that are especially important when planning revascularization. However, specific indications and contraindications for CTA and MRA must be assessed before exposing patients to the studies. New imaging techniques, such as blood oxygen level-dependent (BOLD) MR imaging, may provide further noninvasive insights into RAS.
Study limitations
The main limitation of the study is the utilization of DU as a screening method for RAS. The anatomy of the renal arteries has not been verified by the reference method, which is invasive arteriography or CTA or MRA, depending on local protocols and expertise. The authors only emphasize that finding renal asymmetry, even 12 mm, should be an indication for further evaluation for RAS, including the reference radiologic methods. The authors collected data from retrospective Doppler ultrasonography results, and therefore relied on the descriptions of radiologists performing routine clinical studies in a busy tertiary center. In the ultrasound results available for researchers, from velocity parameters, only the RAR criterion was included, without the values of the PSV and end-diastolic volume (EDV) parameters. Also, the final renal length was provided in the clinical report, as measured by a radiologist performing the study. None of the patients had multiple renal arteries on the ultrasound data. However, renal ultrasound is of greatest utility in kidneys with a single renal artery and it does not identify polar renal arteries and associated polar renal artery disease. Another limitation is the lack of access to detailed clinical data of patients that may influence the interpretation of renal asymmetry. Indications for referral for renal ultrasonography were not included in the final ultrasound result, only from the authors’ own clinical experience assessment, with the most common indications being uncontrolled and resistant arterial hypertension, including suspected secondary hypertension, and screening and follow-up of kidney disease of unknown etiology, including suspected RAS. For chronic disease studies and long-lasting risk factors, the onset of the disease is difficult to determine, and inclusion of early-onset RAS may cause the measurement difference to be lower. Another limitation of the study was its cross-sectional design, at a single point in time, and no follow-up.
Conclusion
Based on our study, we suggest that changing the definition of a significant kidney asymmetry may improve the accuracy of the RAS assessment. We believe it is crucial to increase the sensitivity of the ultrasound studies with the newly proposed criteria. A more accurate diagnosis can initiate treatment earlier and potentially lower late complications of RAS. Additionally, significant renal atrophy secondary to RAS with 15 mm of asymmetry leads to underdiagnosis of early stages of renal ischemia. A lower threshold may improve understanding of the time course of ischemia and renal parenchyma injury in RAS. It may also lead to further studies preventing renal atrophy.
Footnotes
Declaration of conflicting interests
The authors declared no potential conflicts of interest with respect to the research, authorship, and/or publication of this article.
Funding
The authors received no financial support for the research, authorship, and/or publication of this article.