
Abstract
Endothelium-derived nitric oxide (NO) is a mediator of angiogenesis. However, NO-mediated regulation of vasculogenesis remains largely unknown. In the present study, we show that the inhibition of NO significantly attenuated endothelial migration, ring formation, and tube formation. The contribution of nitric oxide synthase (NOS) enzymes during early vasculogenesis was assessed by evaluating endothelial NOS (eNOS) and inducible NOS (iNOS) mRNA expression during HH10–HH13 stages of chick embryo development. iNOS but not eNOS was expressed at HH12 and HH13 stages. We hypothesized that vasculogenic events are controlled by NOS-independent reduction of nitrite to NO under hypoxia during the very early phases of development. Semi-quantitative polymerase chain reaction analysis of hypoxia-inducible factor-1α (HIF-1α) showed higher expression at HH10 stage, after which a decrease was observed. This observation was in correlation with the nitrite reductase (NR) activity at HH10 stage. We observed a sodium nitrite-induced increase in NO levels at HH10, reaching a gradual decrease at HH13. The possible involvement of a HIF/NF-κB/iNOS signaling pathway in the process of early vasculogenesis is suggested by the inverse relationship observed between nitrite reduction and NOS activation between HH10 and HH13 stages. Further, we detected that NR-mediated NO production was inhibited by several NR inhibitors at the HH10 stage, whereas the inhibitors eventually became less effective at later stages. These findings suggest that the temporal dynamics of the NO source switches from NR to NOS in the extraembryonic area vasculosa, where both nitrite reduction and NOS activity are defined by hypoxia.
Introduction
Nitric oxide (NO)/cyclic guanosine monophosphate (cGMP) signaling plays a significant role in the differentiation of mouse and human stem cells into cells of various lineages. 1 However, the involvement of NO in the very early phases of vascular development, which starts from the differentiation of hematopoietic and endothelial cell lineage that fabricates the first-generation blood vessels, is poorly understood. The work of Nath et al. demonstrated that inducible nitric oxide synthase (iNOS)-dependent NO production occurs during blood island formation and endothelial NOS (eNOS) is expressed around 8.0 days post-coitum. They also observed that eNOS expression increased during maturation of the vasculature, whereas iNOS expression was not seen during later stages of development, suggesting a temporal regulation of NOS in developmental niche. 2 A study by Gentile et al. reported that vascular endothelial growth factor (VEGF)-mediated eNOS phosphorylation is important for angioblast migration and proliferation, which underlies the formation of blood vessels and vascular networks. 3 Another proposition was that the transcriptional activity of the eNOS gene in the murine embryogenesis occurs on the onset of blood flow. 4
During the last decade, nitrite (NO2–), an inorganic oxidation product of NO, has received increasing attention for its role as a stable reservoir for NO. In this pathway, nitrite is reduced back to NO, and other bioactive nitrogen oxides, by a variety of enzymes in blood and tissues. Nitrite reduction to NO is greatly potentiated under conditions of hypoxia and low pH. Nitrite signaling has been demonstrated in ischemic reperfusion injury, in the regulation of blood flow, vascular remodeling, and hypertension. 5 Although other inorganic signaling candidates such as H2S, 6 H2O2, 7 and CO 8 have demonstrated remarkable proangiogenic effects, it should be noted that these effects are observed during later stages of vascular development. There is a strong indication that inorganic substrates like nitrite and nitrate play a significant role in life processes, including development of vasculature in the embryo. The present study provides the experimental evidence that inorganic nitrite plays a defining role in the differentiation of common precursor cells followed by vasculogenesis at the very early phases of the development. During this phase, hypoxia takes the center stage of vasculogenesis for the activation of nitrite reductase (NR) followed by induction of NOS expression in a temporal manner. Although NO is a known modulator of vasculogenesis, findings from our study highlight the two different sources of NO for driving vasculogenesis.
Methods
Dulbecco’s modified Eagle’s medium (DMEM) was purchased from PAN-Biotech GmbH (Aidenbach, Germany). Fetal bovine serum (FBS) was from Invitrogen Life technologies, Massachusetts, USA. Trypsin-EDTA solution was obtained from Life Technologies Inc, California, USA. Diaminofluorescein diacetate (DAF-2-DA) and diaminorhodamine (DAR-4M-AM) were obtained from Molecular Probe (Oregon, USA). TRIzol® reagent was purchased from Invitrogen Life Technologies. cDNA M-MuLV reverse transcriptase and Taq polymerase were acquired from Applied Biosystems, Massachusetts, USA. Spermine NONOate (spNO), diethylenetriamine (DETA) NONOate, Proli NONOate, and Sulpho NONOate were purchased from Cayman Chemicals (Ann Arbor, MI, USA). Hypoxia inducible factor (HIF)-1α inhibitor was obtained from Santa Cruz Biotechnology, Texas, USA. Guanosine-3’ 5’ – cyclic monophosphate-8-Bromo sodium salt (8-Br-cGMP) was purchased from EMD Biosciences, Inc. (San Diego, CA, USA). Rotenone, sodium diethyldithiocarbamate (SDDC), allopurinol, JSH-23, sodium nitrite,
Biological sample – chicken embryos
Fertilized white or brown leghorn chicken eggs (Gallus domesticus L.) were acquired commercially from Poultry Research Station, Potheri, Chennai and incubated in a sterile humidified incubator at 37°C. Embryos were staged by counting the number of somites (Hamburger–Hamilton stage). All experimental manipulations in chick embryos were performed between HH stage 3 and HH stage 37. These experiments did not require insitutional review board-equivalent approval, as the embryos were sacrificed before hatching.
Plexus formation assay
Fertilized eggs incubated until HH8 stage under standard conditions were cracked open inside a sterile Petri dish. All treatments (spNO [10 µM], cPTIO [10 µM], JSH-23 [30 µM]) were given at the nearest site of the blood islands using a small disc of Whatman number 1 filter paper. Following treatments, eggs were incubated at 37°C in a humidified incubator. Images were taken using an Olympus camera (Olympus India Pvt Ltd, New Delhi, India) attached with a stereomicroscope at HH10–HH13 stages of development.
Isolation and culturing of chick progenitor cells
Fertilized egg at the specific stage was aseptically broken open into a Petri dish inside a bowl containing sterile phosphate-buffered saline (PBS). The yolk was incised circularly around the area of blood islands using sterile scissors. The extra-embryonic membrane was taken carefully using sterile forceps and placed in a 35 mm tissue culture dish containing sterile PBS. The embryo was removed and the de-embryonated membrane was washed twice gently with sterile PBS to remove any adhering yolk. The membrane was disrupted by mild trypsinization using 0.25% Trypsin/EDTA for 1 minute at 37°C. DMEM containing 10% FBS was added immediately to the dissociated membrane, to inactivate trypsin. The cells were collected and plated onto 24-well plates pre-coated with 0.2% gelatin (Sigma). These cultures were grown in DMEM media (pH 7.5) containing 10% FBS and antibiotics.
Benzidine staining
The extra-embryonic membrane was isolated and washed in freshly prepared PBS. A solution containing 0.2% 3,3′-dimethylbenzidine, 0.2% acetic acid, and 1% hydrogen peroxide was added to the membrane and incubated for 10 min at room temperature. Stained membranes were fixed in methanol. The hemoglobin present in the cells developed a bluish-green color. 9 Images were taken using an Olympus camera attached to the stereomicroscope.
Nitric oxide (NO) detection
DAR-imaging
Extra-embryonic membranes were isolated as described earlier at HH10–HH13 stages and incubated with and without
DAF-fluorimetry
Extra-embryonic membranes isolated between HH10 and HH13 stages were incubated with respective treatments (
NO electrode
The extraembryonic membrane at HH10 stage was excised and the embryo was removed, as described previously, and placed in a glass chamber containing respective treatments (NaNO2 [100 µM], rotenone [5 µM]). The ultrasensitive NO electrode probe, calibrated overnight in 1 × PBS, was placed such that the tip of the probe was 1 mm above the blood islands. NO released by the blood islands was recorded for 15 min.
Ring formation assay
Chick progenitor cells isolated at the HH7 stage were plated onto coverslips pre-coated with 0.2% gelatin and allowed to grow for 6–8 h. During the HH10 stage, cells were incubated with respective treatments (cPTIO [10 µM], JSH-23 [30 µM], 8-Br-cGMP [50 µM], 1H-[1,2,4]oxadiazolo[4,3-a]quinoxalin-1-one [ODQ] [10 µM]), and images were taken at the end of each stage between HH10 and HH13 in 20× magnification using an inverted microscope. The number of ring-like structures was counted in all fields of the coverslip as described. 10 The area of the ring in each stage was calculated using Image J software, National Institute of Health, Maryland, USA.
Tube formation assay
Chick progenitor cells isolated and plated onto coverslips, as described previously, were treated with respective treatments (cPTIO [10 µM]) and images were taken at the end of each stage between HH10 and HH13 in 20× magnification using an inverted microscope. The number of tube-like structures was counted in all fields of the coverslip.
Semi-quantitative reverse transcriptase PCR
Total RNA was isolated from chick extra-embryonic tissues of HH10–HH13 using the TRIzol® method. Total RNA was quantified using NanoDrop, Massachusetts, USA and normalized accordingly. Briefly, 200 ng of RNA was reverse-transcribed and PCR was performed using cDNA. The reaction conditions, product size, and primer sequences have been summarized in Table S1 (see online supplementary material). The products were resolved in 1.5% agarose gel at 100 V using an agarose gel electrophoresis unit.
MTT assay
Chick progenitor cells isolated at the HH7 stage were plated on a 96-well microtiter plate and grown for 6–8 h. Cells were treated with or without rotenone (5 µM), sodium nitrite (100 µM), and a combination of rotenone and sodium nitrite for 24 h. MTT (3-[4,5-dimethyl-2-thiazolyl]-2,5-diphenyl-2H-tetrazolium bromide) at a concentration of 5 mg/mL was added, incubated for 3 h, and the incubation medium was removed by gentle aspiration. Formazan crystals formed upon MTT reduction were dissolved in DMSO and the absorbance was measured with a microplate-reader at 570 nm. Cell viability was expressed as a percentage of MTT, reducing the activity of control samples.
Boyden’s chamber-based migration assay
Chick progenitor cells isolated at the HH10 stage were loaded in the upper well and respective treatments (HIF-1α inhibitor [10 µM], JSH-23 [30 µM], rotenone [5 µM]) in the lower wells. Cell migratory ability was quantified as the number of migrated cells on the lower surface of the membrane.
Immunofluorescence
Chick progenitor cells isolated between the HH10 and HH13 stages of chick embryo development were plated onto gelatin-coated coverslips. Upon cell adherence, the cells were fixed with fresh 2% paraformaldehyde for 10 min. Cells were permeabilized with 0.1% Triton X-100, blocked with 1% bovine serum albumin (BSA), and then immuno-labeled with anti-cGMP antibodies at 1:1000 dilution and incubated at 4°C overnight. Cells were then washed and incubated with anti-rabbit FITC-conjugated secondary antibody for 1 h. The cells were examined with an Olympus XL70 fluorescent microscope. The intensity was quantified using the histogram analysis of Adobe Photoshop, version 7.0
Statistical analysis
All the experiments were performed in triplicate (n = 3) unless otherwise specified. Data have been presented as mean ± SEM. Data analysis was done using the one-way ANOVA test, Student’s t-test, and the Tukey post hoc test, as appropriate, using SigmaStat 3.5 software, Systat Inc, Illinois, USA. Differences among means were considered significant when p ⩽ 0.05.
Results
NO modulation and characterization of angioblasts in early vasculogenesis
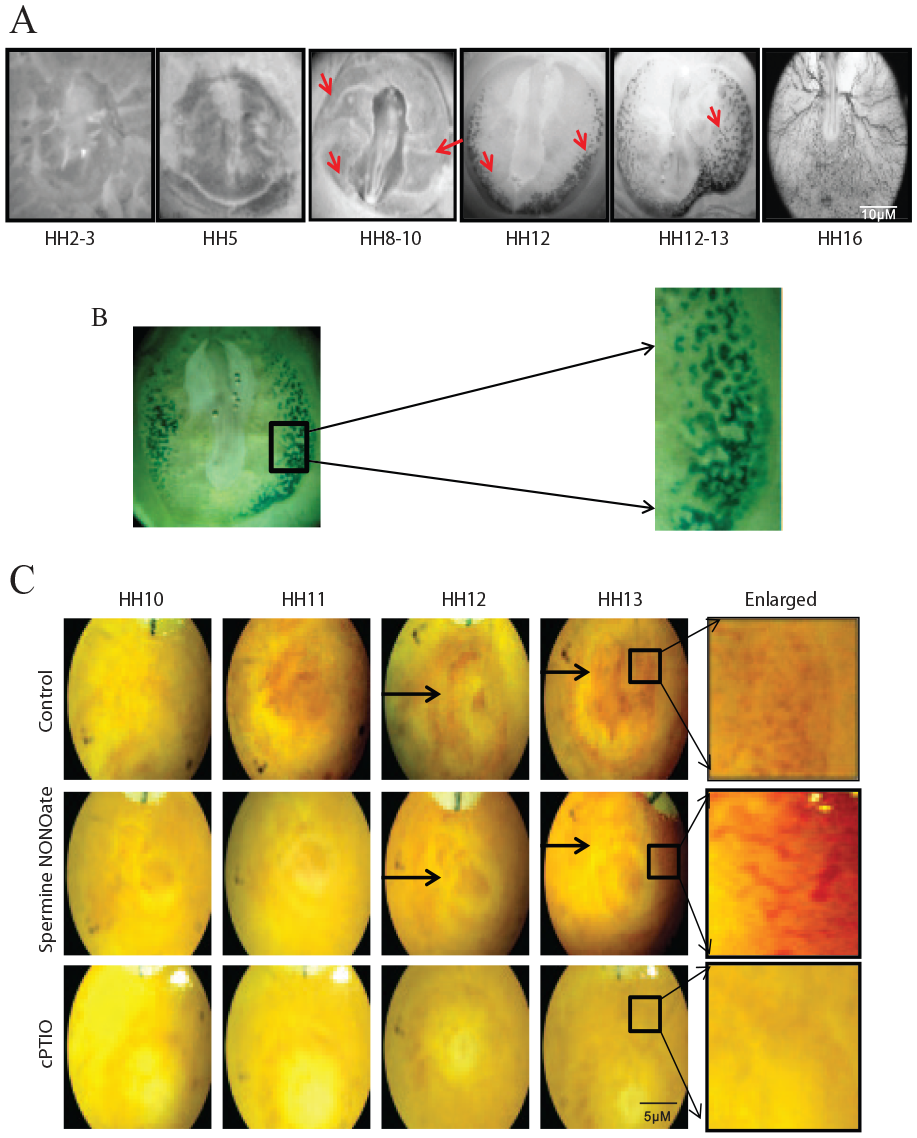
To study the dynamics of blood island formation, we isolated the chick area vasculosa (AV) at regular intervals from the time of incubation and treated AV with benzidine, which stains hemoglobin-synthesizing cells. We observed benzidine-positive cells from the HH8 stage of development throughout the extraembryonic AV (Figure 1A, B). The isolated angioblasts (Figure S1A) were characterized for angioblast markers, CD34, KDR, CD133, and CD31 using flow cytometry (Figure S1B) (see online supplementary material).
(
Further, we aimed to treat eggs with a NO donor and cPTIO, a NO scavenger, to study the role of NO in vasculogenesis. It is known that the half-life of NO donors defines the bioavailability of NO in the process of vasculogenesis; therefore, we explored the best NO donor in angioblasts by ring formation assay. We used DETA, spNO, Proli, and Sulpho NONOate for the experiment. The spNO showed a 2.21-fold increase in the number of ring formation followed by DETA and Proli, which showed 1.66- and 1.5-fold increases in ring formation, respectively. However, Sulpho NONOate showed a decrease in the number of ring formations compared to the control (Figure S1C) (see online supplementary material). Hence, we chose spNO for future experiments.
To further explore the best concentration, we used concentrations ranging between 0 nM and 100 µM of spNO on angioblast cells and checked for ring formation. Concentrations of spNO at 10 nM, 100 nM, and 1 µM showed ring formation; however, the results were not statistically significant. Angioblasts treated with 10 µM and 100 µM concentrations of spNO showed a significant increase in ring structures compared to the control (Figure S1D) (see online supplementary material). We used 10 µM of spNO for further studies.
Next, we treated chicken eggs with spNO and cPTIO at the HH10 stage, along with PBS as vehicle control, to study the role of NO in vasculogenesis. Exogenous addition of NO favored vasculogenesis by the formation of distinct primary plexus at the HH13 stage, whereas in the HH13 stage of the control, the blood islands still coalesced to form plexus. The addition of cPTIO resulted in complete inhibition of plexus formation (Figure 1C).
Temporal dynamics of endogenously produced NO during early vasculogenesis
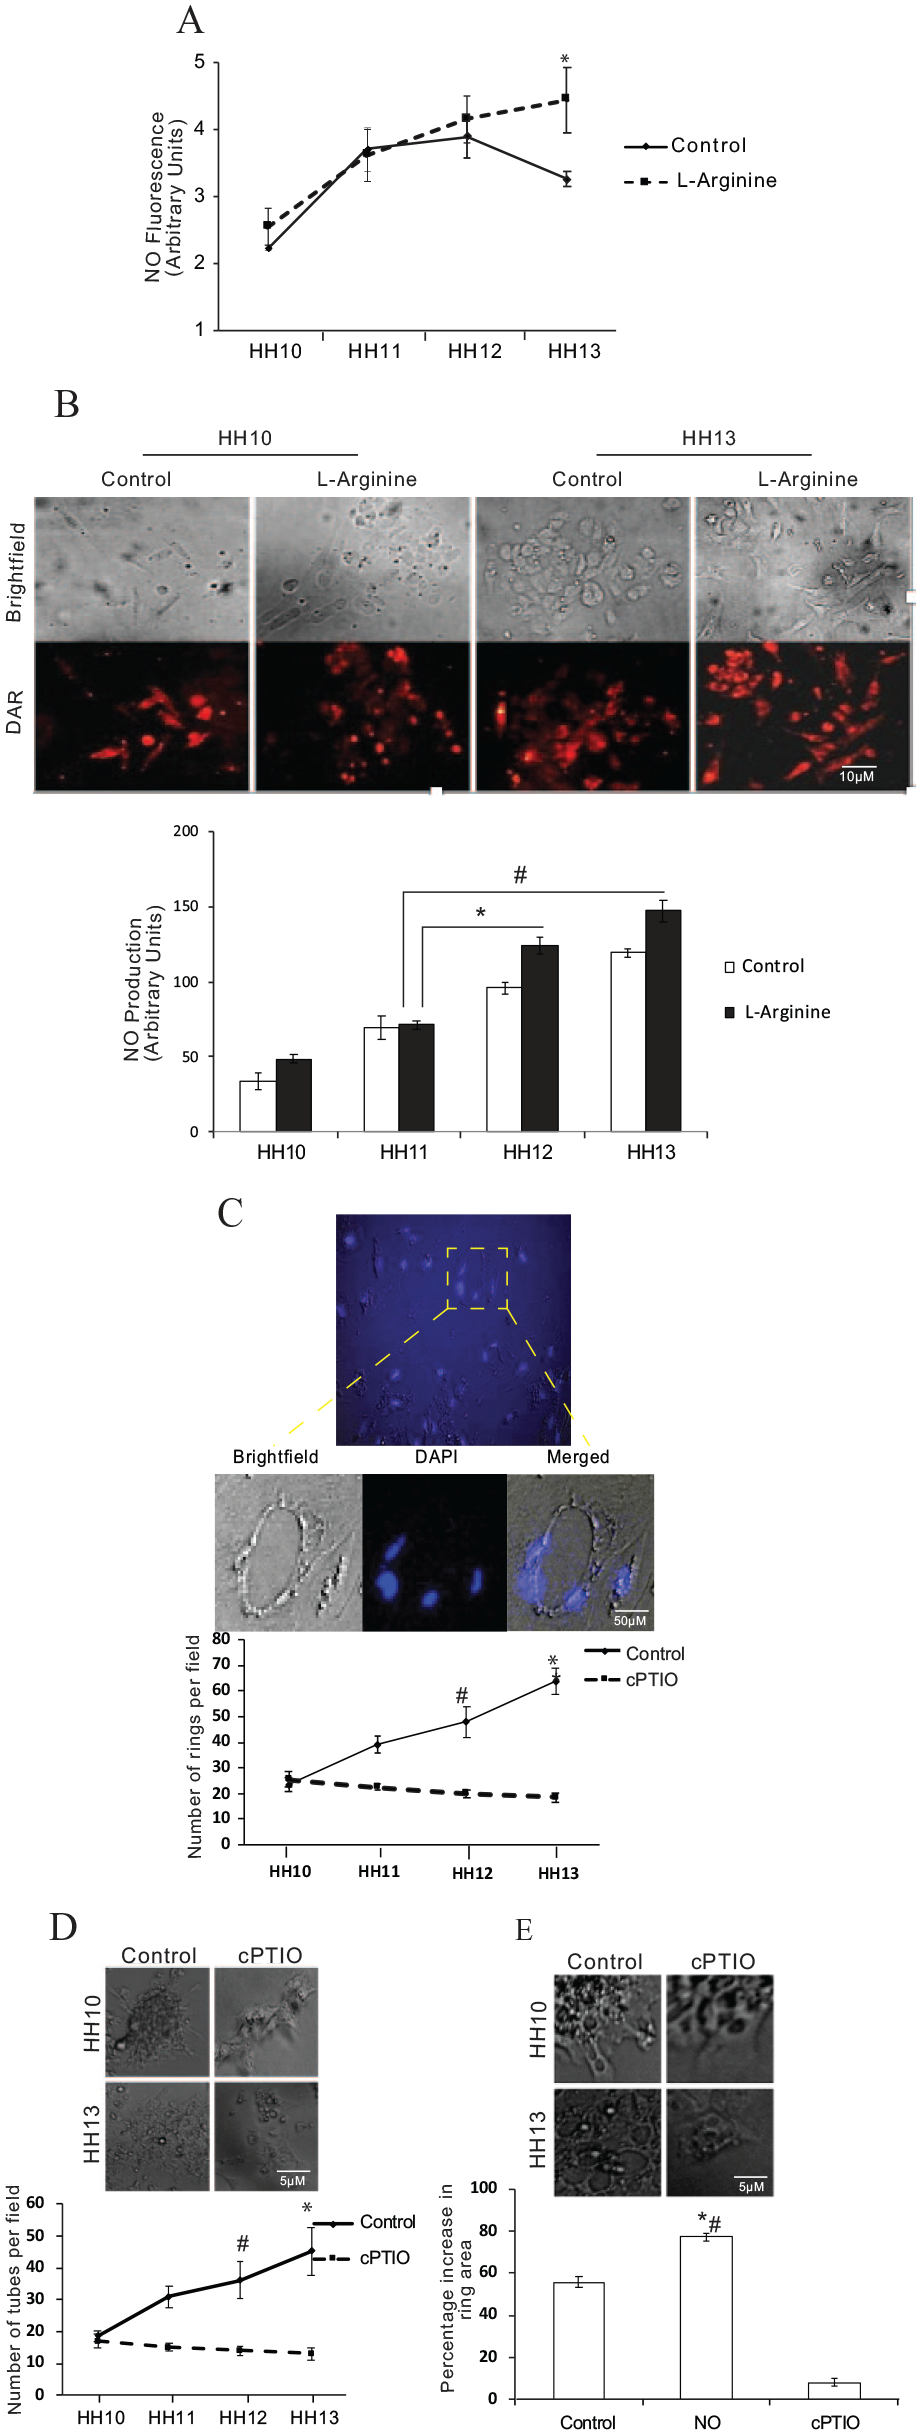
Next, to determine the endogenous NO levels, we isolated angioblasts between stages HH10 and HH13 of development and checked for NO production, with and without
We observed that under
(
NO inhibition restricts the functional potential of angioblasts
Next, we wanted to investigate if NO modulation had any implication in the events of vasculogenesis. Ring formation is the principal event of vasculogenesis. The work of Sinha et al. proposed that NO is implicated in the formation of the endothelial ring-like structures, hence we intended to determine the ring and tube-forming ability of angioblasts in the absence of NO.
10
To understand this, we isolated angioblast cells and hematopoietic cells from the extraembryonic membrane across stages HH10–HH13 (Figure S2A) (see online supplementary material). Hematopoietic cells contain nucleated red blood cells. To understand NO levels in these two populations, and to decide on which cells to use for functional assays, we checked the NO levels in these two populations. Interestingly, we found a significant increase in
Time-dependent distribution of NO synthase (NOS) during early vasculogenesis
Given that NO modulation influences vasculogenesis, the next question we attempted to answer was – what could be the source of NO in angioblasts? Many reports suggest the involvement of NOS isoforms in the vasculogenesis process.3,11 NOS acts as a catalyst in the conversion of
(
Role of hypoxia in early vasculogenesis
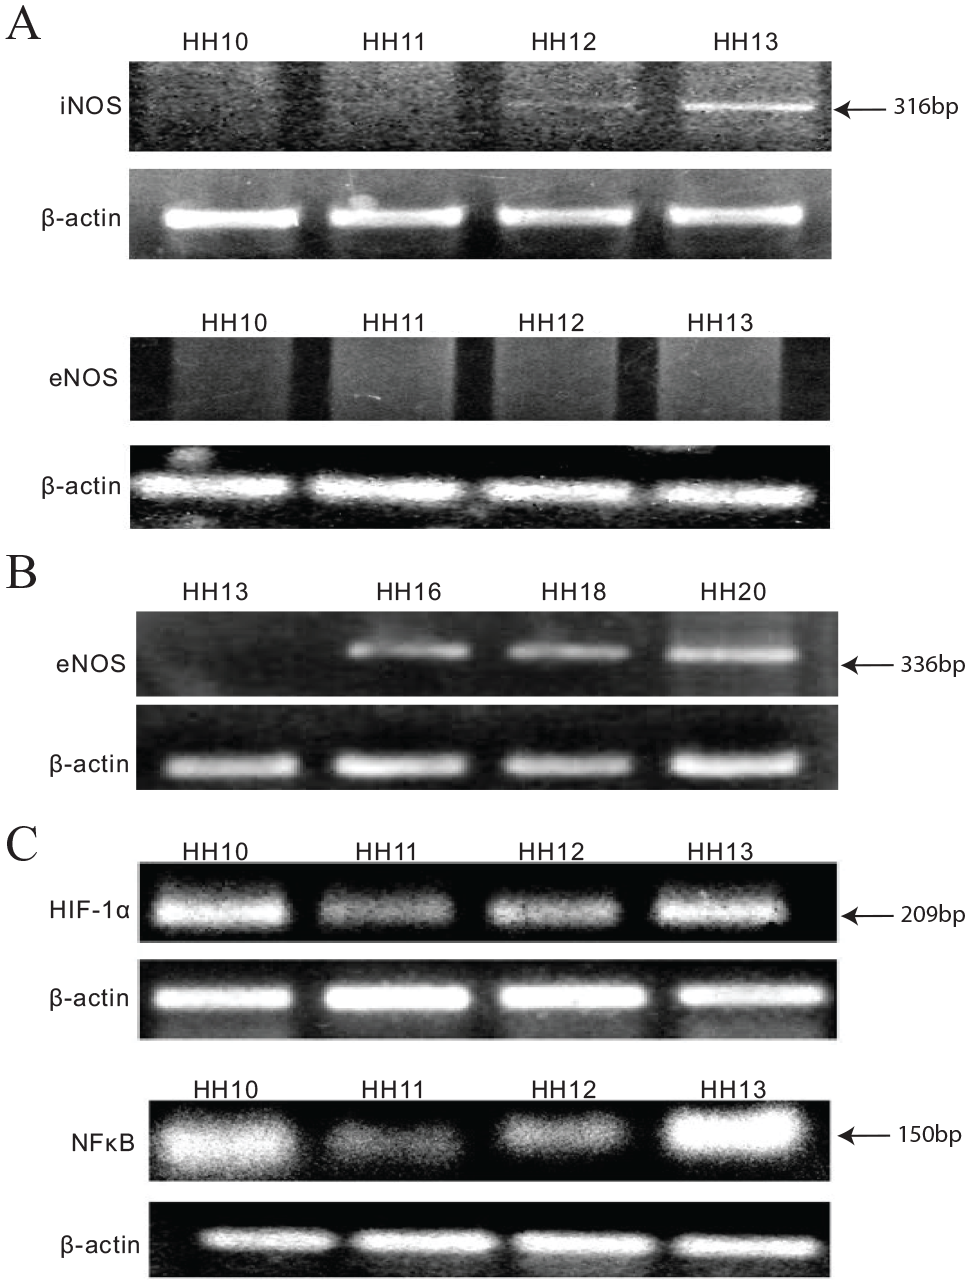
We hypothesized that the proliferation, migration, and plexus formation of mesoderm cells are controlled by NOS-independent reduction of nitrite to NO under conditions of low oxygen levels during the very early phases of development. We first attempted to evaluate the gene expression profile of HIFs from the HH10 to HH13 stages of development. HIF is a known critical transcriptional regulator activated in response to O2 deprivation. 12 Hence, we performed semi-quantitative PCR to examine HIF-1α expression during the HH10–HH13 stages of development (Figure 3C). Furthermore, many of the stimuli that induce HIF-1 in normoxia are known to activate several other transcription factors, such as nuclear factor κB (NF-κB). 13 Hence, we elucidated the plausible expression profile of NF-κB in relation to HIF-1α signaling during the early stages of development. We performed semi-quantitative PCR to evaluate NF-κB expression during the HH10–HH13 stages of development (Figure 3C). We observed the gene expression pattern of NF-κB was similar to HIF-1α expression. With these results, it was evident that a cross-talk occurs between HIF and NF-κB during the HH10–HH13 stages of development.
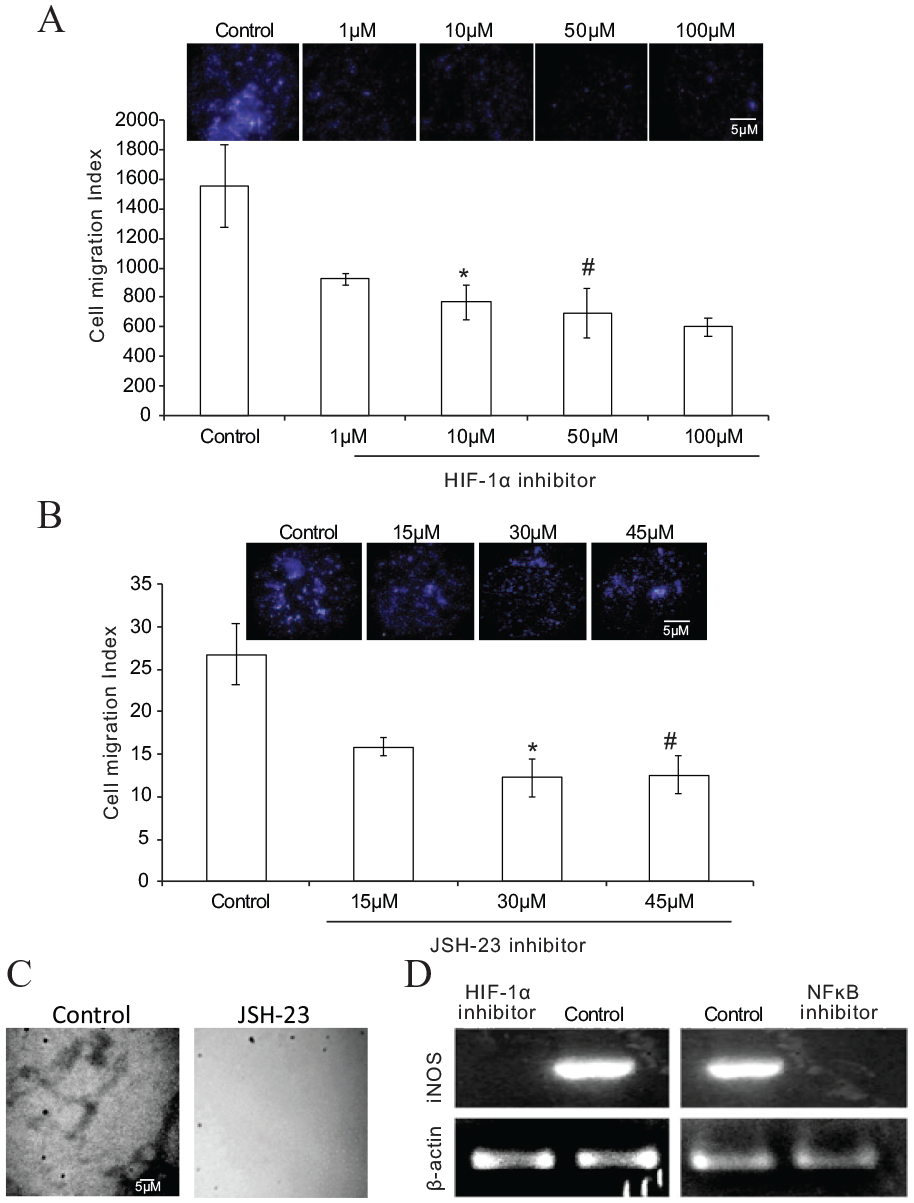
Next, we explored the link between hypoxia signaling and early vasculogenesis. To investigate the link, we employed two specific inhibitors of HIF-1α and NF-κB. We evaluated iNOS expression by blocking either of these two proteins to validate the HIF-iNOS signaling axis. The HIF-1α inhibitor is a novel small molecule that inhibits HIF by reducing HIF-1α accumulation and gene transcriptional activity. 14 To determine the optimal concentration of HIF-1α inhibitor, we used four different concentrations of inhibitor (1 µM, 10 µM, 50 µM, and 100 µM) and analyzed cell migration by Boyden’s chamber assay. Although 10 µM and 50 µM of HIF-1α inhibitor showed significant blockage of migration (Figure 4A), we chose a 10 µM concentration of the inhibitor for further studies. Similarly, JSH-23, an inhibitor of NF-κB transcriptional activity, interferes with lipopolysaccharide-induced nuclear translocation of NF-κB, inhibiting the mechanism of transcription, without affecting the process of IκB degradation. 15 To determine the optimal concentration of JSH-23, we used three different concentrations (15 µM, 30 µM, and 45 µM) to analyze cell migration by Boyden’s chamber assay. Results showed statistically significant inhibition with 30 µM and 45 µM (Figure 4B). Hence, we chose a 30 µM concentration of inhibitor for further studies. To investigate further the functional implications of JSH-23 inhibitor on plexus formation at HH13 stage, we treated the eggs with 30 µM of inhibitor at the HH10 stage and checked for plexus formation at the HH13 stage. We could not observe any plexus formation in inhibitor-treated eggs compared to control (Figure 4C). In an attempt to validate the HIF-NF-κB-iNOS signaling axis, we treated eggs with HIF-1α and NF-κB inhibitor, respectively, at the HH10 stage and incubated them until the HH13 stage. Semi-quantitative PCR was carried out on the RNA from inhibitor-treated and control eggs at the HH13 stage for iNOS expression. Results demonstrated inhibition of iNOS expression in HIF-1α and NF-κB inhibitor-treated eggs. Control eggs were used in common for both the inhibitors. iNOS expression was evident in control eggs, suggesting the direct cross-talk of genes in the signaling axis (Figure 4D).
(
Role of nitrite reductase (NR) in early vasculogenesis
As mentioned previously, we hypothesized that hypoxia acts as a signal for the reduction of NO2 to NO.
16
We studied the NR-derived NO production in angioblasts by incubating them with and without sodium nitrite by DAF-fluorimetry. We observed NO production throughout the stages HH10–HH13; however, interestingly, we found a sudden decrease in NO production in angioblasts treated with sodium nitrite after the HH12 stage (Figure 5A). We inferred that this shift in NO production between HH10–11 and HH12–13 is an attribute to the involvement of NOS enzyme during the later stage of vasculogenesis. Therefore, we treated angioblasts with sodium nitrite and
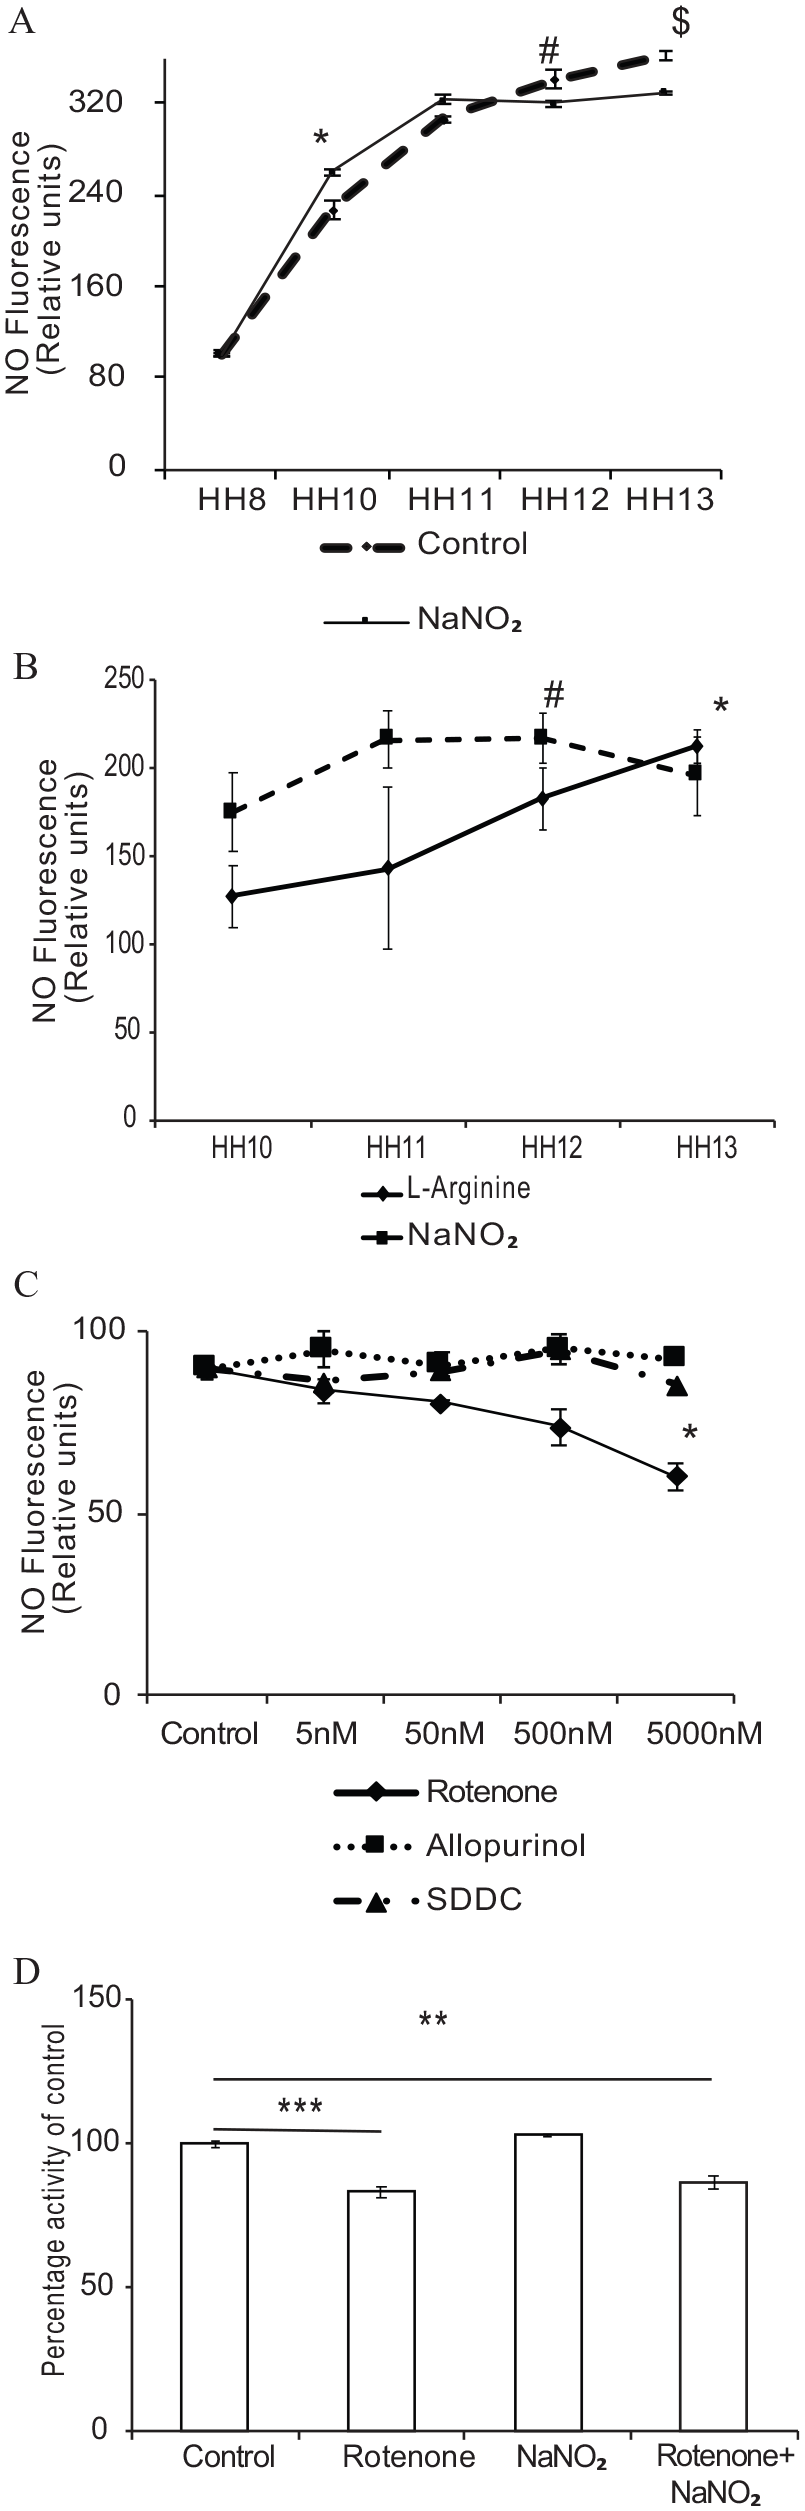
Reconfirming our previous results, we found an inverse relationship of NO production between sodium nitrite and
Mitochondrial NR and vasculogenesis: NR activity in chick area vasculosa (AV)
To determine if nitrite-induced NO production during the HH10 and HH11 stages of development is due to NR activity of angioblasts, we used different NR inhibitors. Xanthine oxidase, aldehyde oxidase, and mitochondrial electron transport chain (ETC) are considered NR, so we used specific inhibitors such as allopurinol, 17 SDDC, 16 and rotenone. SDDC is used very rarely as an NR inhibitor in endothelial cells, yet has the potential in trapping nitrite-induced NO. 16 This prompted us to employ it in our experiments. To evaluate the optimal concentration of SDDC on angioblasts, we first used a range of concentrations (10–50 µM) on EAhy926 cells and analyzed the cell morphology (Figure S3A) (see online supplementary material). We observed rounding off cells at higher concentrations. Effective concentration on mature endothelial cells was found to be 20 µM (Figure S3B) (see online supplementary material). Considering that angioblasts are naive cells, we took a fourfold lesser concentration of SDDC for further assays. We used the recommended concentration of allopurinol from the literature. 17
In another approach, rotenone was used as a very effective inhibitor of electron transfer from the Fe-S center of complex I of the (ETC) to ubiquinone, acting at a domain common for hydrophobic complex I inhibitors, a large membrane located pocket of the complex.18,19 Initially, we used different concentrations of NR inhibitors on angioblasts isolated at the HH10 stage and checked for NO production. We did not observe any significant decrease in NO production in cells treated with all concentrations of allopurinol and SDDC. However, a slight decrease was observed at a higher concentration. In contrast, rotenone significantly attenuated NO production at all concentrations, indicating a greater inhibition of 66% at higher concentrations (Figure 5C).
The results showed that rotenone was very efficient in blocking NR-mediated activities and significantly decreased NO production at a very low concentration ranging from 5 nM to 5 µM, whereas allopurinol and SDDC inhibited NO production at much higher concentrations. Hence, we chose rotenone to validate NR activity in further experiments.
We examined the effects of rotenone on the function of mitochondrial NR activity by MTT assay. Our results demonstrated that incubation with a 5 µM concentration of rotenone could reduce MTT to only 82.1% in relation to the control. This decrease could be attributed to at least a partial dependence on ETC being inhibited by rotenone. However, when cells were pre-incubated with rotenone (5 µM) and then treated with sodium nitrite, still the reduction could not be reversed, thus showing 86.6% reduction in relation to the control (Figure 5D).
To elucidate the influence of a rotenone-induced decrease in NO levels on the plexus formation, we treated the incubated eggs with 5 µM rotenone at the HH10 stage and observed for plexus formation on the 4th day of incubation. We observed significant inhibition of plexus formation in rotenone-treated embryos (Figure S4A) (see online supplementary material). Further, to understand the effect of rotenone on the development of chick embryos, we treated the incubated eggs with 5 µM rotenone at the HH10 stage and observed for plexus formation on the 5th day of incubation. We observed that rotenone-treated embryos showed significant hemorrhage and reduction in body mass; however, rotenone and spNO co-treated embryos exhibited normal morphology, as the control (Figure S4B) (see online supplementary material). A notable reduction in the body mass and eye size was observed in rotenone-treated embryos (Figure S4C) (see online supplementary material). On the other hand, we observed a reduction in body mass in rotenone and spNO co-treated embryos; however, the reduction was not as significant as rotenone treated alone. These results strongly suggest that a decrease in NO levels due to rotenone treatment attributes to poor vasculogenesis, retarded embryo development, and reduced eye size. Having observed that rotenone significantly blunted NO production, we assessed whether or not any other NR could contribute to NO production in angioblasts after rotenone treatment. We incubated angioblasts with 5 µM rotenone and treated them with sodium nitrite to check the NO production. We observed a significant decrease in NO production in cells incubated with rotenone and sodium nitrite compared to control and sodium nitrite alone. Nevertheless, cells incubated with rotenone and sodium nitrite produced more NO than the cells treated with rotenone alone; however, it was not statistically significant (Figure S4D) (see online supplementary material). Reconfirming the previous experiment, we observed a statistically significant decrease in NO levels in rotenone-treated cells compared to the control and sodium nitrite treated alone (Figure S4E) (see online supplementary material).
Real-time measurement of NO by an ultrasensitive NO electrode showed a significant decrease in NO production in rotenone-treated extraembryonic membrane, whereas NaNO2 in combination with rotenone could increase NO production to a minimal level. However, the increase was significantly less than the control and NaNO2 alone (Figure S5A and B) (see online supplementary material).
Nitric oxide invokes cGMP-dependent signaling in early vasculogenesis
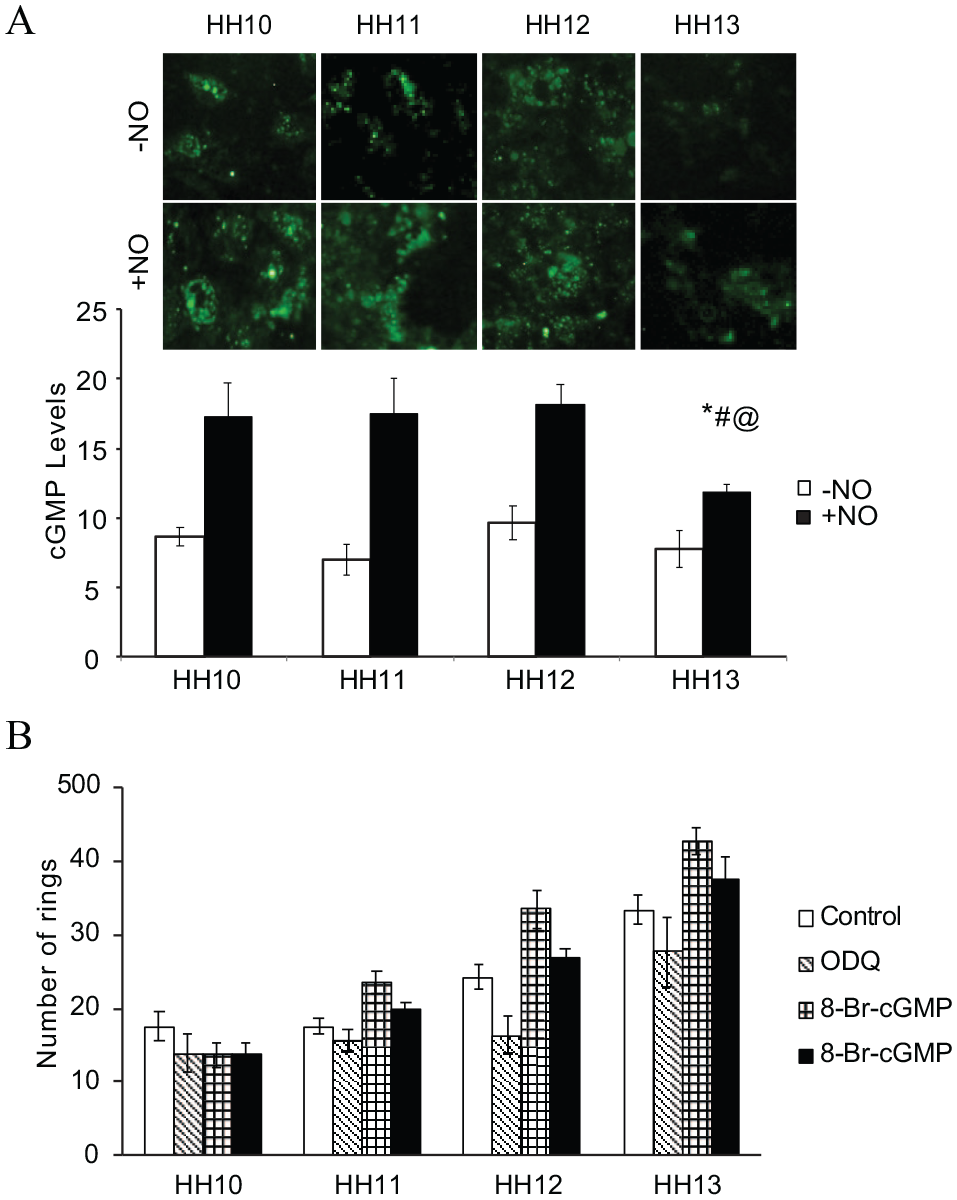
Next, we probed into the NO downstream signaling. Our experimental data showed that cGMP levels did not vary significantly across the stages, except at HH13, where a fall in the cGMP levels was observed (Figure 6A). Further experiments show that 8-Br-cGMP, a stable pharmacological analog of cGMP, could recover partially the ring formation upon ODQ treatment; however, it was not statistically significant (Figure 6B).
(
Discussion
Previous studies have shown that eNOS knockout mice have defects in the mobilization of stem cells and endothelial progenitor cells, 20 emphasizing the importance of NO in vasculogenesis. Earlier results from our laboratory show that the HH8 stage is the most sensitive stage during chick vascular development. In the present study, we determined the temporal dynamics of NO and its role in early vasculogenesis .
When cPTIO was used in our experiments to scavenge NO, the process of plexus formation in AV was delayed or completely absent, whereas NO-treated AV embryo showed plexus formation in HH12 and HH13. Our results were consistent with previous observations, where inhibition of NO at the blood island stage in murine yolk sac development led to vasculopathy. 2 Furthermore, we observed a significant drop in the proangiogenic potential of the cultured vascular cells that were harvested from the blood island when treated with NO scavenger (Figure 2C, D). In accordance with other studies, 21 the present study suggests that NO facilitates angiogenic events such as migration, ring formation, and tube formation during early vasculogenesis.
Further, we also observed a time-dependent expression pattern of iNOS and eNOS across the developmental stages (Figure 3A, B). Studies performed by Teichert et al. suggested that the transcriptional activity of the eNOS gene follows, rather than preceding the onset of circulatory flow in the developing mammalian embryo, suggesting that the eNOS gene is not expressed at the earliest stages of vasculogenesis. 4 Therefore, we speculate that the reason for the absence of eNOS expression during early stages may be due to the absence of circulation.
Oxygen tension plays a crucial role in vasculogenesis during embryonic development.
22
At the time of gastrulation, the actively dividing cells experience a low oxygen environment. Because the uterine environment is hypoxic, we speculate that hypoxia may be the primary stimulus of vessel formation. As NOS becomes inefficient under hypoxic conditions, due to the fact that the enzyme is oxygen-dependent, nitrite, the second major source of NO, becomes relevant. We also speculate that yolk could also be a major source of nitrate. Hypoxia has also been shown to facilitate the reduction of nitrite to NO, a process catalyzed by NRs.
16
We observed a nitrite-dependent increase in NO production in the HH10 and HH11 stages of development, suggesting NR activity (Figure 5A). Besides, the inverse relationship exhibited by sodium nitrite and
The next part of our study focused on the hypoxia signaling. Evaluation of HIF-1α and NF-κB expression showed an increased expression of HIF-1α and NF-κB during HH10 and HH13 (Figure 3C). This difference in expression could be due to a potential alternative signaling pathway for hypoxia-induced alterations of NOS gene expression due to the redox state of the cells. Finally, the present study explored the downstream cascade of NO in the early vasculogenesis niche. Experimental data showed that cGMP levels remained the same across the stages, but a significant decrease in the level of cGMP was observed at the HH13 stage in the presence of NO (Figure 6A). However, 8-Br-cGMP, a stable analog partially rescued soluble guanylate cyclase (sGC), when blocked with ODQ, suggesting cGMP-dependent vasculogenesis (Figure 6B). Studies from other research groups also suggested that cGMP-independent pathways are also critical to angiogenesis.23,24
Study limitations
There were certain limitations to our study. The NOS expression data obtained to make an overall conclusion about the time-dependent NO production during early vasculogenesis were made based on cDNA amplified from isolated RNA rather than by RT-qPCR, and these findings need to be confirmed by protein expression using immunological techniques.
Conclusion
In summary, the present study suggests the importance of NO in early vasculogenesis. We also describe the temporal dynamics of the NO sources, which switches over from NR to the hypoxia-defined induction of iNOS in early vasculogenesis (Figure 7). These findings suggest that the temporal dynamics of the NO source switches from NR to NOS in the extraembryonic area vasculosa, where both nitrite reduction and NOS activity are defined by hypoxia.
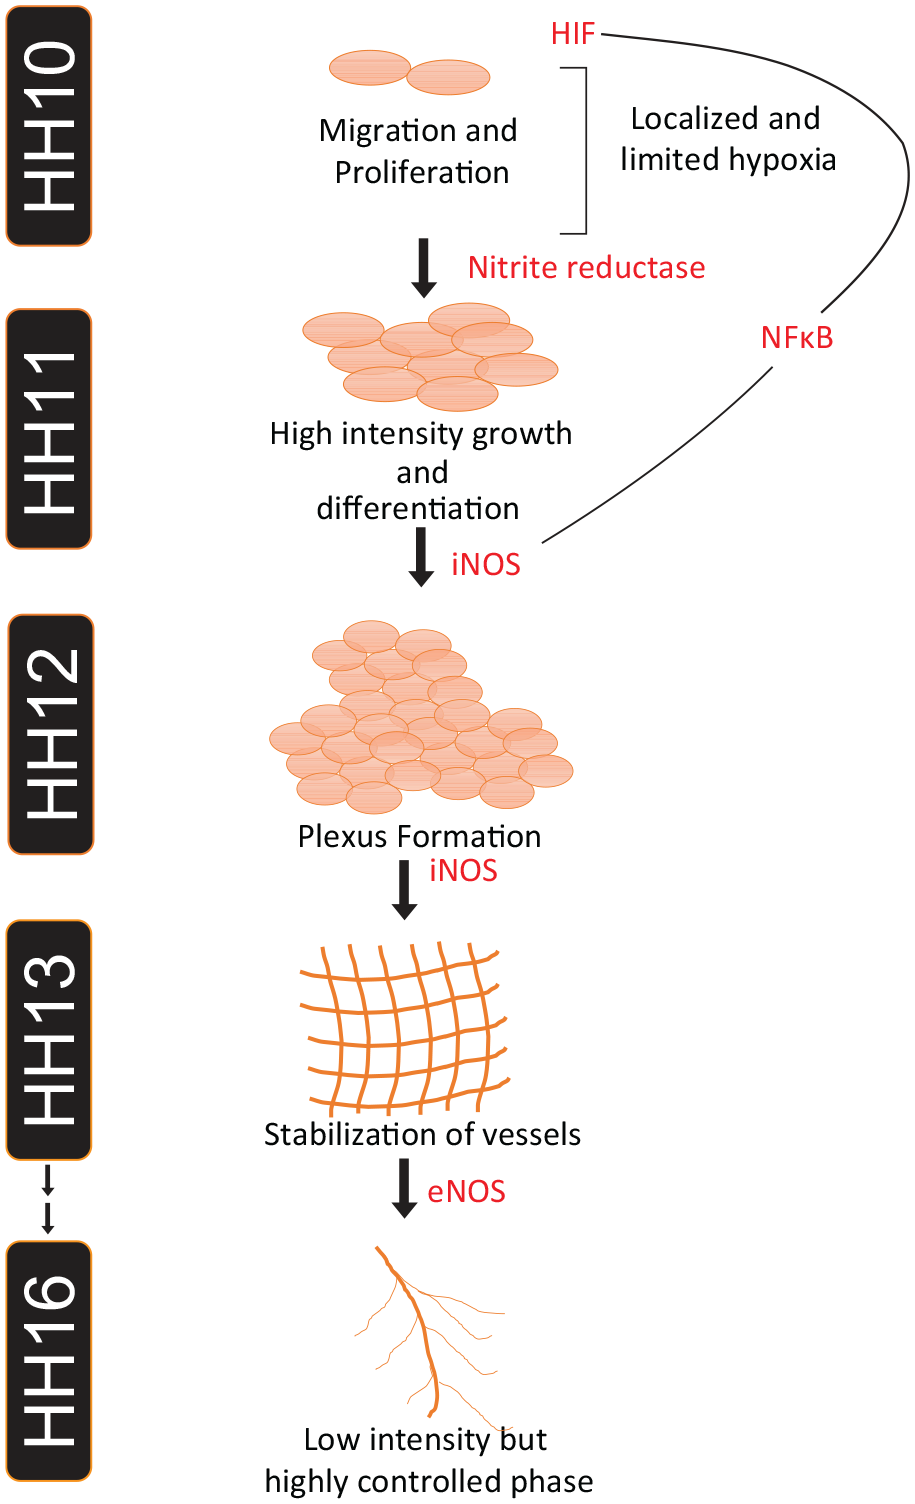
Schematic representation of the temporal dynamics of the NO wave that drives the early vasculogenesis: Our data support the model whereby the first NO wave produced because of NR activity favored by the local hypoxia promotes cell migration and proliferation. The second wave induced by iNOS, and eNOS at later stages, provide a tight regulation of stage appropriate production of NO that provides a massive support to cell proliferation and differentiation, aiding plexus formation, thereby facilitating normal vascular development.
Supplemental Material
sj-pdf-1-vmj-10.1177_1358863X211035445 – Supplemental material for Temporal dynamics of nitric oxide wave in early vasculogenesis
Supplemental material, sj-pdf-1-vmj-10.1177_1358863X211035445 for Temporal dynamics of nitric oxide wave in early vasculogenesis by Saranya Rajendran, Lakshmikirupa Sundaresan, Geege Venkatachalam, Krithika Rajendran, Jyotirmaya Behera and Suvro Chatterjee in Vascular Medicine
Footnotes
Data availability
All study data are available upon request to the corresponding author.
Declaration of conflicting interests
The authors declared no potential conflicts of interest with respect to the research, authorship, and/or publication of this article.
Funding
This work was partially supported by a grant from the University Grant Commission Faculty Recharge Programme (UGC-FRP), Government of India and KBC Research Foundation, India to Suvro Chatterjee.
Supplementary material
The supplementary material is available online with the article.
References
Supplementary Material
Please find the following supplemental material available below.
For Open Access articles published under a Creative Commons License, all supplemental material carries the same license as the article it is associated with.
For non-Open Access articles published, all supplemental material carries a non-exclusive license, and permission requests for re-use of supplemental material or any part of supplemental material shall be sent directly to the copyright owner as specified in the copyright notice associated with the article.