
Abstract
Little is known about the prognostic significance of specific characteristics of magnetic resonance imaging (MRI) measured plaque in the superficial femoral artery (SFA). Associations of MRI-measured plaque quantity, lumen area, and plaque composition in the SFA with subsequent mobility loss were studied in people with lower extremity peripheral artery disease (PAD). Participants with an ankle–brachial index (ABI) < 1.00 were identified from Chicago medical centers and underwent direct visualization of atherosclerotic plaque in the SFA using MRI. Participants were followed annually for up to 4 years. Mobility loss was defined as becoming unable to walk up and down a flight of stairs or walk one-quarter of a mile without assistance among participants without mobility impairment at baseline. Analyses adjusted for age, sex, race, comorbidities, ABI, physical activity, and other confounders. Of 308 PAD participants without baseline mobility impairment, 100 (32.5%) developed mobility loss during follow-up. Compared to the lowest mean plaque area tertile at baseline, participants in the highest (worst) plaque area tertile had a higher rate of mobility loss (hazard ratio (HR) = 2.08, 95% confidence interval (CI) = 1.14–3.79, p = 0.018). Compared to the highest mean lumen area tertile, the smallest (worst) mean lumen area tertile was associated with greater mobility loss (HR = 2.18, 95% CI = 1.20–3.96, p = 0.011). Neither lipid rich necrotic core nor calcium in the SFA were associated with mobility loss. In conclusion, greater plaque quantity and smaller lumen area in the proximal SFA, but not lipid rich necrotic core or calcium, were associated with higher mobility loss in people with PAD.
Keywords
Introduction
People with lower extremity peripheral artery disease (PAD) have higher rates of mobility loss than people without PAD.1–2 Approximately one-third of people with PAD experience new mobility loss over a one-year follow-up, 3 defined as becoming unable to walk one-quarter of a mile or walk up and down a flight of stairs without assistance. 4 A smaller calf muscle area, greater calf muscle fatty infiltration, and lack of walking exercise are each associated with higher mobility loss rates in people with PAD.3,5 However, associations of specific lower extremity atherosclerotic plaque characteristics with mobility loss are unknown.
In the coronary arteries, associations of coronary artery stenosis versus vulnerable plaque as predictors of acute coronary syndromes have been extensively studied.6–11 While preliminary evidence suggested that vulnerable plaque in the coronary arteries, defined as a plaque with lipid rich necrotic core (LRNC) and a thin fibrous cap, was an important predictor of acute coronary events,12–14 more recent evidence suggests that coronary stenosis severity and atherosclerotic burden may be more important prognostic indicators of acute coronary events than vulnerable plaque.6–11 However, in PAD, the prognostic significance of femoral artery stenosis versus plaque characteristics for lower extremity outcomes remains unclear.
The superficial femoral artery (SFA) is the most common site of lower extremity atherosclerosis in PAD.15,16 Among people with PAD, approximately 25% have LRNC in the SFA and 60% have calcium in the SFA. 17 A previous cross-sectional study showed that a greater SFA plaque quantity and a smaller lumen area were associated with greater functional impairment. 18 LRNC in the SFA was associated with higher rates of PAD progression, measured by an ankle–brachial index (ABI) decline, amputation, critical limb ischemia, or revascularization. 19 Greater numbers of collateral vessels have been associated with a slower decline in walking velocity in people with PAD. 20
In this study, associations of plaque quantity, lumen area, presence of LRNC and calcium in the SFA, and collateral vessel number and size with mobility loss were studied in people with PAD. We hypothesized that in the SFA, greater plaque quantity, smaller lumen area, the presence of LRNC, and the presence of calcium would be associated with higher rates of mobility loss. We also hypothesized that greater numbers and a larger size of collateral vessels would be associated with lower rates of mobility loss.
Methods
Participants were part of the Walking and Leg Circulation Study (WALCS) III cohort, a longitudinal observational study examining the association of MRI-measured atherosclerotic plaque characteristics in the SFA with functional impairment and decline in men and women with PAD.17–20 Participants were identified from among all patients diagnosed with PAD in the non-invasive vascular laboratories or in vascular surgery, cardiology, and/or general medical practices at four Chicago-area hospitals. Patients in a general internal medicine practice aged 70 years or older without PAD were screened with the ABI to determine eligibility. The Institutional Review Board at all participating sites approved the protocol. Participants gave written informed consent. MRI was performed between January 2008 and April 2010. Between 1 January 2008 and 31 May 2008, a randomly selected 50% subset was selected to have plaque composition imaging. Between June 2008 and April 2010, all participants had MRI for plaque composition.17,18
Inclusion and exclusion criteria
The inclusion criterion was an ABI < 1.00. This ABI threshold was chosen because previous studies showed that individuals with an ABI of 0.90–1.00 have higher rates of mobility loss, cardiovascular events, mortality, and a higher prevalence of leg pain compared to individuals with an ABI of 1.10–1.40.2,21,22
Exclusion criteria have been described17–20 and are summarized here. Potential participants with dementia and those with a Mini-Mental Status Examination score < 21 were excluded. 23 Nursing home residents, wheelchair-bound patients, and patients with foot or leg amputations were excluded because of extremely impaired functioning. Patients with recent major surgery or contraindications to MRI testing were excluded. Potential participants requiring oxygen, those who stopped a six-minute walk test due to dyspnea, and those with severe knee osteoarthritis were excluded.
Ankle–brachial index measurement
After participants rested supine for 5 minutes, a hand-held Doppler probe (Nicolet Vascular Pocket Dop II, Golden, CO, USA) was used to measure systolic pressures in the right brachial, dorsalis pedis, and posterior tibial arteries and left dorsalis pedis, posterior tibial, and brachial arteries.17–19 Pressures were repeated in reverse order. Dorsalis pedis or posterior tibial arteries for which the calculated ABI was > 1.40 were excluded from the ABI calculation. The ABI was calculated in each leg by dividing average pressures in that leg by the average of the four brachial pressures. 24 This method yields an ABI value that is more closely associated with lower extremity functioning than alternative methods. 24 In a sensitivity analyses, the ABI was also calculated for each leg using the highest pressure in each leg in the numerator and the highest of the left and right brachial artery pressures in the denominator.
Magnetic resonance imaging
The SFA in the leg with the lowest ABI was imaged. MRI data were obtained with a 1.5-Tesla (Espree; Siemens Medical Solutions, Malvern, PA, USA) platform using a four-element phased-array surface coil (Nova Medical, Wilmington, MA, USA). The proximal region of the SFA was imaged using a standard, proton density-weighted turbo spin echo (TSE) acquisition (TR/TE = 2160 ms/8 ms, bandwidth 230 Hz/pixel, turbo factor 15). The field of view (FOV) was 120 × 120 mm2 and images were acquired on a 192 × 192 matrix to yield an in-plane spatial resolution of 0.625 × 0.625 mm2. Three signal averages were acquired for a total scan time of 5 minutes, 41 seconds.
Twelve contiguous 2.5-mm cross-sectional images in the short-axis plane were obtained, beginning at the bifurcation of the common femoral artery into the SFA and moving distally using two-dimensional (2D) bright-blood time-of-flight and proton density-weighted images. Bright-blood 2D time-of-flight images (TR/TE = 31.0 ms/7.2 ms) were registered to the proton density-weighted images and acquired using an identical FOV, slice thickness, and imaging matrix. Additional TSE images were acquired with TR/TE adjusted to collect images with T1-W (TR/TE = 800 ms/8 ms) and T2-W (TR/TE = 2160 ms/50 ms) contrast. Contrast weighting was used for plaque characterization.
For analysis of plaque area and lumen area, two trained physician readers used CASCADE software (Seattle, WA, USA).17,18 Readers who were blinded to clinical data traced the outer boundary and the lumen of each cross-sectional image to quantify wall area and lumen area. Plaque area was normalized for artery size by dividing each measure by the median of the total vessel area. 18 Lumen area was normalized per slice using total vessel area because of variation in vessel dimensions due to patient size.
Presence of LRNC and calcium were assessed at each artery cross-section by two readers at the University of Washington Vascular Imaging Laboratory using validated methods.17,25–28 Tissue types were identified based on signal intensities relative to the sartorius muscle. LRNC is hypointense on T2-weighted images, isointense or slightly hyperintense on T1-weighted images, and isointense on proton density-weighted and time-of-flight images. Calcium is hypointense in T1-weighted, T2-weighted, and time-of-flight images.
Collateral vessel measurement
Participants with a glomerular filtration rate > 30 mL/min/1.73 m2 were eligible for magnetic resonance angiogram (MRA) imaging. Dynamic MRA images from the groin to the knee were acquired from both legs, including the common femoral artery, the profunda femoris, the SFA, and the popliteal artery. Dynamic images were acquired with the TWIST (Time resolved angiography With Interleaved Stochastic Trajectories) pulse sequence.29–31 Parallel imaging with Generalized Autocalibrating Partially Parallel Acquisitions 31 image reconstruction provided a twofold increase in frame rate. Following a three-plane localizer image, the TWIST sequence was applied in the coronal orientation. A 10-mL bolus of gadopentetate dimeglumine (0.5 mmol/mL, Magnevist; Berlex, Montville, NJ, USA) was administered intravenously at 2 mL/sec. Imaging parameters were: TR/TE/Flip angle = 3.3 ms/1.3 ms/25°; rectangular field of view (rFOV) = 246 × 375 mm; matrix = 210 × 320; 88 partitions; voxel size after zero interpolation = 1.2 × 1.2 × 1.2 mm3 (true voxel size = 1.2 × 1.2 × 2.0 mm3); acceleration factor = 2.
A validated scoring system was used to grade the number and size of collateral vessels, based on previous study.20,30,32 For collateral vessel number, participants were categorized according to whether they had 0–3, 4–7, or ≥ 8 collateral vessels.20,30 For collateral size, participants were categorized as: ≤ 5 small collateral vessels and no large collateral vessels; > 5 small collateral vessels and no large collateral vessels; one or more large collateral vessels but a total number of collateral vessels ≤ 5; one or more large collateral vessels with total number of collateral vessels > 5.20,30,32 MRA images were reviewed by a radiologist unaware of participant characteristics.
Baseline comorbidities
Comorbidities were identified and confirmed using algorithms developed for the Women’s Health and Aging Study that combine data from patient report, medical record review, medications, laboratory values, and a primary care physician questionnaire. 33
Other baseline measures
Height and weight were measured at baseline. Cigarette smoking history was determined by self-report. Physical activity was measured based on self-report using the validated question: ‘During the last week, how many city blocks or their equivalent did you walk? Let 12 city blocks equal one mile.34,35
Mobility loss
Participants returned for follow-up at 1 year, 2 years, and 4 years after baseline. At the 3-year follow-up they underwent a telephone interview. At baseline and at each follow-up encounter, participants were asked whether they were able to walk up and down stairs to the second floor and walk one-quarter of a mile (three blocks) ‘on their own’, ‘with help’, or ‘not at all’. Mobility impairment was defined as either requiring help or the inability to (a) walk up and down a flight of stairs or (b) walk one-quarter of a mile.1,3–5 Participants’ reports of their mobility are valid and reliable and predicted rates of nursing home admission, disability, and mortality in the Established Populations for the Epidemiologic Study of the Elderly.4,36,37
Leg symptoms
Leg symptoms were characterized using established methods. 38 Intermittent claudication (IC) was defined as exertional calf pain that does not begin at rest, causes the participant to stop walking, and resolves within 10 minutes of rest. Participants without IC were either asymptomatic (i.e. reported no exertional leg symptoms) or had leg symptoms not meeting criteria for IC.
Statistical analyses
Baseline characteristics were compared between PAD participants with versus without mobility loss during follow-up. T-tests were used for continuous variables and chi-squared tests were used for categorical variables. Rates of mobility loss were compared between participants with versus without LRNC, with versus without calcium, across tertiles of mean lumen area, mean plaque area, and categories of collateral vessel number and grade using log-rank tests for statistical significance. Rates of mobility loss were estimated using Kaplan–Meier methods.
Associations of plaque LRNC, plaque calcium, mean plaque area tertiles, mean lumen area tertiles, collateral vessel number, and collateral vessel grade with mobility loss were evaluated using Cox proportional hazards models, adjusted for age, sex, race, diabetes, history of myocardial infarction, angina, log height, log weight, cigarette smoking, physical activity, and baseline ABI. Analyses were performed using SAS Statistical Software version 9.4 (SAS Inc., Cary, NC, USA).
Results
A total of 473 participants with ABI < 1.00 underwent MRI of the SFA. Of these, 108 (22.8%) were excluded due to the presence of mobility impairment at baseline and one was excluded due to missing data on mobility impairment at baseline, leaving 364 without mobility impairment at baseline. When the ABI was re-calculated using the highest pressures in each leg and arm, 11 of the 364 had an ABI > 1.00. Of the 364 eligible for analyses, 32 (8.8%) did not return for follow-up and 24 (6.6%) were excluded due to missing covariate data, leaving 308 participants. Of these, eight were excluded due to poor image quality, leaving 300 for analyses of the plaque and lumen area. In addition, 202 had data for SFA plaque composition and 199 had data on collateral vessels (Figure 1). The median follow-up was 47 months.
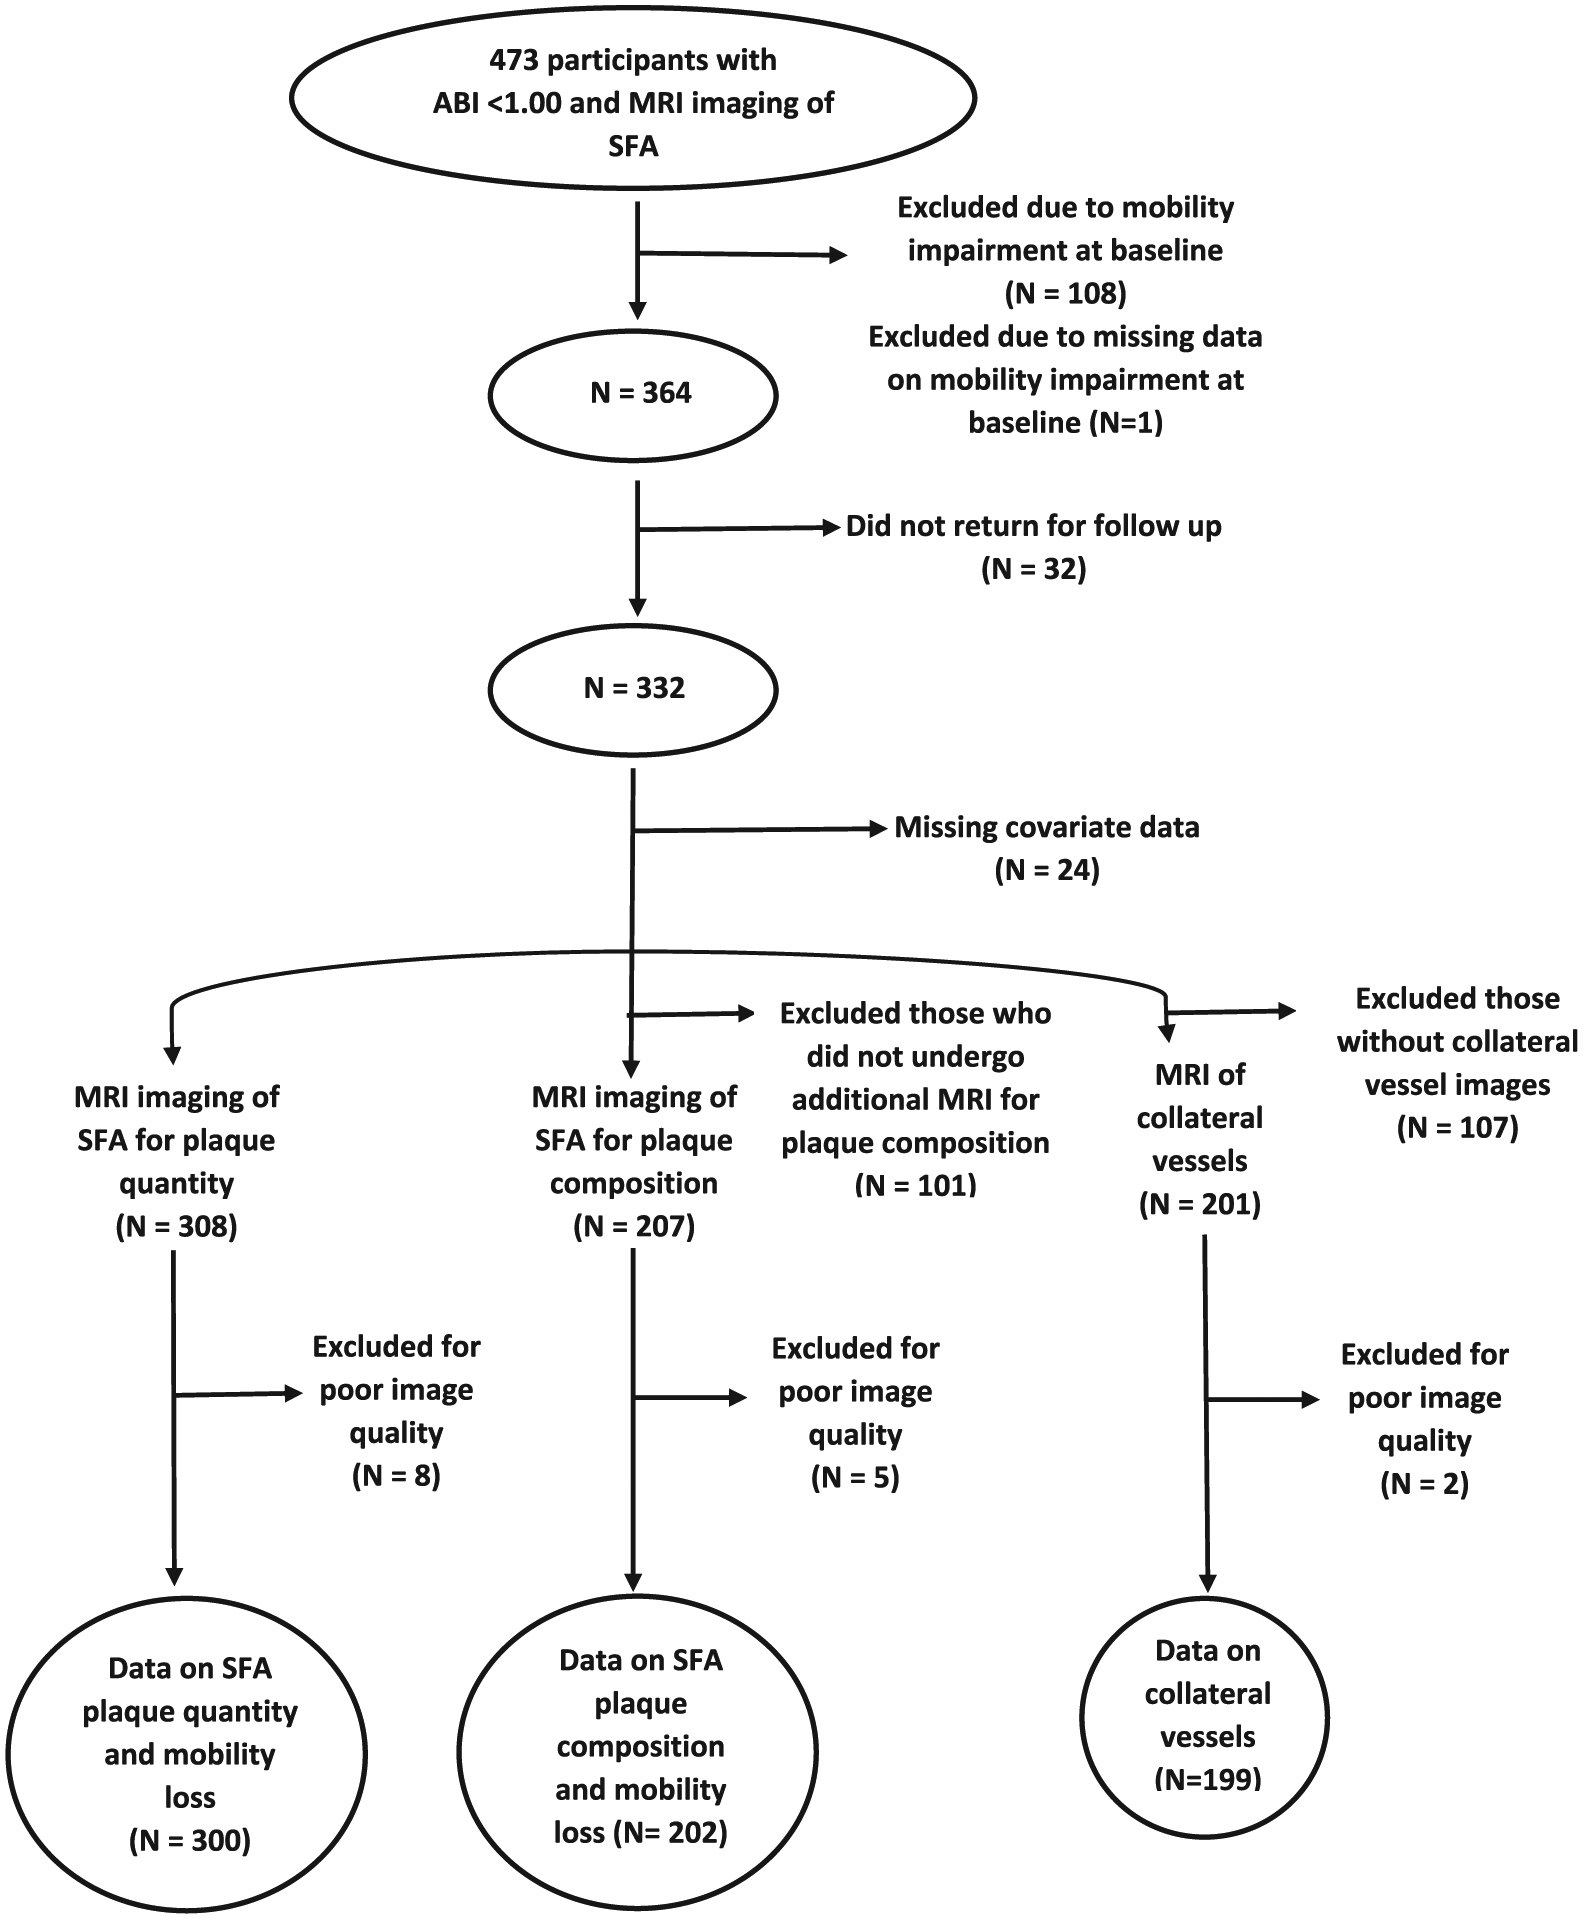
Numbers of participants with an ankle–brachial index < 1.00 included in analyses of proximal superficial femoral artery plaque quantity, plaque composition, and collateral vessels.
PAD participants with a greater SFA plaque area had a smaller mean lumen area, lower ABI values, a higher prevalence of calcium, and higher collateral vessel numbers and grade (Table 1). Similar findings were observed for participants with a smaller lumen area (Table 1). Of the 308 participants without mobility loss at baseline, 100 (32.5%) developed mobility loss during follow-up. Those with mobility loss during follow-up were older than those without mobility loss (Table 2).
Correlations of SFA plaque quantity and lumen area with plaque composition, ABI, and collateral vessels among individuals with ABI < 1.00 and no mobility impairment (n=300).
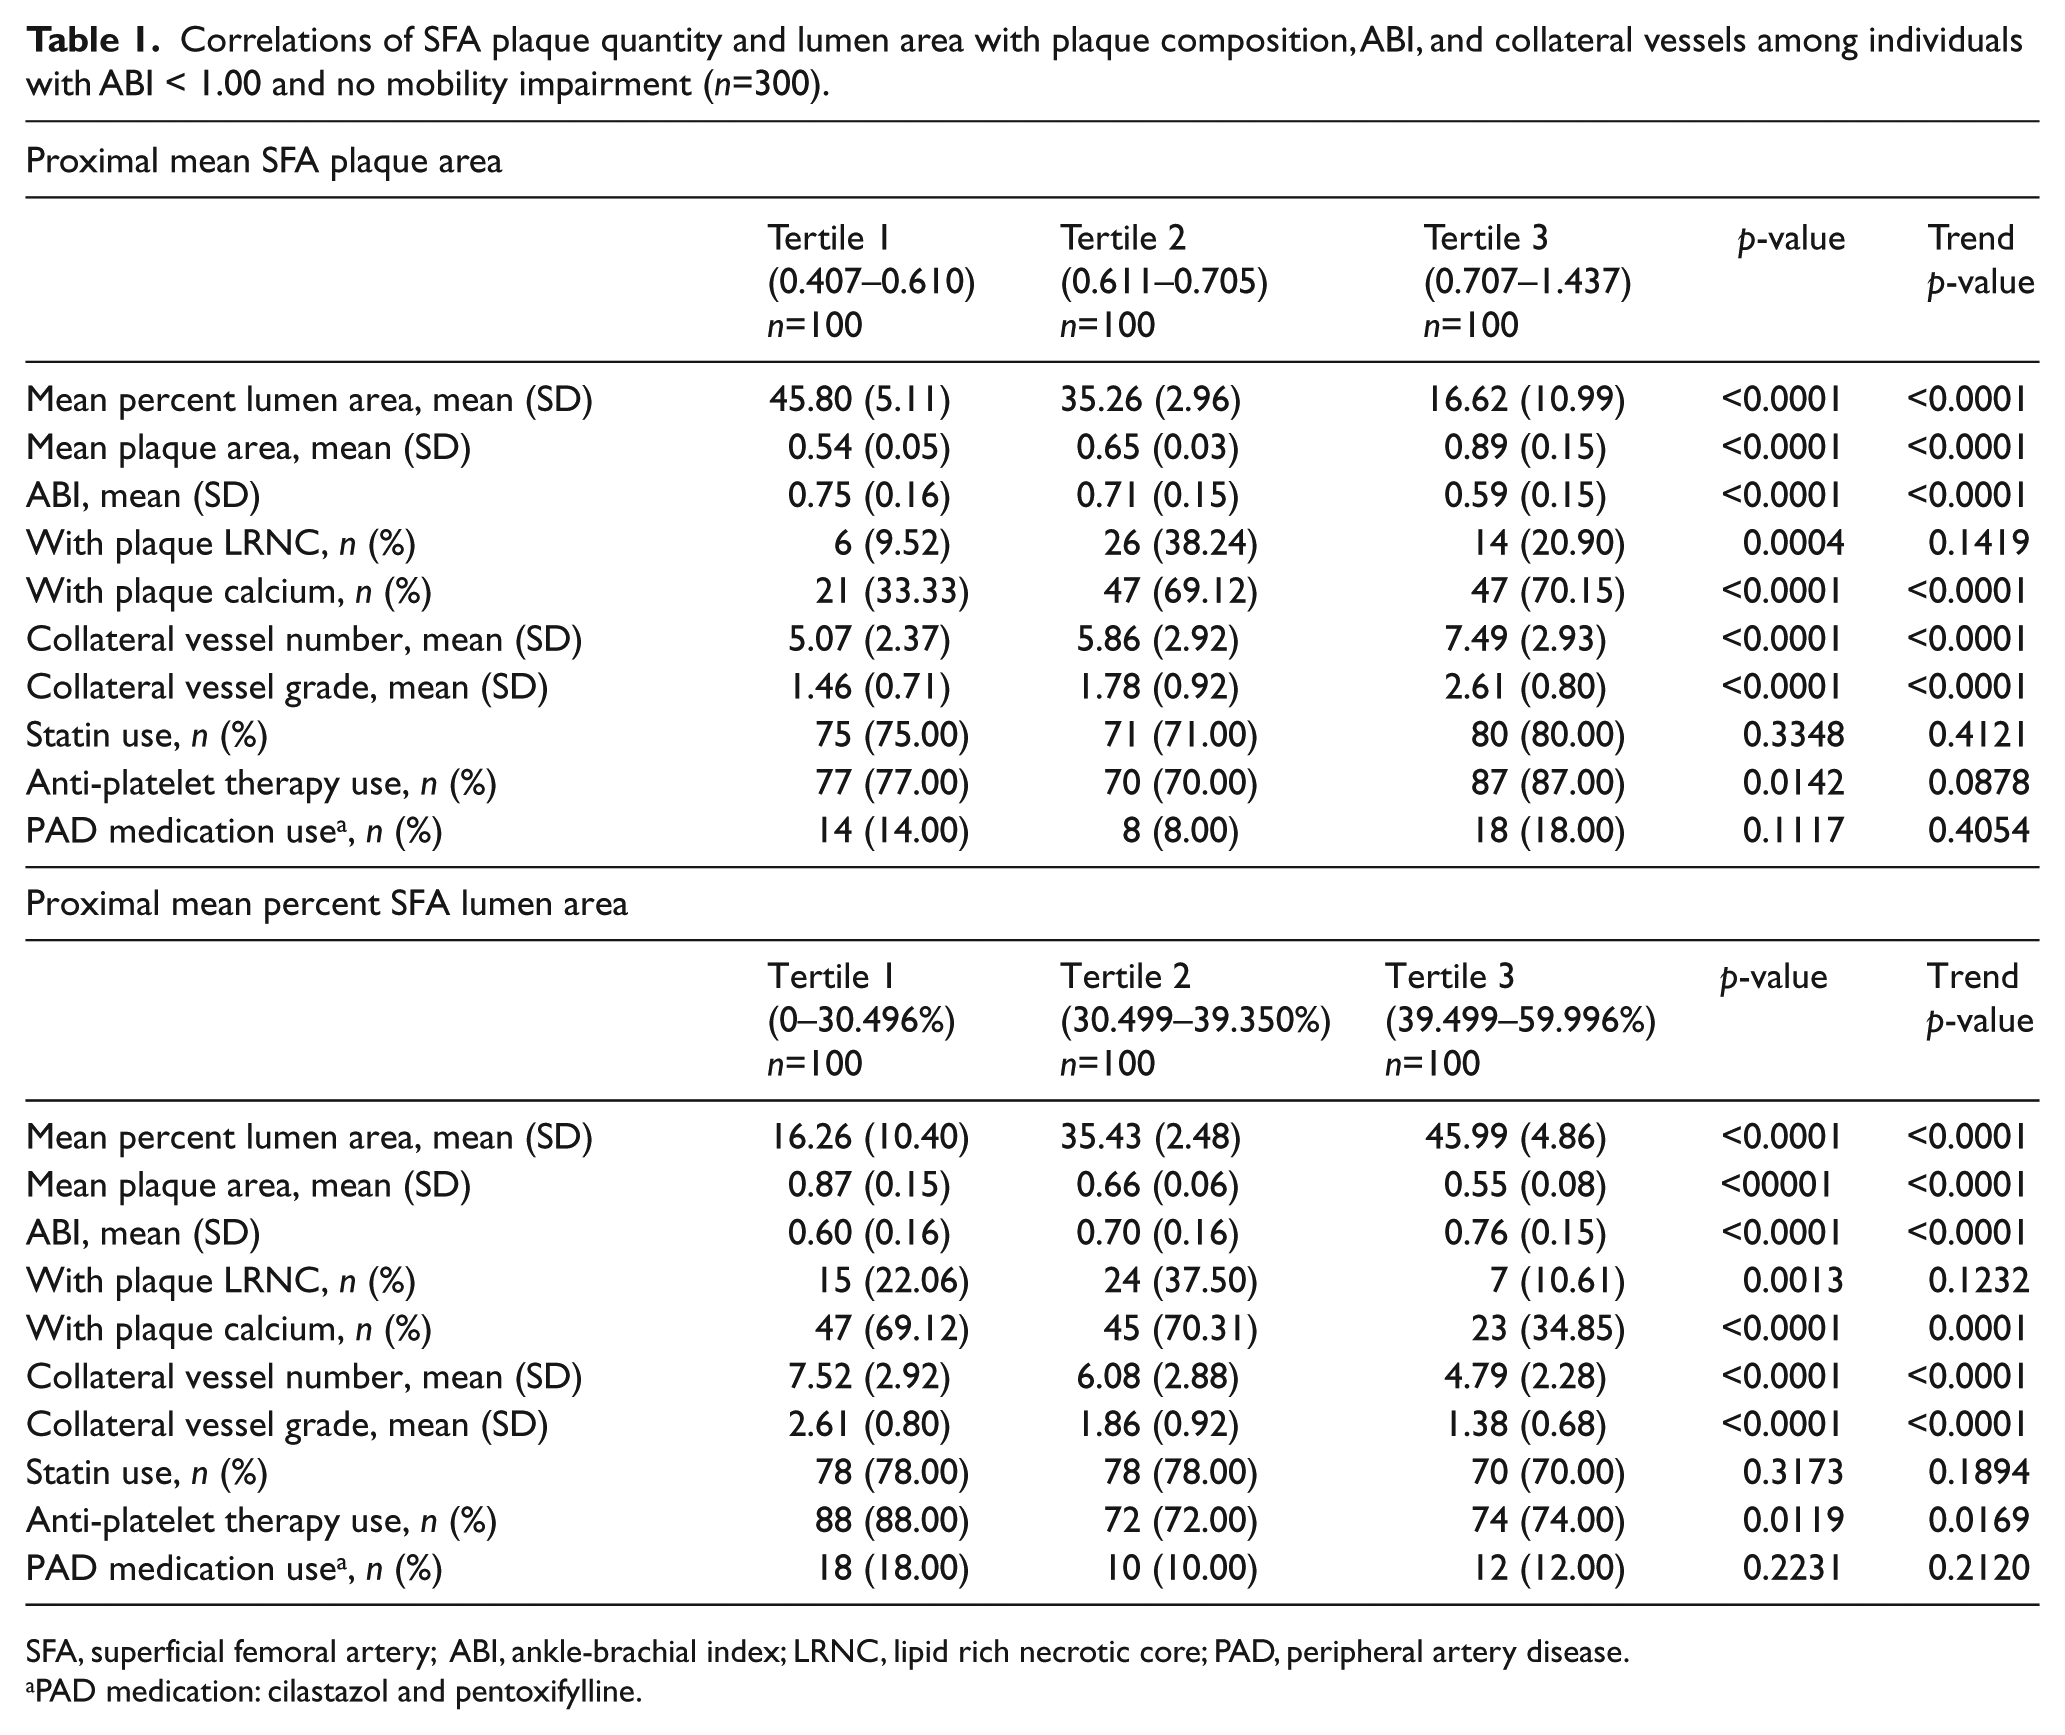
SFA, superficial femoral artery; ABI, ankle-brachial index; LRNC, lipid rich necrotic core; PAD, peripheral artery disease.
PAD medication: cilastazol and pentoxifylline.
Characteristics of PAD participants with versus without mobility loss during follow-up (n=308 a ).
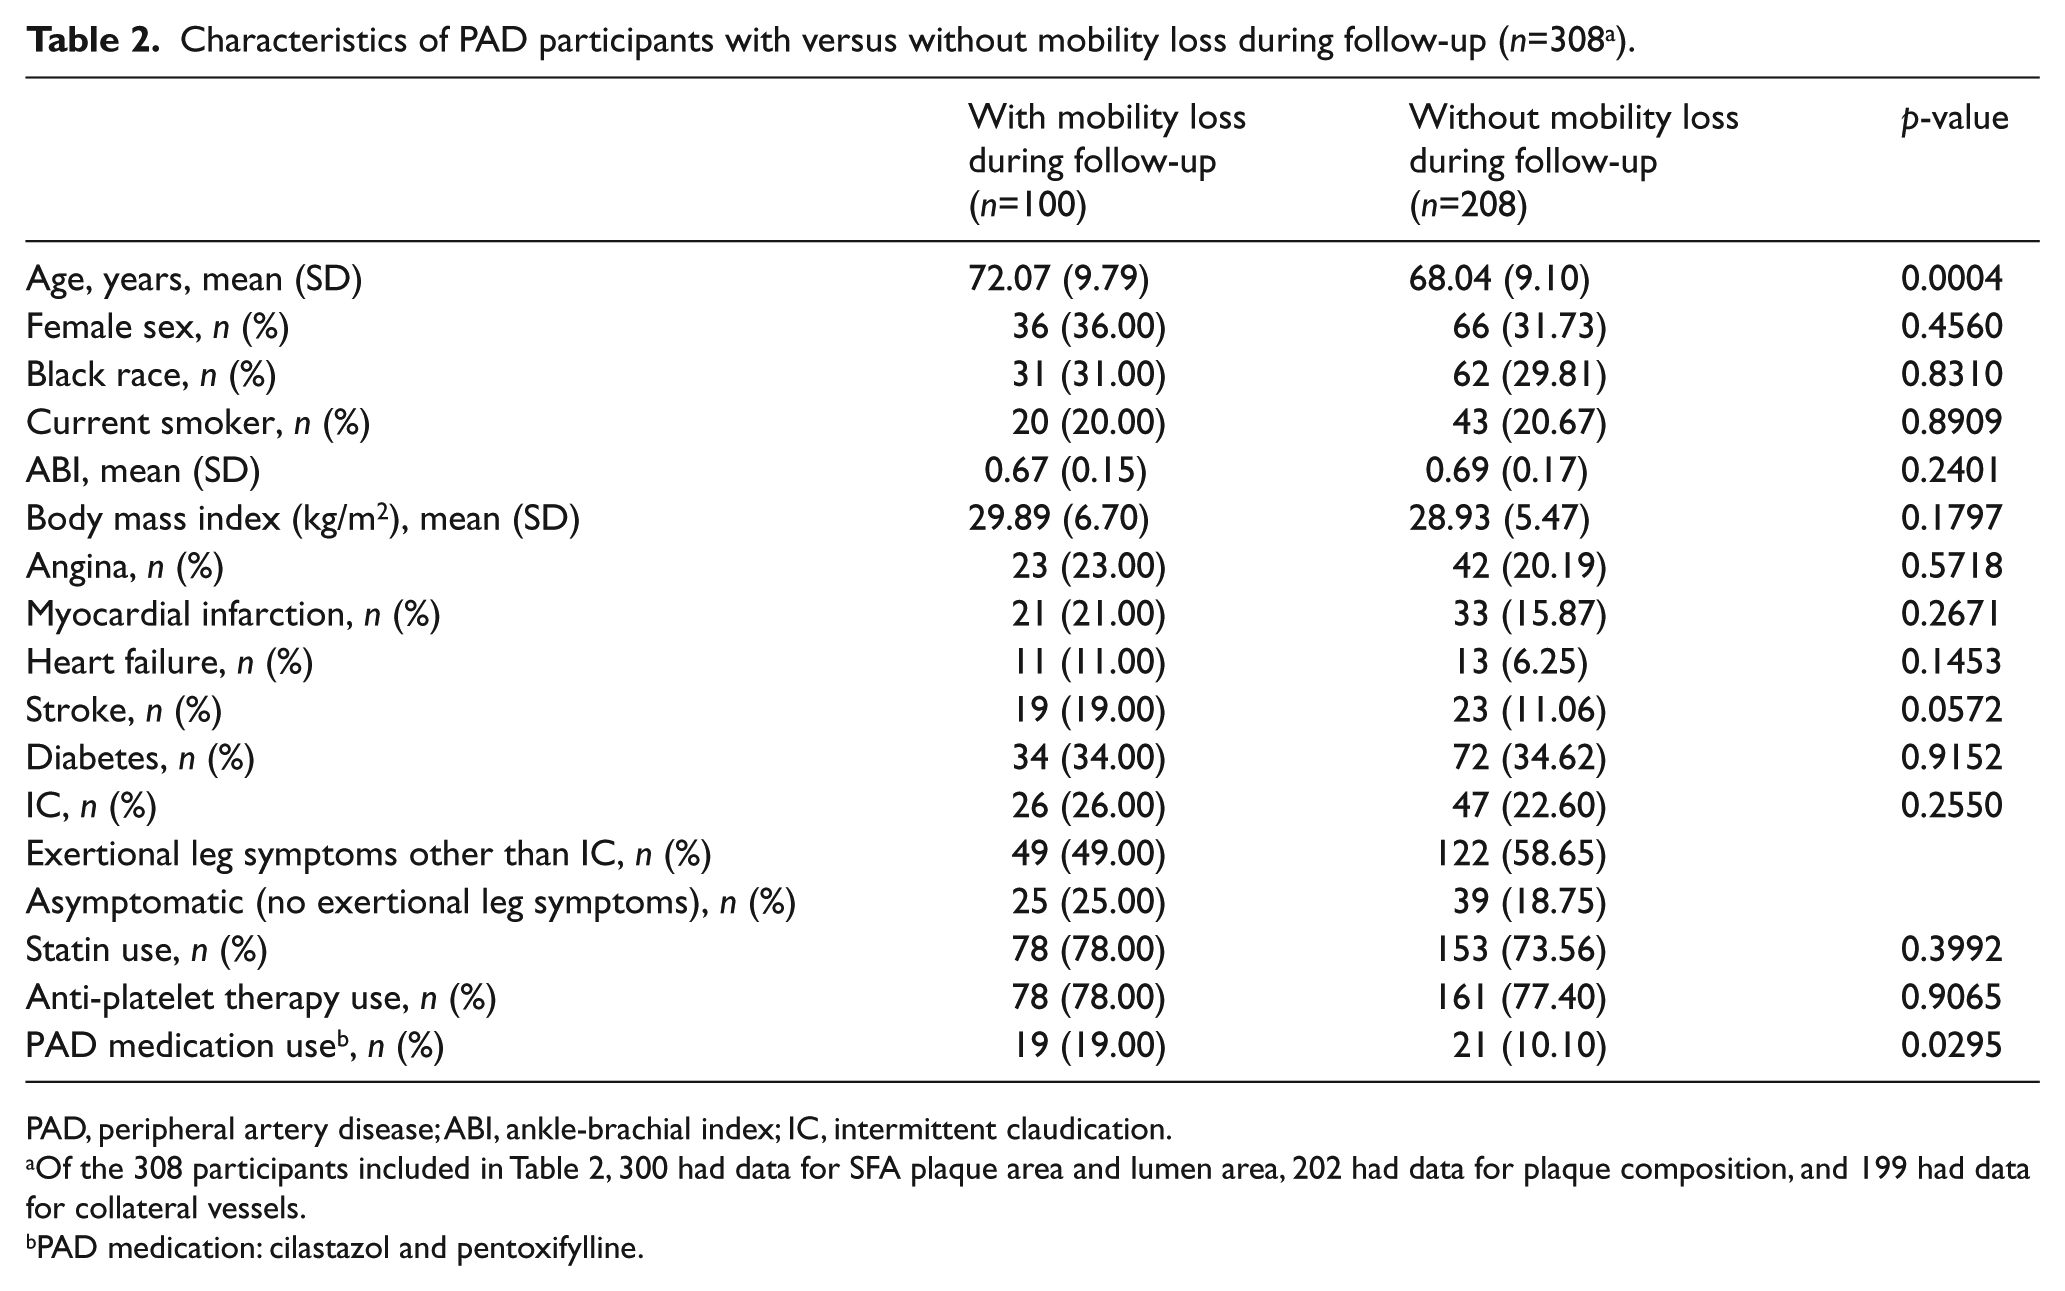
PAD, peripheral artery disease; ABI, ankle-brachial index; IC, intermittent claudication.
Of the 308 participants included in Table 2, 300 had data for SFA plaque area and lumen area, 202 had data for plaque composition, and 199 had data for collateral vessels.
PAD medication: cilastazol and pentoxifylline.
Mobility loss rates were 45/100 (45%), 29/100 (29%), and 23/100 (23%) among PAD participants in the highest (worst), middle, and lowest (best) tertiles for mean plaque area, respectively (log-rank p=0.004, Figure 2). Adjusting for age, sex, race, smoking, log height, log weight, leg symptoms, and comorbidities, PAD participants in the highest (worst) tertile for mean plaque area had a higher rate of mobility loss compared to the lowest (best) tertile for mean plaque area (hazard ratio (HR) = 2.18, 95% confidence interval (CI) = 1.26–3.78, p=0.006). This association was not substantially attenuated after additional adjustment for physical activity and ABI (HR=2.08, 95% CI=1.14–3.79, p=0.018). Findings were not substantially changed when the ABI was calculated using the highest pressures in each leg and arm to calculate the ABI or when participants without exertional leg symptoms were excluded from analyses (data not shown). However, in the latter analyses, associations of plaque area with mobility loss were no longer statistically significant after adjustment for the ABI (HR=1.73, 95% CI=0.86–3.48, p=0.126).
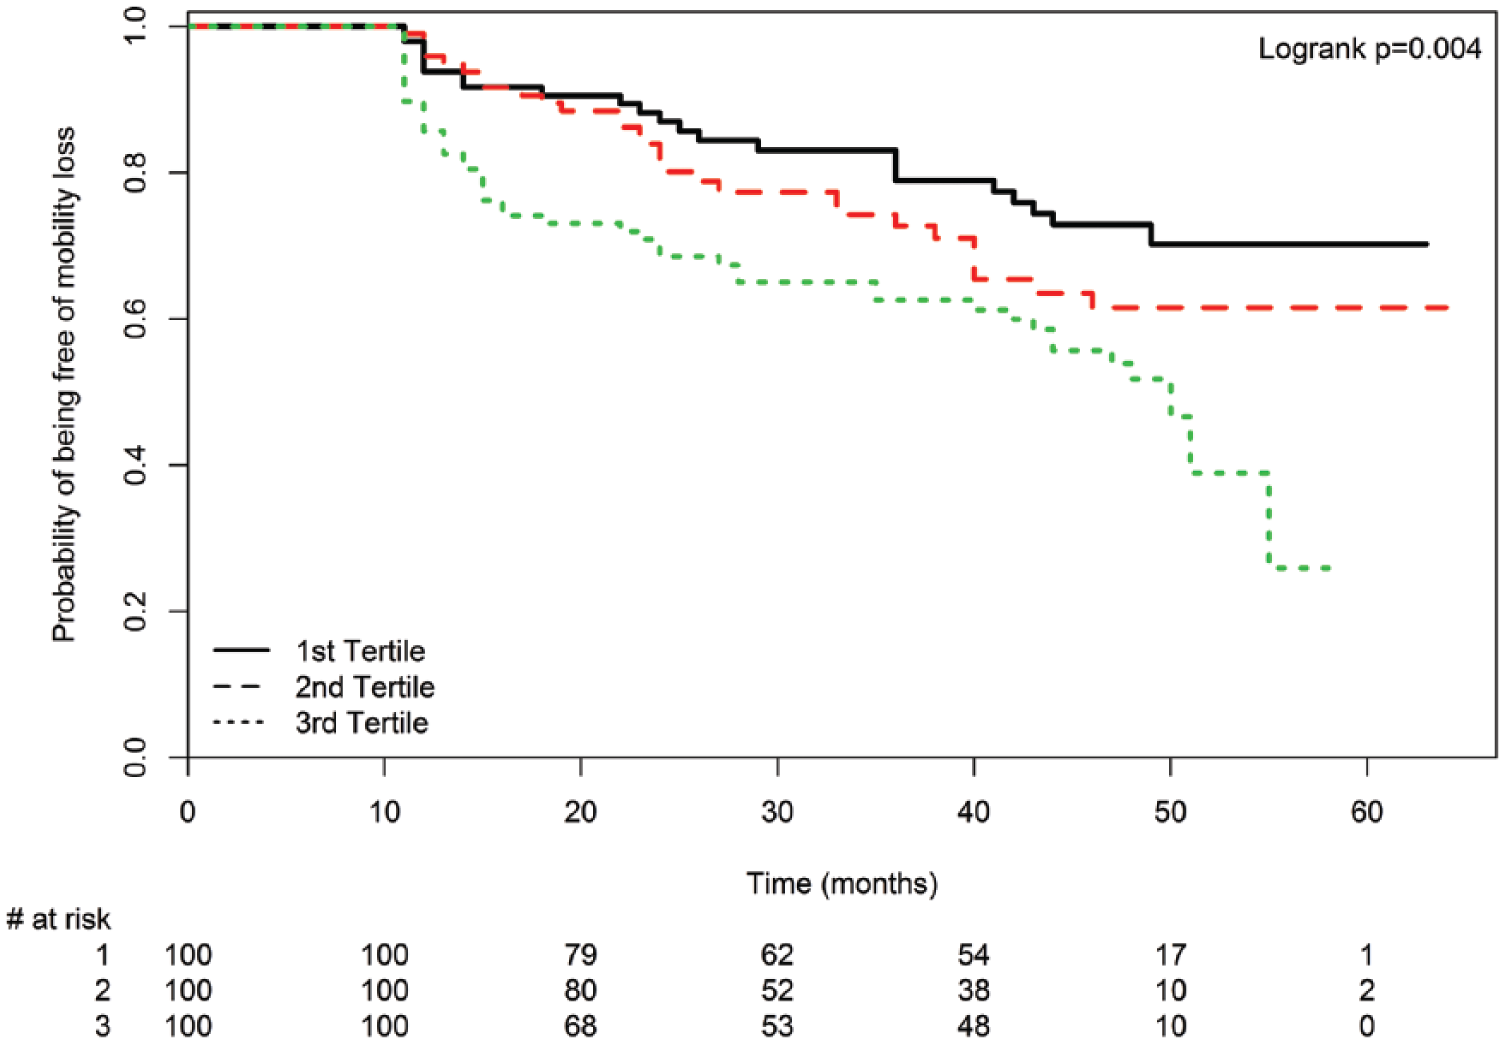
Mean plaque area tertiles and mobility loss among peripheral artery disease participants (n=300). Mobility loss is defined as becoming unable to walk one-quarter of a mile or walk up and down stairs without assistance during follow-up.
Mobility loss rates were 46/100 (46%), 29/100 (29%), and 22/100 (22%) among PAD participants in the smallest (worst), middle, and largest (best) tertiles for mean lumen area at baseline, respectively (log-rank p=0.001, Figure 3). Adjusting for age, sex, race, smoking, log height, log weight, leg symptoms, and comorbidities, PAD participants in the smallest mean lumen area tertile had greater mobility loss than those in the largest mean lumen area tertile (HR=2.29, 95% CI=1.32–3.98, p=0.003). This association was not substantially attenuated after additional adjustment for the ABI and physical activity (HR=2.18, 95% CI=1.20–3.96, p=0.011). Findings were not substantially changed when the ABI was calculated using the highest pressure in each leg to calculate the ABI (data not shown). When participants without exertional leg symptoms were excluded, the associations between the highest versus lowest lumen area tertile and mobility loss were no longer statistically significant, adjusting for age, sex, race, smoking, log height, log weight, leg symptoms, and comorbidities (HR=1.74, 95% CI=0.91–3.32, p=0.093).
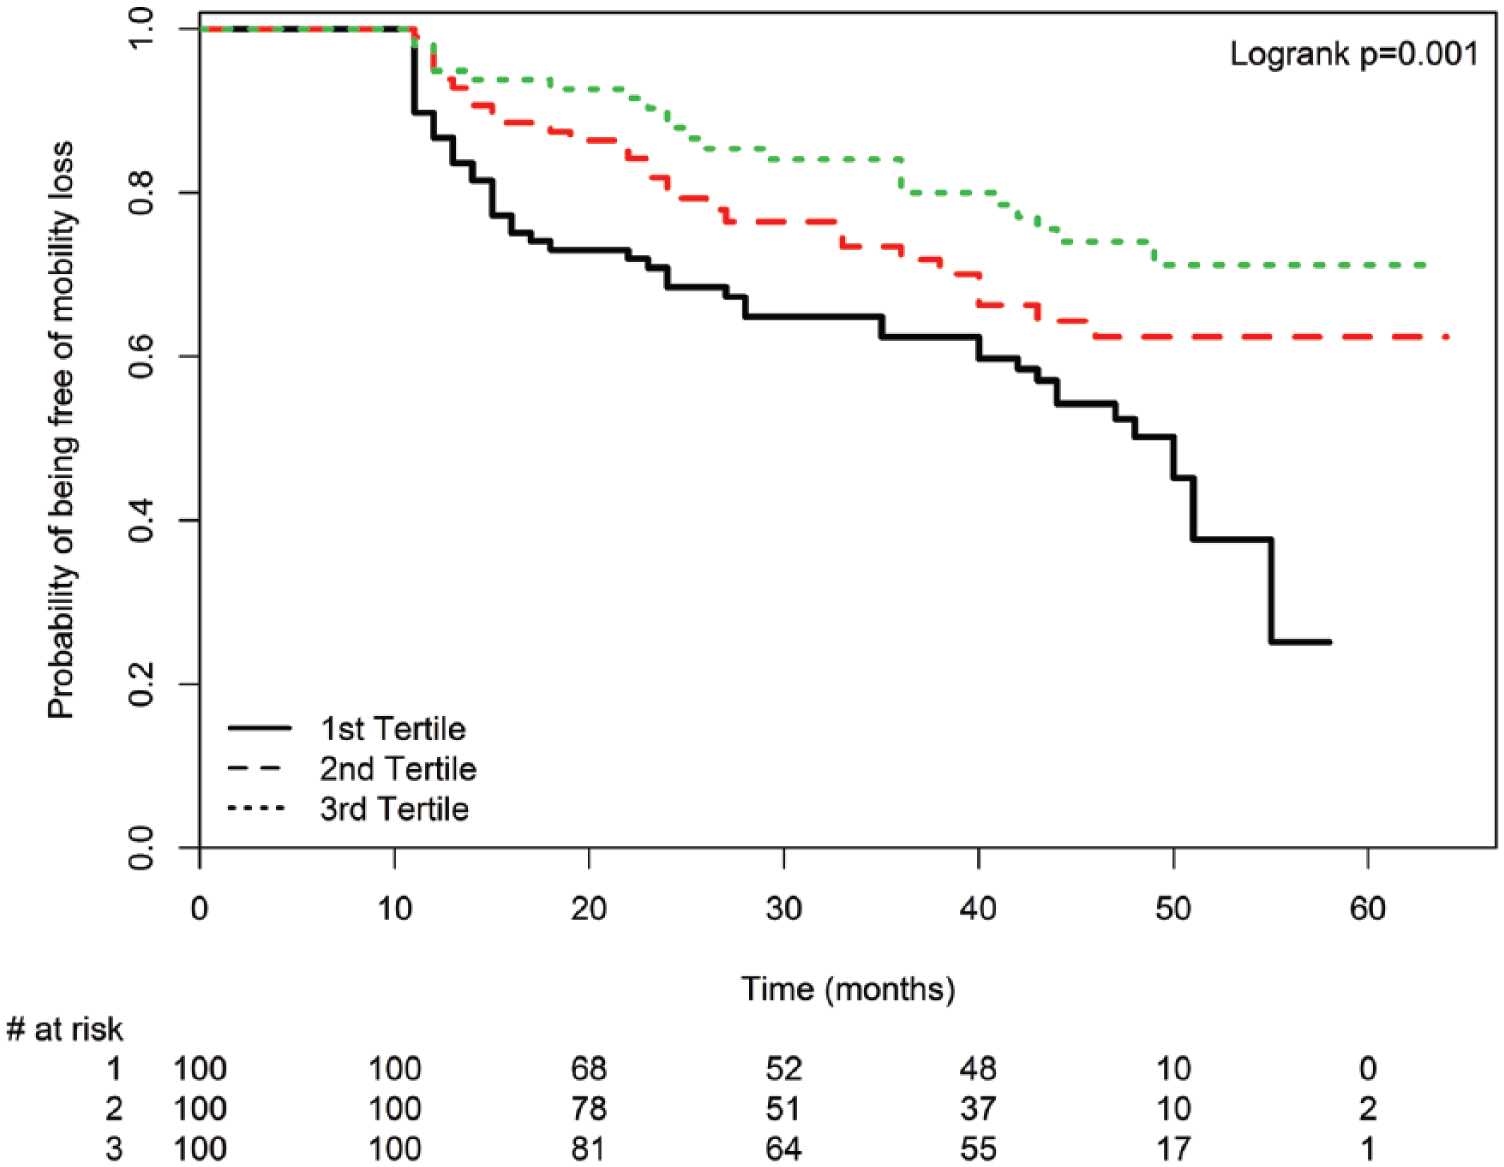
Mean lumen area tertiles and mobility loss among peripheral artery disease participants (n=300). Mobility loss is defined as becoming unable to walk one-quarter of a mile or walk up and down stairs without assistance during follow-up.
There was no difference in mobility loss rates according to the presence versus absence of LRNC in the SFA (13/46 (28.3%) versus 53/156 (34.0%), log-rank p=0.617). In fully adjusted analyses, the presence of LRNC in the SFA was not associated with greater mobility loss compared to the absence of LRNC (HR=0.71, 95% CI=0.36–1.41, p=0.323). There was no difference in mobility loss rates according to presence versus absence of SFA calcium (39/115 (33.9%) versus 27/87 (31.0%), log-rank p=0.428). In fully adjusted analyses, the presence of calcium in the SFA was not associated with greater mobility loss (HR=1.12, 95% CI=0.64–1.94, p=0.699).
There were no associations of category indicating the number of collateral vessels with rates of mobility loss in unadjusted analyses (0–3 collateral vessels: 10/34 (29.4%); 4–7 collateral vessels: 30/103 (29.1%); and ≥ 8 collateral vessels: 23/62 (37.1%); log-rank p=0.303). There were no associations of collateral grade with mobility loss in unadjusted analyses (< 5 small collateral vessels: 23/77 (29.9%); > 5 small but no large collateral vessels: 10/36 (27.8%); one or more large collateral vessels with ≤ 5 collateral vessels: 2/14 (14.3%); one or more large collateral vessels with > 5 collateral vessels: 27/71 (38.0%); log-rank p=0.147). These results did not meaningfully change when analyses were limited to participants with classical symptoms of intermittent claudication (data not shown).
Discussion
Results reported here demonstrate that greater plaque quantity and smaller lumen area in the proximal SFA were associated with higher rates of mobility loss among people with ABI < 1.00. In contrast, the presence of LRNC or calcium in plaque and the number and size of collateral vessels were not associated with mobility loss. The results were not meaningfully changed when analyses were repeated using an ABI < 0.90 as the threshold for inclusion or when analyses were repeated using the highest pressure of the dorsalis pedis and posterior tibial arteries to calculate the ABI.
In the coronary arteries, atherosclerotic plaque with a LRNC and thin fibrous cap has been associated with an increased risk of plaque rupture and thrombus formation, resulting in an acute coronary event or progression of coronary artery atherosclerosis. 12 However, recent prospective studies suggest that atherosclerotic plaque burden rather than LRNC may be more closely associated with acute coronary events.9–11 Results reported here demonstrate that atherosclerotic disease burden in the SFA, rather than plaque composition, is associated with mobility loss among people with PAD.
We recently reported that LRNC in the proximal SFA, but not SFA plaque quantity and lumen area, was associated with greater ABI decline and higher rates of lower extremity revascularization, amputation, and critical limb ischemia. 19 There are several potential explanations for these discordant results. First, analyses reported here were limited to PAD participants without mobility impairment at baseline. It is conceivable that plaque quantity and lumen area are prognostic determinants only for individuals without disability, such as those without mobility impairment at baseline. Second, mobility loss may occur due to progression of heart failure or coronary artery disease, which may be reflected by more severe atherosclerosis in the proximal SFA. In contrast, proximal SFA LRNC may be more specific for progression of lower extremity (i.e. local) atherosclerosis, reflected by ABI decline, critical limb ischemia, and amputation or lower extremity revascularization. 19
Results reported here are consistent with previously reported associations of lower ABI values with higher rates of mobility loss. 39 Together these results demonstrate that greater severity of lower extremity atherosclerosis is associated independently with higher rates of mobility loss. McDermott et al. also reported previously that the SFA plaque and lumen area are each highly correlated with the ABI. 40 Plaque imaging with MRI provides direct visualization of plaque quantity and lumen area in the SFA, while the ABI is a ratio of lower and upper extremity Doppler-recorded pressures and can be artificially increased by medial artery calcinosis. For all of these reasons, it is not surprising that additional adjustment for the ABI did not attenuate associations of MRI-measured plaque and lumen area with mobility loss.
Collateral vessels form in response to lower extremity atherosclerosis and can potentially mitigate against the adverse effects of lower extremity ischemia. However, greater numbers of collateral vessels and larger collateral size were not associated with lower rates of mobility loss. Prior studies showed that more severe PAD was associated with more and larger collateral vessels and that more severe PAD was associated with higher rates of mobility loss.20,30 It is possible that the lack of association of collateral vessel size and number with mobility loss is due to the confounding association of collateral vessel size and number with more severe PAD.20,30,40
Limitations
Our study has limitations. First, we imaged the proximal 3.0-cm segment of the SFA in the leg with the lowest ABI. The absence of LRNC or calcium from the proximal SFA may not exclude the presence of LRNC or calcium in other lower extremity arteries. Second, our findings are generalizable only to PAD participants without contraindications to MRI. Third, MRA may not be the ideal method for assessing collaterals as spatial resolution is higher with either X-ray or CT angiography.
This study was performed to identify atherosclerotic plaque components that are associated with mobility loss in participants with PAD, just as plaque quantity and plaque composition (such as LRNC) have been studied for their association with acute coronary events in people with coronary artery disease.6–14 The results contribute to the understanding of the pathophysiology of mobility loss in people with PAD but should not be interpreted to promote use of MRI to measure plaque characteristics in all patients with PAD or to promote lower extremity revascularization in patients with PAD.
Conclusion
In conclusion, among people with an ABI < 1.00, greater plaque quantity and more severe lumen narrowing in the proximal SFA are associated with higher rates of mobility loss. In contrast, LRNC in the SFA was not associated with mobility loss. Further study is needed to determine whether preventing a high burden of lower extremity atherosclerosis can prevent mobility loss in people with PAD.
Footnotes
Declaration of conflicting interests
The authors declared the following potential conflicts of interest with respect to the research, authorship, and/or publication of this article: Dr Chun Yuan received grant funding from Philips Healthcare and is a member of Philips Radiology Medical Advisory Network (RMAN). Dr Kramer and Dr McDermott receive research funding from Novartis. Mr Hippe receives grant funding from Philips Healthcare and GE Healthcare.
Funding
The authors disclosed receipt of the following financial support for the research, authorship, and/or publication of this article: funded by the National Heart, Lung, and Blood Institute, R01-HL109244 and R01-HL083064.