
Abstract
The objective of the study was to assess the temporal changes in vascular function during pregnancy in healthy women and in those with gestational diabetes mellitus (GDM). Assessment of vascular function was done at three time points, 11–13+6 weeks+days, 20–22+6 weeks+days and 30–32+6 weeks+days, by flow-mediated dilatation (FMD), augmentation index (AIx) and carotid-radial pulse wave velocity (crPWV) in women (n=100) with singleton pregnancies. Out of the 100 women, 20 developed GDM, who were compared with 20 healthy, age-matched pregnant women in a nested case-control design. Women with GDM had lower FMD% in the third compared to the first trimester (6.77 (4.36–9.96) vs 9.76 (6.66–16.61)%; p = 0.026); however, FMD% was similar on inter-group comparison between GDM and healthy pregnancies. AIx was significantly higher in GDM than healthy pregnancies at both first (15.35 ± 10.57 vs 6.45 ± 9.81%; p<0.05) and second trimesters (15.00 ± 8.44 vs 2.50 ± 9.01%; p<0.05). A higher AIx in early pregnancy differentiates women with GDM from those with healthy pregnancies.
Keywords
Introduction
Gestational diabetes mellitus (GDM) is a common complication affecting 7–14% of all pregnancies. 1 There is an increasing trend in the prevalence of GDM which results in adverse pregnancy outcomes and detrimental clinical consequences in both the mother2,3 (pregnancy related complications like preeclampsia and abnormal placentation) and fetus (stillbirth, birth injuries and birth defects). 4 GDM also predisposes women to an increased risk of developing type 2 diabetes, ranging from 2.6% to 70% in studies that assessed the incidence after 6 weeks to 28 years post-partum.5,6 Additionally, women with GDM have other associated cardiovascular abnormalities such as obesity, hypertension, dyslipidemia, and subclinical atherosclerosis.7–9
Diabetes is known to be associated with impaired endothelial function, reduced arterial compliance and increased inflammatory markers, which can subsequently result in altered vascular function and structure.10,11 The higher cardiovascular risk could be attributed to the underlying vascular dysfunction. Two possible mechanisms could affect vascular function in women with GDM – pregnancy associated physiological changes in vascular properties and diabetes induced pathophysiological changes. Assessment of vascular function including quantification of both functional and structural changes in a longitudinal pattern in pregnant women is essential to understand the causal pathophysiology of vascular dysfunction in women who develop GDM. Flow-mediated dilatation (FMD) is a reliable non-invasive measure of conduit artery endothelial function while pulse wave velocity (PWV) measures the structural attributes of vessel wall (arterial stiffness) and augmentation index (AIx) assesses the nature of the reflected pressure waveform, which is also influenced by the functionally mediated changes in vascular tone. 12
A handful of studies are available on arterial stiffness and endothelial functions in GDM at a single time point measurement.13–18 A cross-sectional study has assessed FMD along with arterial stiffness during the post-partum period 19 in women with a history of GDM and normoglycemic pregnancy and found that FMD, along with brachial and carotid artery distensibility, were lower in women with a previous history of GDM, while no difference was observed in PWV.
These studies are insufficient to decipher the dynamic changes in the comprehensive vascular profile of GDM in a temporal pattern in the three trimesters of pregnancy. Additionally, to understand the pathophysiological basis of vascular dysfunction in GDM, it will be beneficial to investigate the association of endothelial function with arterial stiffness parameters sequentially during pregnancy.
To the best of our knowledge, this is the first study that has serially assessed endothelial function and arterial stiffness together in the three trimesters of pregnancy in women with GDM and compared them with normal pregnancies.
Methods
This was a prospective observational study of pregnant women enrolled from the Obstetrics Antenatal Clinic of the All India Institute of Medical Sciences, New Delhi, India, between January 2014 and June 2015. A vascular function assessment was performed in the Department of Physiology, All India Institute of Medical Sciences, New Delhi. The institutional review board approved the study (date of approval, 9 December 2013; reference number, – IESC/T/429/1.11.2013) and written informed consent was obtained from all participants. Women with multiple pregnancies, anemia, pre-existing diabetes mellitus, chronic hypertension, heart disease, renal disease and autoimmune disorders were excluded from the study. The vascular function parameters were measured for 100 women with a singleton pregnancy between the ages of 18 and 35 years at three time points (i.e. Visit 1, first trimester (11–13+6 weeks+days); Visit 2, second trimester (20–22+6 weeks+days); and Visit 3, third trimester (30–32+6 weeks+days)) by a single examiner who was blinded to the clinical diagnosis. Amongst the 100 women, 8 developed gestational hypertension, 3 developed preeclampsia, 20 developed GDM and 14 women were lost to follow-up. The 20 women who developed GDM and 20 healthy age-matched pregnant women were used for further analysis in a nested case–control study design. Vascular function was assessed using FMD, AIx and carotid-radial PWV (crPWV).
All the procedures followed were in accordance with institutional guidelines. A detailed history was taken along with the clinical examination. All routine antenatal investigations were performed as per our hospital policies.
In all women, fasting and post-prandial plasma glucose measurements were performed at the first antenatal visit followed by a 75-g glucose tolerance test (GTT) in the second trimester (24–28 weeks) of pregnancy. A diagnosis of GDM was made on the basis of a fasting plasma glucose ⩾5.1 mmol/L (92 mg/dL) and/or after a 75-g oral glucose load, a 1-hour plasma glucose ⩾10.0 mmol/L (180 mg/dL) and/or a 2-hour plasma glucose ⩾8.5 mmol/L (153 mg/dL). 20 After diagnosis, out of 20 women with GDM, 18 women were advised on diet while two women were given insulin therapy.
Vascular function assessment
All measurements were performed in a temperature-controlled room with participants in a supine position after a 20-minute rest period.
I: Flow-mediated dilatation (FMD)
B-mode images of the right brachial artery were recorded with a 12-MHz linear array probe using vascular ultrasound (Vivid e; GE Healthcare, Germany) to measure the brachial artery diameter. After collection of baseline data, a reactive hyperemia protocol was followed of occluding the right brachial artery blood flow by rapid inflation of a blood pressure cuff placed below the right elbow to 50 mmHg above systolic blood pressure. Occlusion was maintained for a period of 5 minutes. After release of the occlusion by rapid deflation of the blood pressure cuff, the brachial artery diameter was measured for 3 minutes at every 10-second interval. All images were recorded and stored for offline analysis. The brachial artery diameter was measured using electronic calipers from tunica media to media interface during offline analysis.
Based on the electrocardiogram (ECG) cycle, an average of three arterial diameters at the peak of the R-wave of the ECG (end diastole) was analyzed per image. The flow-mediated dilatation % (FMD%) was calculated as the percentage increase in diameter from baseline according to the equation 21 FMD% = DP – DB / DB, where DP is the maximal post-occlusion diameter and DB is the baseline diameter. Intra-observer and inter-observer variability for FMD were 7.5% and 11.9%, respectively.
II: Arterial stiffness
Brachial artery blood pressure (BP) was recorded twice consecutively, with a 1-minute interval between each measurement, using a sphygmomanometer. The average of the two measurements of BP was used as brachial systolic BP and diastolic BP. Arterial stiffness was quantified by AIx and crPWV using applanation tonometry (SphygmoCor® device; AtCor Medical, Australia). The distance from the sternal notch to the best felt carotid pulse site and the distance from the sternal notch to the best felt radial pulse site were measured. To assess arterial stiffness, the tonometer probe was placed at the carotid and radial artery sequentially to obtain an accurate and reproducible pressure signal with simultaneous recording of ECG to allow for an R-gated reference point for timing of the pressure signal. An automated, foot-to-foot method was used to calculate the time elapsed between onset of the pulse wave at carotid and radial sites by the software. The value was averaged over 10 cardiac cycles to obtain the mean time difference. The PWV was reported as the distance between the two arterial sites upon the mean time taken to cover this distance.
The AIx was obtained by placing the tonometer over the radial artery and using the SphygmoCor®Vx pulse wave analysis system (AtCor Medical). The central pulse wave profile was estimated using the validated generalized transfer function algorithm in order to determine the augmentation pressure and the heart rate adjusted augmentation index (AIx@75).22,23
Statistical analysis
Data of normally distributed parameters are expressed as the mean ± SD, and non-parametric data are expressed as median with interquartile range. Maternal characteristics between the GDM and normal pregnancy groups were compared using the Mann–Whitney test. Analysis of changes in the three visits in the same group were done using repeated measures ANOVA (analysis of variance) with Tukey’s multiple comparison test for parametric data and the Kruskal–Wallis test with Dunn’s post hoc test for non-parametric data. Analysis of differences in the GDM and normal pregnancy groups with three visits was done using two-way ANOVA with the Bonferroni post hoc test. All statistical analyses were done using GraphPad Prism version 5.00 for Windows (GraphPad Software, San Diego, CA, USA).
Results
The GDM and normal pregnancy groups both comprised of non-smokers with no significant difference in age, body mass index (BMI) (Table 1) and blood pressure (BP) (Table 2) between the two groups.
Maternal characteristics in the gestational diabetes mellitus (GDM) and normal pregnancy (NP) groups.
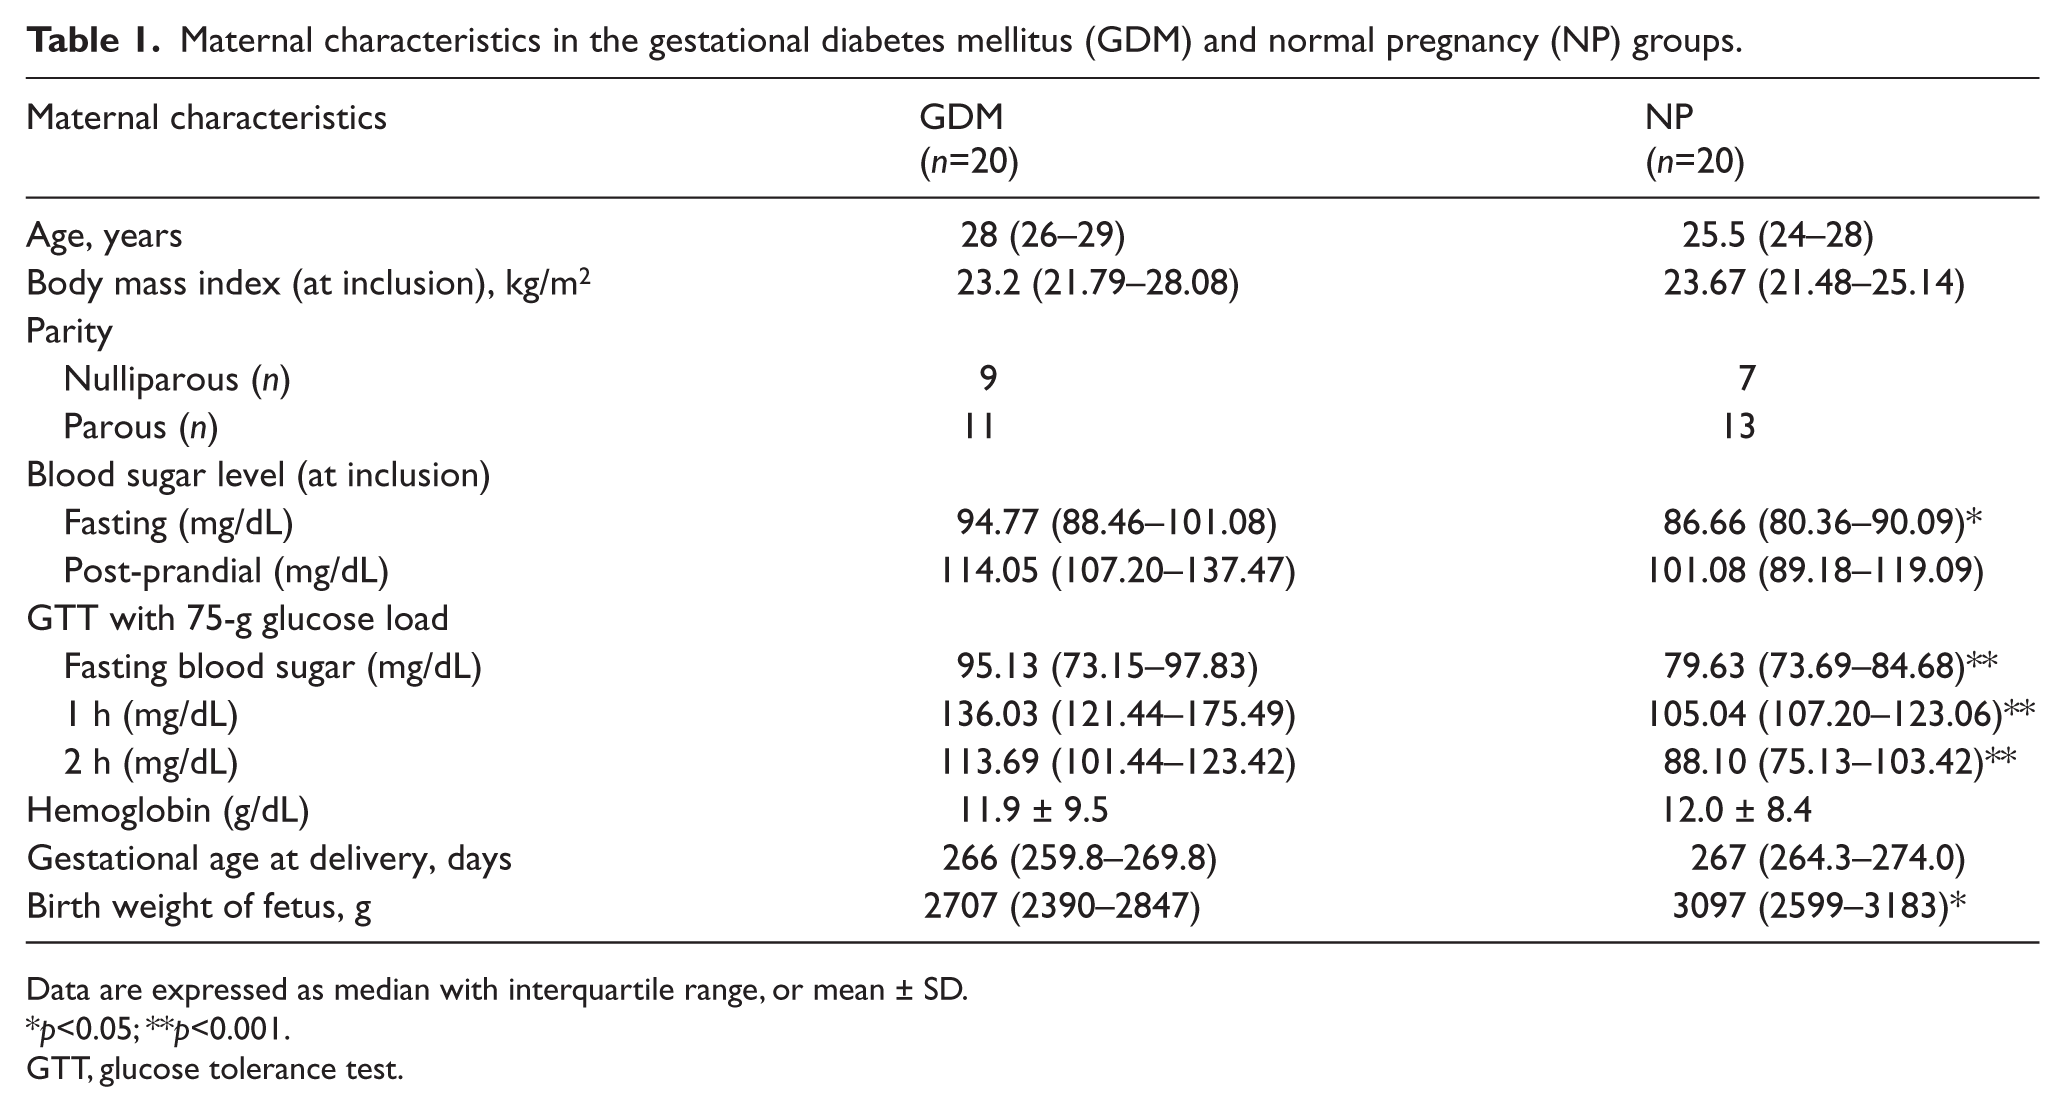
Data are expressed as median with interquartile range, or mean ± SD.
p<0.05; **p<0.001.
GTT, glucose tolerance test.
Vascular function indices in gestational diabetes mellitus (GDM) and normal pregnancy (NP) groups in three trimesters of pregnancy
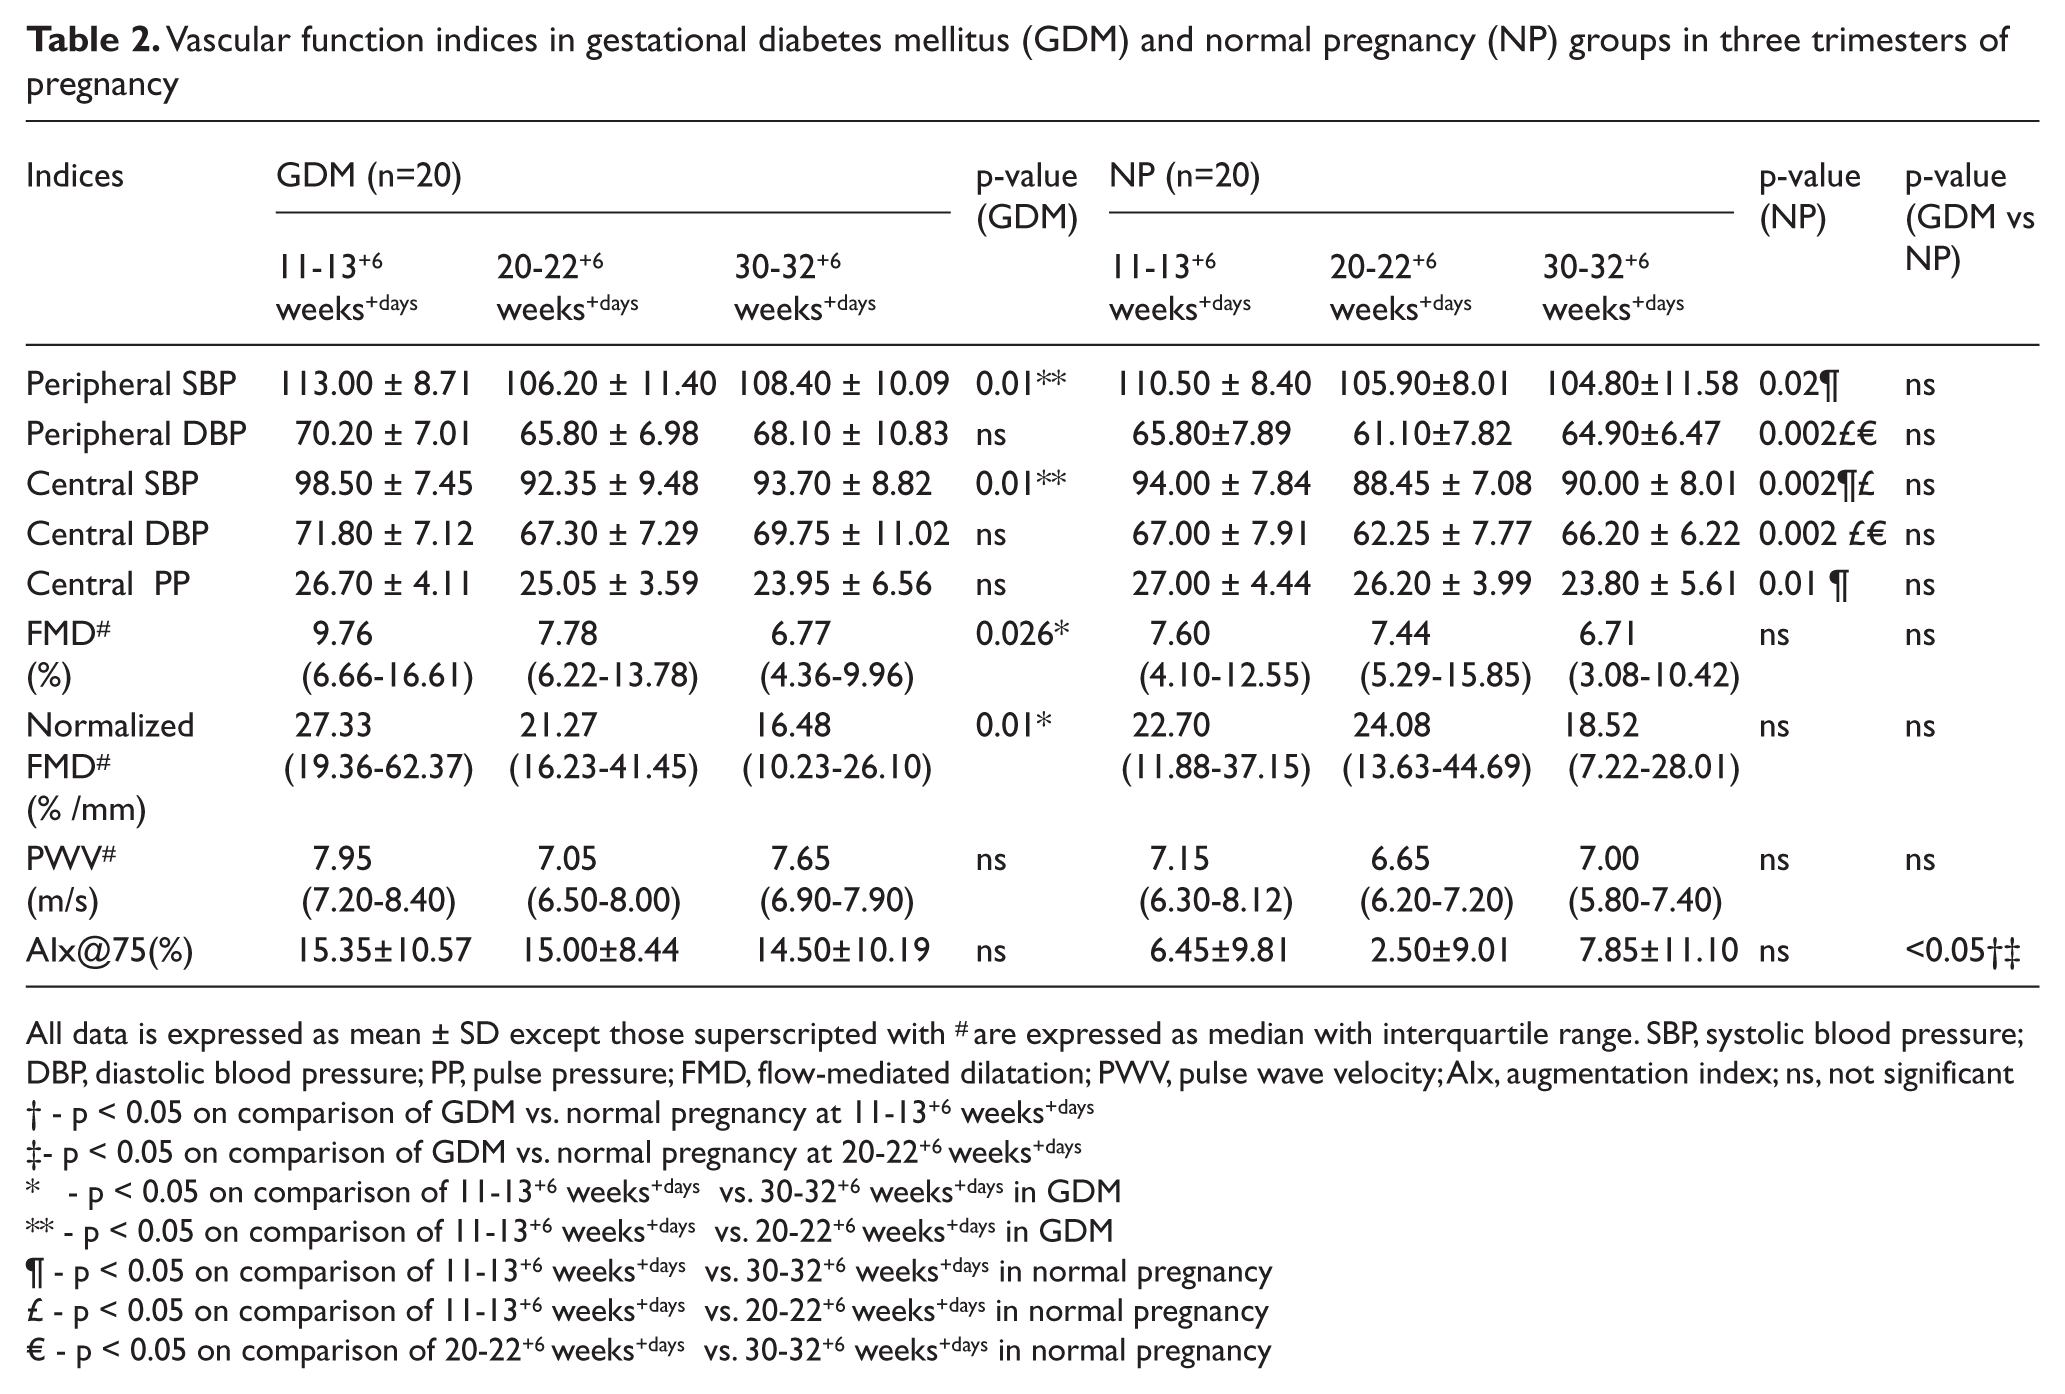
All data is expressed as mean ± SD except those superscripted with # are expressed as median with interquartile range. SBP, systolic blood pressure; DBP, diastolic blood pressure; PP, pulse pressure; FMD, flow-mediated dilatation; PWV, pulse wave velocity; AIx, augmentation index; ns, not significant
- p < 0.05 on comparison of GDM vs. normal pregnancy at 11-13+6 weeks+days
- p < 0.05 on comparison of GDM vs. normal pregnancy at 20-22+6 weeks+days
- p < 0.05 on comparison of 11-13+6 weeks+days vs. 30-32+6 weeks+days in GDM
- p < 0.05 on comparison of 11-13+6 weeks+days vs. 20-22+6 weeks+days in GDM
- p < 0.05 on comparison of 11-13+6 weeks+days vs. 30-32+6 weeks+days in normal pregnancy
- p < 0.05 on comparison of 11-13+6 weeks+days vs. 20-22+6 weeks+days in normal pregnancy
- p < 0.05 on comparison of 20-22+6 weeks+days vs. 30-32+6 weeks+days in normal pregnancy
I: Flow-mediated dilatation (FMD)
FMD was comparable in both groups across the three trimesters of pregnancy. Within the GDM group, the FMD was significantly lower in the third trimester compared to the first trimester (6.77 (4.36–9.96)% vs 9.76 (6.66–16.61)%, p = 0.026), while no significant difference was observed in FMD in the normal pregnancy group (Figure 1, Table 2). As the amplitude of FMD is dependent on the baseline artery diameter, the FMD% was normalized to the baseline artery diameter at each visit. The results were found to be similar after normalization (Table 2).
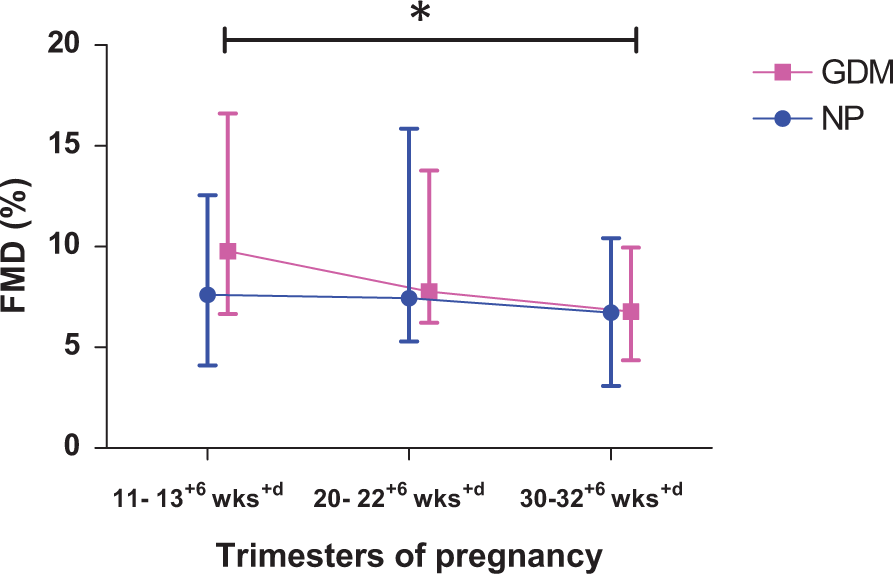
Sequential changes in flow-mediated dilatation (FMD) in gestational diabetes mellitus (GDM) and normal pregnancy (NP) over three trimesters. *p<0.05 in 11–13+6 weeks versus 30–32+6 weeks in the GDM group. (wks, weeks of gestation.)
II: Arterial stiffness
The AIx was higher in the GDM group compared to the normal pregnancy group in the first (15.35 ± 10.57 vs 6.45 ± 9.81, p < 0.05) and second trimesters of pregnancy (15.00 ± 8.44 vs 2.5 ± 9.01, p < 0.05). Within each group, the AIx did not show any significant change over the course of pregnancy when compared to the first trimester (Figure 2, Table 2).
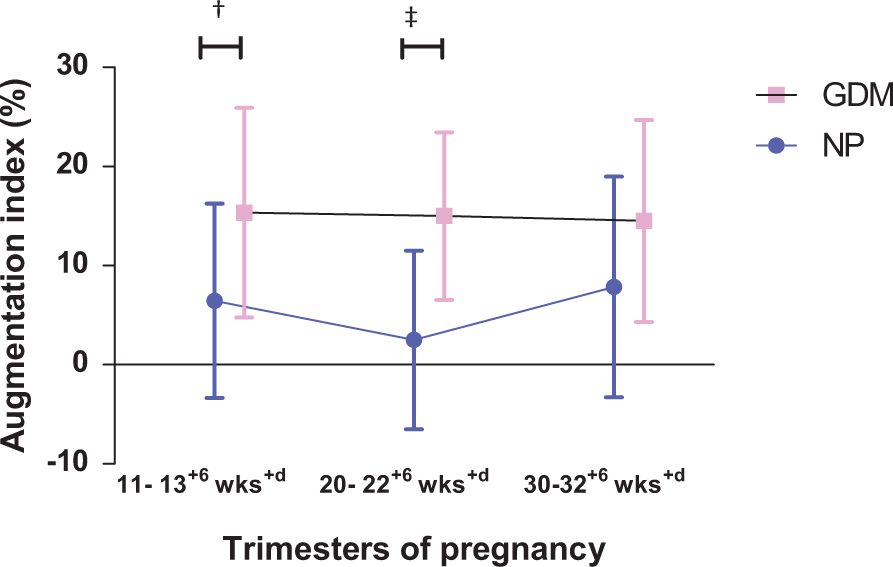
Sequential changes in the augmentation index in gestational diabetes mellitus (GDM) and normal pregnancy (NP) over three trimesters. †p<0.05 in GDM versus NP groups at 11–13+6 weeks; ‡p<0.05 in GDM versus NP groups at 20–22+6 weeks. (wks, weeks of gestation.)
Since the AIx was higher in the GDM group in the first trimester itself, the utility of the AIx in the first trimester to predict the development of GDM was tested by performing a quartile analysis on the pooled AIx data of both GDM and normal pregnancy women. We divided the groups into quartiles on the basis of their AIx and interestingly found that eight out of 10 pregnant women in the highest quartile developed GDM in the second trimester, while only two out of 10 in the lowest quartile developed GDM.
However, in terms of PWV, there was no significant difference throughout the pregnancy in both the groups (Figure 3 and Table 2, Supplementary Table).
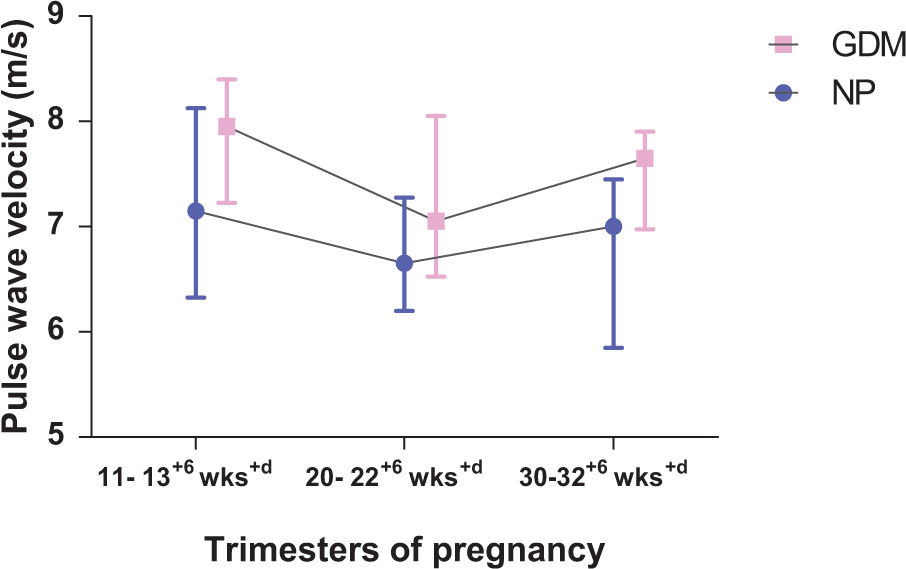
Sequential changes in pulse wave velocity in gestational diabetes mellitus (GDM) and normal pregnancy (NP) over three trimesters. (wks, weeks of gestation.)
We also correlated the fasting glucose levels in the first trimester with the parameters of vascular function (PWV, AIx and FMD) and found a significant correlation between fasting glucose levels (measured at baseline 11–13+6 weeks) and PWV in the first trimester (r = 0.33, p-value = 0.03) and with the AIx in the second trimester (r = 0.34, p-value = 0.03). There was no correlation between fasting glucose and FMD at any time point during the course of pregnancy. In addition, both fasting and post-prandial glucose levels (at 1 hour and 2 hours) during the glucose tolerance test correlated significantly with the PWV and AIx.
Discussion
The present study focuses on both the structural as well as the functional changes in the vasculature in women with GDM over the course of their pregnancy and compares them with healthy pregnant women. GDM is associated with two co-existing challenges – pregnancy associated dynamic changes in vasculature and diabetes mediated alterations in endothelial function and vascular properties. The major finding of this study is a higher AIx in women with GDM during early pregnancy compared to controls. AIx is a composite marker, which depends on PWV and wave reflection properties, which are determined by the vascular tone of small muscular arteries and resistance vessels and is thus better representative of the systemic arterial stiffness. On the other hand, PWV is a measure of regional structural stiffness and did not change throughout the pregnancy in both the groups.
In the present study, AIx was higher in the GDM group in the first and second trimesters but did not achieve statistical significance in the third trimester. Similar results have been reported by Salmi et al. in a study conducted during the third trimester, who found AIx to be comparable between GDM and controls. 16 Savvidou et al. reported a higher AIx in the third trimester in women with GDM. 15 However, the BMI of the GDM group is significantly higher than controls in their study, which could independently influence the AIx, while in the current study the two groups have similar BMIs. Khalil et al. used the multiple of median (MoM) to assess differences between groups and did not find AIx to be higher in GDM in the first trimester. 13
The structural component of arterial stiffness, as measured by the crPWV, was similar throughout pregnancy in GDM. This is supported by existing evidence, which suggests that hyperglycemia and other metabolic alterations in gestational diabetes might be insufficient in duration to lead to structural changes as measured by PWV. 14 Similar results have been reported for carotid-femoral PWV by Salmi et al. 16 and Bulzico et al., 14 where the two groups were matched for BP and BMI, and also by Savvidou et al. 15 when the carotid-femoral PWV was adjusted for BMI. However, Khalil et al. 13 reported a higher PWV in GDM, though the difference may be purely statistical as the difference between the mean values of GDM versus controls reported by them is less than the difference between the medians observed in the present study. Also, Khalil et al. used MoM, not absolute values, to compare the two groups.
On comparing the fasting glucose levels at baseline (11–13+6 weeks), we observed significantly higher levels in patients who subsequently developed GDM compared to healthy pregnant women. In addition, while the PWV was not different between the two groups, the fasting glucose correlated significantly with the PWV in the first trimester and with the AIx in the second trimester of pregnancy. It has been shown in previous studies that fasting glucose levels are a significant predictor of GDM. 24 Additionally, the fasting and post-prandial glucose in the second trimester also correlated with the PWV and AIx. It has been suggested that the production of advanced glycation products due to hyperglycemia can accumulate in the vascular matrix, resulting in decreased elasticity and narrowing of the vessel lumen. 25 The current results show an association of vascular function with fasting glucose levels in early pregnancy (before the onset of clinical GDM) that substantiates this hypothesis which proposes the effect of hyperglycemia on vessel properties.
In the existing literature, most authors have studied vascular functions in the post-partum period of GDM where most of the pregnancy related physiologic alterations tend to revert back to normal and may not reflect the vascular functions in the antenatal period. Although some longitudinal reports are available in normal pregnancy26,27 where vascular functions have been assessed at different time points during the course of pregnancy, we could not find any study that assessed vascular indices in GDM temporally. The current study is able to identify the temporal changes in the vascular parameters and shows that the functional component of arterial stiffness is higher in GDM from the first trimester itself, which did not show any dip in the second trimester in contrast with that observed in healthy pregnant women.
The second finding of this study was a decrease in endothelial function in the third trimester in women with GDM as assessed by a fall in FMD%. A falling trend could also be seen in healthy pregnant women but it was not statistically significant. In addition, endothelial function is similar on intergroup comparison across the three trimesters of pregnancy. While there is a significant decrease in FMD from the first to third trimesters in GDM, the result does not seem to be of clinical significance as the value of FMD in the first trimester in GDM is slightly (though not significantly) higher than in a healthy pregnancy and hence the fall in FMD may be attributed to intra-observer variability. There is a trend of a decrease in endothelial function in both GDM and healthy pregnancies, which could be because of an enhanced inflammatory response during the course of pregnancy. 28
There are two cross-sectional studies which measured FMD at the third trimester. Paradisi et al. reported that FMD% was significantly reduced in women with GDM (mean FMD of 4.1% in GDM vs 10.9% in controls). 17 The reported lower FMD value by Paradisi et al. could be because of a higher BMI (29.7 vs 26.6 kg/m2) and mean BP (87.0 vs 79.7 mmHg) in the GDM group compared to controls. A higher BMI and mean BP can independently influence endothelial function. 29 As mentioned earlier, in the present study the BMI and BP were both similar in the GDM women and healthy controls. De Resende Guimarães et al. have reported a slightly higher range of FMD% in GDM in the third trimester compared to the present study (9.18% vs 6.7%), but the study also reports very high values in the controls (17.55% vs 6.7%). 18 Variation in baseline artery diameter can also influence FMD, as smaller vessels are reported to dilate more than the larger vessels. 30 In the present study, the results of endothelial function were similar even after normalizing for baseline artery diameter.
It has been found that administration of vasoconstrictor (angiotensin II) and vasodilator (nitroglycerine) drugs markedly increase and decrease AIx, respectively, with no observable difference in PWV. 31 Thus, a higher AIx in GDM, in the absence of changes in PWV, could be due to changes in wave reflection properties of peripheral vasculature. Renin-angiotensin-aldosterone system (RAAS) activation is a normal physiological adaptation in pregnancy which helps in the expansion of extracellular fluid volume.32,33 Vasoconstrictor influence of higher circulating levels of angiotensin II consequent to RAAS activation is counter-balanced by numerous vasodilators, including Angiotensin 1–7 (Ang 1–7) peptide, prostaglandins (PGE2, PGI2), nitric oxide, the kallikrein-kinin system and vascular endothelial growth factor. 34 It has been observed in other studies that the ratio of Ang 1–7/Ang II is significantly lower in GDM, resulting in a vasodilator to vasoconstrictor imbalance.32,33
We propose that the higher AIx in pregnant women who subsequently developed GDM might be related to an altered ratio of circulating vasodilator to vasoconstrictor agents. This may result in a higher AIx purely due to an increase in vascular tone and subsequent changes in wave reflection properties with no underlying endothelial dysfunction. Further, deterioration in FMD in the third trimester in GDM may suggest development of subsequent endothelial dysfunction in conduit vessels by the third trimester consequent to the ongoing pathophysiological insults in GDM. Also, there was no correlation between arterial stiffness and endothelial function, suggesting that the increased arterial stiffness was not due to alterations in the endothelial function in GDM. The lack of correlation between FMD and AIx across the three trimesters further corroborates the possibility that the changes in AIx and FMD might be attributable to two different mechanisms.
Limitations
The limitations of the present study include the small sample size, which might fail to detect minimal changes in vascular function parameters. Carotid-femoral PWV was not assessed in the present study, which is a gold standard method to assess arterial stiffness. The lack of additional biochemical markers of vascular dysfunction limits the study making an evidence-based statement on the probable mechanism of vascular dysfunction in GDM.
Conclusion
We conclude that AIx is higher in GDM compared to normal pregnant women in early pregnancy. However, the probable utility of AIx as a predictor of GDM in early pregnancy needs further evaluation in larger cohorts. The proposed model of vasodilator to vasoconstrictor imbalance as a putative mechanism of vascular dysfunction in GDM if supported by future biochemical studies will have profound implications on the diagnosis and management of GDM.
Footnotes
Acknowledgements
The authors would like to thank Dr Manpreet Kaur (Pool Officer, Department of Physiology, All India Institute of Medical Sciences, New Delhi) and Dr Dinu S Chandran (Assistant Professor, Department of Physiology, All India Institute of Medical Sciences, New Delhi) for their intellectual input and help in drafting the manuscript.
Declaration of conflicting interests
The authors declared no potential conflicts of interest with respect to the research, authorship, and/or publication of this article.
Funding
The authors received no financial support for the research, authorship, and/or publication of this article.
References
Supplementary Material
Please find the following supplemental material available below.
For Open Access articles published under a Creative Commons License, all supplemental material carries the same license as the article it is associated with.
For non-Open Access articles published, all supplemental material carries a non-exclusive license, and permission requests for re-use of supplemental material or any part of supplemental material shall be sent directly to the copyright owner as specified in the copyright notice associated with the article.