
Abstract
Although poor walking is the most common symptom of peripheral artery disease (PAD), reported results are inconsistent when comparing gait parameters between PAD patients and healthy controls. This inconsistency may be due to frailty, which is highly prevalent among PAD patients. To address this hypothesis, 41 participants, 17 PAD (74±8 years) and 24 aged-matched controls (76±7 years), were recruited. Gait was objectively assessed using validated wearable sensors. Analysis of covariate (ANCOVA) tests were used to compare gait parameters between PAD and non-PAD groups, considering age, gender, and body mass index as covariates, while stratified based on frailty status. According to the Fried frailty index, 47% of PAD and 50% of control participants were non-frail and the rest were classified as pre-frail. Within non-frail participants, gait speed, body sway during walking, stride length, gait cycle time, double-support, knee range of motion, speed variability, mid-swing speed, and gait initiation were significantly different between PAD and control groups (effect size d = 0.75±0.43). In the pre-frail group, however, most of the gait differences were diminished except for gait initiation and gait variability. Results suggest that gait initiation is the most sensitive parameter for detecting gait impairment in PAD participants when compared to controls, regardless of frailty status (d = 1.30–1.41; p<0.050). The observed interaction effect between frailty and PAD on gait parameters confirms the importance of assessing functionality in addition to age to provide more consistency in detecting motor performance impairments due to PAD.
Introduction
Peripheral artery disease (PAD), which is characterized by atherosclerotic occlusive disease of the lower extremities, globally affects more than 202 million people. 1 The most common symptoms of PAD are intermittent claudication,2,3 atypical leg symptoms, 2 as well as poor walking performance and endurance.4,5 Several researchers have studied alterations in gait behaviors due to PAD; however, reported results are inconsistent when comparing spatio-temporal gait parameters between PAD patients and healthy controls. 6 For instance, some studies reported similar gait speed and stride length between PAD and healthy individuals,4,7 while others reported up to 20% faster walking and larger stride length in the healthy sample compared to PAD patients. 8 One reason for these controversial results may be related to concomitant disability, comorbidity, and other adverse health conditions on the motor performance and lower extremity dysfunction.9,10 Therefore, in motor performance evaluations, specifically gait assessment among elderly individuals with PAD, high variability due to heterogeneity of health status should be addressed through risk stratification using validated criteria such as the frailty index. Frailty is characterized by low physiologic reserves, increased vulnerability to acute stressors, and overall functional decline. 11 As a reflection of biologic, rather than chronologic age, frailty is predictive of adverse health conditions and may explain the substantial heterogeneity of health status among the older adult population.11,12
The main aim of the current study was to assess the effect of frailty status on between-group differences in gait parameters between PAD and control (without diagnosed PAD) groups. Objective validated wearable sensors were used to assess gait parameters within the clinical setting.13–18 We specifically investigated whether gait parameters that are different between non-frail PAD and control groups are also different for the pre-frail group. We focused on pre-frailty, rather than frailty, to include participants who were able to perform the gait tests. Our previous work demonstrated significant differences in gait parameters among PAD patients at different frailty stages. 19 Therefore, we hypothesized that frailty would dominate the effect of PAD for several gait parameters. As a secondary aim, we sought determination of sensitive gait parameters that can distinguish between PAD and control groups, regardless of frailty status.
Methods
Participants
Older adults with diagnosed PAD (age ⩾ 60 years) were recruited from the University of Arizona Division of Vascular and Endovascular Surgery outpatient clinic. PAD eligibility was based on clinical and hemodynamic data as specified in the 2011 ACCF/AHA criteria (Guideline Recommendations: A Report of the American College of Cardiology Foundation/American Heart Association Task Force on Practice Guidelines 20 ). All PAD participants had documented PAD based on either: (1) an abnormal ankle–brachial index (ABI) and appropriate symptoms (such as intermittent claudication, pain and numbness in lower extremities) at time of entry; or (2) a history of prior intervention for symptomatic PAD (either surgical bypass or angioplasty/stent). Same age control participants, without prior diagnosis of any vascular disease, including PAD, were recruited from the Arizona Frailty Cohort. 21 A lack of claudication and pain in the lower extremities and hips were confirmed among control participants using subjective questionnaires. Exclusion criteria for both PAD and control groups included: a serious psychiatric condition (including dementia or serious mental illness based on medical history or mini–mental state examination (MMSE) < 24); major mobility disorders (including stroke or Parkinson’s disease); recent surgery; hip or lower extremity prostheses, severe lower extremity arthritis, an active foot ulcer, or major foot deformity (e.g. Charcot neuroarthropathy or major foot amputation). Additionally, control group participants were excluded if they reported a diagnosis of diabetes. Furthermore, participants with major mobility disorders (i.e. who were unable to walk a distance of 25 steps without walking assistance) were also excluded. The ability of participants to walk a distance of 25 steps without assistance was assessed within the actual gait measurements, and those who failed to perform gait tests were excluded. The study was approved by the University of Arizona Institutional Review Board. Written informed consent, according to the principles expressed in the Declaration of Helsinki, 22 was obtained from all subjects before participation.
Frailty evaluation
In the current study, the Cardiovascular Health Study (CHS) ‘Fried’ index was used to assess frailty. 11 The Fried frailty index is the most established approach for identifying older adults as non-frail, pre-frail (intermediate frailty status) or frail. The Fried criteria include self-reported unintentional weight loss, exhaustion, and low physical activity, as well as objective measures of weakness (grip strength) and slowness (walking speed). Individuals with three or more positive Fried criteria were considered ‘frail’, those with one or two Fried criteria were considered ‘pre-frail’, and those with none of the above criteria were considered ‘non-frail’.
Ankle–brachial index (ABI) measurement and subjective questionnaires
For PAD participants, lower extremity blood flow was quantified via ABI determination in both legs using a 10 MHz handheld Doppler, as described in previous work. 23 For both PAD and control groups, subjective questionnaires included the SF-12 health survey 24 and the visual analog scale (VAS) for pain. 25 The SF-12 health survey was used to assess generic health status based on physical and mental components. Using VAS, the average pain within a prior 2 weeks was assessed. ABI was not measured in controls.
Objective gait assessment
Gait was objectively assessed using wearable motion sensors. Three-dimensional acceleration and angular velocity of shins, thighs, and the trunk were measured using five wearable sensors, each of which included a tri-axial accelerometer and a tri-axial gyroscope (LEGSys; BioSensics, Boston, MA, USA) to derive gait outcome measures using previously validated methods.14,16,26–28 Sensors were attached to the shin above the ankle, to the thigh above the knee, and to the lower back in the lumbar region. This wireless technology allows quantification of spatio-temporal gait parameters in clinical settings.
Gait was assessed on the ground with a minimum of 25 steps under two conditions, including habitual and fast walk. To minimize pain in the lower extremity, especially among PAD individuals, participants walked only 25 steps and rested at least 5 minutes between trials. The habitual walk consisted of participants walking at the normal preferred pace at which they perform everyday activities. The fast walk consisted of participants walking as fast as they comfortably could without jogging or falling. Measured gait parameters included: gait speed, stride length, gait cycle time, double support, knee angle, anterior-posterior and medial-lateral trunk sway, speed variability, and mid-swing speed during gait steady state, as well as parameters related to gait initiation including steps and distance required until steady state walking (see Table 1 and 29 for parameter definitions). 30 Additionally, height normalized gait speed, stride length, and distance to steady state walking were also reported to account for the potential effect of height on gait parameters. Two parameters of steps and distance to steady state walking were added to represent a translational period of walking initiation (acceleration phase). These two parameters account for gait behaviors before steady state walking (i.e. consistent walking phase). The initiation of steady state walking was estimated using the algorithm described in previous works.29,31 Briefly, steady state walking was the first stride of the group of six strides with a standard deviation (SD) below the median SD of all the analyzed strides ±6%, which is related to sensitivity of the wearable sensors. 31
Objective gait parameter definitions. A reference for the calculation procedure is presented for each parameter.
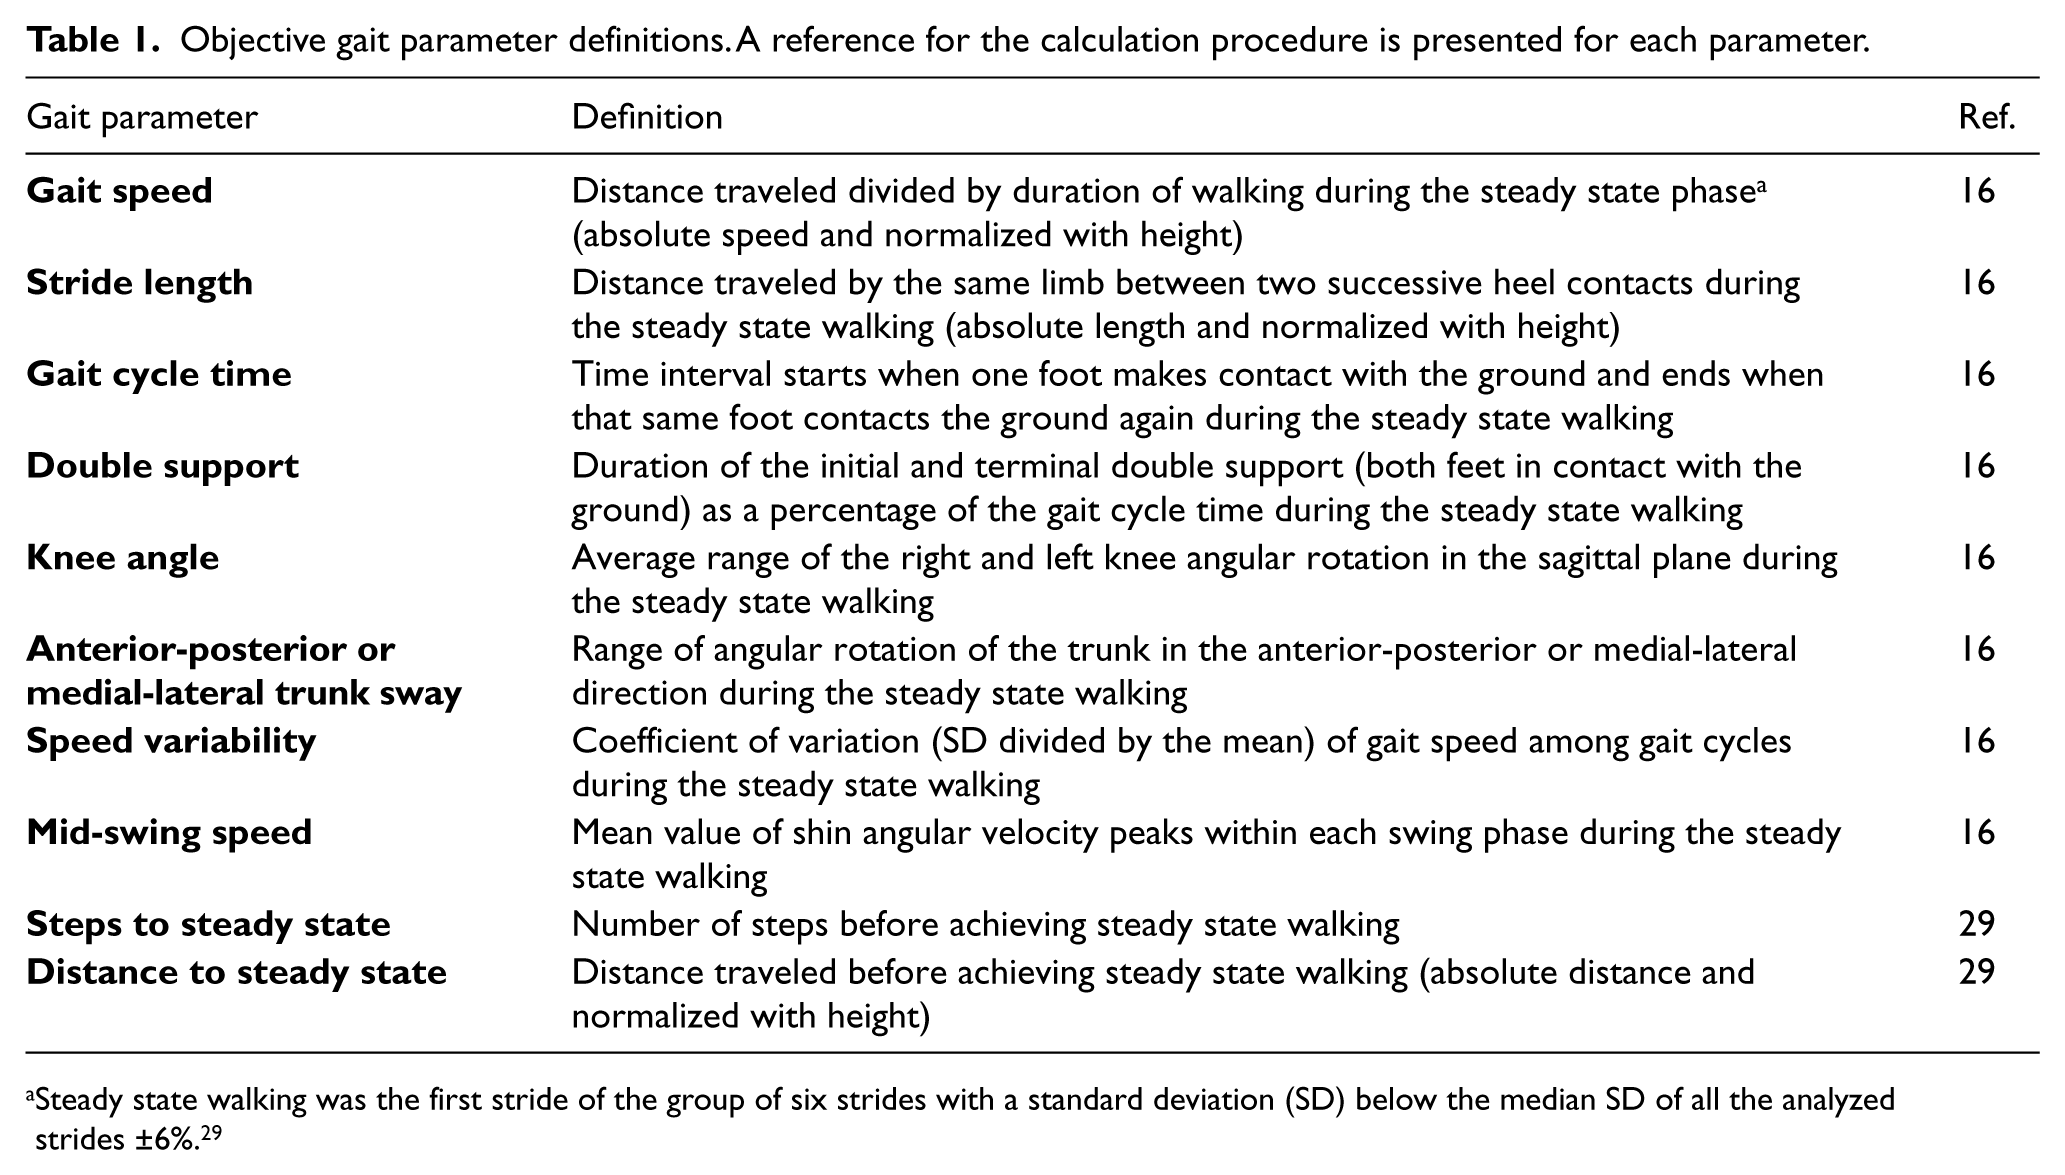
Steady state walking was the first stride of the group of six strides with a standard deviation (SD) below the median SD of all the analyzed strides ±6%. 29
Statistical analysis
Analysis of variance (ANOVA) or chi-squared (χ2) tests were performed to evaluate differences in demographic parameters between PAD and control groups. Gait parameters were compared between PAD and control groups using separate analysis of covariates (ANCOVAs); age, gender, and body mass index (BMI) were considered as covariates. Between-group comparisons were performed separately, for non-frail and pre-frail participants. To assess the effect of diabetes on gait differences between PAD and control groups, ANCOVA tests were repeated adjusting with age, gender, BMI, as well as diabetes. Also, among PAD participants, differences between gait parameters for those with and without diabetes were tested using ANOVA models, separately for each frailty group. For between-group comparison, Cohen’s effect size and 95% confidential intervals (CIs) were reported. Continuous variables were presented as mean ± standard deviation (SD). All analyses were performed using JMP (Version 11; SAS Institute Inc., Cary, NC, USA), and statistical significance was concluded when p ⩽ 0.05.
Results
Participants
Forty-one participants, 17 PAD and 24 control older adults, were recruited. All participants were living independently at the time of study entry. For PAD participants, 20 individuals were screened, among whom 17 were deemed eligible to participate; three participants were ineligible due to an inability to safely perform gait tests, and were likely frail. Of the 17 PAD participants, eight (47%) were non-frail and nine (53%) were pre-frail, based on the Fried index (Table 2). Mean (SD) age and BMI of PAD participants were 74 (8) years and 26.8 (3.5) kg/m2, respectively. Three PAD participants showed a normal ABI (0.9 to 1.3) at the time of measurement; all other PAD participants had an ABI less than 0.9 (on one side or bilaterally). Among controls, 12 (50%) were non-frail and 12 (50%) were pre-frail based on the Fried index. Mean (SD) age and BMI of controls were 76 (7) years and 27.9 (5.7) kg/m2, respectively. Socio-demographic information is reported in Table 2 for PAD and control groups within each frailty category.
Participant socio-demographic information.
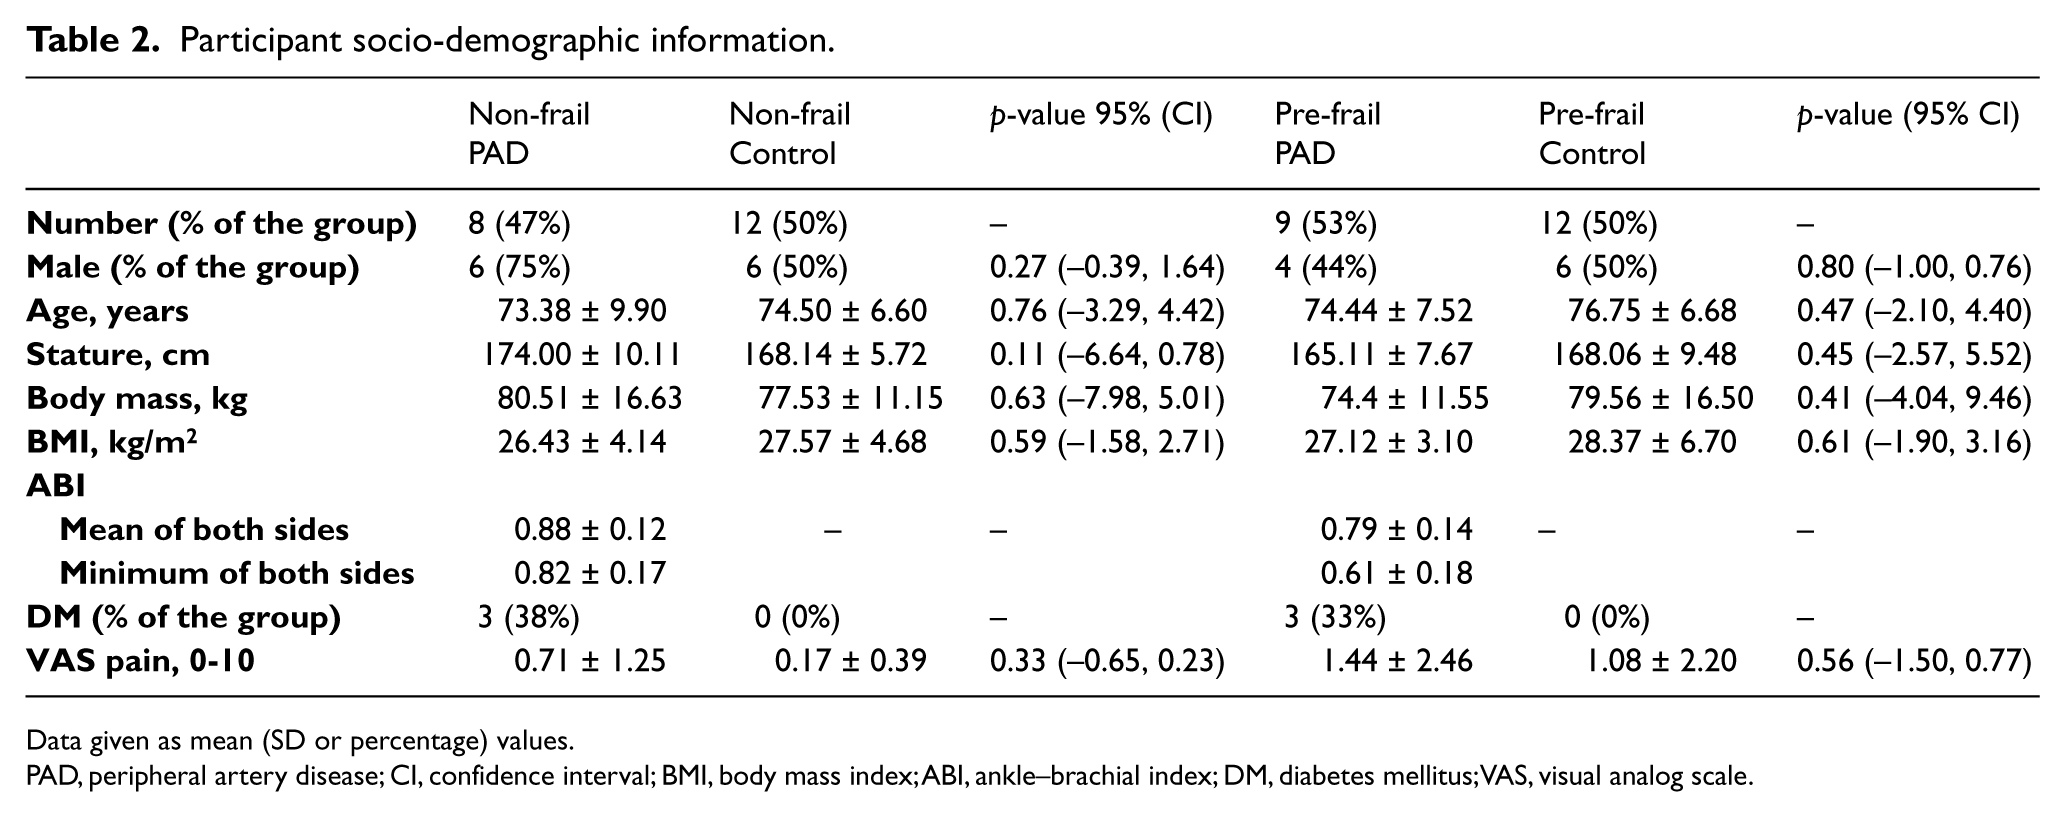
Data given as mean (SD or percentage) values.
PAD, peripheral artery disease; CI, confidence interval; BMI, body mass index; ABI, ankle–brachial index; DM, diabetes mellitus; VAS, visual analog scale.
Differences in gait parameters between PAD and control groups
Differences in gait behaviors between PAD and control groups were more noticeable among non-frail individuals. Average effect size values for differences in gait parameters between two groups were 0.78 and 0.62 within non-frail and pre-frail groups, respectively. For non-frail participants, parameters that were significantly different across both walking conditions included: gait speed, range of trunk sway in the anterior-posterior direction, and the distance and steps to reach steady state (Table 3 and Figure 1); all other gait parameters, including stride length, gait cycle time, double support, knee angle, range of trunk sway in the medial-lateral direction, speed variability, and mid-swing speed, were significantly different between the PAD and control groups for at least one walking condition within the non-frail group (Table 3 and Figure 1).
Differences in gait parameters between PAD and control groups in non-frail participants.
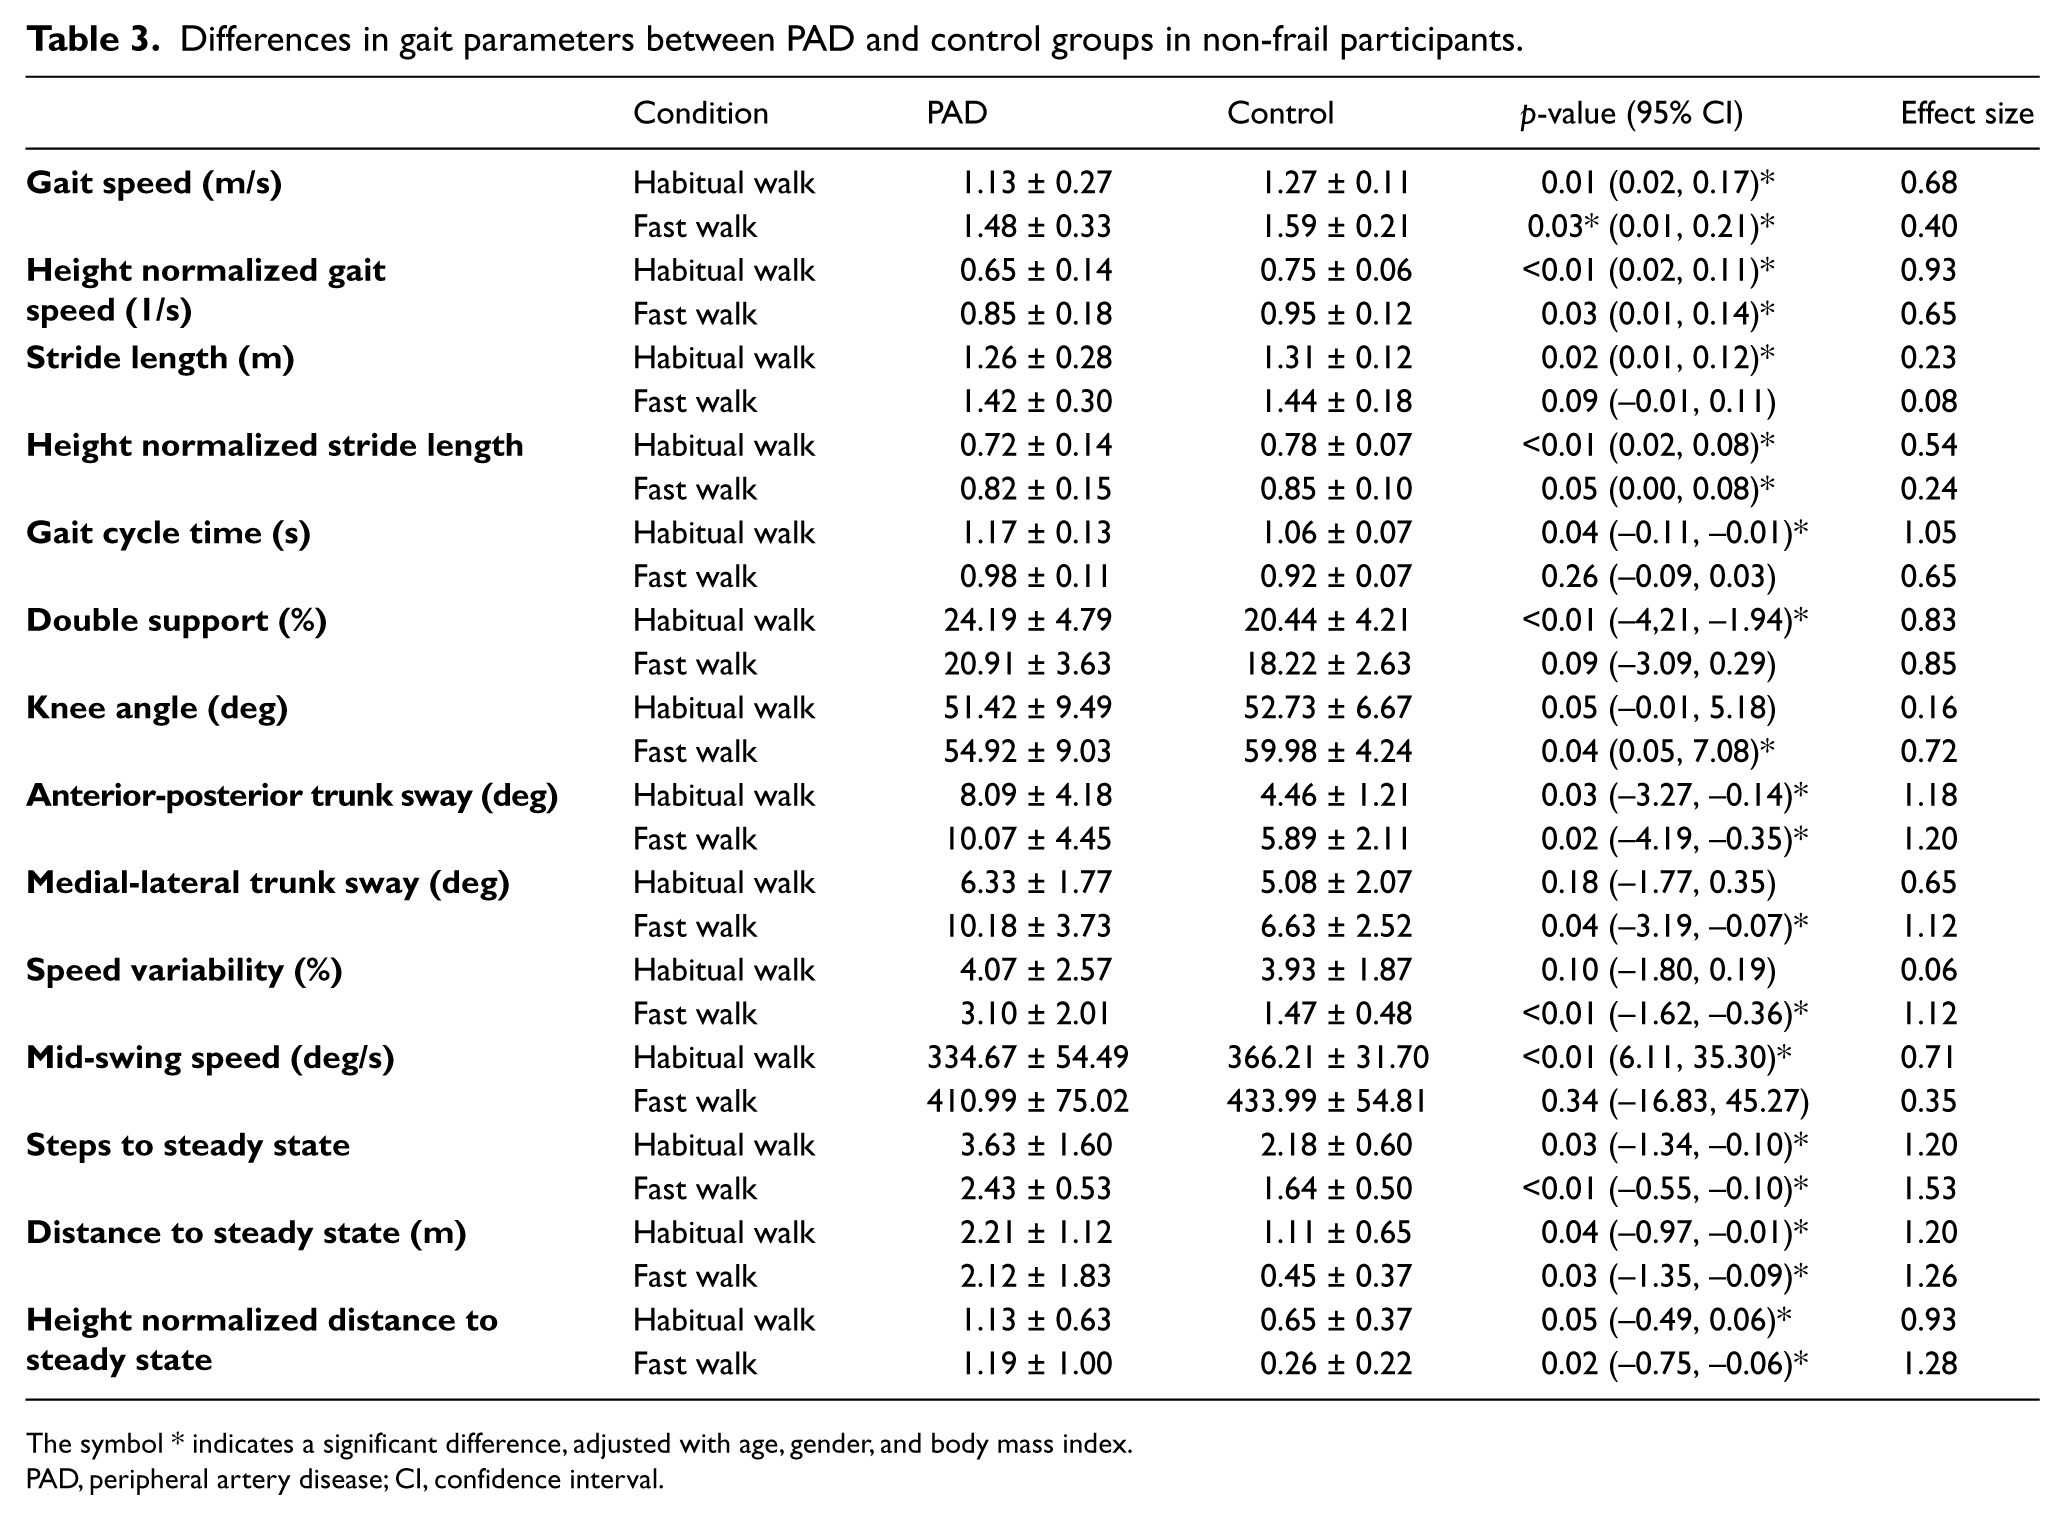
The symbol * indicates a significant difference, adjusted with age, gender, and body mass index.
PAD, peripheral artery disease; CI, confidence interval.
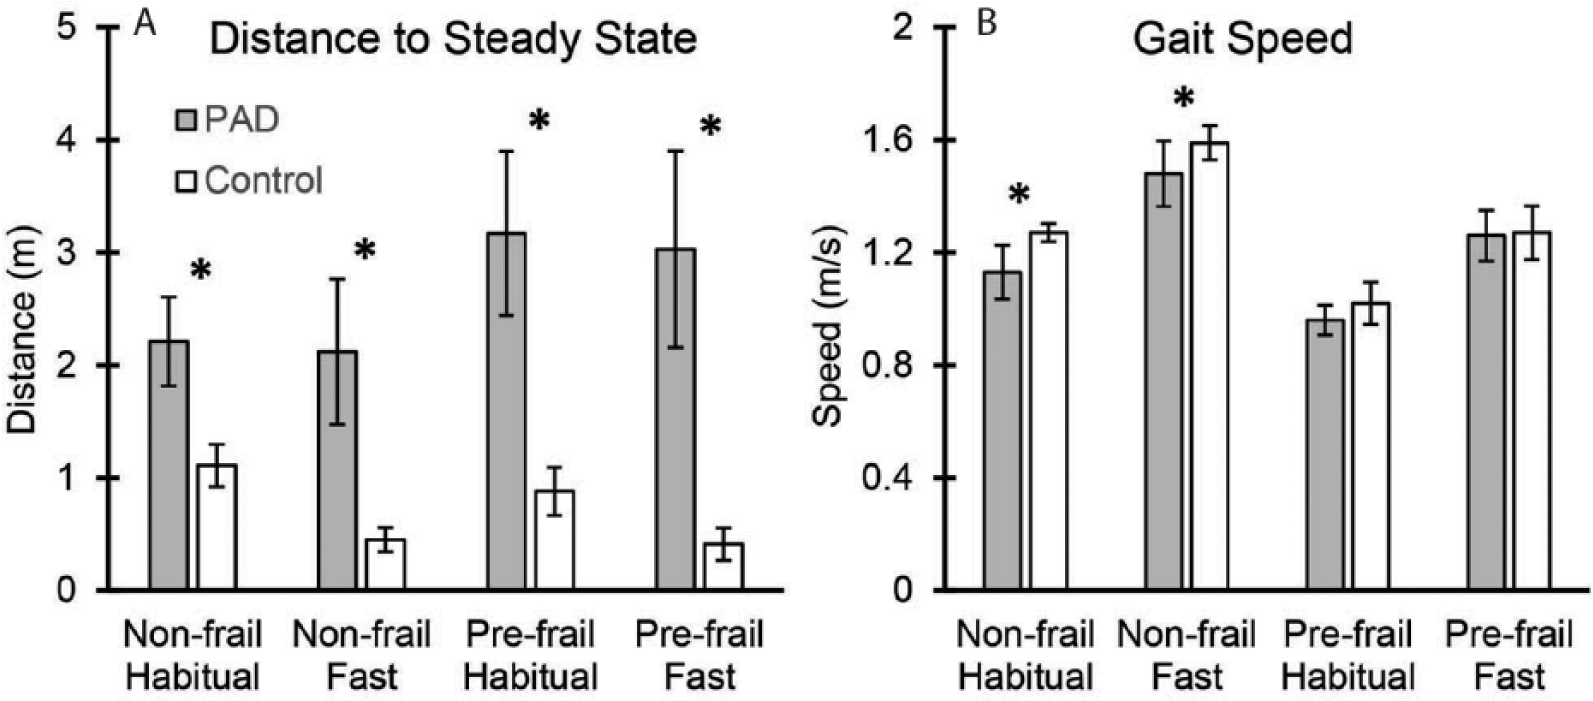
Differences in gait parameters between PAD and control groups. Differences are presented for non-frail and pre-frail groups. While no significant difference was observed in gait speed among pre-frail individuals (Figure 1B), gait initiation distance was significantly different between two groups within both non-frail and pre-frail categories (Figure 1B). The symbol * represents a significant between-group difference adjusted with age, gender, and body mass index. PAD, peripheral artery disease.
On the other hand, within the pre-frail group, no significant differences were observed between PAD and control groups in any of the gait parameters except the distance (absolute and height normalized) and steps to reach steady state and speed variability (Table 4 and Figure 1); the only parameters that were significantly different across both testing conditions among pre-frail participants were the distance and steps to reach steady state (Table 4 and Figure 1). Overall, the distance and steps to reach steady state represented the most sensitive parameters for detecting gait impairment in PAD participants when compared to controls (d = 1.30 among non-frail, d = 1.41 among pre-frail).
Differences in gait parameters between PAD and control groups in pre-frail participants.
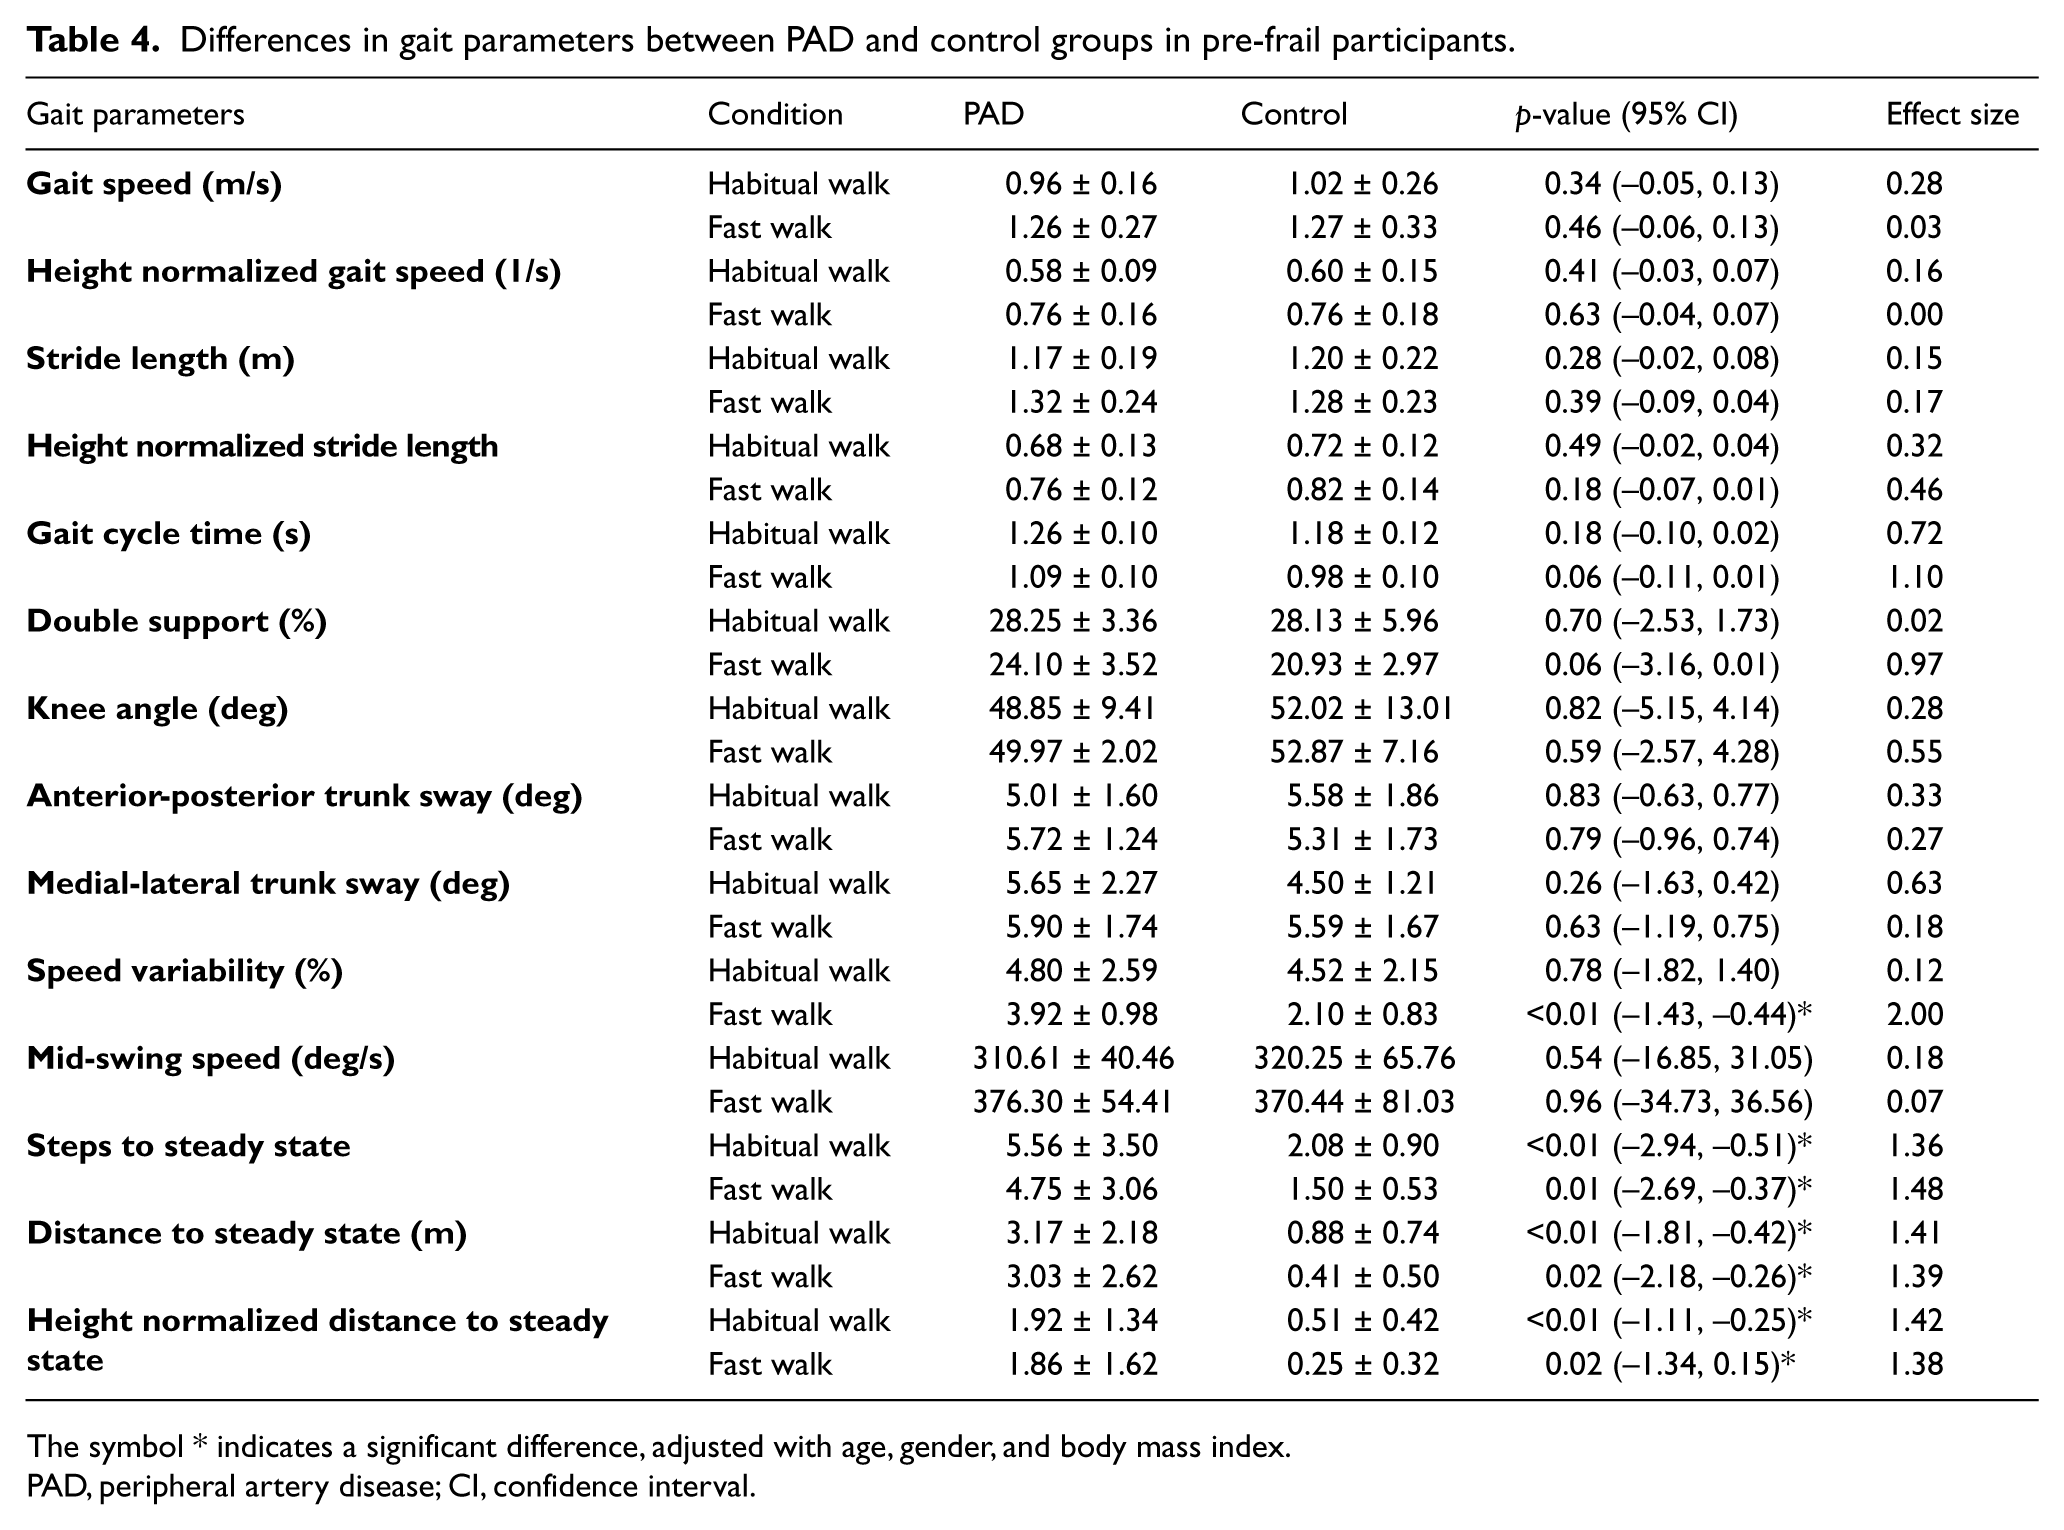
The symbol * indicates a significant difference, adjusted with age, gender, and body mass index.
PAD, peripheral artery disease; CI, confidence interval.
Comparing differences between pre-frail PAD participants with and without diabetes showed that only the knee angle during habitual walking was significantly larger among those without diabetes (9% difference, p < 0.01). Similarly, among non-frail PAD participants, the knee angle was significantly larger in non-diabetic participants within the fast walking condition (18% difference, p < 0.01). Overall, when adjusting for diabetes for comparisons between PAD and control groups, no substantial change occurred in between-group differences compared to original findings. Only prominent change was observed in knee angle differences during walking, especially among non-frail participants; no significant difference in knee angle was detected between two groups of PAD and controls when adjusted with age, gender, BMI, as well as diabetes.
Discussion
Gait differences between PAD and control within frailty groups
The results showed significant differences in all gait parameters between non-frail PAD and control participants, but not among pre-frail participants. This observation suggests a strong effect of frailty status on differences in gait parameters between PAD and control groups, especially the larger influence on the control group. Accordingly, frailty may be considered as a confounder that masks gait differences between PAD and control individuals, conveying the definite effect of frailty on common gait characteristics as compared to PAD. This observation corresponds to previously reported inconsistency in gait alterations due to PAD effects. For instance, McDermott et al. and McCully et al. have reported no significant differences in gait speed and stride length when comparing PAD and healthy aging adults (⩾ 55 years).4,7 Gardner et al., on the other hand, have reported a 23% faster walking speed, 15% larger stride length, and 12% shorter double support on average within habitual and fast walking in healthy age-matched controls compared to PAD individuals. 8 Although in none of these studies frailty has been assessed as a confounder, Gardner et al. have accounted for several chronic conditions for matching the control group with selected PAD participants. Interestingly, within this study, differences in gait parameters were significant between two groups. The disparity in findings could be explained if the participants were non-frail.
Frailty increases with age, and is more prevalent in people with poorer health and higher rates of comorbid chronic disease and disability. 32 Findings from the current study suggest that frailty status should be measured as a potential confounder when investigating gait deterioration with PAD in older adults. The prevalence of frailty in older adults with PAD has been reported to be as high as 17.5%. 33 Comparing this prevalence with 7% frailty among community dwelling older adults, suggests how closely PAD and frailty are related. 11
Sensitive parameters for identifying gait impairments in PAD
In spite of the dominant influence of frailty on gait performance, current results suggest that parameters related to gait initiation were sensitive to detect gait differences between PAD and control groups, regardless of frailty status. Specifically, the distance and number of steps to reach steady state walking were significantly different between PAD and control groups in both non-frail and pre-frail participants and within both habitual and fast walking conditions. Of note, assessment of gait initiation behaviors have recently become more common for investigating walking alterations due to aging; longer distances of gait initiation were reported for older frail individuals compared to healthy young participants, especially older adults who are at higher risk of falling.29,34
By definition, steady state walking is established when there is less variability in gait velocity between strides and walking becomes more consistent.29–31 Accordingly, the distance and number of steps to reach steady state walking are reflective of the acceleration phase at the beginning of the walking bout. Gait initiation is an inherently unstable state as it requires a large deviation between center of pressure (COP: pressure under the feet that causes body movements) and center of mass (COM: representing the point of the mean position of the mass). 35 The difference between COP and COM positions leads to a sudden forward body movement, which, accordingly, requires a delicate activation and captivation of lower extremity muscles for maintaining the balance. 36 Overall, a longer distance to reach steady state walking suggests a longer period of time required for the neuromuscular system to control the lower extremity motion and muscle activities to execute stable walking. The transitional period of gait initiation may, therefore, provide better identification of neuromuscular gait impairments compared to steady state walking behaviors, which was the case within the current study.
Our results showed that the distance and steps to steady state walking are, respectively, 235% and 57% higher on average among PAD non-frail compared to control non-frail participants; corresponding differences were 450% and 192% among pre-frail participants (Figure 1). This suggests that regardless of frailty status, gait initiation may be a sensitive parameter for detecting gait impairments in PAD patients. This finding is in agreement with previous work; several studies have reported muscle atrophy and reduction in muscle strength, as well as impaired nerve conduction velocity in lower extremities among PAD patients.37–39 As mentioned above, initiating a walking bout requires a complex neuromuscular control to provide an optimum activation of agonist and antagonist lower extremity muscles. Therefore, lack of adequate muscle strength and deterioration in nervous system performance may both cause excessive gait initiation impairments in PAD patients.
Limitations and future directions
The study sample size was relatively small, and no frail participants were recruited. Further, although PAD symptoms were confirmed within subjective questionnaires, ABI assessments were performed only for PAD participants, not the control group. Also, prior PAD intervention including surgical bypass or angioplasty/stent was not an exclusion criterion for patient recruitment, and three diagnosed PAD patients had a normal ABI at the time of gait assessment. Therefore, the current results, while encouraging, should be confirmed within a larger sample that also includes frail older adults, with a more robust list of measurements. Moreover, the purpose of the current study was to determine gait parameters that are sensitive to alterations caused by PAD. Although current results suggest that gait initiation parameters are more sensitive for identifying walking differences between PAD and healthy groups, the underlying mechanism for these differences is still unknown. Future causal research is required to investigate whether decline in muscle performance, peripheral nervous system dysfunctioning, or both, lead to gait impairments and deteriorated dynamic balance in PAD patients. Better understanding of the underlying mechanism for gait impairments may be promising targets for intervention to prevent disability in PAD patients.
Summary of findings and implications
Although advancing age has been persistently associated with adverse health outcomes, recent studies have demonstrated that due to the heterogeneity of health status in older adults, more robust assessments of functional decline, rather than solely chronological age, are required for adjusting statistical comparisons. Within the current study, the observed interaction effect between frailty and PAD on gait parameters confirms the importance of assessing functionality in addition to age to provide more consistency in detecting motor performance impairments due to PAD. We observed 10% faster gait speed among PAD compared to healthy individuals within the non-frail category. This difference dropped to 3% for similar comparison within the pre-frail group.
Considering frailty status as the confounding variable, in addition to demographic information, there are still differences in walking behaviors between PAD patients and healthy individuals; gait initiation performance measured by the distance and steps required to reach steady state walking showed high sensitivity in detecting PAD gait alterations. The establishment of sensitive parameters to measure gait impairments in PAD will allow clinicians to more precisely pinpoint the deficiency and suggest appropriate interventions. Specifically, we hypothesized that impairments in lower extremity muscles and nerves may be related to lack of dynamic balance and poor gait initiation in PAD patients. Further, altered gait initiation behaviors have been associated with fall risk in older adults.34,40 Assessing gait initiation behaviors among PAD patients may, therefore, provide critical information to understand fall mechanisms and reduce fall events by appropriate targeted exercise routines.
Footnotes
Acknowledgements
The content is solely the responsibility of the authors and does not necessarily represent the official views of the National Institute on Aging or the National Institutes of Health. We thank Hossein Mehdikhani and Mahmoud Zaki for helping with data collection.
Declaration of conflicting interests
The authors declared no potential conflicts of interest with respect to the research, authorship, and/or publication of this article.
Funding
The authors disclosed receipt of the following financial support for the research, authorship, and/or publication of this article: the study was supported in part by STTR-Phase II Grant (Award Number 2R42AG032748) from the National Institute on Aging.