
Abstract
To determine whether coronary artery disease (CAD) is associated with abdominal aortic aneurysm (AAA) growth, we performed a meta-analysis of currently available studies. Databases including MEDLINE and EMBASE were searched through October 2015 using PubMed and OVID. Search terms included enlargement, expansion, growth, or progression; rate or rates; and abdominal aortic aneurysm. Studies considered for inclusion met the following criteria: the design was unrestricted; the study population was AAA patients with and without CAD; and outcomes included data regarding AAA growth. For each study, growth rates in both the CAD and non-CAD groups were used to generate standardized mean differences (SMDs) and 95% confidence intervals (CIs). Of 664 potentially relevant publications screened initially, we identified 20 eligible studies including data on a total of 7238 AAA patients. A pooled analysis of all 20 studies demonstrated a statistically significant association of CAD with slower AAA growth rates (i.e. a significantly negative association of CAD with AAA growth) in the fixed-effect model (SMD, −0.06 [–0.0592]; 95% CI, −0.12 [–0.1157] to −0.00 [–0.0027]; p = 0.04). There was minimal between-study heterogeneity (p = 0.16) and a statistically non-significant association of CAD with slower AAA growth rates (i.e. a non-significantly negative association of CAD with AAA growth) in the pooled result from random-effects modeling (SMD, −0.06; 95% CI, −0.13 to 0.01; p = 0.12). In conclusion, CAD may be negatively associated with AAA growth.
Introduction
The first (published in 2004) meta-analysis by Cornuz et al. 1 of six population-based risk factor studies of abdominal aortic aneurysm (AAA) showed that a history of coronary artery disease (CAD) was a major risk factor or risk indicator for screening-detected AAA (odds ratio [OR], 2.30; 95% confidence interval (CI), 1.92 to 2.75). Another recent (published in 2013) meta-analysis by Li et al. 2 of three epidemiological studies also showed that CAD was a risk factor for AAA (OR, 1.82; 95% CI, 1.65 to 2.00). Despite the evidence for the positive association of CAD with AAA presence, however, CAD may be not 3 or even negatively 4 associated with AAA growth. Using a large clinical database from the ADAM (Aneurysm Detection and Management) study, Bhak et al. 3 found no association between angina or CAD and AAA expansion rates. Unexpectedly, in a retrospective cohort study, Nakayama et al. 4 demonstrated an inverse association between the existence of CAD and an accelerated AAA expansion rate (i.e. negative association of CAD with AAA growth) in 510 elective repair cases for which at least two follow-up CT scans of AAA were available. These data suggest that atherosclerosis has a minimal role in the continuing expansion that characterizes the natural history of AAA. 5 Although AAA has been traditionally regarded as a consequence of atherosclerosis, recent findings lend support to the concept that AAA grows through pathologic mechanisms that differ from those responsible for atherosclerotic occlusive disease.4,6,7 To determine whether CAD is associated with AAA growth, we performed a meta-analysis of currently available studies.
Methods
All studies reporting AAA growth rates were identified using a two-level search strategy. First, databases including MEDLINE and EMBASE were searched through October 2015 using web-based search engines (PubMed and OVID). Second, relevant studies were identified through a manual search of secondary sources including references of initially identified articles and a search of reviews and commentaries. All references were downloaded for consolidation, elimination of duplicates, and further analysis. Search terms included enlargement, expansion, growth, or progression; rate or rates; and abdominal aortic aneurysm.
Studies considered for inclusion met the following criteria: the design was unrestricted; the study population was AAA patients with and without CAD; and outcomes included data regarding AAA growth. Data regarding AAA growth included: (1) growth rates in both the CAD and non-CAD groups; (2) mean differences (MDs) between growth rates in the CAD group and those in the non-CAD group; (3) proportions of CAD patients in both the rapid and slow AAA-growth groups (according to a cut-point defined by the authors of each study); or (4) ORs of rapid (or slow) AAA growth (according to a cut-point defined by the authors of each study) for CAD versus non-CAD patients. Two reviewers (authors) reviewed the eligible studies and determined whether they met the selection criteria. Data regarding detailed inclusion criteria, CAD definition, duration of follow-up, and AAA growth were abstracted (as available) from each individual study. Data were extracted in duplicate by two investigators (authors), and disagreements were resolved by consensus.
We conducted a meta-analysis of summary statistics from the individual studies. For each study, growth rates in both the CAD and non-CAD groups were used to generate standardized MDs (SMDs) (between growth rates in the CAD group and those in the non-CAD group) and their 95% CIs, or proportions of CAD patients in both the rapid and slow AAA-growth groups were used to generate ORs (of rapid AAA growth for CAD versus non-CAD patients) and their 95% CIs. Based on an assumption that the underlying continuous measurements in each group follow a logistic distribution (which is a symmetrical distribution similar in shape to the normal distribution but with more data in the distributional tails), and that the variability of the outcomes is the same in both case and control participants, 8 we re-expressed the OR (of rapid AAA growth for CAD versus non-CAD patients) as SMD (between growth rates in the CAD group and those in the non-CAD group) acording to the simple formula 9 (the standard error (SE) of the logarithmic OR can be converted to the SE of a SMD by multiplying by the same constant [√3/π = 0.5513]), despite any cut-points. When both univariate-unadjusted and multivariate-adjusted estimates were available, we combined the latter preferentially in pooled analyses. Study-specific estimates were combined using inverse variance-weighted averages of SMDs in both fixed-effect and random-effects models. Between-study heterogeneity was analyzed by means of standard χ2 tests. Where no significant statistical heterogeneity was identified, the fixed-effect estimate was used preferentially as the summary measure. Publication bias was assessed graphically using a funnel plot and mathematically using an adjusted rank-correlation test 10 and a linear regression test. 11 All analyses were conducted using Review Manager version 5.3 (available from http://tech.cochrane.org/revman) and Comprehensive Meta-Analysis version 3 (Biostat, Englewood, NJ, USA).
Results
As outlined in Figure 1, our search identified 20 eligible studies3–5,12–28 reporting the association of CAD and AAA growth, which included data on a total of 7238 AAA patients. The study design and patient characteristics, detailed measurements of AAA diameters, and growth rates of AAA are summarized in Tables 1, 2, and 3, respectively. The study design was a randomized controlled trial in three studies,3,5,21 a prospective cohort study in 11,14–18,20,22,25–28 and a retrospective observational study in six.4,12,13,19,23,24 Multivariate-adjusted (including propensity-score matched 23 ) estimates were available in seven studies.3,4,5,16,18,20,23 Despite the noted heterogeneity in design between the studies, there was sufficient similarity between the populations and the hypotheses to merit inclusion of all 20 studies in the quantitative meta-analysis.
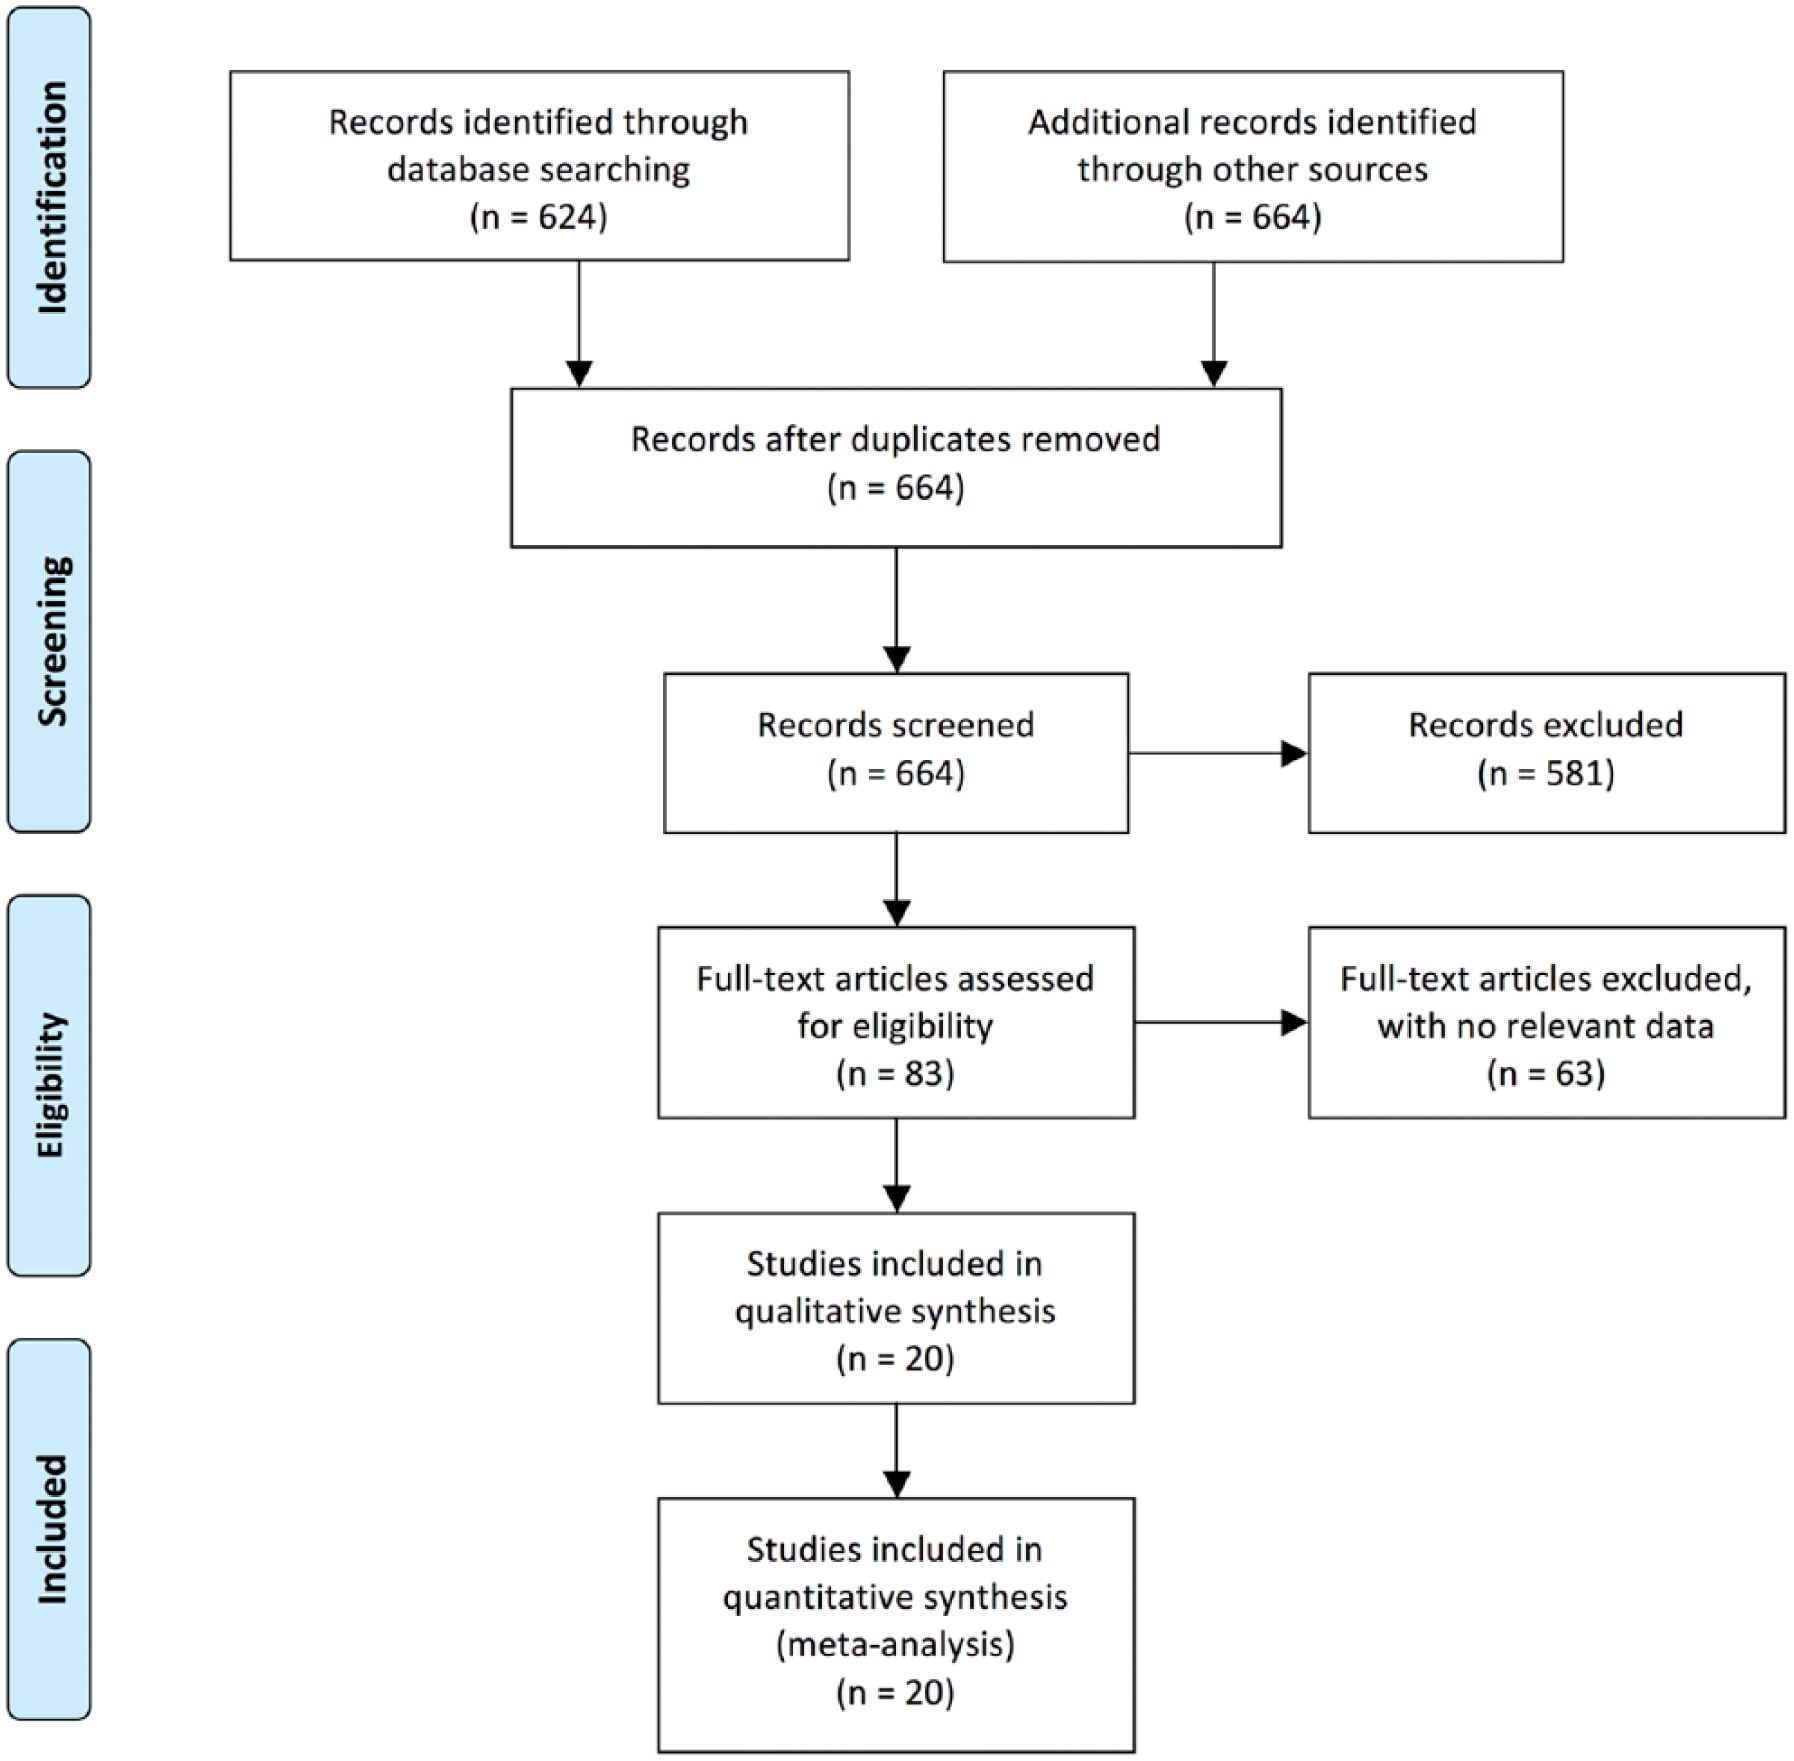
Preferred Reporting Items for Systematic Reviews and Meta-Analyses (PRISMA) flow diagram for the meta-analysis. Adapted from Moher et al. 40
Study design and patient characteristics.
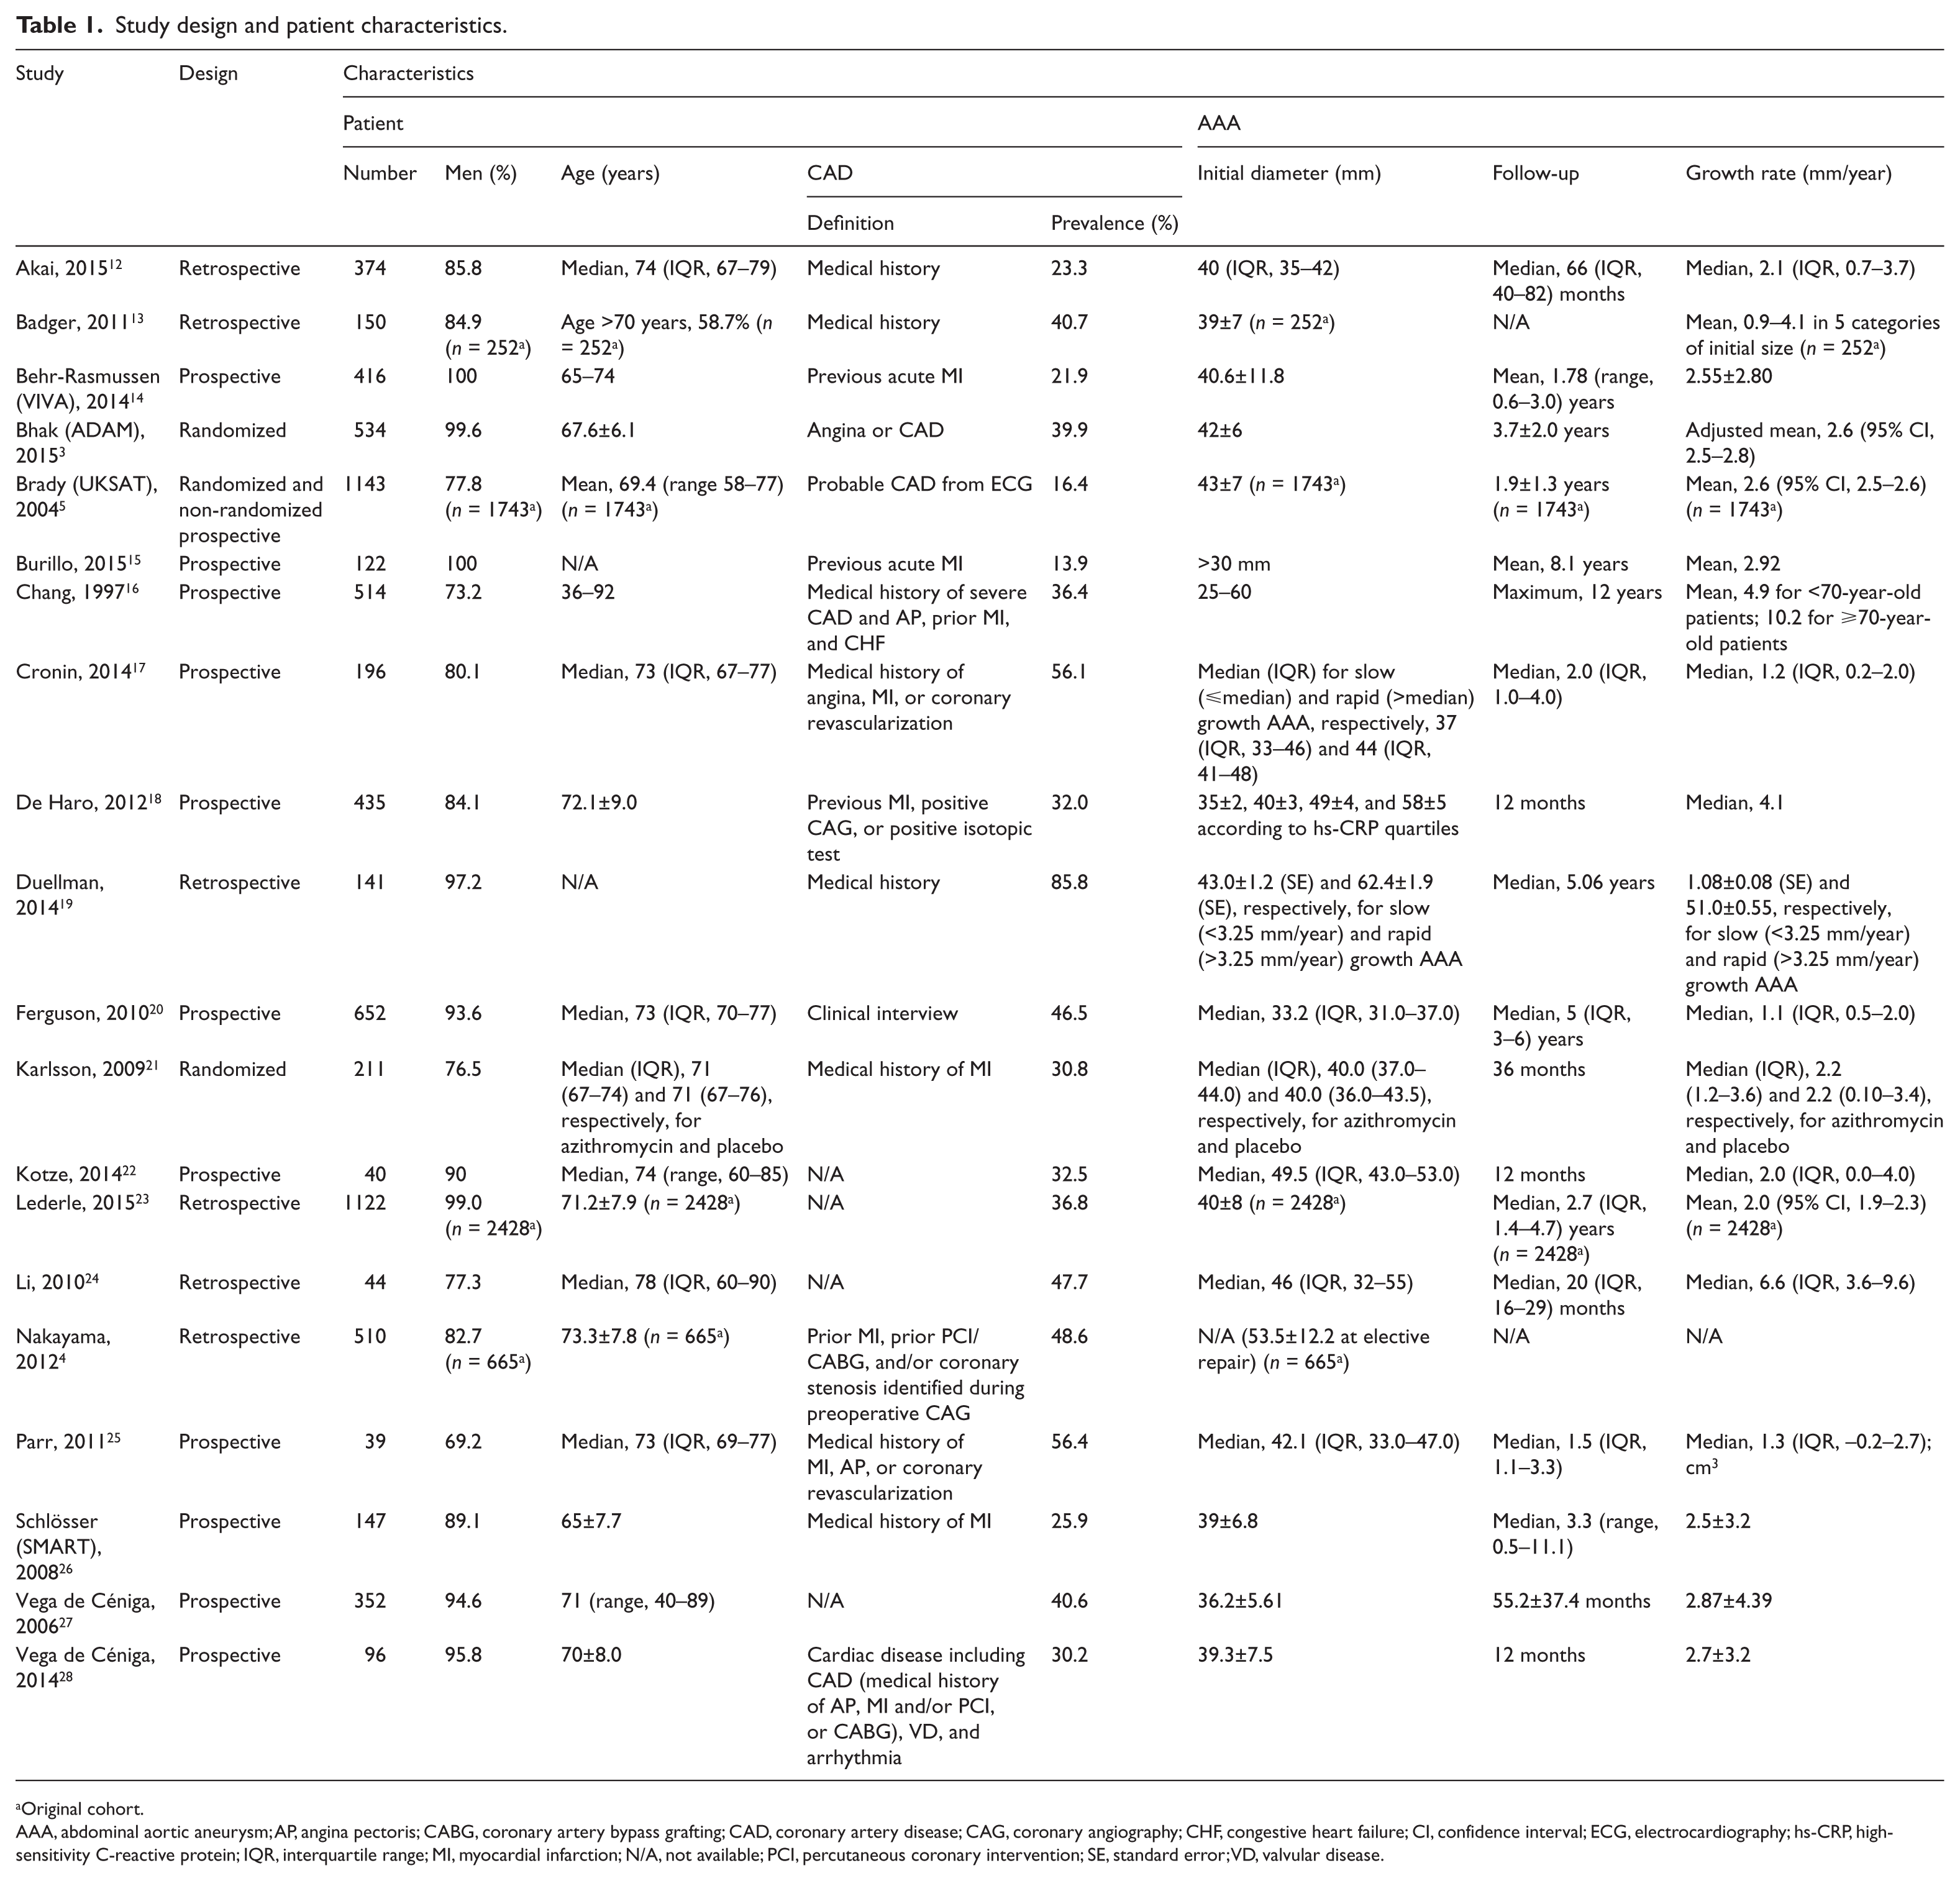
Original cohort.
AAA, abdominal aortic aneurysm; AP, angina pectoris; CABG, coronary artery bypass grafting; CAD, coronary artery disease; CAG, coronary angiography; CHF, congestive heart failure; CI, confidence interval; ECG, electrocardiography; hs-CRP, high-sensitivity C-reactive protein; IQR, interquartile range; MI, myocardial infarction; N/A, not available; PCI, percutaneous coronary intervention; SE, standard error; VD, valvular disease.
Detailed measurements of abdominal aortic aneurysm diameters.
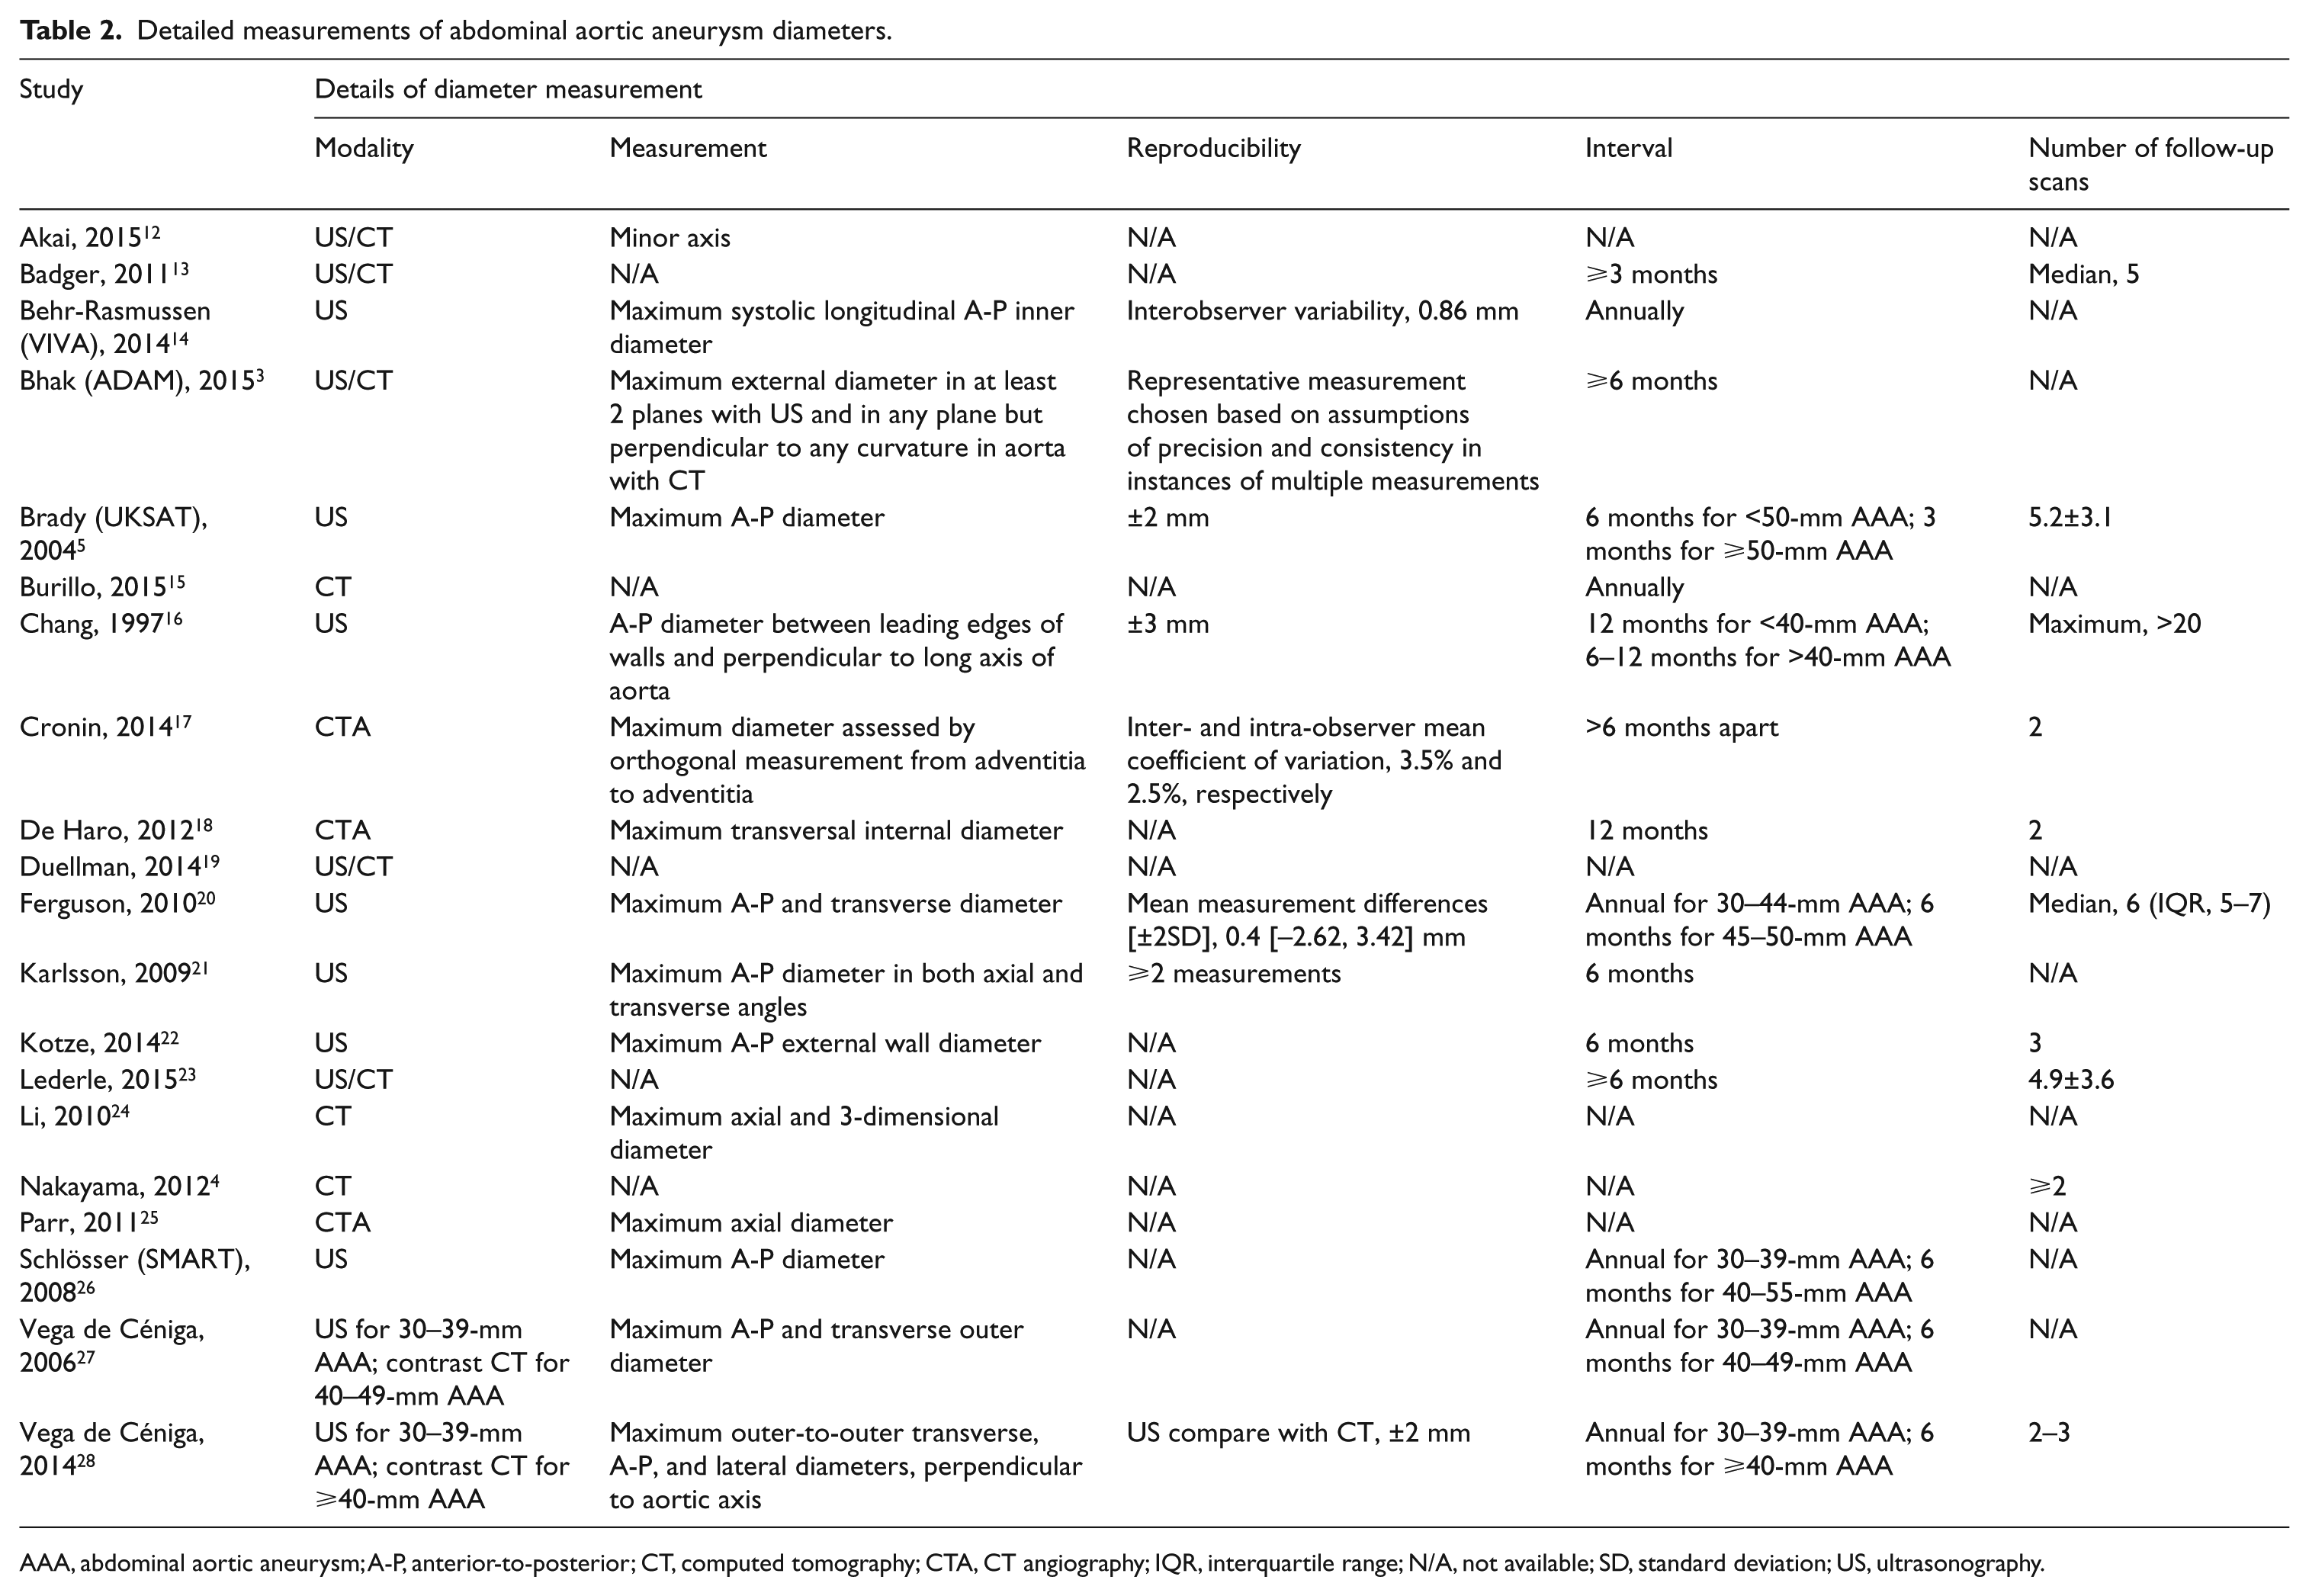
AAA, abdominal aortic aneurysm; A-P, anterior-to-posterior; CT, computed tomography; CTA, CT angiography; IQR, interquartile range; N/A, not available; SD, standard deviation; US, ultrasonography.
Growth rates of abdominal aortic aneurysm.
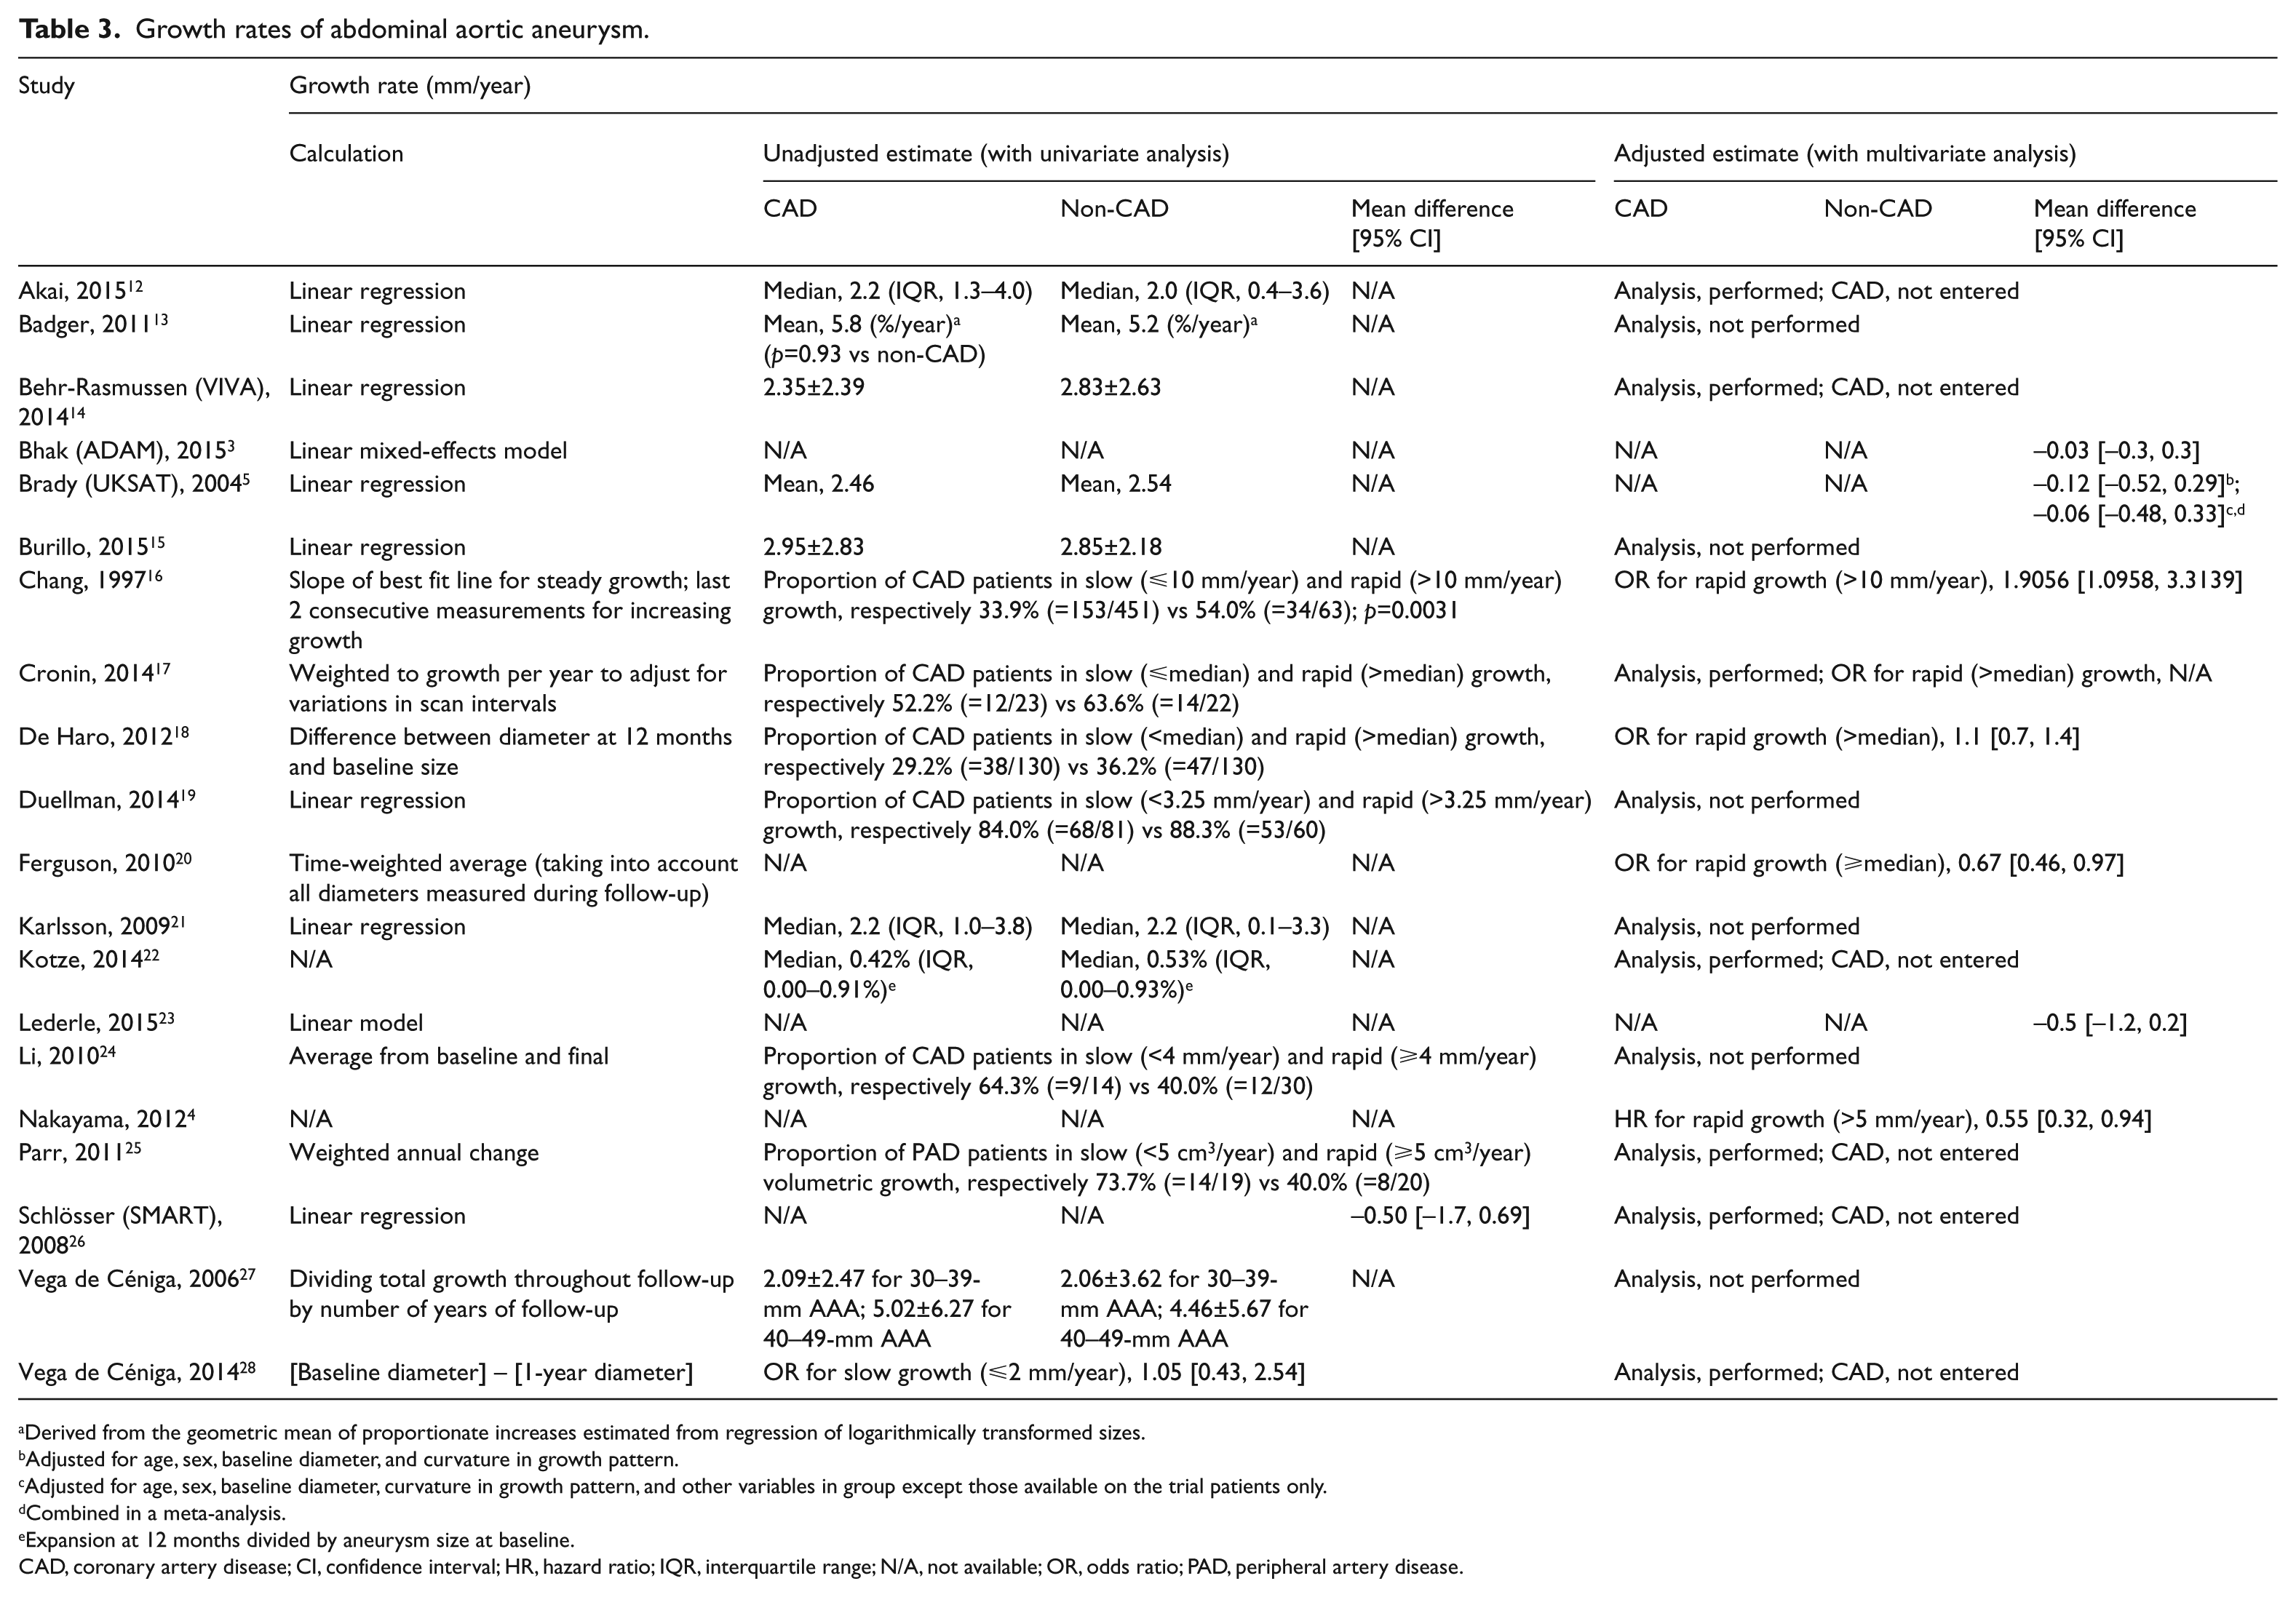
Derived from the geometric mean of proportionate increases estimated from regression of logarithmically transformed sizes.
Adjusted for age, sex, baseline diameter, and curvature in growth pattern.
Adjusted for age, sex, baseline diameter, curvature in growth pattern, and other variables in group except those available on the trial patients only.
Combined in a meta-analysis.
Expansion at 12 months divided by aneurysm size at baseline.
CAD, coronary artery disease; CI, confidence interval; HR, hazard ratio; IQR, interquartile range; N/A, not available; OR, odds ratio; PAD, peripheral artery disease.
Of the 20 studies, only one 16 demonstrated a statistically significant association of CAD with greater AAA growth rates, whereas three4,20,25 indicated a statistically significant association of CAD with slower AAA growth rates. A pooled analysis of all 20 studies demonstrated a statistically significant association of CAD with slower AAA growth rates (i.e. a significantly negative association of CAD with AAA growth) in the fixed-effect model (SMD, −0.06 [–0.0592]; 95% CI, −0.12 [–0.1157] to −0.00 [–0.0027]; p = 0.04; Figure 2). There was minimal between-study heterogeneity (p = 0.16) and a statistically non-significant association of CAD with slower AAA growth rates (i.e. a non-significantly negative association of CAD with AAA growth) in the pooled result from random-effects modeling (SMD, −0.06; 95% CI, −0.13 to 0.01; p = 0.12). To assess publication bias we generated a funnel plot of the effect size (SMD) versus the precision (reciprocal of SE) for each study (Figure 3). There was no evidence of significant publication bias (2-tailed p with continuity correction = 0.65 by the adjusted rank-correlation test; 10 2-tailed p = 0.84 by the linear regression test 11 ).
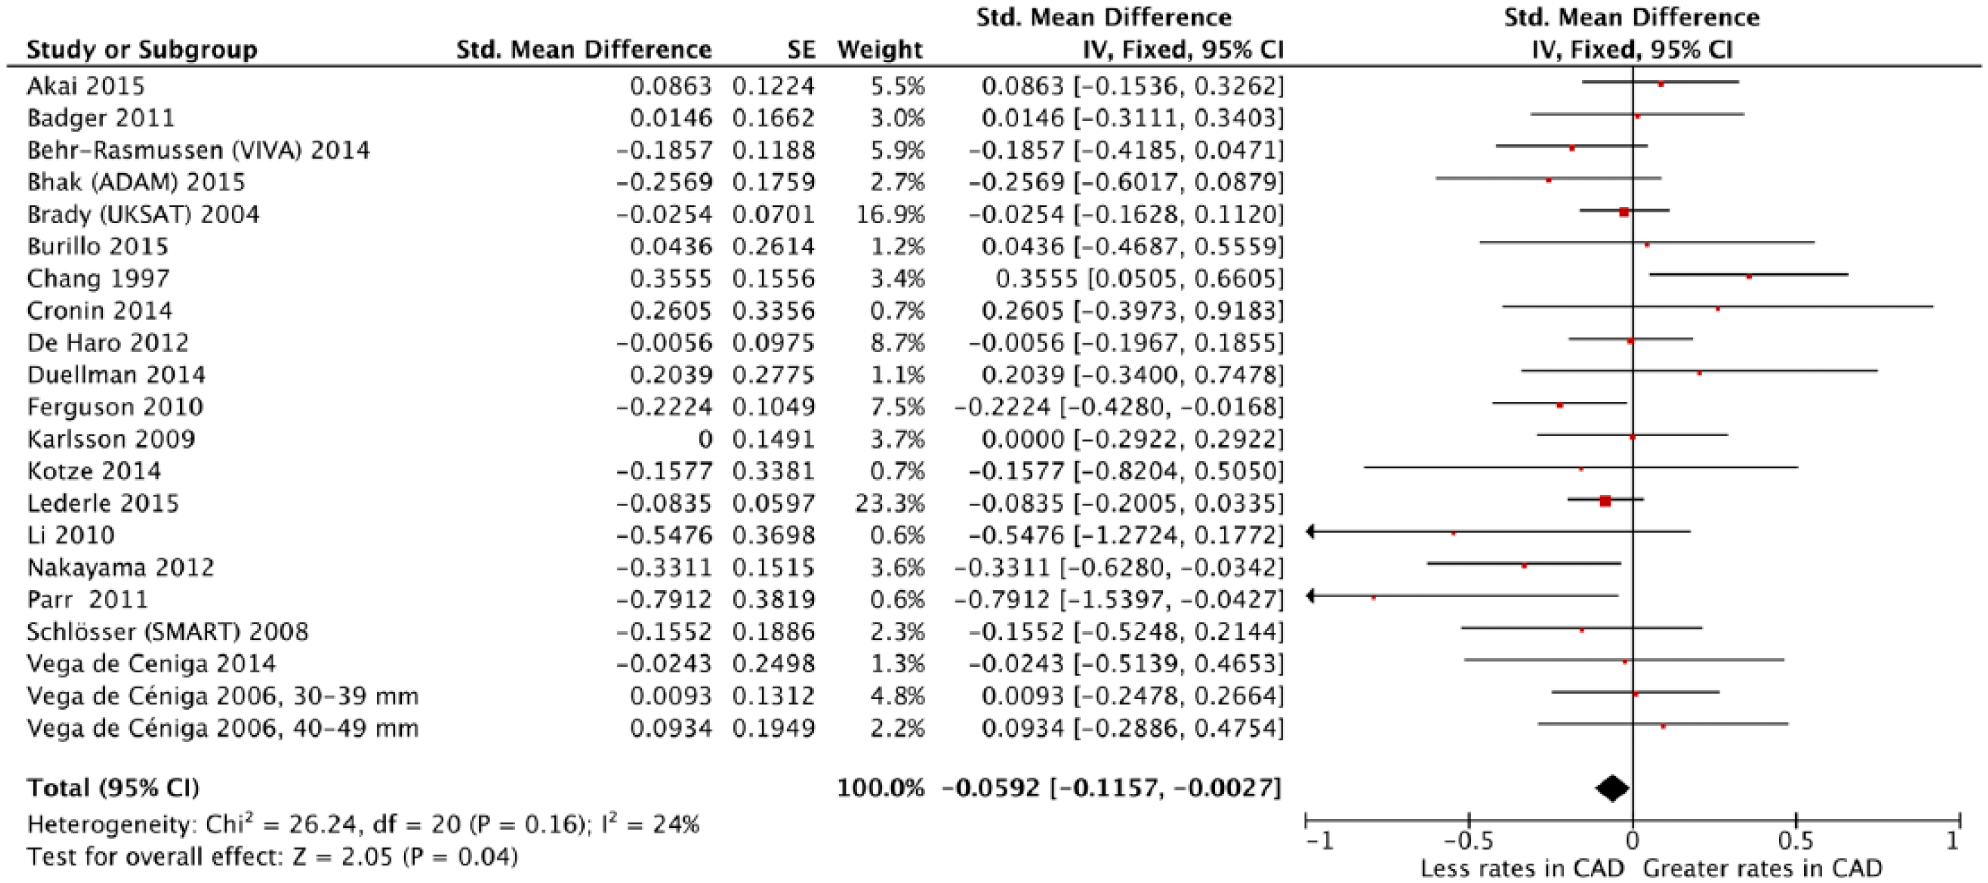
Forest plot of standardized mean differences of abdominal aortic aneurysm growth rates between patients with and without coronary artery disease (CAD). (ADAM, Aneurysm Detection and Management; CI, confidence interval; IV, inverse variance; SMART, Second Manifestations of ARTerial disease; UKSAT, UK Small Aneurysm Trial; VIVA, Viborg Vascular.)
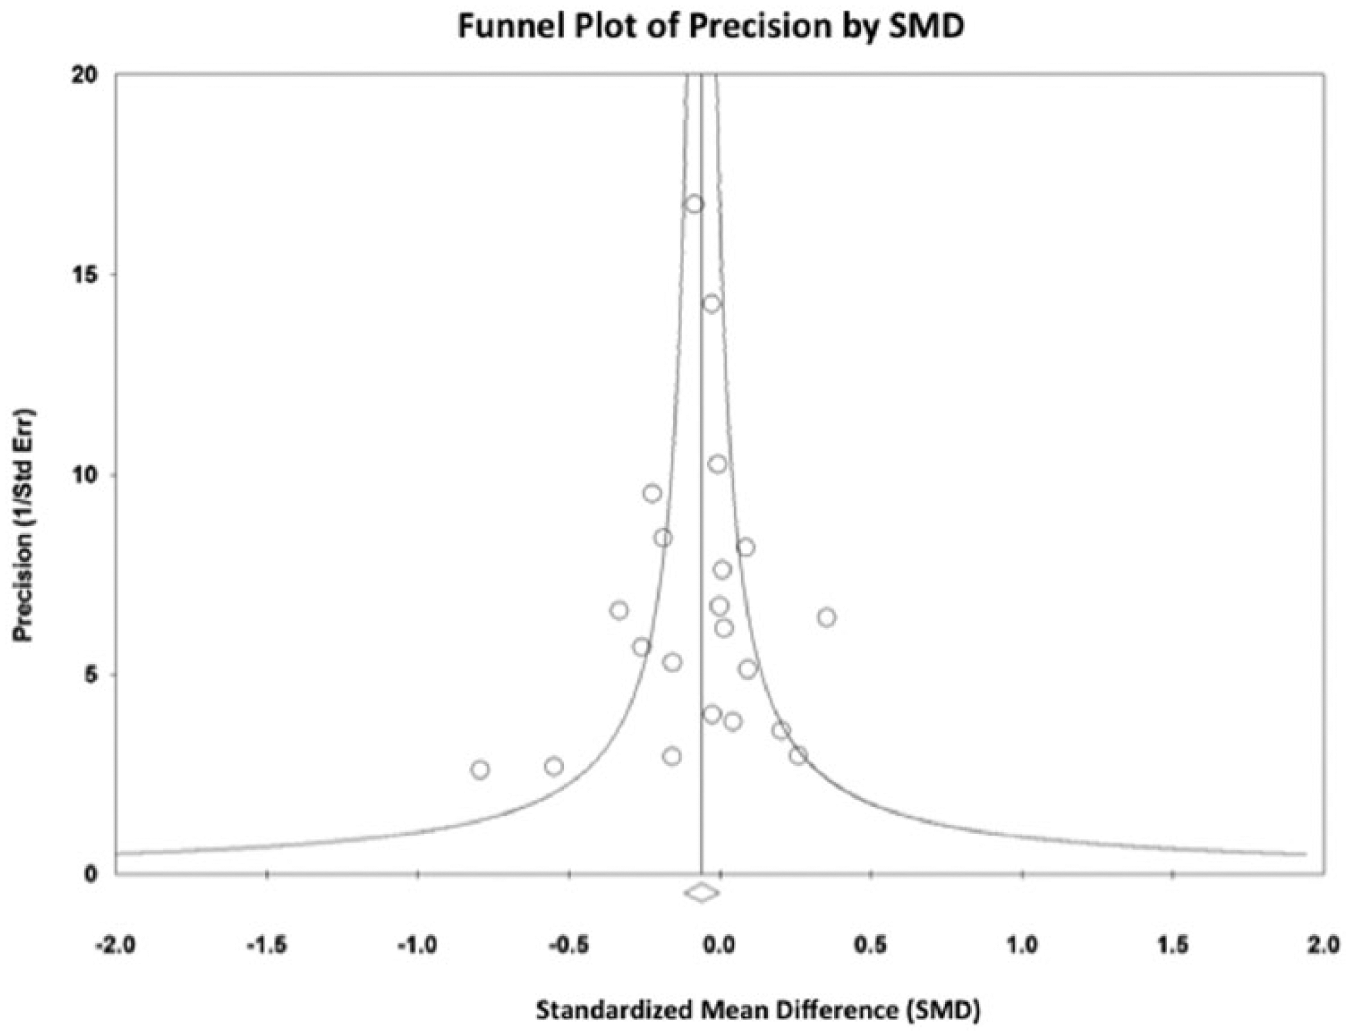
Funnel plot of the precision (reciprocal of standard error) by the standardized mean difference of abdominal aortic aneurysm growth rates between patients with and without coronary artery disease.
Discussion
The results of our analysis suggest a negative association of CAD with AAA growth. Most individual studies were unable to demonstrate a statistically significant benefit to CAD, likely due to systematic underpowering (as reflected in the wide CIs and lack of statistical significance) of these studies in the design phase and primarily due to the small number of enrolled patients.
Although patients with AAA frequently have atherosclerotic diseases such as CAD and peripheral artery disease (PAD), it is unknown whether this association between AAA and atherosclerosis is causal or simply due to common risk factors. One possibility is that an AAA develops as a pathological response to aortic atherosclerosis, a theory first suggested more than half a century ago, when the term ‘atherosclerotic aneurysms’ was commonly used, but still prevalent today. 7 Environmental and genetic risk factors lead to development of aortic atherosclerosis according to the following two theories. 7 First, resultant positive remodeling, intimal thrombosis, and release of proinflammatory cytokines stimulate secondary matrix degradation and adventitial inflammation, which promotes AAA development. Second, environmental and genetic risk factors directly stimulate aortic medial degradation and adventitial inflammation, leading to AAA formation, which secondarily stimulates intimal atherosclerosis. More likely, both pathways act to some extent, with the relative proportion varying from patient to patient depending on the risk profile. 7 Some differences between atherosclerosis and AAA, however, have been documented. First, diabetes is a negative or neutral risk factor for AAA but an important risk factor for atherosclerosis, and, additionally, male gender and smoking are much more dominant risk factors for AAA than atherosclerosis.7,29 Second, there are a number of disparate markers for AAA and atherosclerosis; 7 for example, low-density lipoprotein has no clear association with AAA but is an important risk factor for atherosclerosis. 30 Third, some recognized genetic determinants of atherosclerosis have no consistent association with AAA; 7 for example, apolipoprotein E single-nucleotide polymorphisms. 31 Fourth, marked elastin fragmentation and adventitial chronic inflammation are mainly restricted to AAA.7,29 Fifth, there are examples of differential effects of interventions on AAA and atherosclerosis progression in rodent models; 7 for example, tumor necrosis factor 32 and matrix metalloproteinase-12 deficiency, 33 and peroxisome proliferator-activated receptor ligation. 34 Sixth, despite a significant association between carotid artery total plaque area and history of CAD with AAA prevalence, there is no association between carotid artery total plaque area and aortic diameter within the AAA range (i.e. there is no consistent correlation between atheroma extent and AAA severity).7,35 The lack of a consistent dose–response relationship between atherosclerosis and AAA diameter suggests that atherosclerosis may not be a causal event in AAA but develops in parallel with or secondary to aneurysmal dilatation. 35 Finally, there may be different local responses to atherosclerosis in the abdominal aorta. On the one hand, plaque deposition associated with localized dilation, thinning of the media, and loss of medial elastic lamellae may predispose that segment of aorta to subsequent aneurysm formation. 6 On the other hand, plaque deposits without media thinning, without loss of elastic lamellae, and without artery wall dilation may predispose the aorta, in the event of continuing plaque accumulation, to the development of lumen stenosis. 6
Despite the positive association of CAD with AAA presence,1,2 the reason why CAD is negatively associated with AAA growth is unclear. Diabetes, a major risk factor of CAD, is independently and negatively associated with not only AAA presence,36,37 but also AAA growth.38,39 The RESCAN meta-analysis 39 of 6268 individual patient data from 10 studies (of the available 18 studies) demonstrated that diabetics had growth rates that were on average 0.51 (SE, 0.10) mm/year slower than those of non-diabetics after adjustment for all demographics, medical history, and drug history. Our recent meta-analysis 39 of 19 studies also demonstrated statistically significant slower growth rates in diabetic patients than in non-diabetic patients (unadjusted SMD, −0.32; 95% CI, −0.40 to −0.24; p < 0.00001; adjusted SMD, −0.29; 95% CI, −0.417 to −0.18; p < 0.00001). On the other hand, PAD as well as CAD, a major comorbidity of diabetes, is also positively associated with AAA presence.1,2 The meta-analysis by Cornuz et al. 1 of eight population-based risk factor studies of AAA showed that a history of PAD was a major risk factor or risk indicator for screening-detected AAA (OR, 2.48; 95% CI, 2.10 to 2.92). The meta-analysis by Li et al. 2 of three epidemiological studies also showed that claudication was a risk factor for AAA (OR, 3.00; 95% CI, 1.74 to 5.19). Although the association of PAD with AAA growth has been debated, PAD may be not 3 or even negatively 14 associated with AAA growth despite its positive association with AAA presence.1,2 Bhak et al. 3 found no independent association between claudication and AAA expansion rates (MD, −0.1 mm/year; 95% CI, −0.6 to 0.3 mm/year; p = 0.52). Whereas, in a longitudinal study from the UKSAT (UK Small Aneurysm Trial), Brady et al. 5 indicated that a lower ankle/brachial pressure index (indicating more severe PAD) was associated with slower AAA growth (i.e. negatively associated with AAA growth) (MD per 0.2-unit increase in the index, 0.22 mm/year; 95% CI, 0.10 to 0.34 mm/year). Further investigations would be required to elucidate why CAD is negatively associated with AAA growth despite its positive association with AAA presence.
Limitations
Our analysis must be viewed in the context of its limitations. First, our results may be influenced by a publication bias. This risk was minimized through an exhaustive search of the available literature. By not adding the search terms coronary artery/arterial/heart disease, ischemic/ischaemic heart disease, myocardial infarction, angina, and acute coronary syndrome (adding these terms indeed led to retrieving a limited number of studies), we initially identified 83 potential eligible studies reporting AAA growth and then selected 20 studies providing the association of CAD with AAA growth. Although the statistical tests did not indicate publication bias, there is clearly limited power to detect such bias, given the small number of studies examined. Second, all data currently available for inclusion were abstracted from epidemiologic studies which commonly lacked blinding in accessing data. Additionally, retrospective studies included the possibility of missed information. Interpretation of our results was complicated by the heterogeneity among the studies, probably due to differences in study designs, populations, definitions of AAA and CAD, measurements of AAA diameter, adjustment factors, and durations of follow-up. Finally, the risk of obtaining a spurious explanation for variable effects could have appeared higher because of the many characteristics that differed among the studies included and the relatively small number of cases. 36 Thus, we preferred to use data adjusted for local confounders at each study level (when the information was available). Multivariate-adjusted (including propensity-score matched) estimates were available in seven3,4,5,16,18,20,23 of the 20 studies included in the present meta-analysis. Although cardiovascular medications were adjusted for in five3,4,18,20,23 of these seven studies, the potential for confounding by other factors associated with treatment of CAD (such as smoking cessation counseling/quit rates) still remains.
Conclusion
In conclusion, we found that, based on a meta-analysis, CAD may be negatively associated with AAA growth. Further investigations would be required to elucidate why CAD is negatively associated with AAA growth despite its positive association with AAA presence.
Footnotes
Acknowledgements
The ALICE (All-Literature Investigation of Cardiovascular Evidence) Group is composed of 15 doctors who currently belong (Hisato Takagi, MD, PhD; Mitsuyoshi Matsumoto, MD; Shohei Mitta, MD; Norikazu Kawai, MD; Takuya Umemoto, MD, PhD) or have belonged (Hiroki Ogura, MD; Yusuke Mizuno, MD; Hirotaka Yamamoto, MD; Taku Watanabe, MD; Masao Niwa, MD; Shin-nosuke Goto, MD; Masafumi Matsui, MD; Takayoshi Kato, MD; Seishiro Sekino, MD; Yukihiro Matsuno, MD, PhD) to the Department of Cardiovascular Surgery, Shizuoka Medical Center, Shizuoka, Japan since March in 2004.
Declaration of conflicting interests
The authors declared no potential conflicts of interest with respect to the research, authorship, and/or publication of this article.
Funding
The authors received no financial support for the research, authorship, and/or publication of this article.