
Abstract
The extent and clinical significance of stem and progenitor cell (SPC) increases in response to lower-extremity ischemia in people with peripheral artery disease (PAD) are unclear. We compared changes in SPC levels immediately following a treadmill exercise test between individuals with and without PAD. Among participants with PAD, we determined whether more severe PAD was associated with greater increases in SPCs following treadmill exercise-induced lower-extremity ischemia. We measured SPC levels in 25 participants with PAD and 20 without PAD before and immediately after a treadmill exercise test. Participants with PAD, compared to participants without PAD, had greater increases in CD34+CD45dim (+0.08±0.03 vs −0.06±0.04, p=0.008), CD34+CD45dimCD133+ (+0.08±0.05 vs −0.08±0.04, p=0.014), CD34+CD45dimCD31+ (+0.10±0.03 vs −0.07±0.04, p=0.002), and CD34+CD45dimALDH+ SPCs (+0.18±0.07 vs −0.05±0.08, p=0.054) measured as a percentage of all white blood cells. Among participants with PAD, those with any increases in the percent of SPCs immediately after the treadmill exercise test compared to those with no change or a decrease in SPCs had lower baseline ankle–brachial index values (0.65±0.17 vs 0.90±0.19, p=0.004) and shorter treadmill times to onset of ischemic leg symptoms (2.17±1.54 vs 5.25±3.72 minutes, p=0.012). In conclusion, treadmill exercise-induced lower-extremity ischemia is associated with acute increases in circulating SPCs among people with PAD. More severe PAD is associated with a higher prevalence of SPC increases in response to lower-extremity ischemia. Further prospective study is needed to establish the prognostic significance of ischemia-related increases in SPCs among patients with PAD.
Introduction
Individuals with lower-extremity peripheral artery disease (PAD) have greater functional impairment, faster functional decline, and higher rates of cardiovascular events than people without PAD.1–4 Circulating stem and progenitor cells (SPCs) may protect against these adverse outcomes in people with PAD. Previous studies have shown that bone marrow-derived and tissue-resident SPCs migrate to sites of ischemia and endothelial damage and facilitate repair of damaged tissue and promote new blood vessel formation.5–11 Higher levels of circulating SPCs after an ischemic stimulus may protect against adverse lower-extremity outcomes in people with PAD.
Coronary and lower-extremity ischemia promote surges in circulating SPCs.12–15 However, the percentage of PAD patients that have a surge in SPC levels after acute ischemia is unclear. In addition, characteristics of PAD patients that are associated with an acute SPC surge after ischemia, and the degree of increase in circulating SPCs in response to acute lower-extremity ischemia in people with PAD, are unclear.13,15 We hypothesized that lower-extremity ischemia induced by a treadmill exercise test in people with PAD would acutely increase circulating SPCs and that people with PAD would have greater acute increases than people without PAD. We further hypothesized that, among people with PAD, more severe PAD would be associated with greater increases in SPCs immediately following a treadmill exercise test. To determine whether our hypotheses are correct, we compared percent changes in circulating SPCs, measured as a percentage of all white blood cells (WBCs), after a treadmill exercise test in people with and without PAD. In addition, we studied whether more severe PAD was associated with greater acute increases in circulating SPCs after a treadmill exercise test among participants with PAD. To determine whether increases in circulating SPCs after an ischemia-inducing treadmill exercise test persist for 24 hours after the exercise test, we also compared the percent changes in circulating SPCs before and 24 hours after the treadmill exercise test in a subset of participants.
Materials and methods
The study was conducted at Northwestern University and was approved by Northwestern’s Institutional Review Board. All participants provided written, informed consent.
Participant identification
Participants were recruited for the PROgenitor cell release Plus Exercise to improve functionaL performance in PAD (PROPEL) Study. 16 Participants evaluated for eligibility for the PROPEL Study were invited to participate. Recruitment methods for PROPEL included radio and newspaper advertising, mailed postcards to men and women aged 60 years and older, posted flyers, and mailed letters to patients with PAD at Northwestern Medical Center. 16 Potential participants were first assessed for eligibility by telephone using a standardized interview. Those who remained eligible after telephone assessment were scheduled for a baseline study visit.
Inclusion and exclusion criteria
Inclusion criteria for PAD participants were as follows: (a) an ankle–brachial index (ABI) measurement of less than or equal to 0.901,3; (b) an ABI greater than 0.90 but less than 1.00 in conjunction with a 20% drop in ABI after heel-rise exercise; and (c) an accredited vascular laboratory report consistent with PAD based on abnormal toe pressures (toe pressure < 0.70 in either leg). As previously reported, 16 exclusion criteria included: (a) below or above knee amputation or critical limb ischemia; (b) foot/leg amputation or gangrene; (c) wheelchair confinement; (d) use of a walking aid other than a cane; (e) nursing home residence; (f) cancer treatment within the past 3 years; (g) communication difficulty due to language barriers; (h) Parkinson’s disease; (i) walking performance primarily limited by a condition other than PAD; (j) significant hearing or visual impairment; (k) greater than a Class II New York Heart Association heart failure or angina; (l) angina at rest or an increase in angina symptoms during the previous 6 months; (m) severe aortic stenosis; (n) an abnormal or uninterpretable baseline exercise treadmill test; (o) walking limitations for a reason other than ischemic leg pain; (p) foot ulcers; (q) lower-extremity revascularization during the past 9 months; (r) major orthopedic surgery during the past 6 months; (s) coronary artery bypass grafting during the previous 3 months; (t) current participation in another clinical or exercise trial other than PROPEL; (u) participation in another clinical trial during the past 3 months; and (v) participation in cardiac rehabilitation during the past 6 months.
ABI measurement
After participants rested in the supine position for 5 minutes, a handheld Doppler probe (Pocket-Dop II; Nicolet Vascular, Golden, CO, USA) was used to measure systolic blood pressures in the following order: right brachial, dorsalis pedis, and posterior tibial arteries; left dorsalis pedis, posterior tibial, and brachial arteries. Measures were repeated in reverse order. The ABI was calculated by dividing average pressures in each leg by the average of the four brachial pressures. 17
Participant characteristics
Leg symptoms were classified into one of five groups using the San Diego Claudication Questionnaire 3 according to previously defined methods: classic intermittent claudication, leg pain on exertion and at rest, atypical exertional leg pain, leg pain/carry on, and asymptomatic (i.e. no exertional leg pain). Patient characteristics including age, ethnicity, smoking history, medications, comorbidities, and physical activity were obtained via standardized questionnaires administered by a certified health interviewer. The Walking Impairment Questionnaire was administered to determine self-reported PAD-related walking limitations, including walking distance, walking speed, and stair-climbing. 18 In the Walking Impairment Questionnaire distance score and the Walking Impairment Questionnaire speed score, participants recorded the degree of difficulty for walking specific distances and for walking one block at specific speeds, respectively. In the Walking Impairment Questionnaire stair-climbing score, participants reported the degree of difficulty climbing one, two, and three flights of stairs. Participant-rated scores were multiplied by a pre-specified weight for each distance, speed, or number of stair flights. The products were summed and divided by the maximum possible score, producing a percentage score ranging from 0 (inability to perform any of the tasks) to 100 (no difficulty with any of the walking or stair-climbing measures).
Body mass index (BMI)
Height and weight were measured at the study visit and the BMI was calculated by dividing the weight in kilograms by height in meters squared.
Treadmill exercise test
Maximal treadmill walking distance and distance to onset of leg symptoms was measured using the Gardner–Skinner protocol. 19 In this protocol, speed is maintained at 2.0 miles per hour (mph), and the treadmill grade is increased by 2.0% every 2 minutes. Participants unable to walk 2.0 mph started at a treadmill speed of 0.50 mph. The speed was then increased by 0.50 mph every 2 minutes until the participant reached 2.0 mph, after which the treadmill grade was increased by 2.0% every 2 minutes. Maximal walking time and time of leg symptom onset was recorded.
Six-minute walk test
Participants were provided with standardized instructions to walk continuously with the goal of covering as much ground as possible within 6 minutes. Participants walked back and forth along a 100-foot hallway for 6 minutes and the total distance walked was recorded.1–3,20 If necessary, participants were allowed to rest. The 6-minute walk test is more closely correlated with walking performance during daily life as compared to the treadmill exercise test in people with PAD. 21
Four-meter walking velocity
Walking velocity was measured over a 4-meter distance at usual pace and at fast pace.2,3,20 Each walk was performed twice. The fastest walk in each pair was used in the analyses.
Blood collection
Peripheral blood was collected in EDTA tubes (BD Biosciences, San Jose, CA, USA) pre-treadmill exercise test, 15 minutes after the treadmill exercise test, and, in a subset of participants, at 24 hours after the treadmill exercise test. SPC levels were measured within 2 hours of the blood draw. Two groups of participants were recruited. Group 1 was recruited between October 2012 and June 2013 and provided blood samples immediately after the treadmill stress test. Group 2 was recruited between June 2013 and August 2013 and provided samples both immediately after the treadmill stress test and 24 hours after the treadmill stress test.
Flow cytometry
The technician performing the flow cytometric procedure was blinded to participant status (i.e. PAD vs non-PAD). Red blood cells were lysed with freshly prepared lysis buffer (155 mM NH4Cl, 10 mM KHCO3, 0.1 mM EDTA in deionized water). Cells were counted using the Countess® Automated Cell Counter (Life Technologies, Carlsbad, CA, USA) and stained with LIVE/DEAD® Fixable Dead Cell Stains (Life Technologies) to detect dead cells by flow cytometry. Cells were incubated with Fc receptor blocking reagent (Miltenyi Biotec, Inc., San Diego, CA, USA) and with the following antibody cocktail: CD34 VioBlue (Miltenyi Biotec), CD133-APC (Miltenyi Biotec), CD45 AlexaFluor 700 (BD Biosciences), CD31 (PECAM-1) APC-eFluor® 780 (eBioscience, Inc., San Diego, CA, USA), and CD235a PerCP-eFluor®710 (eBioscience, Inc.). Aldehyde dehydrogenase (ALDH) activity was measured in a subset of the samples to ensure that detected cells were progenitor cells using the ALDEFLUOR™ reagent (STEMCELL Technologies, Vancouver, Canada). Stained samples were acquired using a BD LSR II (BD Biosciences). A Fluorescence Minus One control was employed to establish an unbiased gating strategy for antibodies without a clear positive population. Spectral overlap between fluorochromes was compensated using OneComp eBeads (eBioscience, Inc.) stained with the antibodies used in the antibody cocktail. Data were analyzed using FlowJo software (Tree Star Inc., Ashland, OR, USA). Vascular endothelial growth factor receptor 2 (VEGFR2) expression was not quantified since we did not find any commercially available anti-VEGFR2 antibodies that could be optimally titrated similar to previous reports (data not shown).22,23 A modified gating strategy established by the International Society for Hematotherapy and Graft Engineering was used 24 and described in Figure 1. As can be seen by Figure 1, we gated on all CD45+ cells since the cells outside of our CD45+ cell gate are negative for CD45 and express CD235 (a red blood cell marker) or are debris. SPCs express lower levels of CD45 than hematopoietic cells and can be interchangeably identified as CD45dim or CD45lo. After gating on CD34+ cells, we ensured that the CD34+ population was CD45dim (or CD45lo). We defined SPCs as CD45dimCD34+, CD45dimCD34+CD133+, CD45dimCD34+CD31+, and CD45dimCD34+ALDH+. The percent of SPCs were calculated by dividing the total number of detected SPCs by the total number of WBCs. Test–retest reliability of the instrument and SPC isolation was also determined. The coefficient of variation for these tests was 3.0% for CD34+CD45dimALDH+, 4.5% for CD34+CD45dim, 5.1% for CD34+CD45dimCD133+, and 3.1% for CD34+CD45dimCD31+ SPC measures (Figure 2B). All original FACS data and its associated analysis are stored on an external hard drive. An additional backup of all data is stored on a second external hard drive.
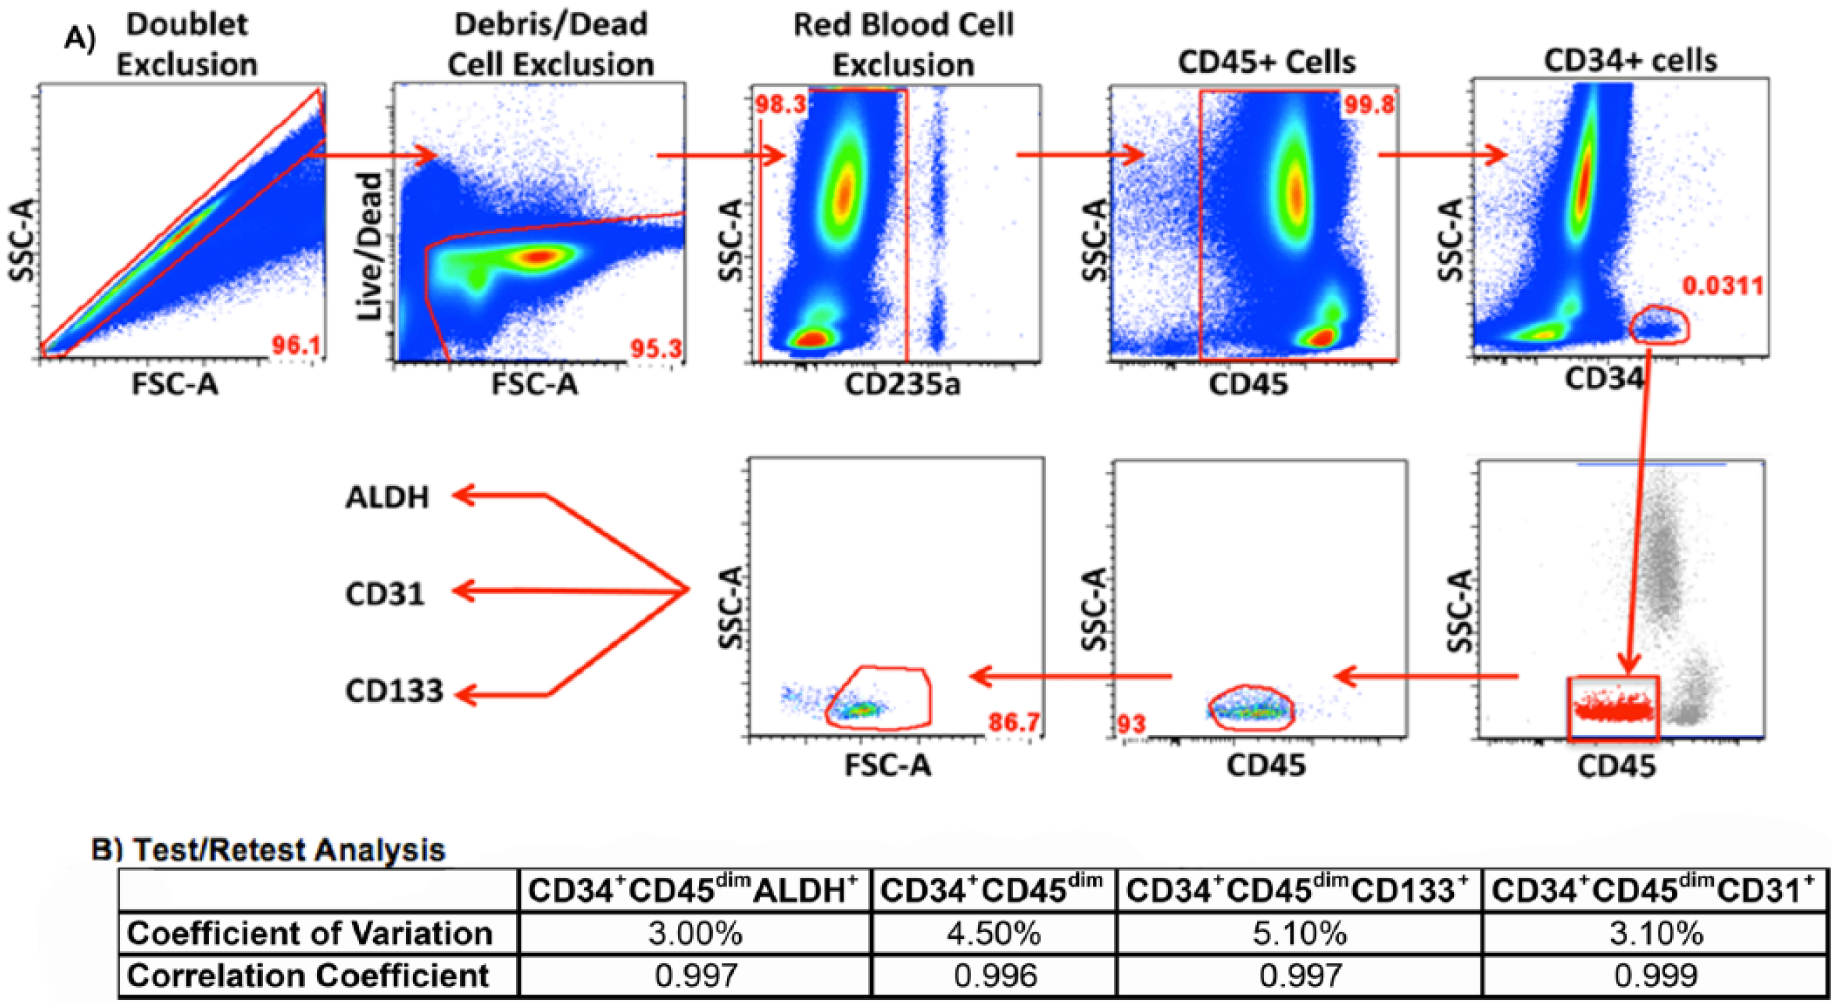
Gating strategy and test–retest reliability of stem and progenitor cell measurements by FACS analysis. (A) CD45+ cells were analyzed after doublet, debris, dead cell and red blood cell exclusion. The CD34+ cell fraction was then identified and further purified by removing any cells that express high levels of CD45 and low forward scatter properties. Expression of ALDH, CD133, and CD31 were then analyzed. This strategy is a modification of the previously published, widely used International Society for Hematotherapy and Graft Engineering gating strategy. 24 (B) Coefficient of variation and correlation coefficients of the test–retest analysis of CD34+CD45dimALDH+, CD34+CD45dim, CD34+CD45dimCD133+, and CD34+CD45dimCD31+ SPC populations are listed.
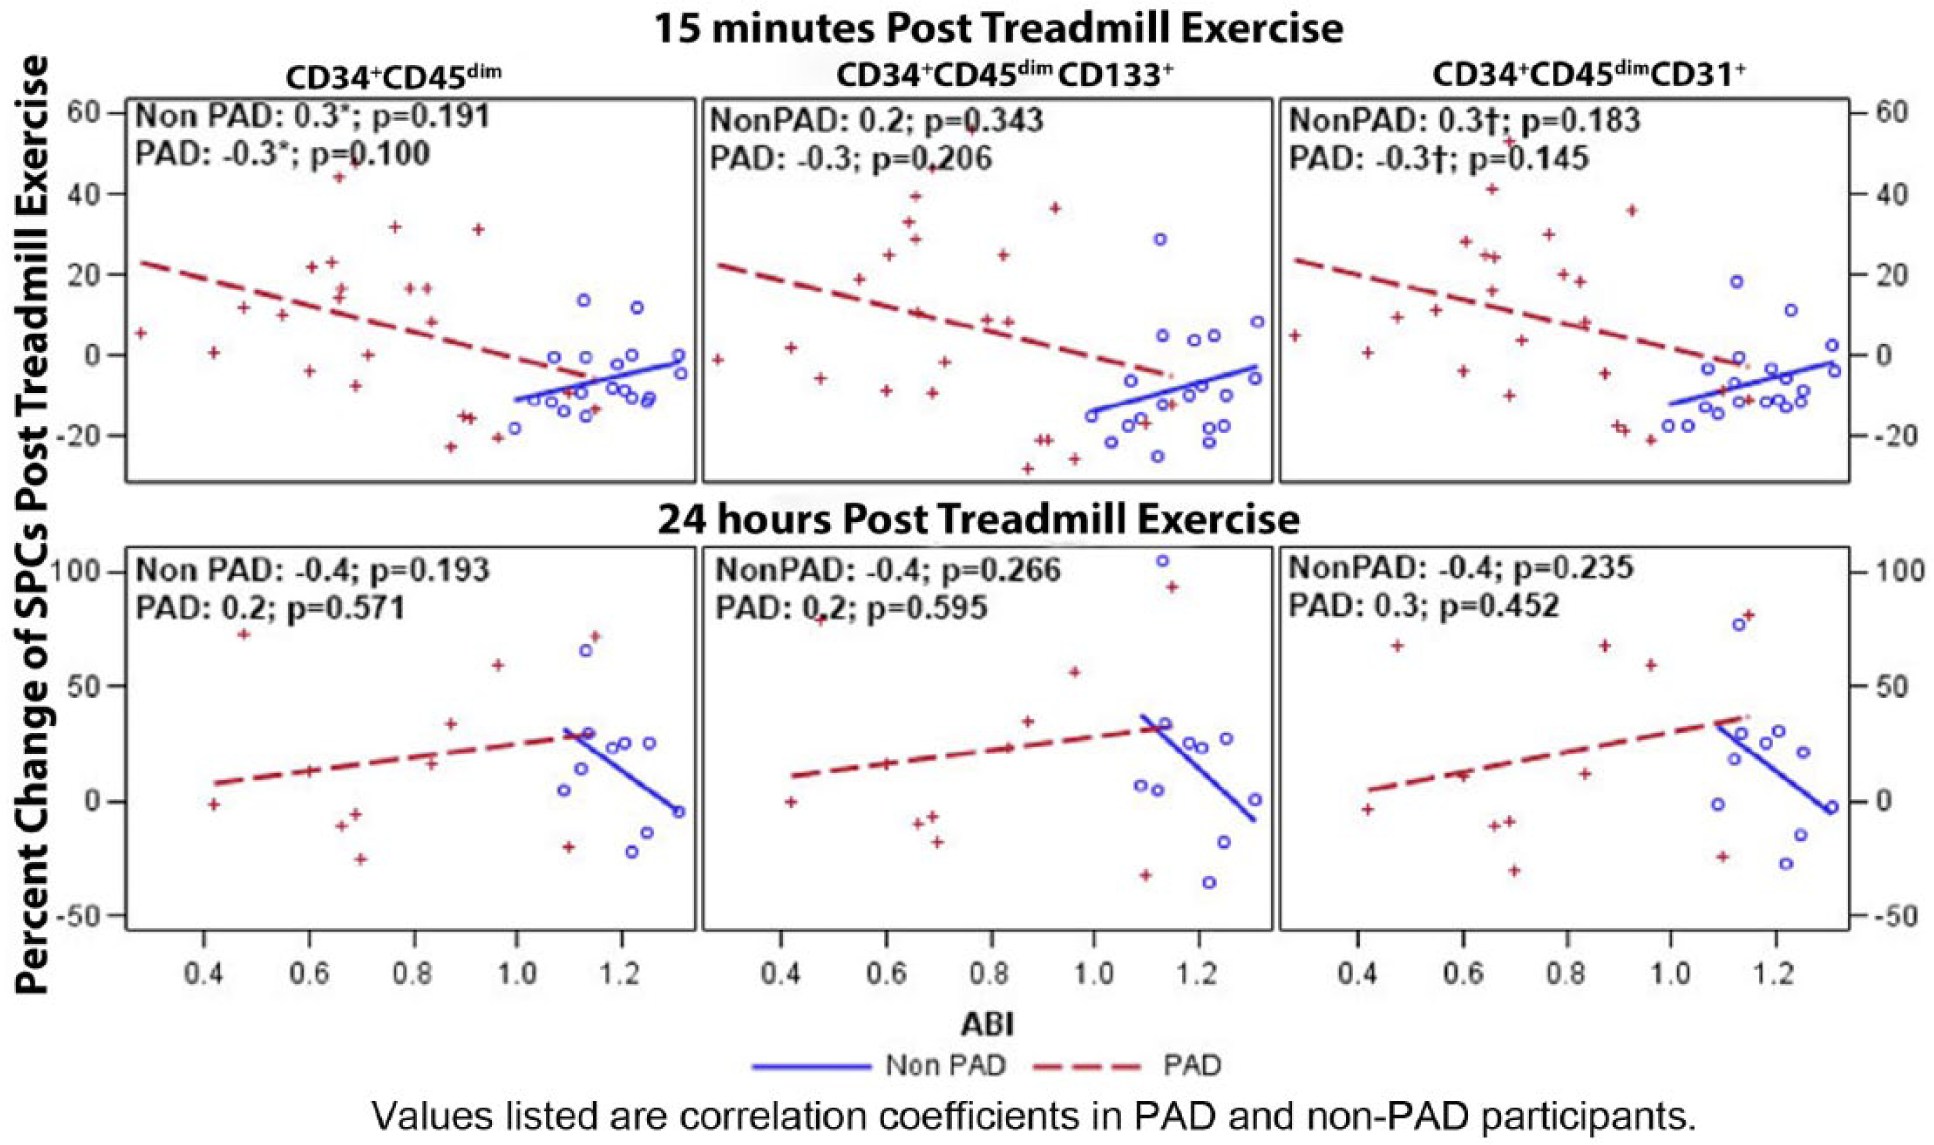
Association of percent change of stem and progenitor cells (SPCs) 15 minutes and 24 hours post treadmill exercise test with ankle–brachial index (ABI) scores among participants with and without peripheral artery disease (PAD). Scatter plot depicting the correlation between ABI and SPC changes. Correlation coefficients of the relationship between ABI and SPC changes for 24 PAD and 19 non-PAD participants (Groups 1 and 2, combined) at 15 minutes post treadmill exercise test and 11 PAD and 10 non-PAD participants (Group 2) at 24 hours post treadmill exercise test are listed on the scatter plots. Values listed are correlation coefficients in PAD and non-PAD participants.
Statistical analysis
Baseline characteristics were compared between PAD and non-PAD participants using two-sample, two-sided t-test and chi-squared test, when appropriate. Similarly, the two-sample t-test and chi-squared test were used to compare the continuous and categorical characteristics between the two groups of participants (with versus without PAD) at baseline, 15 minutes and 24 hours after an ischemia-inducing treadmill exercise test. Comparisons of changes in circulating SPC percentages after the treadmill exercise test between the PAD and non-PAD cohorts were assessed using analysis of covariance adjusting for age, sex, race and the presence of diabetes. Participants were categorized according to whether or not the percentage of circulating SPCs increased after the treadmill exercise test. The association between PAD status and the probability of experiencing increases in circulating SPCs after the treadmill exercise test was evaluated using Fisher’s exact test. Clinical characteristics between PAD participants with and without an SPC increase at 15 minutes and 24 hours after the treadmill exercise test were also determined within the PAD cohort and were compared using a two-sample t-test for continuous characteristics and chi-squared test for categorical characteristics. Lastly, regression analysis was used to study the correlation between ABI and percent SPC increase in PAD and non-PAD participants separately. Statistical significance was established at p < 0.05. All statistical analyses were performed in SAS, version 9.4.
Results
A total of 25 PAD and 20 non-PAD participants completed the treadmill exercise test and follow-up SPC measurement at either 15 minutes and/or 24 hours after the treadmill exercise test. Participants were recruited in two groups: 14 PAD and 10 non-PAD participants were recruited into Group 1 and provided blood samples immediately after the treadmill stress test, 11 PAD and 10 non-PAD participants were recruited into Group 2 and provided samples immediately after and at 24 hours after the treadmill stress test. One PAD and one non-PAD participant in Group 2 were only able to provide a 24-hour sample. PAD participants had significantly poorer 6-minute walk and treadmill exercise walking times compared to participants without PAD (Table 1). When SPCs were measured as a percent of the total WBC population, PAD participants in Groups 1 and 2 combined had greater increases in mean SPC percentages for CD34+CD45dim, CD34+CD45dimCD133+, CD34+CD45dimCD31+ and CD34+CD45dimALDH+ SPC populations compared to non-PAD participants 15 minutes after an ischemia-inducing treadmill exercise test (Table 2). However, in Group 2, 24 hours after the treadmill exercise test, SPC percentages increased in both PAD and non-PAD participants similarly, and there were no difference in the degree of change in any SPC percentages 24 hours after the treadmill exercise test (Table 2). There were also no differences in WBC counts between PAD and non-PAD participants at either 15 minutes or 24 hours after the treadmill exercise test (Table 2).
Comparison of participants with and without peripheral artery disease (PAD).
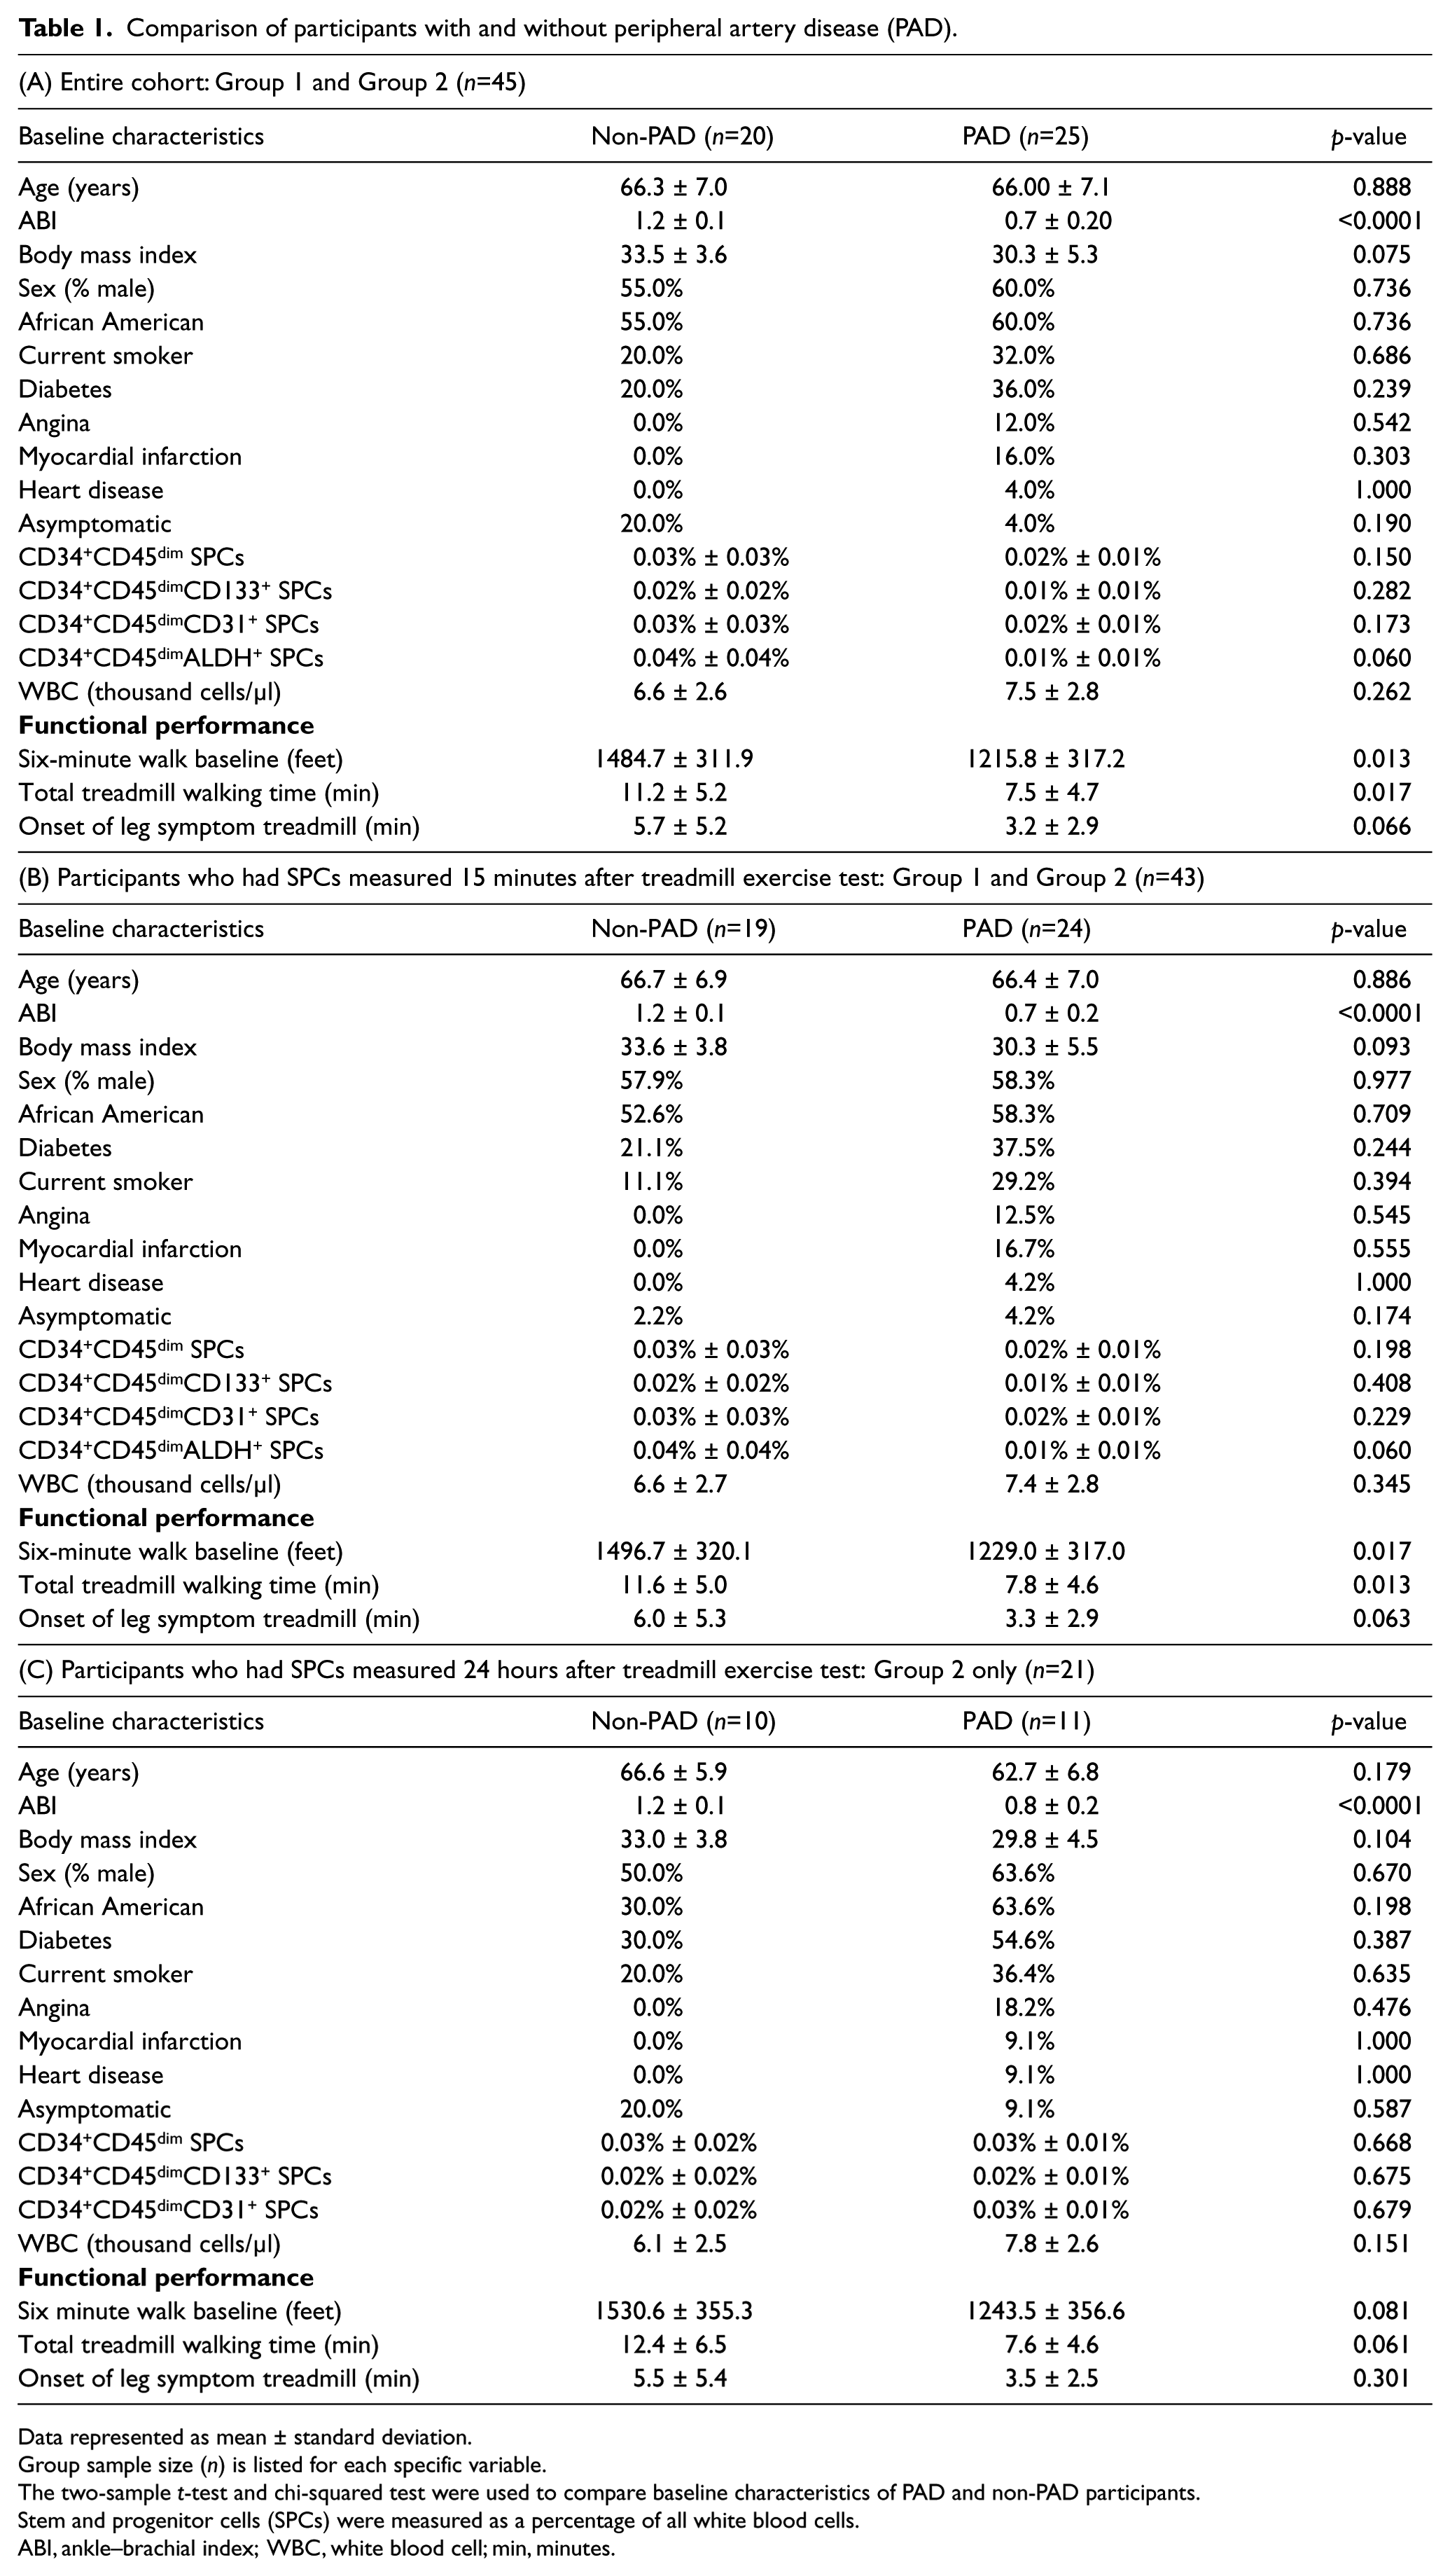
Data represented as mean ± standard deviation.
Group sample size (n) is listed for each specific variable.
The two-sample t-test and chi-squared test were used to compare baseline characteristics of PAD and non-PAD participants.
Stem and progenitor cells (SPCs) were measured as a percentage of all white blood cells.
ABI, ankle–brachial index; WBC, white blood cell; min, minutes.
Percent change of circulating stem and progenitor cells (SPCs) 15 minutes and 24 hours after the treadmill exercise test in participants with and without peripheral artery disease (PAD).
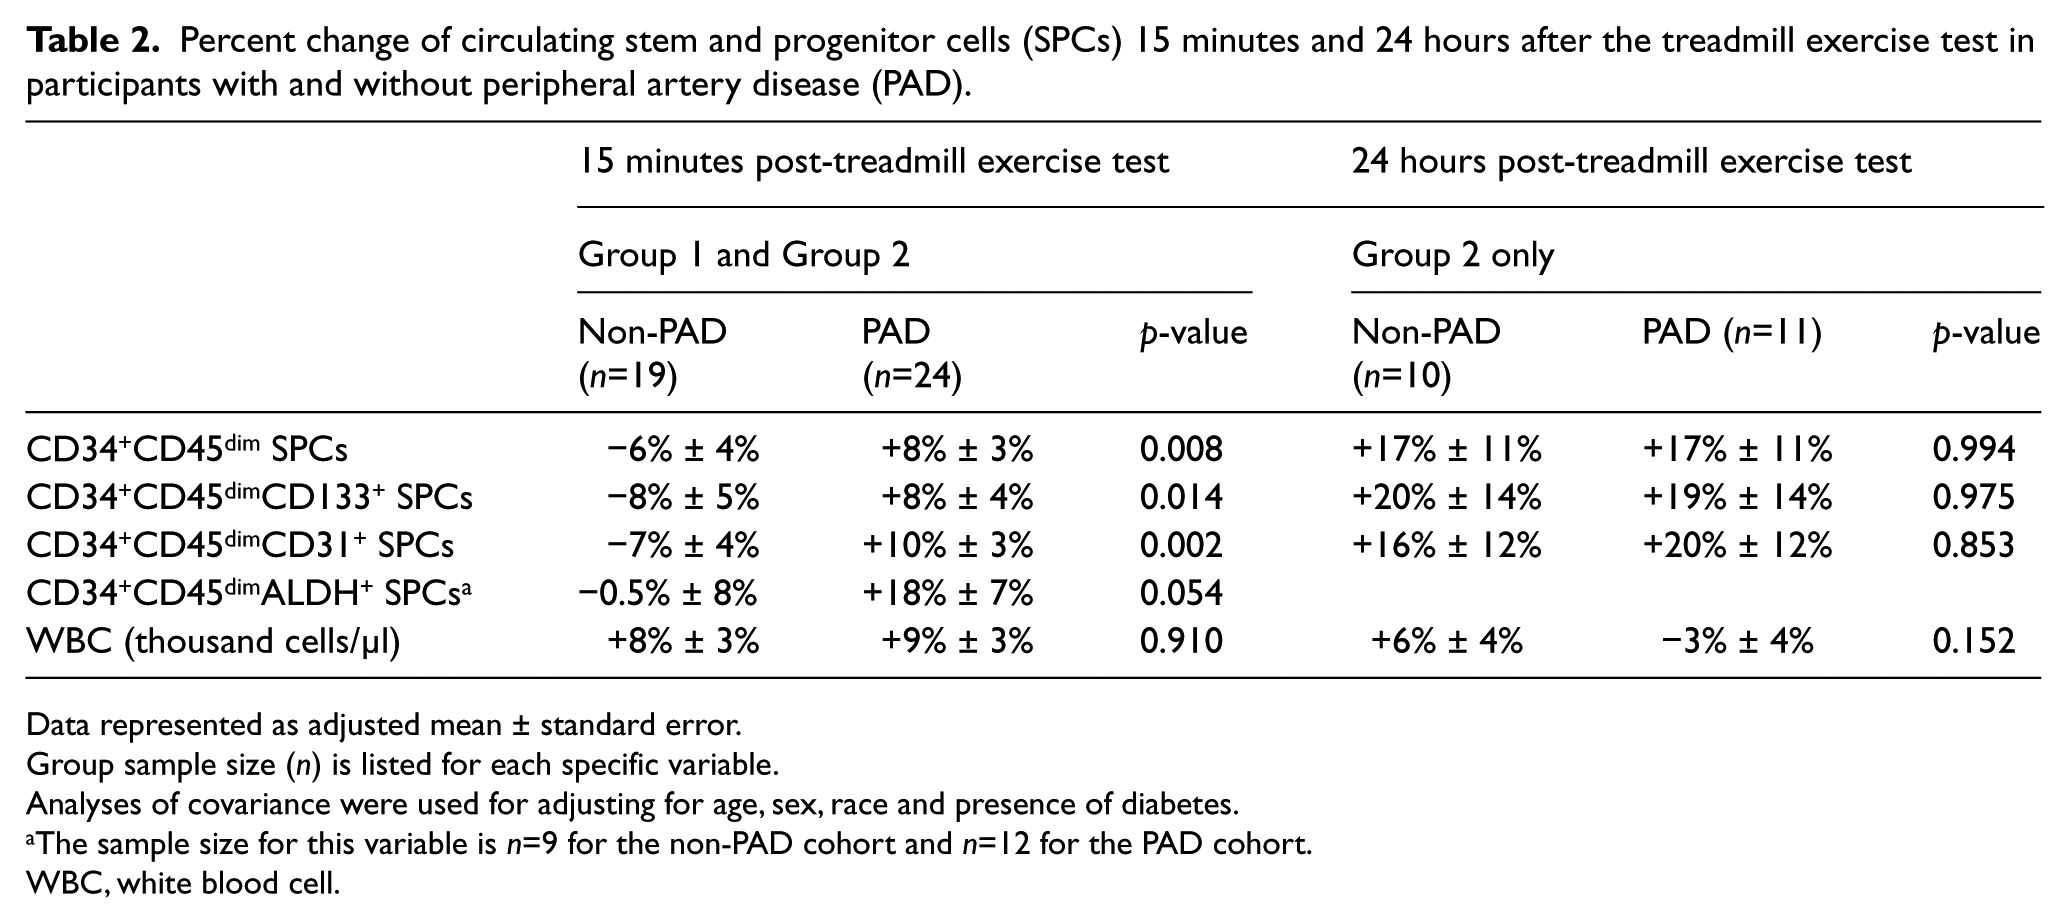
Data represented as adjusted mean ± standard error.
Group sample size (n) is listed for each specific variable.
Analyses of covariance were used for adjusting for age, sex, race and presence of diabetes.
The sample size for this variable is n=9 for the non-PAD cohort and n=12 for the PAD cohort.
WBC, white blood cell.
In Groups 1 and 2 combined, 15 minutes after the treadmill exercise test, 15/24 (63%) PAD participants versus 3/19 (16%) non-PAD participants (p=0.004) had higher circulating percentages of CD34+CD45dimCD133+ SPCs and 16/24 (67%) PAD participants versus 3/19 (16%) non-PAD participants (p=0.002) had higher percentages of CD34+CD45dimCD31+ SPCs compared to baseline values (Table 3). In Group 2, 24 hours after the treadmill exercise test, there were no significant differences in the degree of increase in the percentage of SPCs between the PAD and non-PAD populations (Table 3). These results indicate that compared to participants without PAD, a higher percentage of PAD participants experienced an increase of CD34+CD45dim and CD34+CD45dimCD31+ SPCs at 15 minutes post treadmill exercise test, but not at 24 hours after the treadmill exercise test.
The proportion of peripheral artery disease (PAD) and non-PAD participants who experienced any increase in percentages of circulating stem and progenitor cells (SPCs) relative to baseline 15 minutes and 24 hours after a treadmill exercise test. a
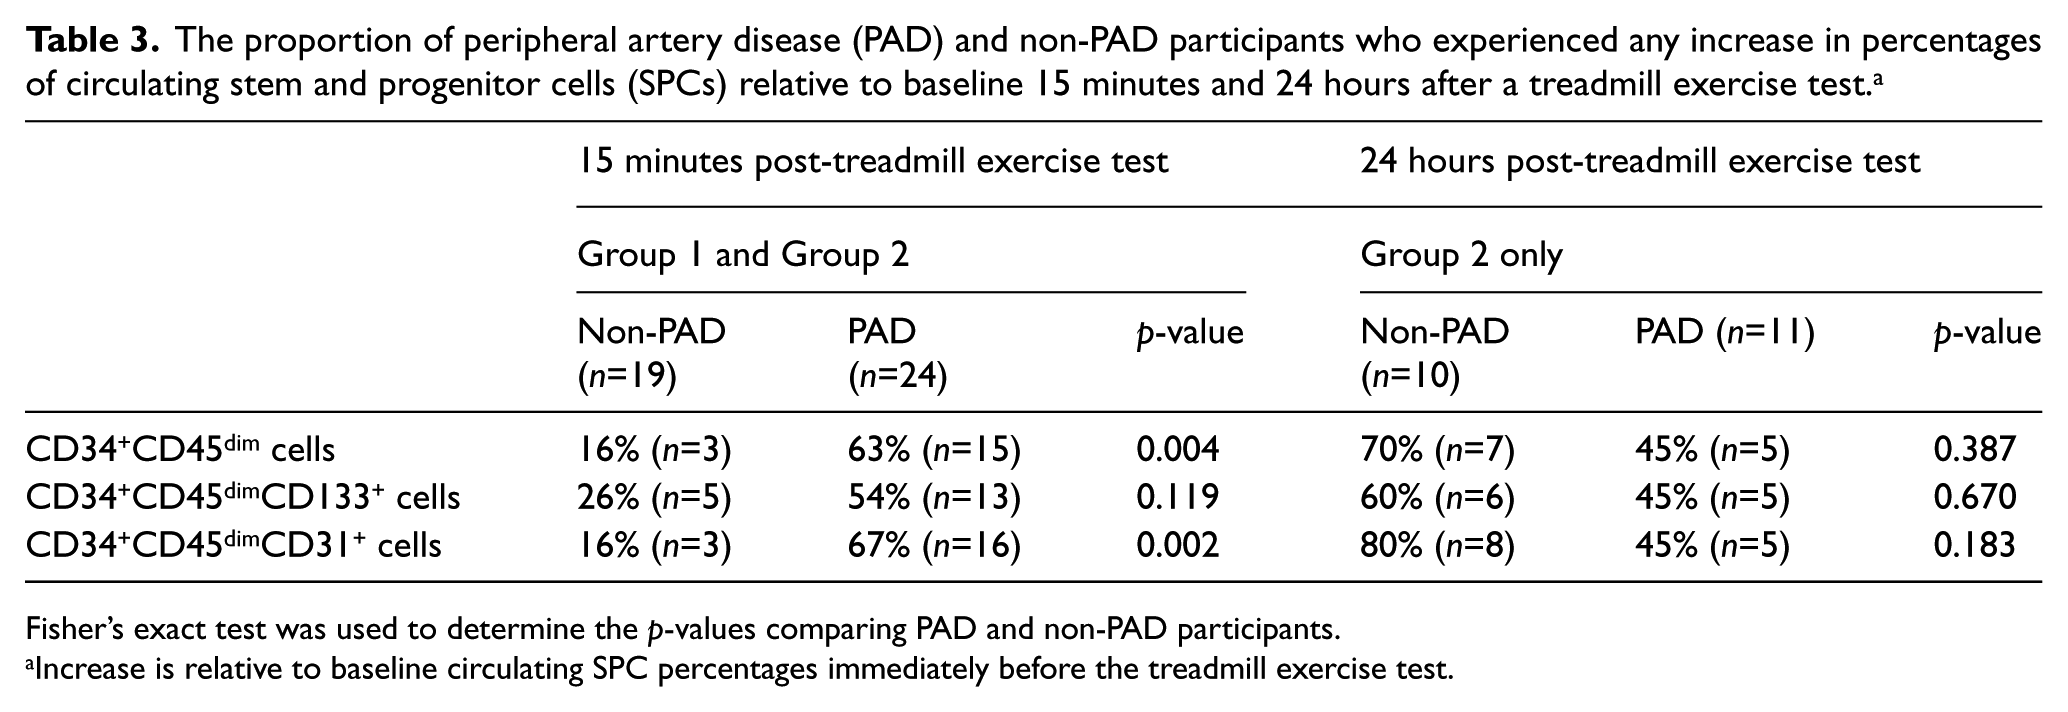
Fisher’s exact test was used to determine the p-values comparing PAD and non-PAD participants.
Increase is relative to baseline circulating SPC percentages immediately before the treadmill exercise test.
Clinical characteristics and functional performance were compared between PAD participants with increases in SPC percentages versus PAD participants without increases in SPC percentages in both Group 1 and Group 2 at 15 minutes after the ischemia-inducing treadmill exercise test. PAD participants with increases in percent of CD34+CD45dim and CD34+CD45dimCD31+ SPC cells had lower ABI values and shorter pain-free treadmill walking times than participants without SPC increases (Table 4). Participants with larger percent increases in CD34+CD45dimCD133+ SPCs had shorter pain-free walking times than PAD participants without SPC increases (Table 4). Although PAD participants with greater increases in SPCs after the treadmill exercise stress test had lower baseline SPC percentages than those without an increase after the treadmill exercise, these differences were not statistically significant (Table 4).
Clinical characteristics associated with any increase in stem and progenitor cell (SPC) levels 15 minutes after treadmill exercise test among participants with peripheral artery disease (PAD) in Group 1 and Group 2 (n=24).
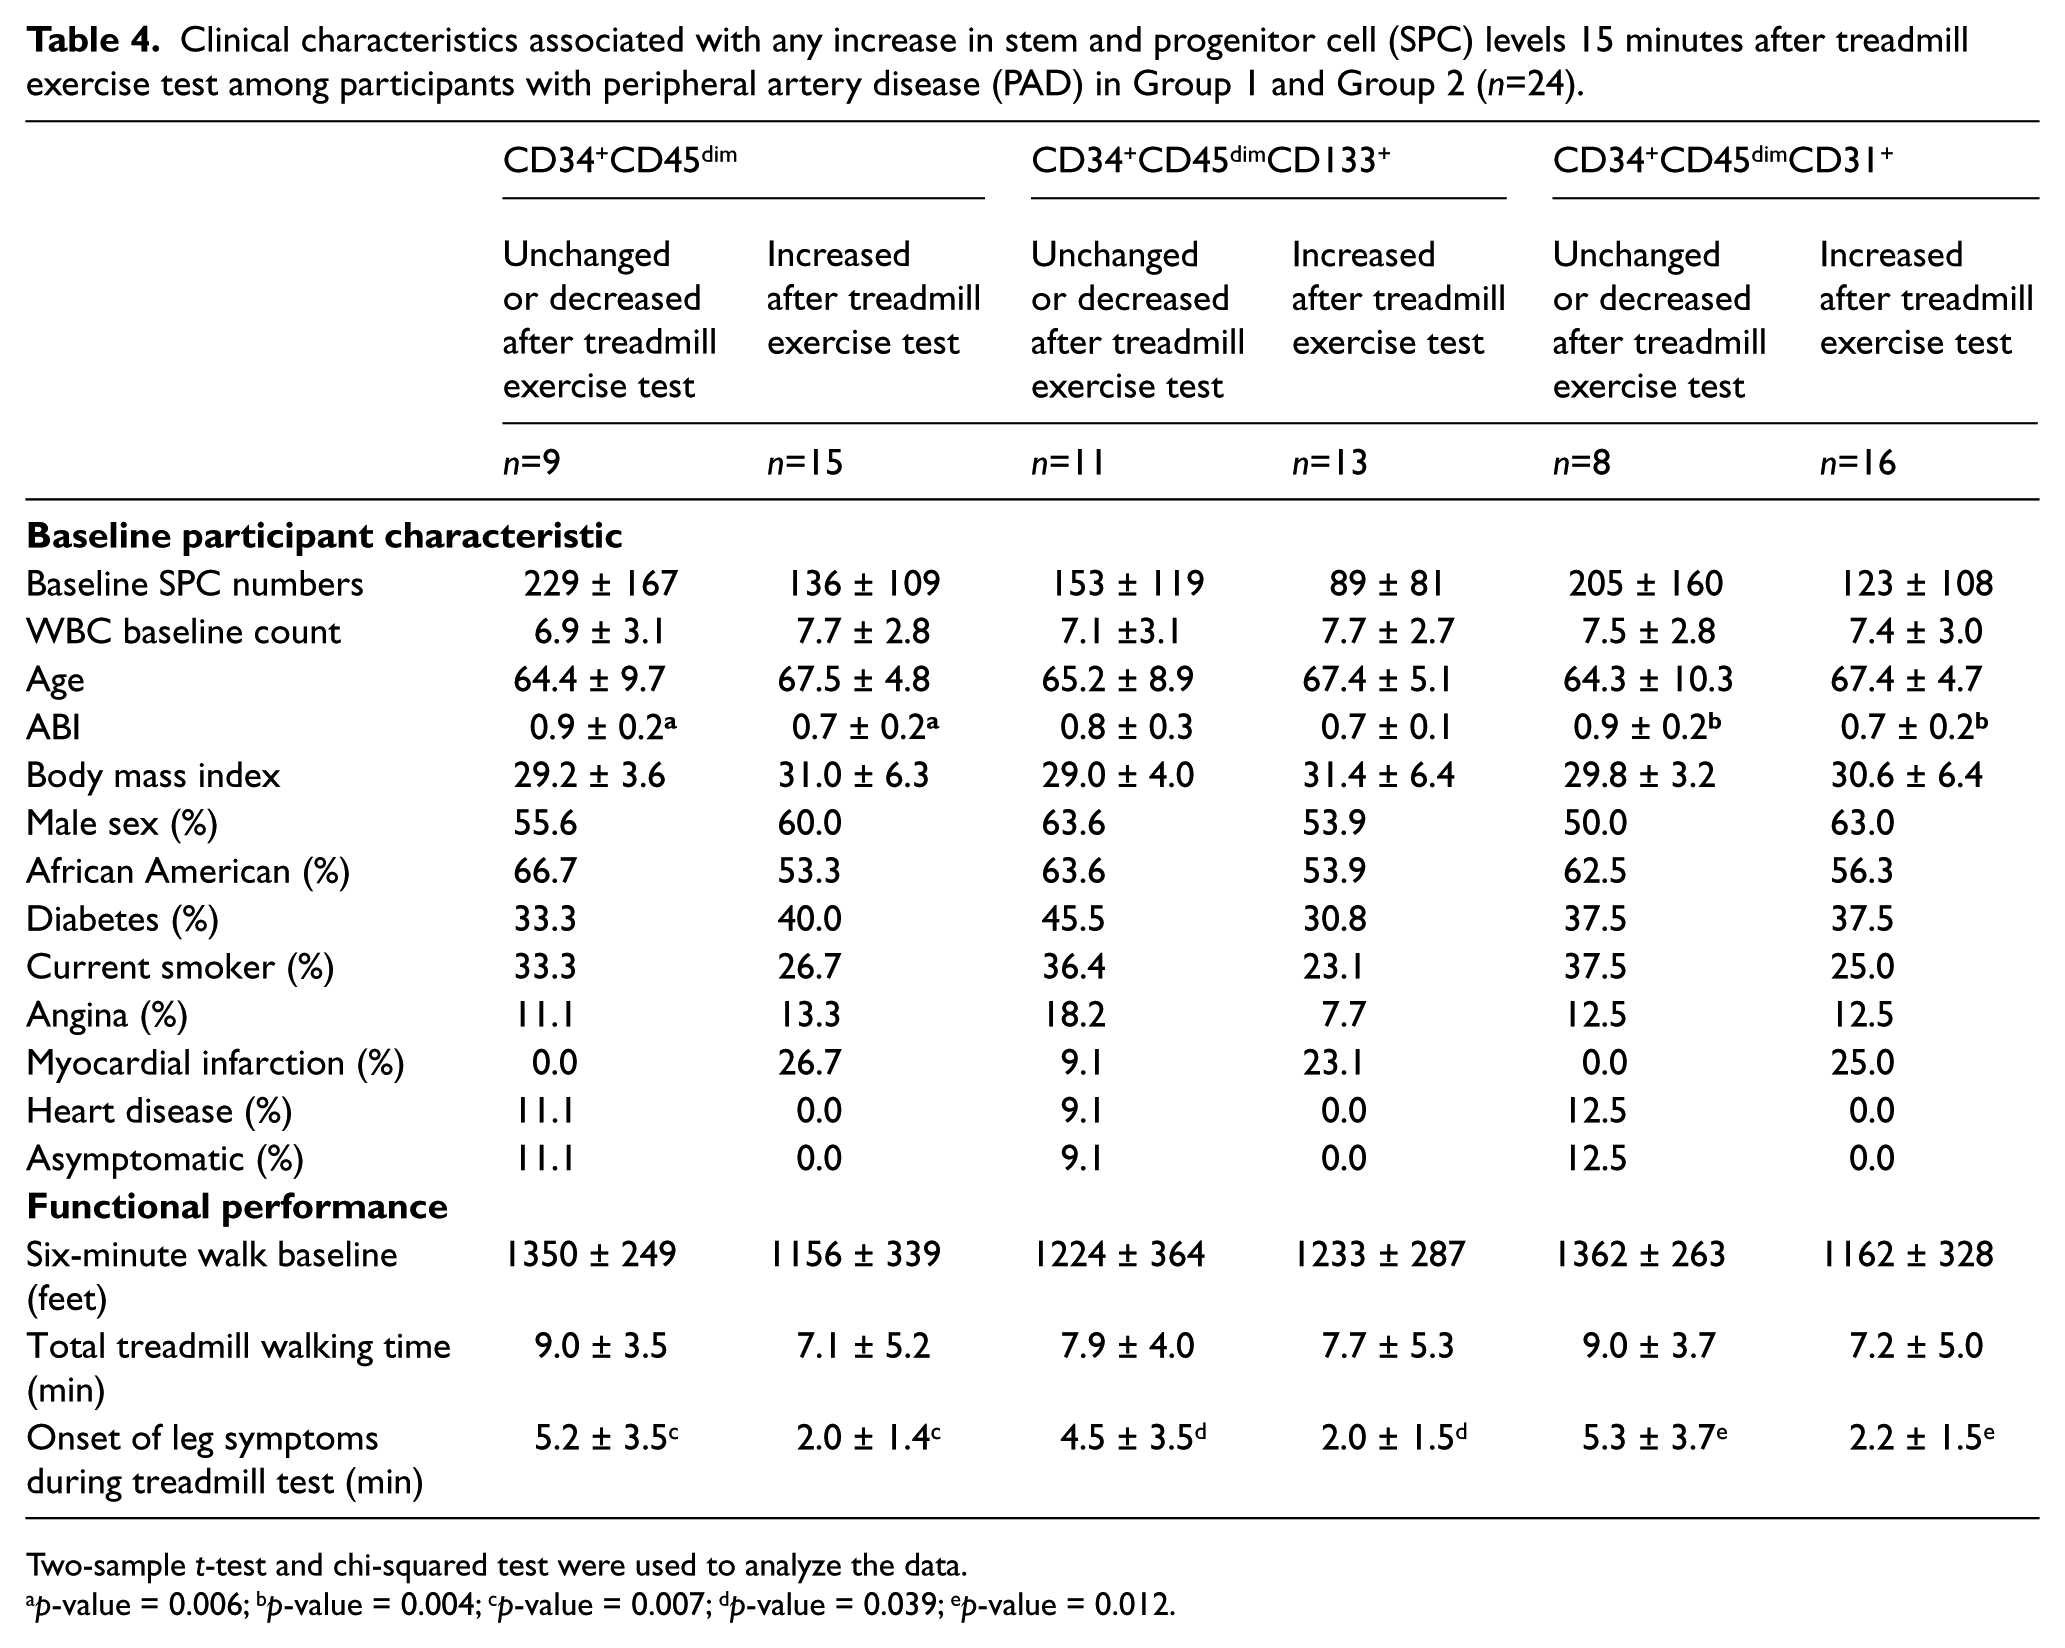
Two-sample t-test and chi-squared test were used to analyze the data.
p-value = 0.006; bp-value = 0.004; cp-value = 0.007; dp-value = 0.039; ep-value = 0.012.
Discussion
The results reported here show that participants with PAD experienced significant increases in circulating percentages of some SPC populations 15 minutes after a treadmill exercise stress test compared to non-PAD participants. However, no differences in the percentage increase in SPCs between PAD and non-PAD participants were observed 24 hours after the treadmill exercise test. Additionally, 15 minutes after the treadmill exercise stress test a significantly higher proportion of PAD participants experienced increases in CD34+CD45dim and CD34+CD45dimCD31+ SPC cells than non-PAD participants. In the PAD participant cohort, the presence of any increase in the percentages of CD34+CD45dim and CD34+CD45dimCD31+ 15 minutes after the treadmill exercise test was associated with lower ABI values and shorter pain-free treadmill walking times. The presence of any increase in the percentage of CD34+CD45dimCD133+ SPC 15 minutes after the treadmill exercise test was associated with shorter pain-free treadmill walking times among participants with PAD. These results demonstrate that among individuals with PAD, severe PAD is associated with larger increases in some SPC populations 15 minutes following treadmill exercise-induced leg ischemia.
The absence of acute changes in SPC percentages immediately after the exercise treadmill test in participants without PAD is likely due to the absence of ischemia, a proposed stimulus for increasing circulating SPC levels. Despite walking for a shorter time period on the treadmill, participants with PAD had greater increases in the percent of circulating SPCs compared to non-PAD participants at 15 minutes after the treadmill exercise test. Twenty-four hours after the treadmill exercise test, differences in percent increases in SPCs were not observed between PAD and non-PAD participants. The lack of association between PAD and an increase in SPCs 24 hours after the treadmill exercise test may be explained by several reasons. First, acute ischemia in participants with PAD may trigger an immediate release of SPCs from the spleen and explain the acute increase in SPC percentages at 15 minutes after the treadmill exercise test. Second, the bone marrow of PAD participants may be incapable of longer-term (i.e. 24 hours later) release of SPCs after an ischemic stimulus, perhaps because of ‘exhaustion’ or lack of reserve of the bone marrow pool of SPCs in individuals with PAD. Third, SPCs are capable of undergoing only a finite number of cell divisions and may have entered a senescent state 24 hours after the ischemic stimulus. Fourth, SPC survival and differentiation may have been reduced in the participants with PAD. Fifth, circulating SPCs in PAD participants may have migrated to the site of ischemia and, therefore, may not have been detectable in the peripheral blood 24 hours after the ischemic stimulus. Sixth, the peak SPC response of participants without PAD may have occurred 24 hours after the treadmill exercise test and may explain why there were no differences between PAD and non-PAD participants at the 24-hour time point. Additional studies are necessary to determine which of these possibilities are correct. Although circadian variation may explain some of our findings, the fact that we measured SPCs immediately after the exercise stress test and 24 hours after the exercise stress test should have minimized any circadian variation effect on the SPC measures.
Several SPC mobilizing agents have been tested for treating people with PAD. These agents include vascular endothelial growth factor and granulocyte macrophage colony-stimulating factor (GM-CSF), for example.25,26 Most of these studies showed no benefits of the SPC mobilizing agents for improving outcomes in PAD. The largest randomized trial to test the ability of GM-CSF to improve walking performance in people with PAD showed no benefit for the primary outcome measure of improved treadmill walking performance. 27 The ongoing PROPEL study will test the ability of GM-CSF combined with the ischemic stimulus of supervised treadmill exercise to improve walking performance in people with PAD. 16
Previous studies reported that individuals with higher levels of SPCs in the setting of a myocardial infarction or stroke had better outcomes than individuals with lower levels of SPCs.28,29 These studies assessed the levels of CD34+VEGFR2+ cells and non-adhering peripheral blood mononuclear colony-forming cells, respectively. However, the prognostic significance of ischemia-induced increases in circulating SPCs among participants with PAD is unclear. Data reported here, for the first time, demonstrate that PAD participants with more severe PAD and shorter pain-free walking time on the treadmill have higher circulating levels of SPCs after an ischemia-inducing treadmill exercise test. The prognostic significance of these findings for patients with PAD is unclear.
Previous findings regarding the association of ischemia-inducing exercise on circulating SPC levels in people with PAD have been inconsistent.15,30 Shaffer et al. reported no increases in CD34+VEGFR2+ SPC levels after ischemia-inducing exercise in participants with PAD compared to participants without PAD. 13 However, in the study by Shaffer et al., non-PAD and PAD participants were limited to a maximum time of 10 minutes on the treadmill exercise test, which may have limited the intensity of the induced lower leg ischemia and observed SPC changes. Sandri et al. demonstrated that percentages of SPCs in PAD and non-PAD participants increased up to 72 hours after the treadmill exercise test, with a peak response at 24 hours. 30 In contrast to findings reported here, Sandri et al. also demonstrated that non-PAD participants had significantly greater increases of CD34+VEGFR2+ SPCs than PAD participants at 24 hours. Variations in the degree of ischemia attained or in patient populations may account for differences observed across these studies. In the study by Shaffer et al., participants exercised for no more than 15 minutes, even if they did not experience ischemic leg symptoms. Additionally, Sandri et al. measured SPCs 2 hours post-exercise and may have missed the peak levels of SPCs. Inconsistent methods to identify SPCs may also have contributed to these inconsistent results. Shaffer et al. and Sandri et al. used VEGFR2 in the quantification of SPCs. However, measurement of VEGFR2 antibodies may be unreliable. 22 In addition, these studies did not use the currently preferred ISHAGE-based gating strategy. These disparate methods may have contributed to the absence of an increase in SPCs after exercise in the study by Shaffer et al.
Limitations
Our study has limitations. First, the sample size was small and findings need to be confirmed in a larger sample size. Second, the study is cross-sectional and causal inferences cannot be made. Third, results may not be generalizable to people who did not meet the inclusion criteria for the PROPEL study. Fourth, SPC function was not measured. Fifth, the presence and degree of ischemia at the completion of the treadmill exercise test was not measured with ABI values after the treadmill exercise test. However, participants were urged systematically to walk as long as possible during the exercise treadmill test. Sixth, since SPCs were measured only at two time points, it is difficult to decipher the exact trend of SPC release after an ischemia-inducing treadmill exercise test. Also, for that reason, the peak SPC responses of non-PAD participants might have been missed since SPCs were measured at only 15 minutes and 24 hours after exercise. Seventh, there may be circadian variation in SPC levels that may have affected results reported here. However, we measured SPC percentages immediately after treadmill exercise and 24 hours after treadmill exercise. This study design should have minimized circadian variation.
Conclusions
In summary, PAD participants have significantly greater increases in SPC levels 15 minutes but not 24 hours after a treadmill exercise test compared to participants without PAD. PAD participants with increases in the percentage of SPCs after an ischemic stimulus have more severe PAD and shorter pain-free treadmill walking time. Further study is needed to establish the prognostic significance of SPC elevations following leg ischemia in participants with PAD.
Footnotes
Acknowledgements
We should like to thank Katherine Barnes for her contribution to this work.
Declaration of conflicting interest
The authors declare that there is no conflict of interest.
Funding
The study was funded by the National Heart, Lung, and Blood Institute (R01-HL107510) and the National Institute of Health’s Intramural Program of the National Institute on Aging.