
Abstract
Background:
Calcification in atherosclerotic plaques has been viewed as a marker of plaque stability, but whether calcification accumulates in specific anatomic sites in the carotid artery is unknown. We determined the burden and distribution of calcified plaque in carotid endarterectomy (CEA) tissues.
Methods:
A total of 22 CEA tissues were imaged with high-resolution micro-computed tomography (micro-CT). Total plaque burden and total calcium score using the Agatston method were quantified. The Agatston score (AS) was also normalized for tissue size. Plaque and calcium distribution were analyzed separately for three CEA regions: common segment (CS), bulb segment (BS), and internal/external segments (IES).
Results:
The average CEA tissue length was 40.83 (interquartile range [IQR] 33.31–42.41) mm with total plaque burden of 103.45 (IQR: 78.84–156.81) mm3 and total AS of 38.58 (IQR 11.59–89.97). Total plaque volume was 21.02 (IQR: 14.47–25.42) mm3 in the CS, 37.89 (22.59–48.32) mm3 in the BS, and 54.05 (36.87–74.52) mm3 in the IES. Of the 22 tissues, 15 had no calcium in the CS compared with three in the bulb and two in the IES. Normalized calcified plaque was most prevalent in the BS, the IES and was least prevalent in the CS. The overall correlation of calcification between histology sections and matched micro-CT images was 0.86 (p<0.001).
Conclusions:
Calcified plaque is heterogeneously distributed in CEA tissues with most in the bulb and IES regions. The amount of calcification in micro-CT slices shows a high correlation with matched histology sections.
Introduction
Atherosclerosis is characterized by the thickening of the intimal layer, a complex process involving monocyte recruitment and retention, and foam cell formation. 1 Advanced lesions are characterized by the formation of a lipid rich/necrotic core which is often accompanied by calcium crystal formation leading to plaque calcification.2,3 The presence of extended calcified plaques is indicative of advanced atherosclerosis. However, the exact mechanism of atherosclerotic calcification including the spatial location of calcific regions within atherosclerotic lesions remains incompletely understood. 4 This study investigates the spatial distribution of calcification within atherosclerotic plaques obtained from carotid endarterectomy (CEA) tissues. Elucidation of the distribution of calcified plaques in different extracranial carotid segments may enhance our understanding of the pathophysiology of atherosclerosis. CEA tissues were imaged with high-resolution micro-computed tomography (micro-CT). Total calcification burden and distribution of calcified plaque were determined in three segments of the CEA tissues (common carotid, bulb and internal and external carotid segments), and were histologically validated with select von Kossa-stained sections.
Methods
Tissues
Carotid endarterectomy samples were obtained from 22 patients who underwent clinically indicated carotid endarterectomy at the Houston Methodist Hospital in Houston, Texas. CEA tissues were collected under a protocol approved by the Baylor College of Medicine Institutional Review Board. Tissues were obtained within 4 hours after resection and stored in 50% phosphate buffered saline/glycerol at -20°C. Before tissues were studied, they were dialyzed against phosphate buffered saline at 4°C for 24 hours.
Micro-computed tomography imaging (micro-CT)
High-resolution micro-CT was performed using a Siemens Inveon Preclinical Multimodel SPET/PET/CT System, and the Inveon acquisition workplace software (Siemens, Erlangen, Germany). CEA tissues were imaged with an isotropic voxel resolution of 0.17 mm. The voltage used was 80 kV and the current was 500 µA. For reconstruction a filtered back projection algorithm was employed with a reconstructed isotropic voxel size of 0.17 mm. No contrast agent was used.
Image processing
The micro-CT data of the CEA tissues were analyzed with a custom-built software system implemented in Matlab Version 7.8.0 (64-bit). Different anatomical segments of the CEA specimens (common, bulb, internal/external segments) were identified by an observer (BA). Outer and inner (unless totally occluded) contours of specimens were segmented semi-automatically with a graphical user interface implemented with Matlab. The delineation process involves a series of left-mouse-button clicks, each adding a vertex until the completion of the polygonal contour. Completed contours can be manually refined by moving each vertex individually. Once the contour is closed, the segmented contours are smoothed automatically using a level set algorithm with a weighting term for a curvature-based force.5-7 The quantification of calcification is automated once the contours are delineated using the Agatston method. 8 The total calcium score was calculated by measuring the peak of Hounsfield Units (HU) of the area of interest. The threshold for density was 130 HU with area ≥ 1 mm. Each lesion was given a density score as follows: 1=130–199, 2=200–299, 3=300–399, and 4 ≥ 400 HU. The Agatston score (AS) for the lesion was then calculated by multiplying the density score by the area of the lesion. The AS was calculated for each slice and the sum over all micro-CT slices represents the total AS for each CEA tissue.
Total plaque burden and total calcium score using the Agatston method were identified between the inner and outer contours. Normalization of AS was then obtained by dividing median AS for each tissue segment by the median plaque volume for that tissue segment.
Intra and inter-observer variability
For quality control, intra-observer and inter-observer variability was assessed using the intra-class correlation coefficient (ICC). 9 To assess intra-observer variability a second reading was done approximately 1 month after the first reading. Inter-observer variability was measured by two observers (LR, YP) in one consensus reading.
Internal external segment sub analysis
On micro-CT images, eight tissues had complete separation between the internal segment and external segment. The AS of the internal and external segments for these tissues were additionally measured in a separate reading using a 2 mm increment between slices and the amount of calcification was normalized as detailed above.
Segment lengths on micro-CT
The assessed micro-CT slices were composed of either internal/external segments (IES) or common segment (CS) or bulb segment (BS) or a combination of them. We determined total length of the assessed slices for each segment. The calculated lengths were then compared between each segment.
Histology
After CEA tissues were scanned with micro-CT, representative samples with intact tissue were selected. These CEA tissues were frozen with optimal cutting temperature compound (OCT, Sakura, Japan), and using micro-CT images as a guide, frozen sections of 10 μm thickness at representative locations (CS, BS, IES) of the CEA were collected. The entire frozen tissues were sectioned with a cryomicrotome where all sections were counted, aiding in determining the intra-tissue position. Note that all CEAs were sections starting from the internal/external end of the specimen, enabling proper orientation/alignment. Depending on the size and extent of calcification, 5–10 different representative locations were selected along a CEA specimen. Sections were then treated with von Kossa stain to visualize calcified regions (Figure 1). Sections above the bifurcation (flow divider) were assigned to the internal/external segment. The BS was defined as the region approximately within 1 cm distal to the flow divider, and the CS was situated below.
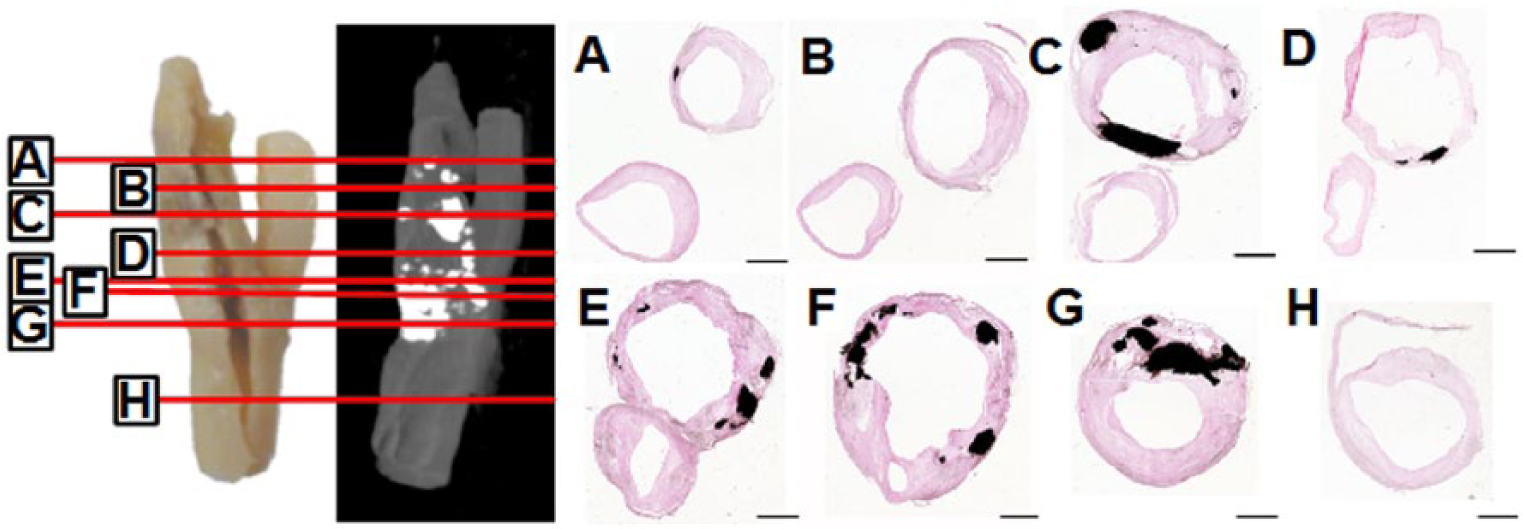
CEA specimen with corresponding histological sections, as indicated by the red lines (panels A–H). Calcified areas are prone to rupturing due to sectioning, highlighted by remnant of calcified fragments near the edge. The space void of calcification was rendered in black for illustrative purposes to show the entire calcified area in von Kossa images. Scale bar=2 mm.
Images of low magnification were acquired using a Pathscan Enabler IV microscope slide scanner (Meyer Instrument, Houston) at 7200 dpi. The digitized images of sections were warped when necessary to achieve closure of the surgical slit on vessel wall (MorphAge, Creaceed Inc. Belgium). The histological images were put in a panel in the order of their relative positions along the tissue. For high-magnification studies, the histology slides were examined with a bright field microscope (Leica, Germany).
Morphological analysis was performed using the public domain ImageJ software (National Institutes of Health, USA). Von Kossa-stained section representing the transverse area of the vessel wall was subjected to image analysis. The captured image was calibrated with a 2 mm stage micrometer. The outlines of the tissue and individual visible calcium particles were carefully traced. Total calcium area per tissue section was then determined. In a section with three visible calcium particles, all the measurements were done in triplicate and inter-observer variability was assessed by intra-class correlation coefficient using a two-way model.
Histology and micro-CT matching
Histology sections for each segment were then matched with corresponding micro-CT images by three observers (RH, GB, and JM). Total AS was calculated for the corresponding micro-CT images as mentioned above. For each segment, correlation between histology sections and corresponding micro-CT slices were calculated for total calcium area (histology) and total AS (micro-CT). Correlations between total calcium areas in all histology sections to total AS of matched micro-CT slices, were also calculated.
Statistical analysis
Comparison between medians of total plaque burden for different carotid artery specimen segments was performed using the Kruskal–Wallis test. The same approach was used to compare AS of different carotid artery specimen segments. The total length of the assessed micro-CT slices was compared using the Kruskal–Wallis test. The same approach was used to compare the length between CEA segments. Intra-class correlation coefficient was calculated using a two-way model to assess inter- and intra-observer variability. The total AS of the separate internal segments was compared with external segments using the Kruskal–Wallis test.
Spearman correlation was used in all correlations between the histology sections and corresponding micro-CT slices. The calcium variables were non-normally distributed in all sections and slices, as confirmed with the Shapiro–Wilk test.
An ICC <0.30 was considered as poor agreement, 0.30–0.70 as moderate-to-good agreement, and >0.70 as excellent.9,10 The statistical analyses were performed with Stata Statistical Software: Release 13 (StataCorp LP, College Station, Texas). A p-value of 0.05 or less was considered to be statistically significant.
Results
For the 22 CEA tissues, 350 micro-CT slices were assessed in total. The median total CEA tissue length was 40.83 (interquartile range [IQR]: 33.31–42.41) mm (Figure 2). Total plaque burden was 103.45 (IQR: 78.84–156.81) mm3 and total AS was 38.58 (IQR 11.59–89.97) (Figure 3). The median length of CS, BS, and IES was 11.65 (IQR: 9.96–14.77), 7.92 (IQR: 6.00–8.78), 17.68 (IQR: 14.49–20.78), respectively. Total plaque volume in CS, BS and IES was 21.02 (IQR: 14.47–25.42) mm3, 37.89 (22.59–48.32) mm3, and 54.05 (36.87–74.52) mm3, respectively (p=0.0023 for comparison between CS and BS, p=0.0001 for comparison between CS and IES, and p=0.011 for comparison between BS and IES) (Table 1). In the CS, seven among 22 tissues contained some calcium. In the BS, 19 out of 22 tissues and in the IES 20 out of 22 tissues contained some calcification. Calcified plaque normalized for tissue size was most prevalent in the BS. (AS 0.38; IQR: 0.13–1.54), the IES (AS: 0.35; IQR: 0.07–0.70) and was least abundant in the CS (AS: 0.0; IQR: 0–0.022) (Table 2). Compared with CS, normalized calcified plaque was more abundant in the BS (AS: 0 vs. 0.38, p=0.0001), and the IES (AS: 0 vs. 0.35, p=0.0001, Figure 4). There was no difference in the abundance of normalized calcified plaque in BS compared with IES (AS 0.38 vs. 0.35, p=0.32).
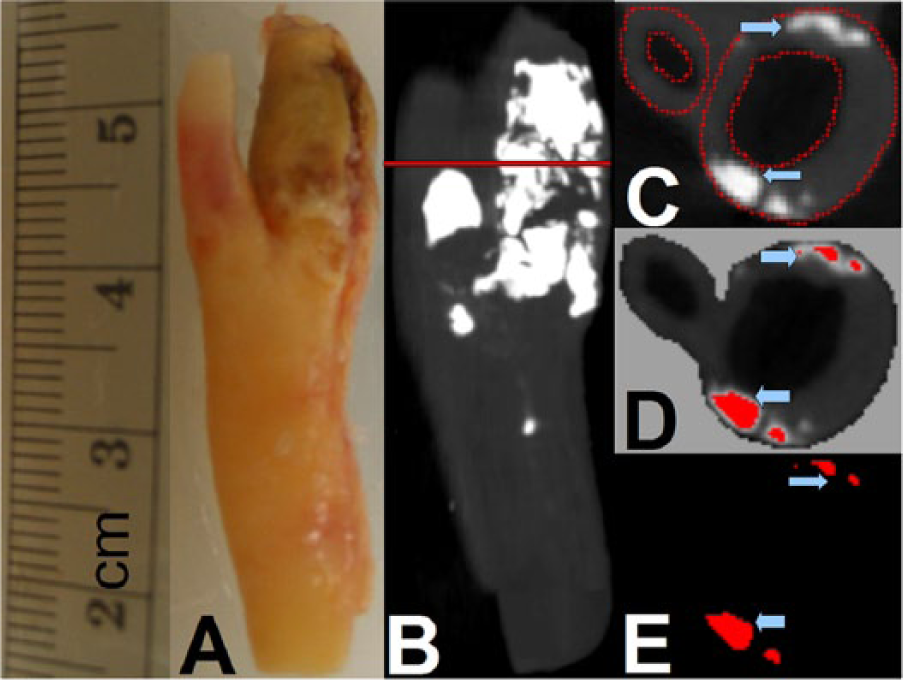
Coronal view of a gross CEA specimen (panel A) and micro-CT imaging of the CEA specimen (panel B) with corresponding cross-sectional view (panel C). The red line in panel B shows the level of the cross-sectional micro-CT slice in panel C. A user interface was utilized to semi-automatically quantify plaque burden and Agatston score (panels D and E) after delineating the inner and the outer contour of the plaque.
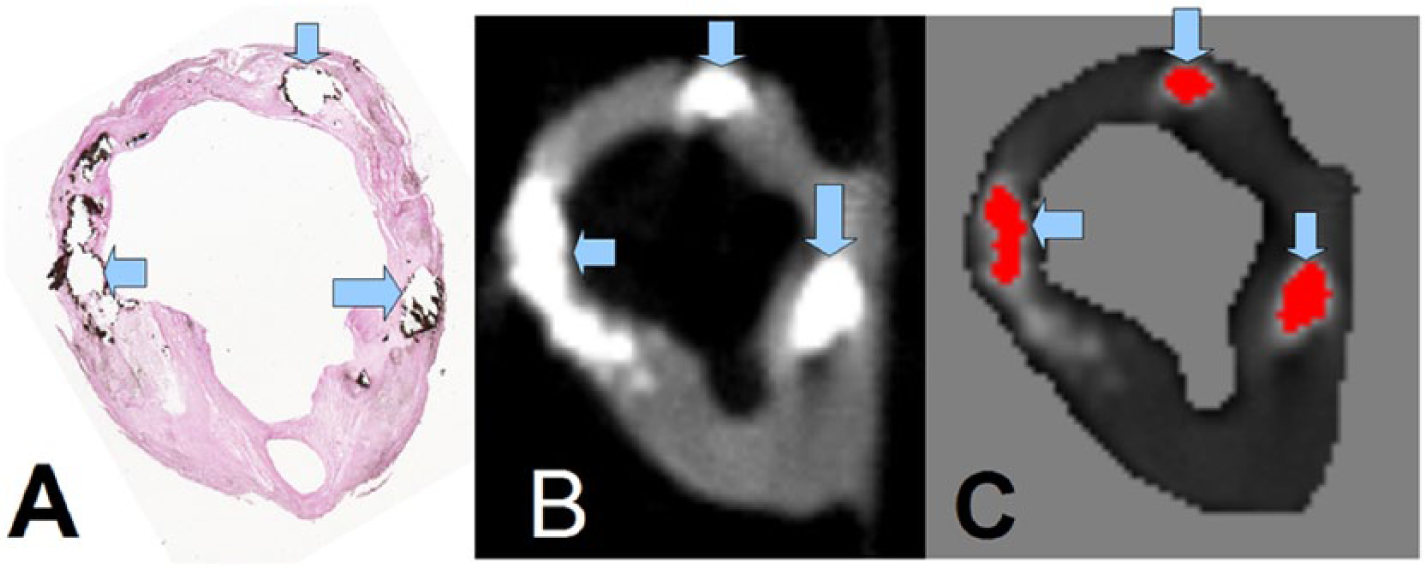
Cross-sectional view of the internal/external CEA region: the histology section (panel A) is shown with corresponding micro-CT slice (panel B) and the superimposed calcified plaque region (panel C). The graphical user interface was used to calculate plaque burden and Agatston score. The arrows point to the calcified region in the plaque.
Plaque burden for three segments from CEA tissues.
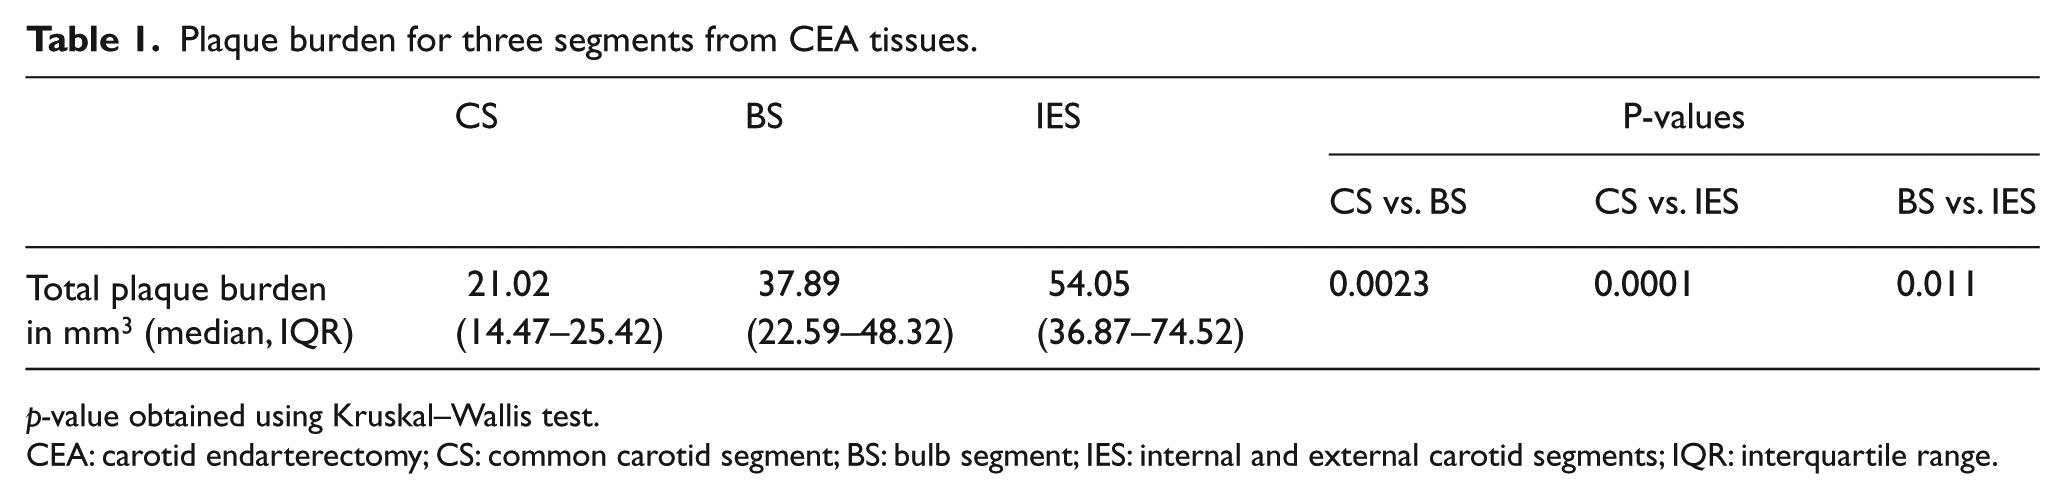
p-value obtained using Kruskal–Wallis test.
CEA: carotid endarterectomy; CS: common carotid segment; BS: bulb segment; IES: internal and external carotid segments; IQR: interquartile range.
Agatston score distribution across the common-, bulb-, and internal and external segments of CEA tissues.
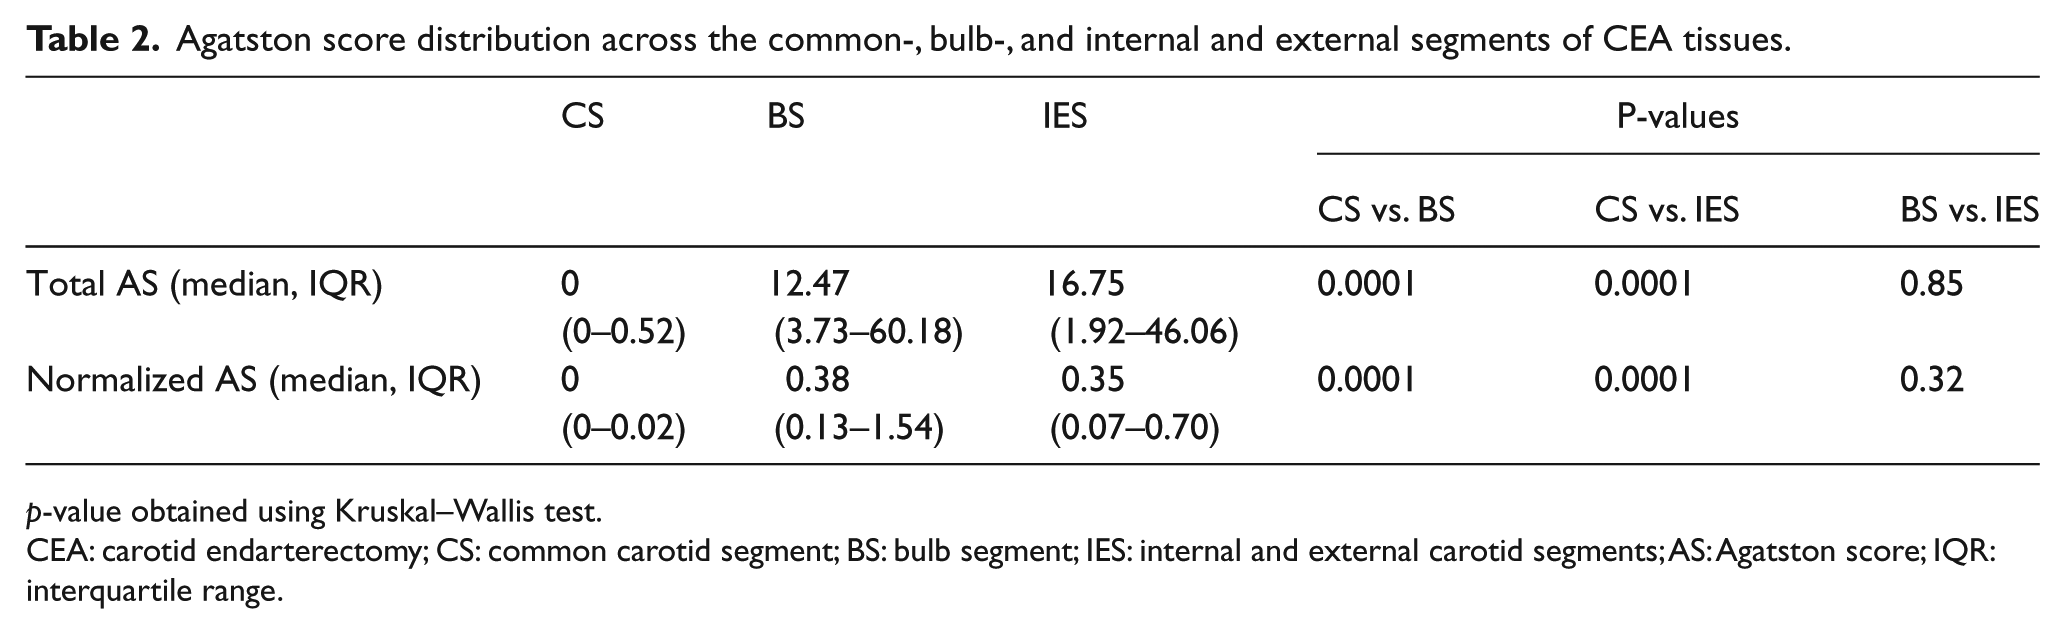
p-value obtained using Kruskal–Wallis test.
CEA: carotid endarterectomy; CS: common carotid segment; BS: bulb segment; IES: internal and external carotid segments; AS: Agatston score; IQR: interquartile range.
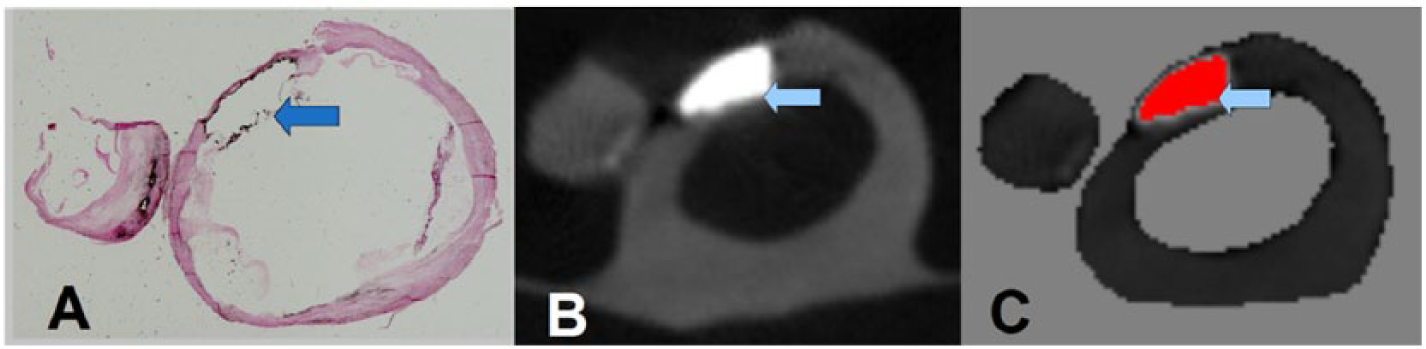
Cross-sectional view of the common carotid plaque: the histology section (panel A) is shown with the corresponding micro-CT (panel B) and the superimposed calcified plaque region, as quantified with the Agatston method (panel C). The arrows in panels A–C point to matched calcified plaque regions in a von Kossa-stained histology section and in the matched micro-CT slice.
Intra and inter-observer variability
Out of 22 CEA tissues, four tissues were randomly selected and re-evaluated by the first observer (BA) with a total of 51 micro-CT slices. There was excellent agreement between the two readings, with average ICC 0.996 (95% confidence interval [CI]: 0.993–0.998) and individual agreement among each tissue of 0.992 (95% CI: 0.986–0.995). Out of the 22 CEA tissues, 10 tissues were evaluated by observers two and three (LR, YP) with a total of 138 micro-CT slices. There was good agreement between the observers two and three (LR, YP) and the first observer (BA) with average ICC of 0.963 (95% CI: 0.948–0.973) and individual agreement among each tissue of 0.929 (95% CI: 0.902–0.949) (Appendix). The window width and window level settings were adjusted individually by each user. The excellent inter-observer variability (ICC=0.963) suggests only minor effects of individual users’ window level settings on the contour tracings.
Internal external segment sub analysis
The average total AS of separate internal segments and external segments was 46 (IQR: 15.39–139.28) and 0 (IQR: 0–0), respectively. Comparison between internal segments and external segments showed that internal segments have more calcium than external segments (p<0.001). Normalized AS for separate internal segments and external segments were 38.56 (IQR: 18.22–110.37) and 0 (IQR: 0–0), respectively. Comparison between normalized AS of separate internal and external segments showed that the internal segments had more calcium than external segments (p=0.001).
Segment lengths on micro-CT
The results for comparing the total length (40.83 mm, IQR: 33.31–42.41) of assessed slices showed no significant difference (p=0.72) between the CS (11.65 mm, IQR: 9.96–14.77), and the BS (7.92 mm, IQR: 6.00–8.78). However, there was a significant difference between the CS and IES (17.68 mm, IQR: 14.49–20.78), and between BS and IES (p<0.001 and p<0.001, respectively).
Histology and micro-CT matching
Out of the 22 CEA tissues, 19 tissues were of sufficient quality to perform histological analysis. The overall number of matched histology sections was 126. There was excellent agreement between the three histology readings with individual ICC of 0.999 (95% CI: 0.999–0.999) and average ICC of 0.999 (95% CI: 0.999–0.999). Spearman correlation between overall histology sections and corresponding micro-CT image slices for total calcium area and total AS was 0.86 (p<0.001). Spearman correlation between histology sections and corresponding micro-CT image slices for the total calcium area and total AS was 0.80 for CS (p=0.0006), 0.91 for BS (p<0.001), and 0.72 for IES (p=0.0007). The morphological characterization of calcification based on histological features of the CEA tissues has been discussed briefly previously, 11 and a more detailed histological analysis is underway.
Discussion
This study quantified calcification in CEA tissues using micro-CT imaging. We have quantified total plaque area, and amount of calcified area of carotid endarterectomy tissues using micro-CT imaging and histology. Our study is among the first to focus on the distribution of calcification in different segments of CEA tissues. Compared with the CS we found larger plaque volume in the BS and the IES. Plaque was more abundant in the IES than the BS. Compared with the CS there was more calcified plaque normalized for plaque size in the BS and the IES. There was no difference in abundance of calcified plaque in the BS versus the IES. The Agatston method was used to quantify calcification, which is currently the most widely used standard method for qualitative and quantitative measurement of calcified plaque in the coronary arteries. 8 We have validated the presence and amount of calcified plaque in micro-CT scans with histological sections treated with von Kossa stain to visualize calcified regions. There was a very low inter-observer variability of the AS in our study as reflected by an excellent ICC >0.90. The distribution of overall carotid plaque volume was similar to the distribution of calcified plaques, further validating our findings.
Other studies have quantified calcified plaques using multiple-detector CT imaging and magnetic resonance imaging (MRI) and correlated the results to histology. Shinnar et al. 12 quantified calcific plaque by MRI and compared it with histology sections stained with combined Mason trichrome and hematoxylin/eosin. Twenty-two human carotid endarterectomy specimens were imaged, a sample size which is similar to our study; however, in our study we matched approximately twice as many slices to histology sections, providing a full coverage of each CEA tissue. De Weert et al. 13 quantified calcified plaque in 21 CEA tissues using multiple-detector CT by measuring HU and calculated the area which was correlated with histology. The total number of matched slices was 27 and the correlation of calcified plaque area was 0.83, which is slightly lower than in our study. However, in our study calcification was detected using the Agatston method and not HUs directly.
Coronary artery calcium (CAC) score is a widely used tool to measure the atherosclerosis burden in coronary arteries. 14 It is highly associated with the presence of coronary artery disease and predicts coronary heart disease (CHD) events in both symptomatic and asymptomatic patients.15,16 The CAC score has a negative predictive value and a score of 0 is associated with low future CHD events. 17 An increasing body of evidence suggests that carotid plaque calcification may predict atherosclerosis burden and subsequent vascular events in the distribution of carotid beds.18 -20 In fact, calcified atherosclerotic plaques can be found in multiple vascular beds. Allison et al. 21 showed that renal artery calcium is significantly correlated with calcific plaques in the carotids, coronaries, illiacs, and aorta.
CAC score is based on the Agatston method and has been shown to predict incident CHD beyond that provided by traditional risk factors.22-24 Several studies have also shown cerebrovascular risk prediction using CAC.25-27 Only a few of them used cerebrovascular disease as sole end point, 27 and others either included it in their composite endpoints,26,28,29 or used carotid stenosis as a surrogate endpoint. 25 There is evidence that carotid plaque calcification is associated with carotid stenosis and cerebrovascular events.18,19 As we gather more data on carotid plaque calcification predicting cerebrovascular events and consider screening for carotid calcification in clinical practice in the future, our findings of differential distribution patterns of carotid plaque calcification become very instructive.
The spatial distribution of coronary calcification was a significant predictor of CHD events in the Multi-Ethnic Study of Atherosclerosis (MESA), resulting in a significantly higher area under the curve compared with the AS alone. 30 In this study, we analyzed calcifications in CEA tissue showing distinct spatial distribution patterns of calcified plaques. Together, these findings suggest that the location of calcified atherosclerotic plaques may be of importance in the pathophysiology of atherosclerosis.
Atherosclerosis is a complex biophysical process involving endothelial damage, uptake of oxidized lipoproteins and altered hemodynamics. It is believed that vascular hemodynamics may play a significant role in the formation of atherosclerotic plaques 31 in the carotid arteries, suggested by the observations that atherosclerotic plaques are more prevalent in the regions of the carotid bifurcations, including the carotid bulb and proximal internal carotid, where blood flow is predominantly tortuous and non-laminar with low wall shear stress.32-34 Whether the variation in distribution of calcification is related to local hemodynamic effects or if it is simply a function of burden requires further study.
Ultrasonography-based studies have shown that carotid plaque is twice as likely to be present in the internal carotid segment and four times as likely in the bifurcation segment compared with the common carotid artery. 35 The abundance of sono-opaque structures in the arterial wall, as measured by ‘acoustic shadowing’ was about 10 times greater in the internal carotid segment and 20 times more abundant in the BS compared with the common carotid segment. 35 Measurements using sonography can be difficult to reproduce because the procedure is not automated and can be subject to error.36-40 CT imaging, on the other hand, has been shown to be highly reproducible. 41
This study has several limitations. This is a cross-sectional study, but the cross-sectional design still fulfills the objective of the study to get a snap shot view of the distribution of carotid artery calcification in its different segments without introducing major biases. Patients undergoing CEA represent a selected group that may not reflect the carotid artery calcium distribution of symptomatic or asymptomatic individuals with carotid artery disease. A further limitation is that no clinical information was available for the patients who underwent CEA. Carotid endarterectomy is typically performed for symptomatic or asymptomatic high-grade carotid artery stenosis. Therefore, the CEA tissues in our study were obtained from a very high-risk group, with advanced atherosclerosis in the carotid bed.
The slice thickness of micro-CT images was 170 µm while histological sections were 10 µm thick. The difference in slice thickness created difficulties during the matching of histology sections with micro-CT slices. Due to limited spatial resolution of micro-CT, the AS method was unable to detect micro-calcification that we could detect in histology sections, as part of an ongoing investigation. These issues were more pronounced in the IES, which typically have a large area and a higher degree of tissue deformation due to sectioning. Although micro-CT is predominately a pre-clinical imaging technology, it is conceivable that high-resolution imaging can be useful for the pathological assessment of cardiovascular tissues. The proposed methodology can be applied to clinical CT scans (isotropic voxel size of 300–500 µm) in DICOM format, although clinical imaging systems feature a significantly lower resolution compared with micro-CT.
Window level settings were not fixed. For ex vivo imaging of CEA tissues, window levels are of less importance compared with in vivo CT or CT angiography studies, since the regions outside the tissues in our study represent air (HU: -1000). Good tissue visualization was achieved in our study with a wide window width (WW: 2000 or higher) and a comparatively low window level (WL: 50–100). However, for in vivo carotid artery imaging, window width needs to be reduced to increase tissue contrast.
In conclusion, calcified plaque was heterogeneously distributed in CEA tissues. Calcified CEA tissue, as well as atherosclerotic plaque burden, was more abundant in the carotid bulb and the internal/external segments than the proximal common carotid segment. The quantification of calcification in CEA tissues using the Agatston method is feasible and showed a high correlation with matched histology sections. The differential distribution of calcification could be related to local hemodynamic variation, or it could be a function of atherosclerotic burden or both. Additional study will be required to elucidate this mechanism.
Footnotes
Appendix
Intra-observer and inter-reader variability determined by intra-class correlation (ICC) using a two-way model.
| Intra-observer ICC for micro-CT slices | Inter-observer ICC for micro-CT slices | Intra-observer ICC for histology sections | |
|---|---|---|---|
| Individual ICC (95% CI) | 0.992 (0.986–0.995) | 0.929 (0.902–0.949) | 0.999 (0.999–0.999) |
| Average ICC (95% CI) | 0.996 (0.993–0.998) | 0.963 (0.948–0.973) | 0.999 (0.999–0.999) |
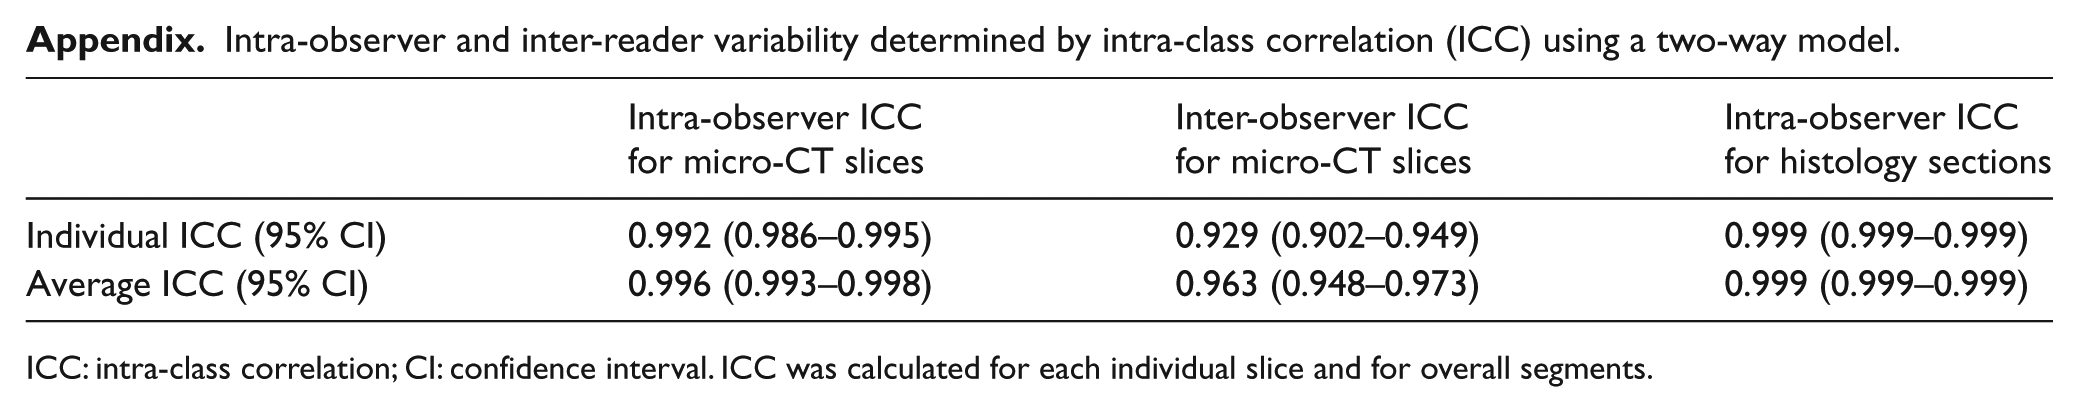
ICC: intra-class correlation; CI: confidence interval. ICC was calculated for each individual slice and for overall segments.
Declaration of conflicting interest
None declared.
Funding
This work was supported by NIH grants R01 HL63090 (JDM), and T32 HL007812 (JDM), and by funding from the Division of Atherosclerosis and Vascular Medicine, Department of Medicine, Baylor College of Medicine, Houston, Texas. Dr. Nambi was supported by an NIH Career Development Award (K23 HL096893). Dr. Brunner was supported by an AHA Beginning Grant-in-Aid award (13BGIA16720014) and by the Caroline Wiess Law Fund for Molecular Medicine.
Funding Sources American Heart Association, (Grant / Award Number: ‘13BGIA16720014’) National Institutes of Health, (Grant / Award Number: ‘K23 HL096893’,‘R01 HL63090’,‘T32 HL007812’).