
Abstract
Adipokines regulate metabolic processes linked to coronary artery (CAC) and abdominal aorta calcification (AAC). Because adipokine and other adiposity-associated inflammatory marker (AAIM) secretions differ between visceral and subcutaneous adipose tissue, we hypothesized that central adiposity modifies associations between AAIMs and CAC and AAC. We evaluated 1878 MESA participants with complete measures of AAIMs, anthropometry, CAC, and AAC. Associations of AAIMs with CAC and AAC prevalence and severity were analyzed per standard deviation of predictors (SD) using log binomial and linear regression models. The waist-to-hip ratio (WHR) was dichotomized at median WHR values based on sex/ethnicity. CAC and AAC prevalence were defined as any calcium (Agatston score >0). Severity was defined as ln (Agatston score). Analyses examined interactions with WHR and were adjusted for traditional cardiovascular disease risk factors. Each SD higher interleukin-6 (IL-6), fibrinogen and CRP was associated with 5% higher CAC prevalence; and each SD higher IL-6 and fibrinogen was associated with 4% higher AAC prevalence. Associations of IL-6 and fibrinogen with CAC severity, but not CAC prevalence, were significantly different among WHR strata. Median-and-above WHR: each SD higher IL-6 was associated with 24.8% higher CAC severity. Below-median WHR: no association (pinteraction=0.012). Median-and-above WHR: each SD higher fibrinogen was associated with 19.6% higher CAC severity. Below-median WHR: no association (pinteraction=0.034). Adiponectin, leptin, resistin, and tumor necrosis factor-alpha were not associated with CAC or AAC prevalence or severity. These results support findings that adiposity-associated inflammation is associated with arterial calcification, and further add that central adiposity may modify this association.
Keywords
Introduction
Recognized as an active endocrine organ, adipose tissue and surrounding stromal-vascular cells secrete adipokines such as adiponectin, leptin, and resistin, and inflammatory markers such as interleukin-6 (IL-6) and tumor necrosis factor-alpha (TNF-α). 1 Adipokines typically regulate glucose metabolism, insulin resistance, and fatty acid metabolism in skeletal muscle, and have also been shown to actively contribute to other numerous regulatory and inflammatory processes.2,3 Further, IL-6 directly stimulates the production of other acute phase reactants, including fibrinogen and C-reactive protein (CRP), from the liver.4,5
These termed ‘adiposity-associated inflammatory markers’ (AAIMs) have been linked to coronary heart disease4,5 and the development of coronary artery calcium (CAC). 6 In particular, IL-6, fibrinogen, and CRP have been found to be associated with both CAC 6 and abdominal aortic calcium (AAC), although associations with AAC were attenuated after adjusting for traditional cardiovascular disease (CVD) risk factors. 7 Lower levels of adiponectin have also been linked to the presence of CAC.8–10 Higher adiponectin levels, however, have been associated with more diverse findings. While higher adiponectin levels have been associated with anti-atherogenic effects in people without prevalent CVD,11,12 Dekker and others found increased mortality risk associated with higher adiponectin levels in people with a history of CVD.12,13 Though associations between leptin and resistin and CAC and AAC are less known, higher levels of these two adipokines typically demonstrate pro-atherogenic effects. 1
Associations between AAIMs and CAC and AAC are often attenuated after accounting for measures of adiposity. Numerous studies have demonstrated the association between abdominal obesity and CAC, 14 suggesting that the central distribution of adipose tissue significantly affects CVD risk.15,16 Findings were similar with regard to AAC, but were attenuated after adjusting for traditional CVD risk factors.7,17,18
Because of the attenuation of the association of AAIMs with CVD, namely CAC and AAC, when accounting for central adiposity and because AAIMs differ between visceral and subcutaneous adipose tissue, we hypothesized that associations between AAIMs and CAC and AAC would differ by central adiposity. Therefore, we specifically examined whether central adiposity, defined by the waist-to-hip ratio, modifies associations between AAIMs and CAC and AAC prevalence and severity in a multi-ethnic population without a history of CVD.
Methods
The Multi-Ethnic Study of Atherosclerosis (MESA)
The Multi-Ethnic Study of Atherosclerosis (MESA) is a prospective cohort study investigating subclinical atherosclerosis in African, Chinese, Hispanic, and non-Hispanic white Americans. Between July 2000 and August 2002, approximately 6814 individuals aged 45–84 years with no clinically apparent CVD were recruited from six US field centers: Baltimore, MD; Chicago, IL; Los Angeles, CA; New York, NY; St Paul, MN; and Winston-Salem, NC. Individuals were excluded if they had clinical CVD, including physician-diagnosed myocardial infarction, angina, stroke, transient ischemic attack, or heart failure; use of nitroglycerine; or current atrial fibrillation, or had undergone a procedure related to CVD. Details regarding the MESA design, recruitment methods, examination components and data collection have been previously published. 19
Study population
This ancillary study population constitutes a randomly selected group of MESA participants at follow-up visits between August 2002 and September 2005 from five of six field centers (all except Baltimore, MD). 7 Characteristics between the entire MESA cohort and this ancillary study cohort did not differ. Of the 1968 ancillary study participants, 53 lacked CAC measures, two lacked AAC measures, 17 lacked waist or hip circumference measures, and 71 lacked measurements for covariates. Following all exclusions, in a cross-sectional design. Of the 1968 ancillary study participants, 53 lacked CAC measures, two lacked AAC measures, 18 lacked waist or hip circumference measures, and 70 lacked measurements for covariates. All procedures were performed under institutionally approved protocols for human subject research, and all participants provided informed consent for study participation.
Measurement of adiposity-associated inflammatory markers (AAIMs)
Concentrations of AAIMs, adiponectin, leptin, TNF-α, resistin, IL-6, fibrinogen, and high-sensitivity CRP were measured in stored fasting blood samples from visits occurring between August 2002 and September 2005. Adiponectin, leptin, TNF-α, and resistin were measured using Bio-Rad Luminex flow cytometry (Millipore, Billerica, MA, USA) at the Laboratory for Clinical Biochemistry Research (University of Vermont, Burlington, VT, USA). High-sensitivity CRP and fibrinogen were measured by immunonephelometry using the BNII instrument (N High Sensitivity CRP and N Antiserum to Human Fibrinogen; Dade Bering Inc., Deerfield, IL, USA). IL-6 was measured by ultrasensitive ELISA (Quantikine HS Human IL-6 Immunoassay; R&D Systems, Minneapolis, MN, USA). Average analytic coefficients of variation across several control samples for these analytes were 5.8% for adiponectin, 5.2% for leptin, 8.9% for TNF-α, 6.7% for resistin, 9.3% for IL-6, 5.9% for fibrinogen, and 6.4% for CRP.
Measurement of abdominal aortic (AAC) and coronary artery calcium (CAC)
AAC was measured using electron-beam CT scanners at Northwestern University and University of California, Los Angeles (Imatron C-150) at settings previously described, using 25 6-mm slices with a 35-cm field of view and normal kernel. 7 Multidetector CT mode scanners (Sensation 64, GE LightSpeed, Siemens S4+ Volume Zoom and Siemens Sensation 16) using 5-mm slices with a 35-cm field of view were used at the remaining three field centers: Columbia University, Wake Forest University, and University of Minnesota. All scans were analyzed centrally using a standard protocol by the MESA CT Reading Center, and all scan scores were brightness-adjusted with a standard phantom. Calcification was identified as a plaque ≥1 mm2 with a density >130 Hounsfield units and quantified using the Agatston scoring method. 20 CAC was measured using the methodology for acquisition, interpretation, and reproducibility that has been previously described. 21 The Agatston score was calculated as above, 20 and scores were adjusted using a standard calcium phantom that was scanned along with the participant. 22 Any detectable calcium was defined as a CAC score >0. 21
Covariates
Standardized questionnaires were used to obtain participant demographics, ethnicity, medical history, and medication usage, including current blood pressure (BP) and cholesterol-lowering medications. Cigarette smoking was classified as never, current or former, and was dichotomized in analyses to ‘ever’ versus ‘never’.
Height and weight were measured with participants wearing light clothing and no shoes. Body mass index (BMI) was calculated as weight (kg)/height (m2). Using a Gulick II anthropometric tape while the participant was standing, waist circumference was measured at the level of the umbilicus and hip circumference was measured at the maximum circumference of the buttocks. Both measures were rounded to the nearest centimeter. The waist-to-hip ratio (WHR) was calculated by dividing waist circumference by hip circumference. Resting BP was measured three times in the seated position using a Dinamap automated sphygmomanometer, and the average of the second and third readings was used for this analysis. Hypertension was defined as systolic blood pressure ≥140 mmHg, diastolic blood pressure ≥90 mmHg or current use of hypertensive medications.
Blood samples were obtained after a 12-hour fast to measure glucose, total cholesterol, high-density lipoprotein cholesterol (HDL-C), triglycerides, and creatinine. Low-density lipoprotein cholesterol (LDL-C) was calculated using the Friedewald equation. Diabetes was classified as having a fasting blood glucose ≥126 mg/dL or self-reported use of hypoglycemic medications. Impaired fasting glucose status was defined as a fasting glucose of 101–125 mg/dL.
Statistical analysis
Univariate associations of AAIMs with potential confounders and measures of calcium presence were evaluated using t-tests for normally distributed continuous variables, Wilcoxon tests for non-normally distributed continuous variables, and chi-squared tests for categorical variables. CAC and AAC prevalence were dichotomized according to a CAC or AAC score >0. CAC and AAC severity were defined by log-transforming Agatston scores among participants with prevalent CAC or AAC (i.e. Agatston score >0), and were analyzed as continuous variables. Because CAC and AAC prevalence were >10% in the study population, we used log-binomial models to calculate prevalence ratios (PR) instead of logistic models, as odds ratios would overestimate the prevalence ratio. Multivariable linear regression was used to examine associations with CAC and AAC severity. We chose to use WHR as a measure of body composition as it has been shown to capture separate effects of peripheral and central adiposity in relation to coronary heart disease. 23 Because WHR cut-offs for CHD differ by sex as well as by ethnicity, we chose sex and ethnicity-specific median values, which allowed us to examine the effects of WHR while accounting for sex and ethnic differences. WHR categories (median-and-above versus below-median) were defined according to median WHR stratified by sex and ethnicity: non-Hispanic white American female=93.4 cm, male=100.5 cm; Chinese American female=87.0 cm, male=85.6 cm; African American female=96.5 cm, male=98.5 cm; Hispanic American female=98.8 cm, male=99.6 cm. We tested interactions of WHR and each adiposity-associated inflammatory marker on an additive scale in the linear regression models and a multiplicative scale in the log binomial models for their association with CAC or AAC. Following the recommendation of Rothman, no adjustments were made for multiple comparisons; instead, exact p-values for two-sided tests are presented. 24 P-values <0.05 were considered statistically significant for all models including interaction terms. Statistical analysis was conducted using SAS version 9.3.
Results
Participants with prevalent CAC were significantly older, had higher WHRs, and included a higher prevalence of Caucasian and male participants. They had a higher prevalence of hypertension and diabetes, as well as higher levels of triglycerides, resistin, IL-6, TNF-α and fibrinogen (Table 1). Similarly, participants with prevalent AAC were also older, and included a higher prevalence of Caucasian and male participants, a higher prevalence of current smokers, and higher WHRs. They also had higher proportions of hypertension and diabetes, and higher levels of triglycerides, LDL-cholesterol, adiponectin, leptin, resistin, IL-6, TNF-α, CRP, and fibrinogen.
Baseline characteristics of cohort by presence/absence of coronary artery or abdominal aortic calcium.
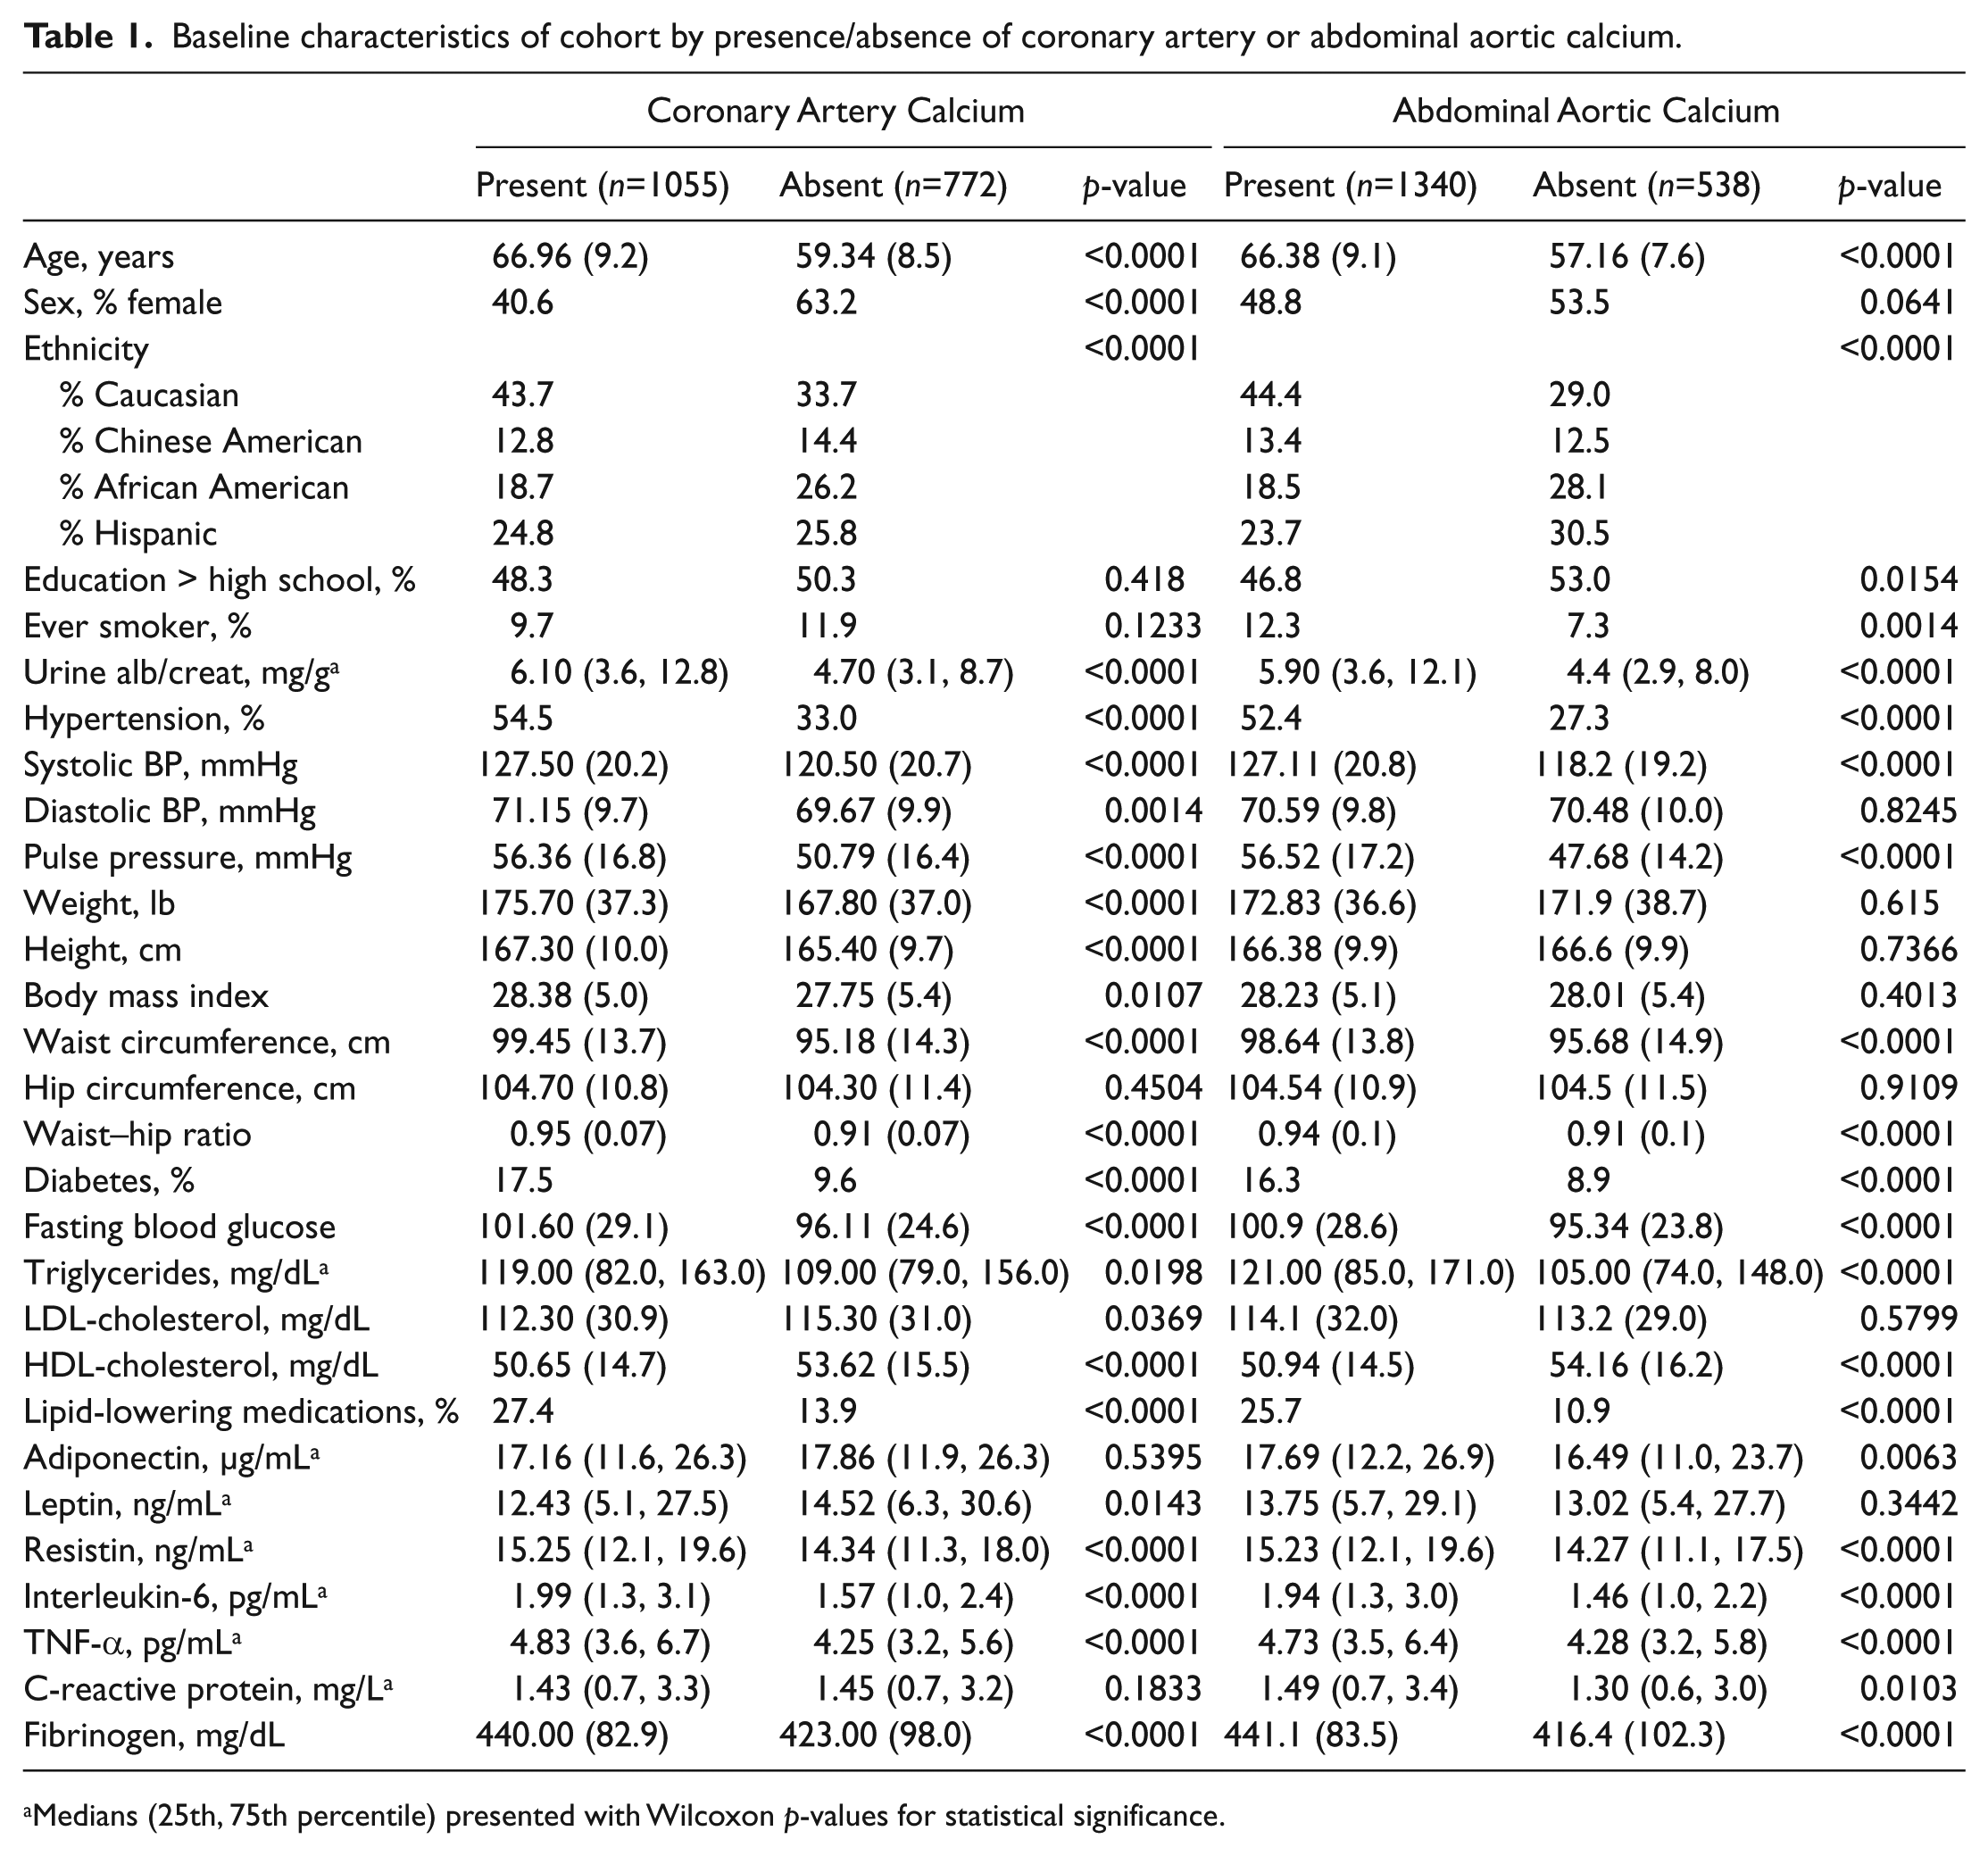
Medians (25th, 75th percentile) presented with Wilcoxon p-values for statistical significance.
In unadjusted analysis evaluating the association of the AAIMs with any CAC (Table 2), resistin, IL-6, and fibrinogen were significantly associated with CAC. However, after adjusting for demographics and lifestyle/comorbidities, the association between resistin and CAC was attenuated and no longer statistically significant. In fully adjusted models including lipid and glucose measures, associations of CRP, IL-6, and fibrinogen remained statistically significantly associated with CAC. Specifically, each standard deviation (SD) higher CRP, IL-6, and fibrinogen corresponded to an approximately 5% higher CAC prevalence (95% CI: 1.03–1.08, 1.02–1.08, 1.02–1.09, respectively).
Associations of adiposity-associated inflammatory markers on CAC and AAC prevalence (PR) a .
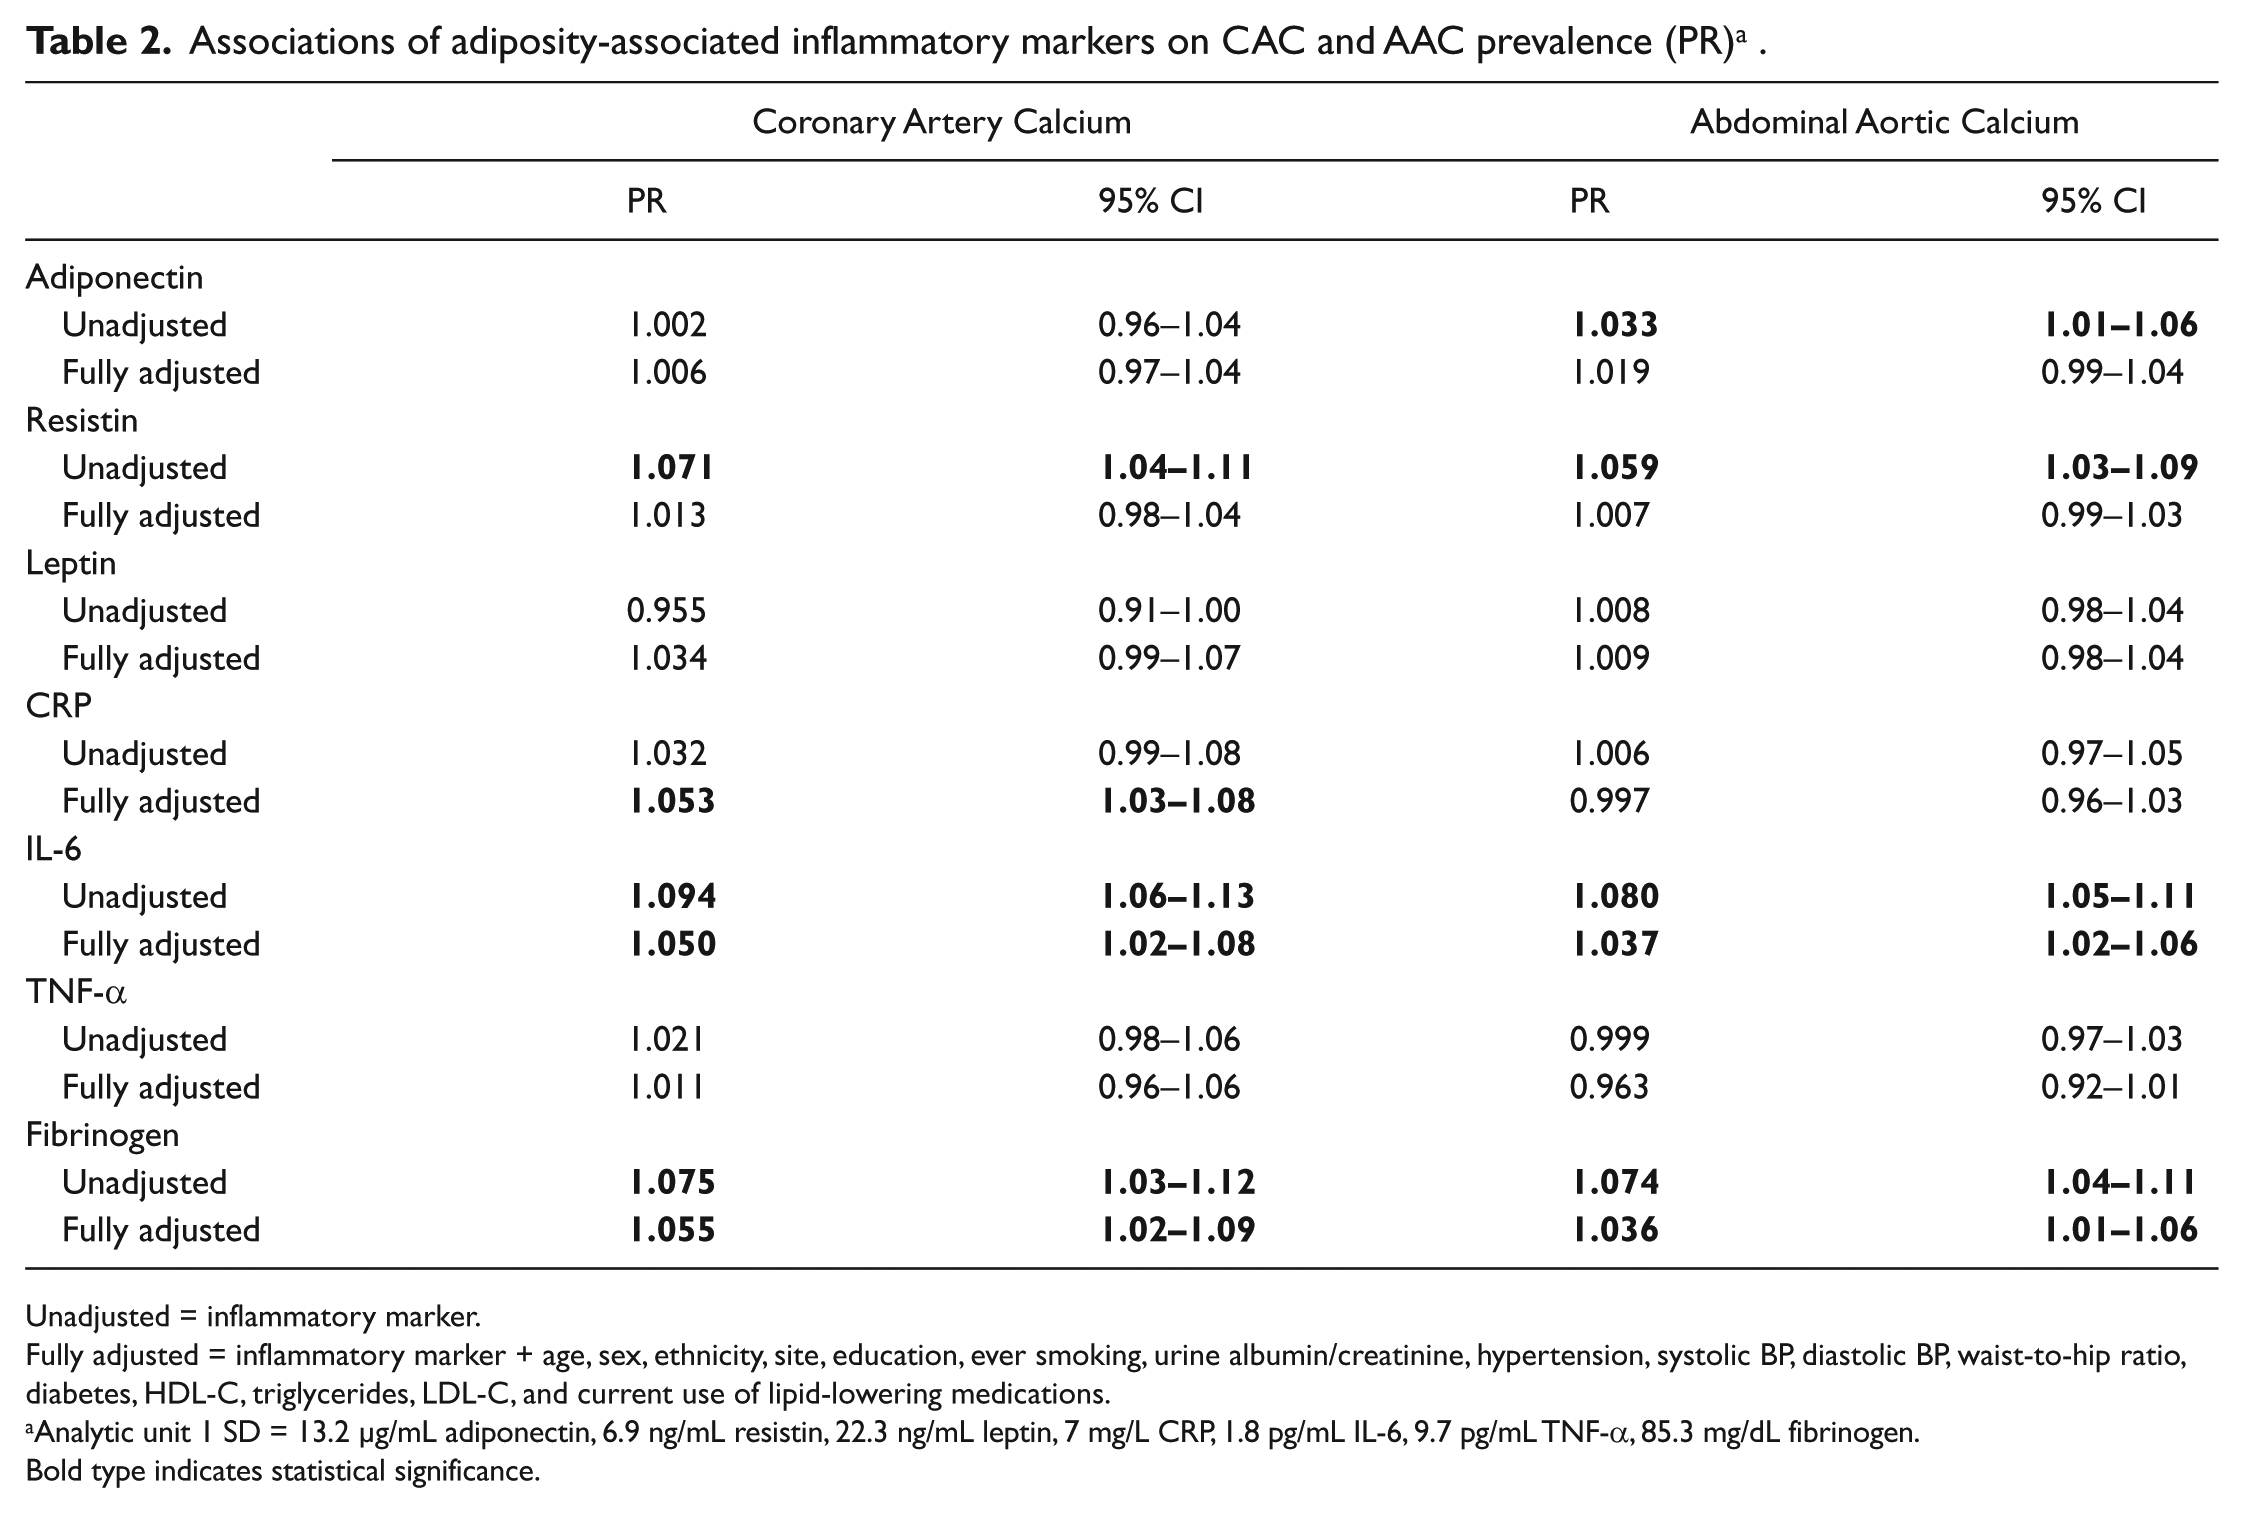
Unadjusted = inflammatory marker.
Fully adjusted = inflammatory marker + age, sex, ethnicity, site, education, ever smoking, urine albumin/creatinine, hypertension, systolic BP, diastolic BP, waist-to-hip ratio, diabetes, HDL-C, triglycerides, LDL-C, and current use of lipid-lowering medications.
Analytic unit 1 SD = 13.2 µg/mL adiponectin, 6.9 ng/mL resistin, 22.3 ng/mL leptin, 7 mg/L CRP, 1.8 pg/mL IL-6, 9.7 pg/mL TNF-α, 85.3 mg/dL fibrinogen.
Bold type indicates statistical significance.
In unadjusted analyses evaluating associations of the AAIMs with any AAC (Table 2), adiponectin, resistin, IL-6, and fibrinogen were significantly associated with AAC. After adjusting for demographics, the association between adiponectin and AAC became non-significant, but associations remained significant for resistin, IL-6, and fibrinogen, and became significant for leptin. In fully adjusted models, the significant associations with AAC persisted only for IL-6 and fibrinogen, where a SD increase in either one corresponded to a 4% higher AAC prevalence (95% CI: 1.02–1.06, 1.01–1.06, respectively).
With regard to CAC severity, resistin and IL-6 were significantly associated in unadjusted models (Table 3). However, with adjustment for demographics, lifestyle, comorbidities and lipids and glucose, no AAIMs demonstrated significant associations with CAC severity. While a similar pattern was observed for AAC severity, IL-6 and fibrinogen demonstrated persistent significant associations with AAC severity even after adjusting for all covariates. In these fully adjusted models, leptin demonstrated significant inverse associations with AAC severity. That is, each SD higher IL-6 and fibrinogen was associated with 17% and 12% higher AAC severity, respectively (p=0.0005; p=0.021), while each SD higher leptin was associated with 12% lower AAC severity (p=0.0302).
Percent change in CAC and AAC severity related to standard deviation change in the adiposity-associated inflammatory marker a .
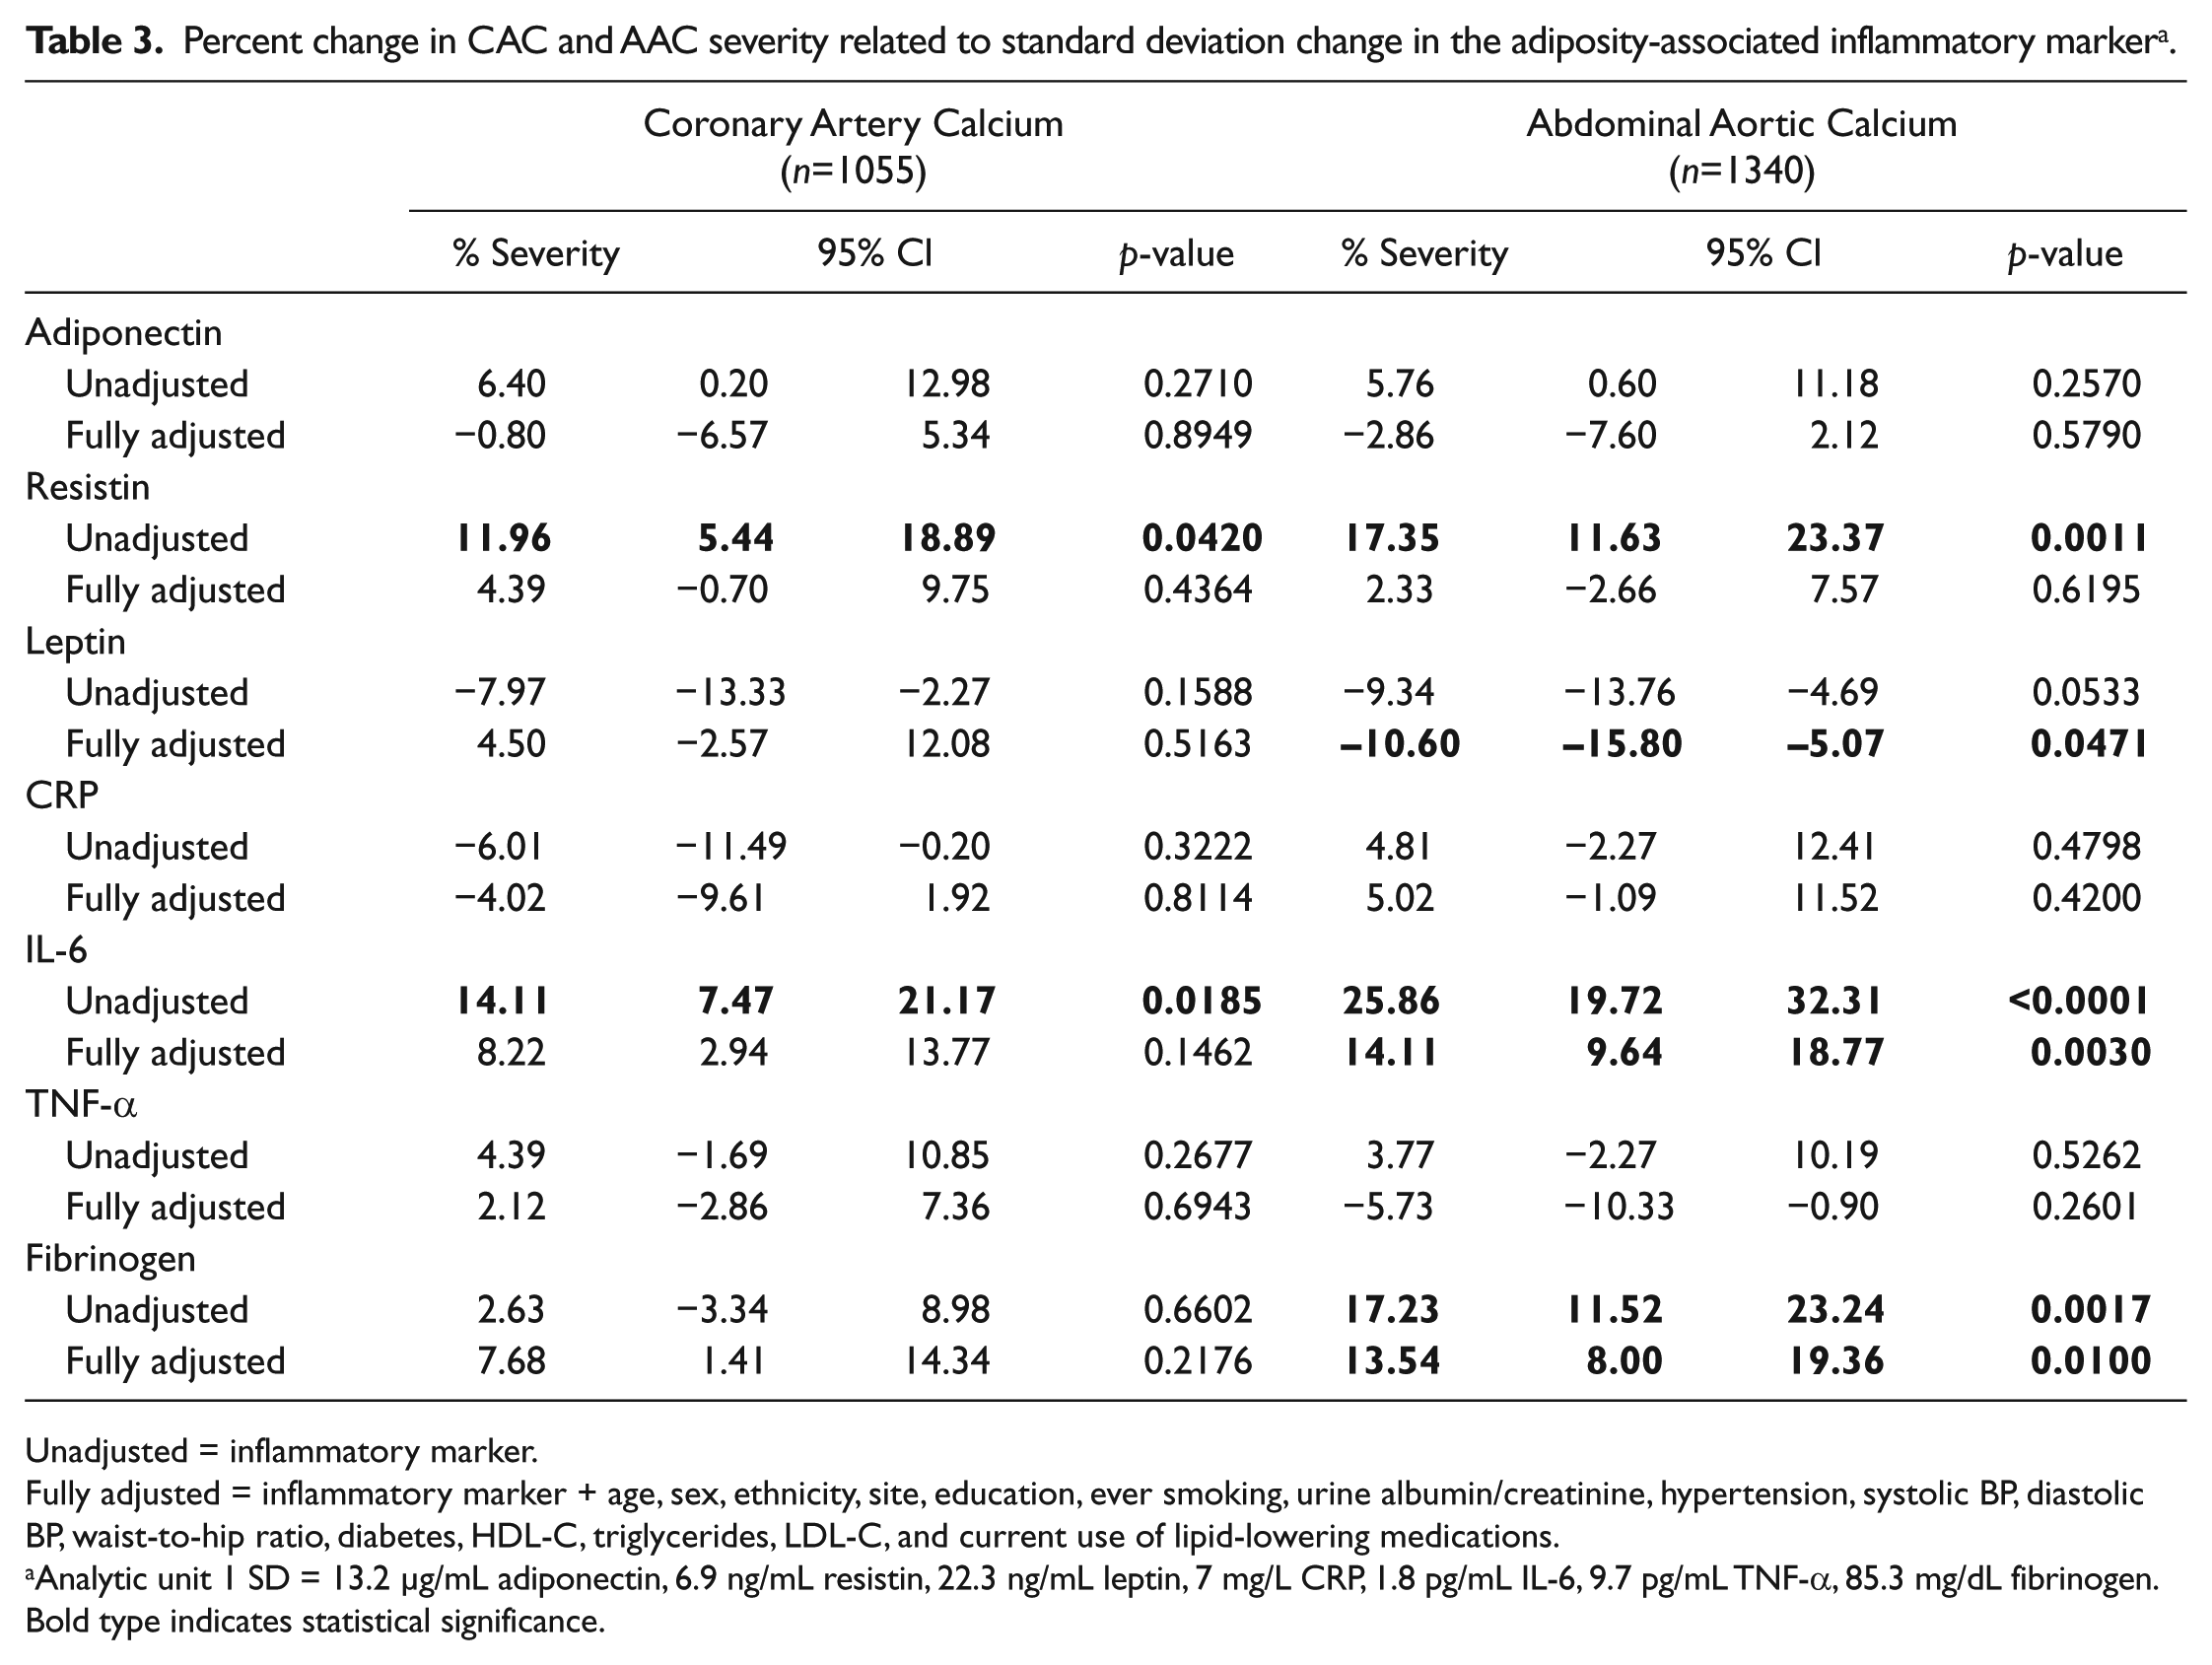
Unadjusted = inflammatory marker.
Fully adjusted = inflammatory marker + age, sex, ethnicity, site, education, ever smoking, urine albumin/creatinine, hypertension, systolic BP, diastolic BP, waist-to-hip ratio, diabetes, HDL-C, triglycerides, LDL-C, and current use of lipid-lowering medications.
Analytic unit 1 SD = 13.2 µg/mL adiponectin, 6.9 ng/mL resistin, 22.3 ng/mL leptin, 7 mg/L CRP, 1.8 pg/mL IL-6, 9.7 pg/mL TNF-α, 85.3 mg/dL fibrinogen.
Bold type indicates statistical significance.
As illustrated in Figure 1, associations of IL-6 and fibrinogen with CAC severity were modified by WHR, while associations of IL-6 and fibrinogen with CAC prevalence were not. Specifically, among participants with median-and-above WHR for their sex and ethnicity, each SD higher IL-6 was associated with 24.8% higher CAC severity (p=0.002), whereas no statistically significant association was observed among participants with below-median WHR (pinteraction = 0.012). Similarly, among participants with median-and-above WHR, each SD higher fibrinogen was associated with a 19.6% higher CAC severity (p=0.019), whereas no association was observed among participants with below-median WHR (pinteraction = 0.034). While associations between IL-6 and fibrinogen and CAC severity were not statistically significant in participants with below-median WHR, the direction of these associations, however, suggest qualitative interaction, as they are in directions opposite to those in the median-and-above WHR group. No statistically significant interactions between WHR and AAIMs for AAC severity were detected (data not shown).
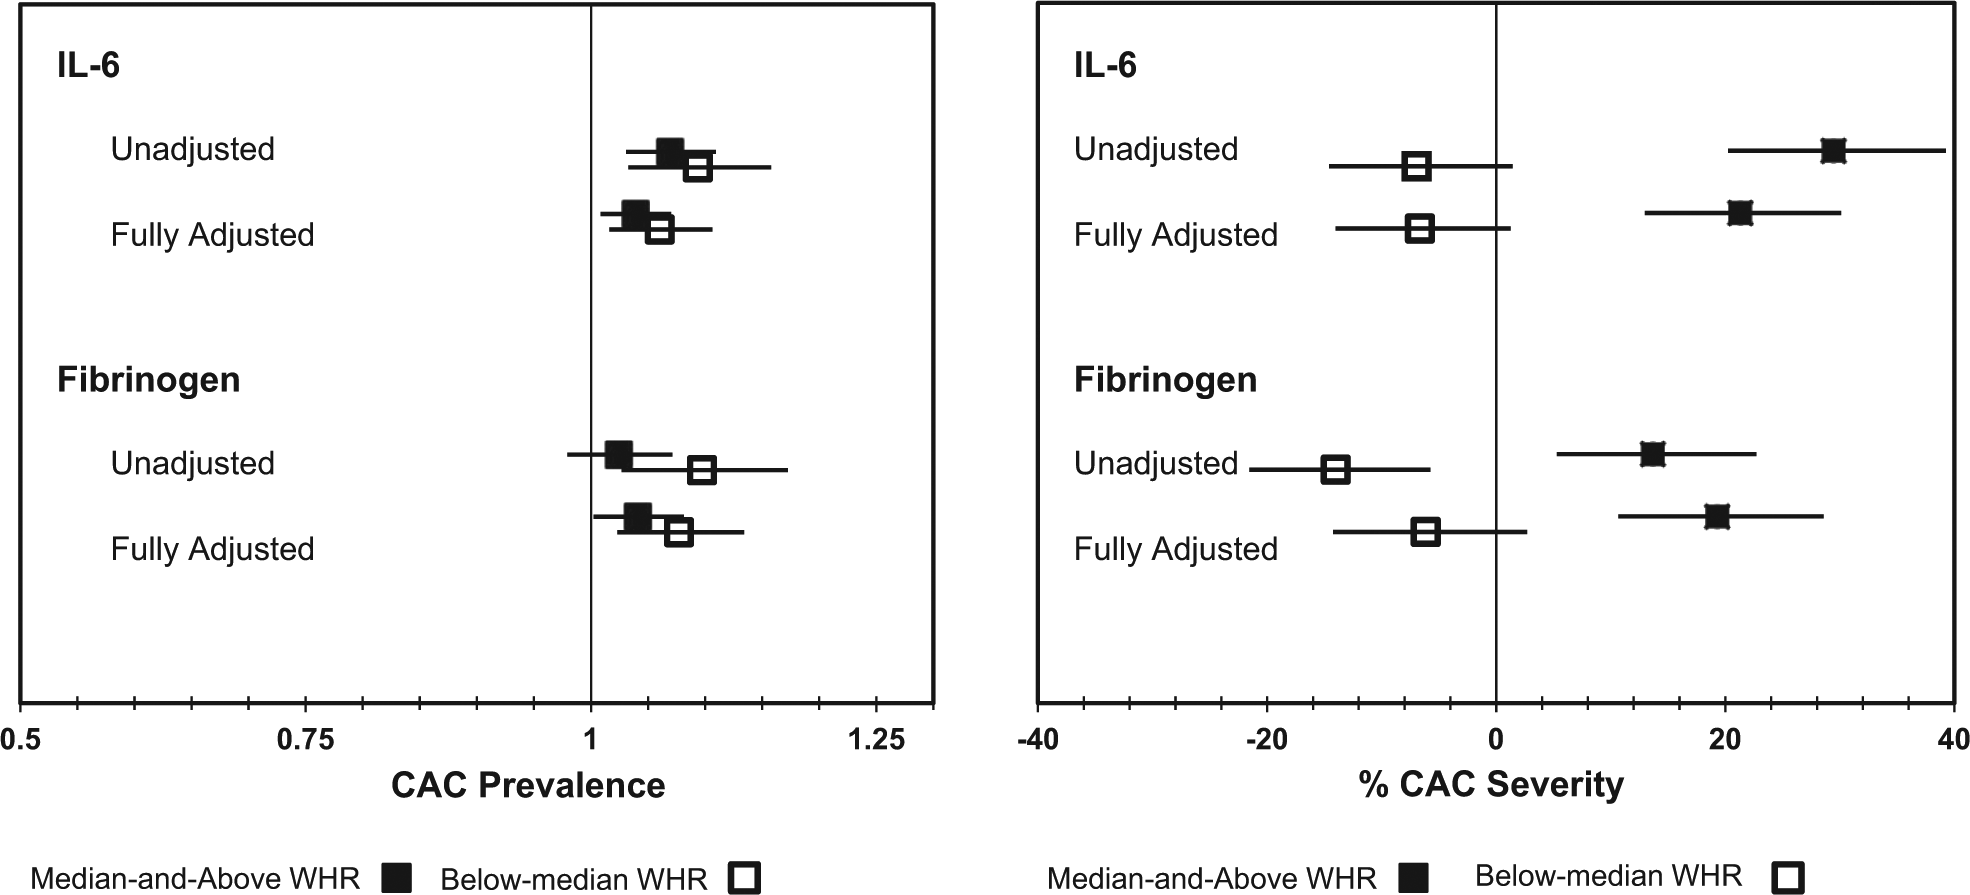
Modification of associations between IL-6 and fibrinogen and CAC prevalence and CAC severity by WHR. (Unadjusted = inflammatory marker; Fully Adjusted = inflammatory marker + age, sex, ethnicity, site, education, ever smoking, urine albumin/creatinine, hypertension, systolic BP, diastolic BP, waist-to-hip ratio, diabetes, HDL-C, triglycerides, LDL-C, and current use of lipid-lowering medications.)
Discussion
In this multi-ethnic community-living population, we found that higher IL-6 and fibrinogen concentrations demonstrated significant associations with higher CAC and AAC prevalence and severity. The main effects of IL-6 and fibrinogen were significantly associated with AAC prevalence, while IL-6, fibrinogen, and CRP were significantly associated with CAC prevalence, and IL-6, fibrinogen, and leptin were significantly associated with AAC severity. The associations between IL-6 and fibrinogen and CAC severity were modified by WHR, where associations were significant and positive among participants with median-and-above WHR, but were not significant among below-median WHR. Associations between IL-6 and fibrinogen with CAC prevalence, however, were not modified by WHR. No significant associations of adiponectin, resistin, and TNF-α with CAC or AAC prevalence or severity were observed.
We observed significant associations of AAIMs with AAC prevalence in addition to CAC, which is consistent with the results from Jenny et al. showing associations of IL-6 and fibrinogen with CAC prevalence in the overall MESA population at the 2000–02 Exam. 6 IL-6 enhances the innate immune system through stimulation of the acute-phase reaction, 25 which stimulates release of acute-phase proteins, including CRP and serum amyloid-A, and increases the synthesis of fibrinogen, an important clotting agent from the liver. 26 Thus, the associations between CAC and CRP, and CAC and fibrinogen in conjunction with IL-6 in our results correspond appropriately to expected biological associations. Despite negative feedback mechanisms to regulate IL-6 production, overproduction of IL-6 has been implicated in the pathogenesis of inflammatory diseases. 27 Its overproduction may exert downstream effects on CRP, amyloid-A, and fibrinogen, contributing to higher levels of these AAIMs in atherosclerosis. IL-6 has also been shown to play a major role in age-related vascular disease and remodeling of arteries, 28 and in human and mouse species has been expressed in atherosclerotic plaques. 29
Because of the influence of IL-6 on fibrinogen and CRP, one might expect to find consistent associations of all three inflammatory markers with arterial calcification in multiple vascular beds. CRP was associated only with CAC, and not with AAC, suggesting either attenuation by an unmeasured confounder specific to CAC, or that potentially the mechanism which contributes to calcification in the abdominal aorta differs from the mechanism behind calcification in the coronary arteries.
The modification of associations between AAIMs and arterial calcium by central adiposity existed only with CAC severity. Associations between AAIMs, AAC prevalence or severity, or CAC prevalence did not differ by WHR, suggesting that the amount of calcium in coronary arteries, not just its presence, is most affected by a greater WHR; or that the dichotomization of this outcome into ‘presence’ or ‘absence’ resulted in less power to detect significant effect modification. As our sample size was sufficient to detect a more precise association, especially for severity measures, we conclude that the differences between AAC and CAC and the interaction between WHR and AAIMs are likely the result of biologic interactions rather than a statistical anomaly. Although less understood, the lack of interaction tested between WHR and AAIMs may suggest that WHR had no effect on the prevalence or severity of AAC. It may further imply that central adiposity may contribute less to calcification in coronary (medium size arteries) than it does to the abdominal aorta.
Jenny and colleagues previously investigated associations of non-specific markers of inflammation (i.e. IL-6, fibrinogen, and CRP) with coronary artery calcium prevalence and burden in MESA. 6 Our current project capitalizes on their findings and adds to it the investigation of associations between these non-specific inflammatory markers and abdominal aortic calcium, associations of adipokines with CAC and AAC, and the influence of central adiposity on these associations. Thus, our study findings contribute that central adiposity as determined by WHR modifies the association between AAIMs and CAC severity, where individuals with greater central adiposity show stronger associations between inflammation and CAC severity. It also adds that the adipokines we suspected would directly influence calcification of the abdominal aorta do not.
Participants in this study were a random sample of the entire MESA cohort, which was selected based on varying field site-specific criteria. 19 While these results are representative of the five participating MESA sites (Chicago, IL; Los Angeles, CA; New York, NY; St Paul, MN; and Winston-Salem, NC), they may not be generalizable to the US adult population. MESA represents four distinct ethnicities – African American, Caucasian American, Chinese American, and Hispanic American – all of whom were free of CVD at baseline. Thus, MESA encompasses common ethnicities in the US as well as longitudinal measures for the comprehensive assessment of CVD. Measurements of AAIMs, CAC, AAC and covariates were collected under standard protocol with quality assurance, which minimized measurement error and residual confounding. Therefore, while the results of this study are limited in their generalizability, the internal validity of this study design and execution supports these current findings. We must also acknowledge that circulating biomarkers may not reflect local levels of adiposity-associated inflammatory markers, and thus cannot conclude direct associations between a specific adipose tissue depot and its effect on inflammation and arterial calcification. Because of the cross-sectional study design, we were unable to evaluate temporality between AAIMs and CAC and AAC, thus limiting the ability to infer causality. While we were limited in our ability to evaluate causal associations, we were able to show, however, that central adiposity modifies relationships between AAIMs and coronary artery calcification, prompting further investigation of the effect of body composition on inflammation in cardiovascular disease.
Conclusion
In summary, the association between two adiposity-associated inflammatory markers, IL-6 and fibrinogen, and coronary artery calcium in a population-based cohort of men and women from four ethnic groups was modified by central adiposity, as measured by WHR. Conversely, selected adipokines (i.e. leptin, adiponectin, and resistin) were not associated with coronary or abdominal aortic calcium, and these associations were not modified by central adiposity. Higher concentrations of IL-6 and fibrinogen were associated with both CAC and AAC prevalence and severity, suggesting potential involvement of these inflammatory markers in the disease process, regardless of central adiposity. Future research is needed in this area to examine associations among the progression of CAC and AAC, change in body composition, and longitudinal changes in AAIMs.
Footnotes
Acknowledgements
Declaration of conflicting interest
The authors report no conflicts of interest.
Funding
This research was supported by contract R01-HL-088451 and contracts N01-HC-95159 through N01-HC-95169 from the National Heart, Lung, and Blood Institute and by grants UL1-RR-024156 and UL1-RR-025005 from NCRR.