
Abstract
Associations of vitamin D levels with prospectively measured functional decline and mortality in people with lower extremity peripheral artery disease (PAD) are unknown. We determined whether lower baseline vitamin D levels are associated with a faster decline in functional performance and higher mortality among people with and without PAD. A total of 658 participants (395 with PAD) underwent baseline measurement of 25-hydroxyvitamin D (DiaSorin radioimmunoassay), a 6-minute walk test, 4-meter walking velocity and the Short Physical Performance Battery (SPPB), and were followed annually for up to 4 years. Analyses were adjusted for age, sex, race, body mass index, comorbidities, the ankle–brachial index, and other confounders. Among participants with PAD, lower baseline vitamin D levels were associated with a faster decline in the 6-minute walk (vitamin D < 30 nmol/L: –70.0 feet/year; vitamin D 30 to < 50 nmol/L: –72.3 feet/year; vitamin D 50 to < 75 nmol/L: –35.5 feet/year; vitamin D 75 to < 120 nmol/L: –35.9 feet/year; p trend=0.012). PAD participants with vitamin D < 30 nmol/L had a faster decline in the SPPB and 6-minute walk compared to those with levels of 50 to < 75 (p=0.034 and p=0.04, respectively). Among participants without PAD, lower vitamin D was associated with a faster decline in the fast 4-meter walking velocity (p trend=0.003). There were no significant associations of baseline vitamin D levels with all-cause or cardiovascular disease mortality in PAD or non-PAD participants. In conclusion, among individuals with and without PAD, low vitamin D status was associated with a faster decline in some measures of functional performance but was not related to mortality.
Keywords
Introduction
Basic and animal research suggests that vitamin D is important for maintaining physical function and cardiovascular health.1,2 However, a recent systematic review concluded that the association of low vitamin D levels with functional decline in people without lower extremity peripheral artery disease (PAD) is unclear. 3 Similarly, associations of low vitamin D levels with cardiovascular events in clinical populations without PAD are inconsistent.4–6
Vitamin D contributes to skeletal muscle health. Vitamin D receptors exist on nuclear and cellular membranes of skeletal muscle cells and vitamin D promotes changes in mRNA transcription and protein synthesis that maintain muscle health.7–10 In animals, vitamin D deficiency is associated with myofibrillar protein degradation and adverse alterations in muscle contraction kinetics.11,12 Because patients with PAD have more adverse muscle characteristics than individuals without PAD, vitamin D may be particularly important for skeletal muscle health in patients with PAD compared to those without PAD. 13
People with PAD have greater functional impairment, faster functional decline, and increased cardiovascular event rates compared to individuals without PAD.14–16 A recent population-based study suggested that men and women with PAD have lower levels of vitamin D than those without PAD. 17 Therefore, we studied associations of baseline vitamin D levels with subsequent functional decline and mortality among individuals with PAD. We hypothesized that lower vitamin D levels are associated with faster functional decline and higher all-cause and CVD mortality among individuals with PAD. In exploratory analyses, we assessed whether lower vitamin D levels were associated with more adverse changes in calf muscle and greater declines in peripheral nerve function among people with PAD. To determine whether our results were unique to PAD, we also studied these associations in individuals without PAD.
Methods
Participant identification
The protocol was Institutional Review Board-approved by Northwestern University Feinberg School of Medicine. Participants gave informed consent. Participants included 395 individuals with PAD and 263 individuals without PAD who were part of the Walking and Leg Circulation Study (WALCS) II cohort,13,20 had stored blood samples from their baseline study visit, and had follow-up data available for functional decline or mortality. The WALCS II cohort included participants in the original WALCS cohort who consented to continuing annual follow-up visits and newly identified participants recruited to increase the sample size of WALCS II.13,18 Inclusion criteria for WALCS II were identical to those for the original WALCS cohort, except that because all WALCS participants were aged 59 years at the start of WALCS II, newly identified participants for WALCS II were aged 59 and older.
WALCS II PAD participants were identified consecutively from among patients diagnosed with PAD in three Chicago-area non-invasive vascular laboratories. Approximately half of the non-PAD participants were identified from among consecutive patients with normal lower extremity arterial testing in the Chicago-area vascular laboratories. The remainder were identified from consecutive patients in a primary care practice.13,18 Participants were aged 59 years and older at baseline. Participants returned annually for up to 4 years after baseline.
Inclusion and exclusion criteria
Inclusion and exclusion criteria for WALCS II have been reported14,19 and are summarized here. PAD was defined as an ankle–brachial index (ABI) < 0.90. Absence of PAD was defined as an ABI ≥ 0.90 and ≤ 1.30. Potential patients with a lowest leg ABI > 1.30 were excluded. Patients with dementia, nursing home residents, wheelchair-bound patients, patients with recent major surgery, and patients with foot or leg amputations were excluded. Non-English-speaking patients were excluded.
Ankle–brachial index measurement
After participants had rested supine for 5 minutes, a hand-held Doppler probe (Nicolet Vascular Pocket Dop II; Golden, CO, USA) was used to measure systolic pressures in the right brachial, dorsalis pedis, and posterior tibial arteries and the left brachial, dorsalis pedis, and posterior tibial arteries. Each pressure was measured twice. The ABI was calculated by dividing average pressures in each leg by the average of the four brachial pressures. 19 Average brachial pressures in the arm with highest pressure were used when one brachial pressure was higher than the opposite brachial pressure in both measurement sets, and the two brachial pressures differed by 10 or more mmHg in at least one measurement set. In these cases, subclavian stenosis was possible. 20 The lowest leg ABI was used in analyses.
Functional performance
Functional performance measures were obtained at baseline and annually for up to 4 years.
Six-minute walk
Following a standardized protocol,13,14,16 participants walked up and down a 100-foot hallway for 6 minutes after being given instructions to cover as much distance as possible.
Four-meter walking velocity
Walking velocity was measured with a 4-meter walk performed at ‘usual’ and ‘fastest’ pace according to a previously defined protocol.13,14,16
Repeated chair rises
Participants sat in a straight-backed chair with arms folded across their chest and stood five times consecutively as quickly as possible. Time to complete five chair rises was measured. 21
Standing balance
Participants were asked to hold three increasingly difficult standing positions for 10 seconds each: standing with feet together side-by-side and parallel (side-by-side stand), standing with feet parallel with the toes of one foot adjacent to and touching the heel of the opposite foot (semi-tandem stand), and standing with one foot directly in front of the other (tandem stand). 21
Short Physical Performance Battery (SPPB)
The SPPB combines data from the usual-paced 4-meter walking velocity, time to rise from a seated position five times, and standing balance. Individuals receive a zero score for each task they are unable to complete. Scores of 1 to 4 are assigned for remaining tasks, based upon quartiles of performance from the Established Populations for the Epidemiologic Study of the Elderly. 21 Scores are summed to obtain the SPPB, ranging from 0 to 12.
Death
Information on deaths was obtained through 23 May 2009 from family members, proxies, primary care physicians, and the Social Security Administration Death Index. Death certificates were obtained from the state in which death occurred or the patient’s medical record. Cardiovascular disease (CVD) deaths were those with International Classification of Disease-10 codes in the range I01.0 through I99.9, including deaths from coronary heart disease, stroke, PAD, and other CVD.
Calf muscle cross-sectional area
Computed tomography (CT) scans (LightSpeed; General Electric Medical Systems, Waukesha, WI, USA) of calf skeletal muscle were performed at baseline, 2-year follow-up, and 4-year follow-up with 2.5 mm cross-sectional images of the calves at 66.7% of the distance from the distal to the proximal tibia. 13 Images were analyzed using BonAlyse (BonAlyse Oy, Jyvaskyla, Finland) software to quantify muscle tissue, fat, and bone. 13
Peripheral nerve function
Electrodiagnostic testing of peripheral nerve function was performed at baseline and 2-year follow-up in both legs and in a randomly selected ulnar motor nerve by the electrodiagnostic supervisor at the Northwestern Memorial Hospital. 18
Vitamin D levels
Levels of 25-hydroxyvitamin D were measured using the direct, competitive, chemiluminescence immunoassay with the DiaSorin LIAISON® 25-OH Vitamin D Total assay (Heartland Assays, Ames, IA).22,23 The coefficient of variation percent (CV) for measurement of vitamin D among 81 split sample specimens was 3.74. Values were adjusted for the season in which they were collected.
Comorbidities
Validated algorithms combining data from patient report, physical examination, medical record review, medications, laboratory values, and a primary care physician questionnaire were used to verify and document comorbidities at baseline. 24 For example, a diagnosis of diabetes mellitus required the presence of two of the following four criteria: (1) patient-reported history of physician-diagnosed diabetes mellitus; (2) an elevated hemoglobin A1C value from medical record review; (3) use of insulin or an oral hypoglycemic agent; and (4) a report of diabetes mellitus on the primary care physician questionnaire. A participant was also classified with diabetes mellitus if none of the first three criteria were true, but the physician reported the presence of diabetes mellitus on the primary care physician questionnaire and this was confirmed when the physician was re-contacted to verify the presence of diabetes. Comorbidities assessed were diabetes mellitus, pulmonary disease, cancer, number of cardiovascular diseases (angina, myocardial infarction, stroke, heart failure) and number of arthritic diseases (spinal stenosis, disk disease, knee or hip osteoarthritis, and rheumatoid arthritis).
Other measures
Height and weight were measured. Body mass index (BMI) was calculated as weight (kg)/(height (m))2. Cigarette smoking history and alcohol consumption were based on self-report. Physical activity was measured using patient-reported blocks walked in the past week. 25
Statistical analyses
Baseline 25-hydroxyvitamin D levels were categorized using definitions from the Institute of Medicine, which defined deficient vitamin D status as 25-hydroxyvitamin D levels < 30 nmol/L, possibly inadequate vitamin D status as 30–50 nmol/L, and sufficient levels as 50 nmol/L or greater. 26 The Institute of Medicine stated that levels above 75 nmol/L are not associated with additional benefit. Therefore, the following four categories of vitamin D levels were defined: vitamin D < 30 nmol/L, vitamin D 30 to < 50 nmol/L, vitamin D 50 to < 75 nmol/L, and vitamin D 75 to < 120 nmol/L. Participants with values >= 120 nmol/L were excluded. Analyses of variance and statistical tests for trend were used to compare baseline characteristics across these vitamin D categories among participants with and without PAD.
Associations of baseline vitamin D categories with average annual change in functional performance measures, calf muscle characteristics, and peripheral nerve function were analyzed using mixed-effects regression models, in which a subject-specific random effect accounted for the potential correlations among successive annual differences in each outcome measure. Dependent variables in each mixed-effect regression analysis were the successive annual changes in functional performance, muscle outcomes, and nerve function, respectively. Analyses adjusted for age, race, sex, ABI, BMI, smoking, comorbidities, physical activity, study cohort (WALCS vs WALCS II), and prior year functional performance (for functional outcomes), prior year muscle measure (for muscle outcomes), or prior year nerve function (for nerve outcomes). Analyses of change in calf muscle area additionally adjusted for tibia length.
Proportional hazards analyses were used to compare differences in all-cause and cardiovascular disease mortality across baseline vitamin D categories, adjusting for age, sex, race, number of CVD diseases at baseline, pulmonary disease, diabetes (for all-cause mortality only), smoking, BMI, physical activity, and study cohort (WALCS vs. WALCS II). The proportional hazards assumption was examined with martingale residuals and was not violated. Statistical analyses were performed using SAS statistical software (version 9.2; SAS Institute Inc., Cary, NC, USA).
Results
Of 478 participants with PAD with baseline blood samples, 349 (73%) participated in at least one follow-up visit for functional performance and 392 (82%) contributed to the mortality outcome. Of 351 participants without PAD with baseline blood samples, 240 (68%) had at least one annual follow-up visit for functional performance and 263 (75%) contributed to the mortality outcome. The mean follow-up was 39.3±16.4 months for functional outcomes, 47.5±16.3 months for mortality, 43.1±14.9 months for calf muscle measures, and 25.0±3.3 months for peripheral nerve function. Among PAD participants, there were no significant differences between those included in analyses and those missing follow-up or covariate data (data not shown). Among non-PAD participants, those included in analyses had higher vitamin D levels than those excluded due to missing follow-up or covariate data: 55.69±23.75 vs 40.84±16.26, p=0.04.
Mean vitamin D levels were 53.9±25 vs 55.7±23.7 nmol/L among participants with and without PAD, respectively (p=0.362). Eighty (20%) of 395 PAD participants and 36 (14%) of 263 participants without PAD had a baseline vitamin D level < 30 nmol/L, consistent with vitamin D deficiency.
Among participants with or without PAD, lower vitamin D levels were associated with higher BMI, lower physical activity, and higher prevalences of African-Americans and diabetes mellitus (Table 1). Among participants with PAD, low vitamin D levels were associated with higher prevalences of women and current smoking and a lower prevalence of vitamin D supplementation (Table 1). Among participants without PAD, low vitamin D levels were associated with a higher prevalence of heart failure.
Baseline characteristics associated with vitamin D levels among study participants (n=658).
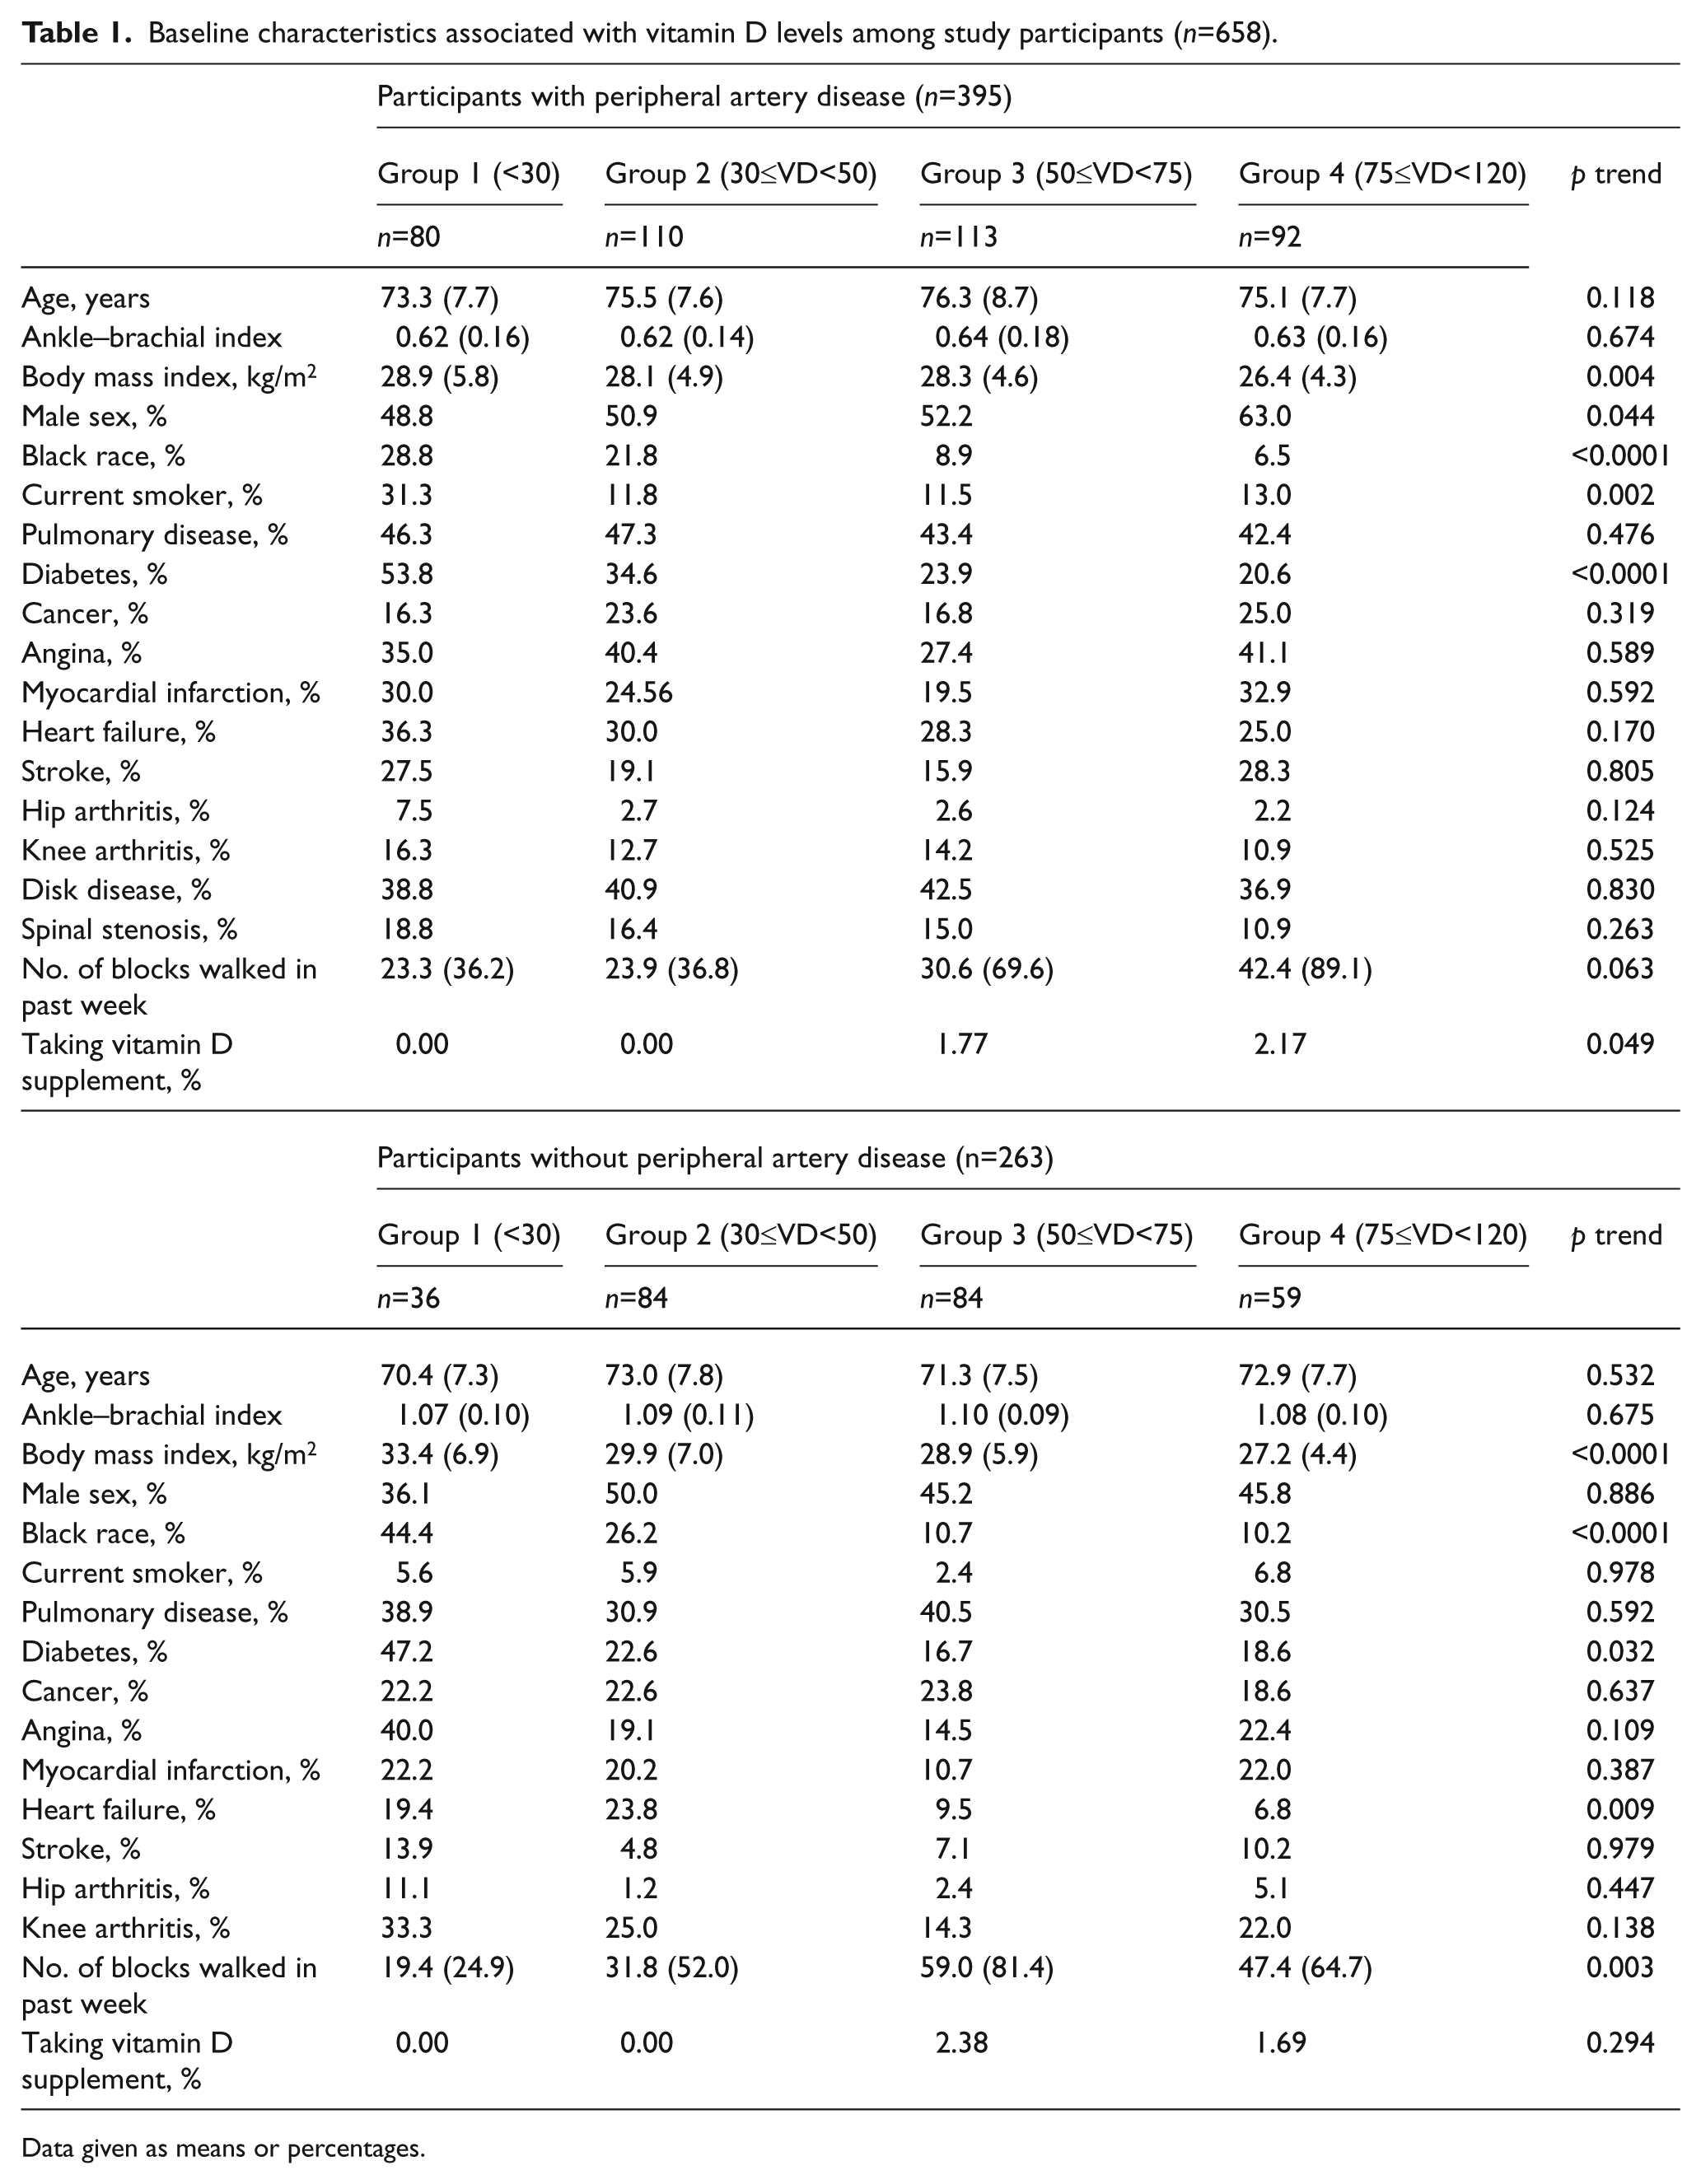
Data given as means or percentages.
Among PAD participants, vitamin D levels were associated with a faster decline in the 6-minute walk (p trend=0.012), adjusting for age, sex, race, comorbidities, BMI, smoking, physical activity, ABI, prior year performance, and study cohort (Figure 1). PAD participants with baseline vitamin D levels < 30 nmol/L had a faster decline in the 6-minute walk compared to those with vitamin D levels of 50 to < 75 (p=0.040), a faster decline in the SPPB score compared to those with vitamin D levels of 30 to < 50 (p=0.028), and a faster decline in the SPPB score as compared to those with vitamin D levels of 50 to < 75 nmol/L (p=0.034) (Figure 1).
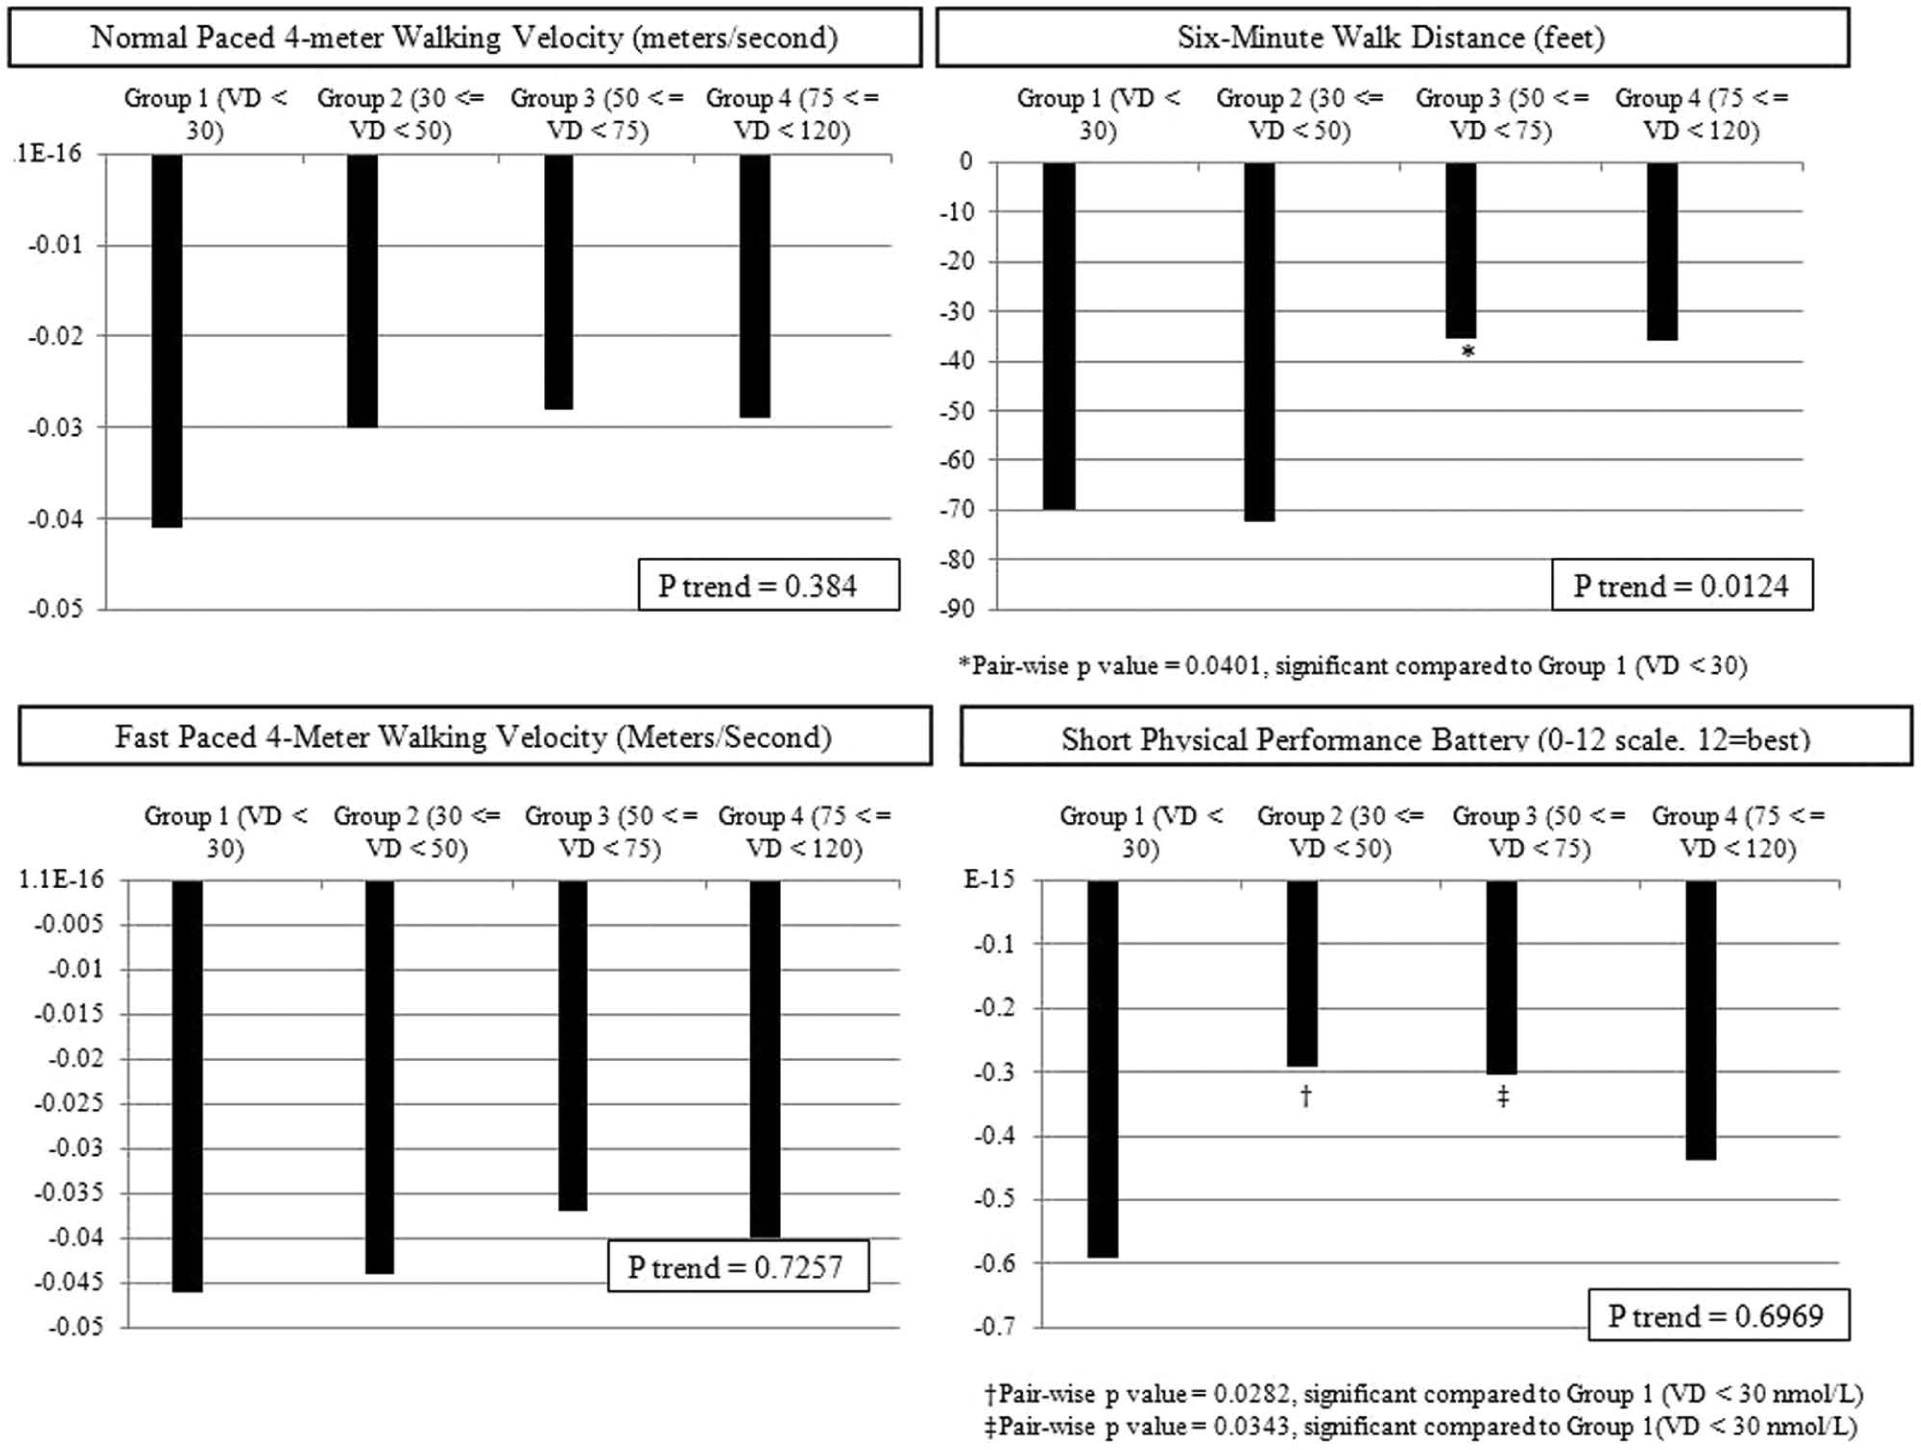
Adjusted average annual change in functional performance across baseline vitamin D categories among participants with peripheral artery disease.
Among participants without PAD, lower baseline vitamin D levels were associated with a faster decline in the fast-paced 4-meter walking velocity, adjusting for age, sex, race, comorbidities, BMI, smoking, physical activity, ABI, study cohort, and prior year performance (p trend=0.003). Non-PAD participants with baseline vitamin D levels < 30 nmol/L had a faster decline in the fast-paced 4-meter walking velocity, compared to those with baseline vitamin D levels of 75 to < 120 nmol/L (p=0.0164) (Figure 2).
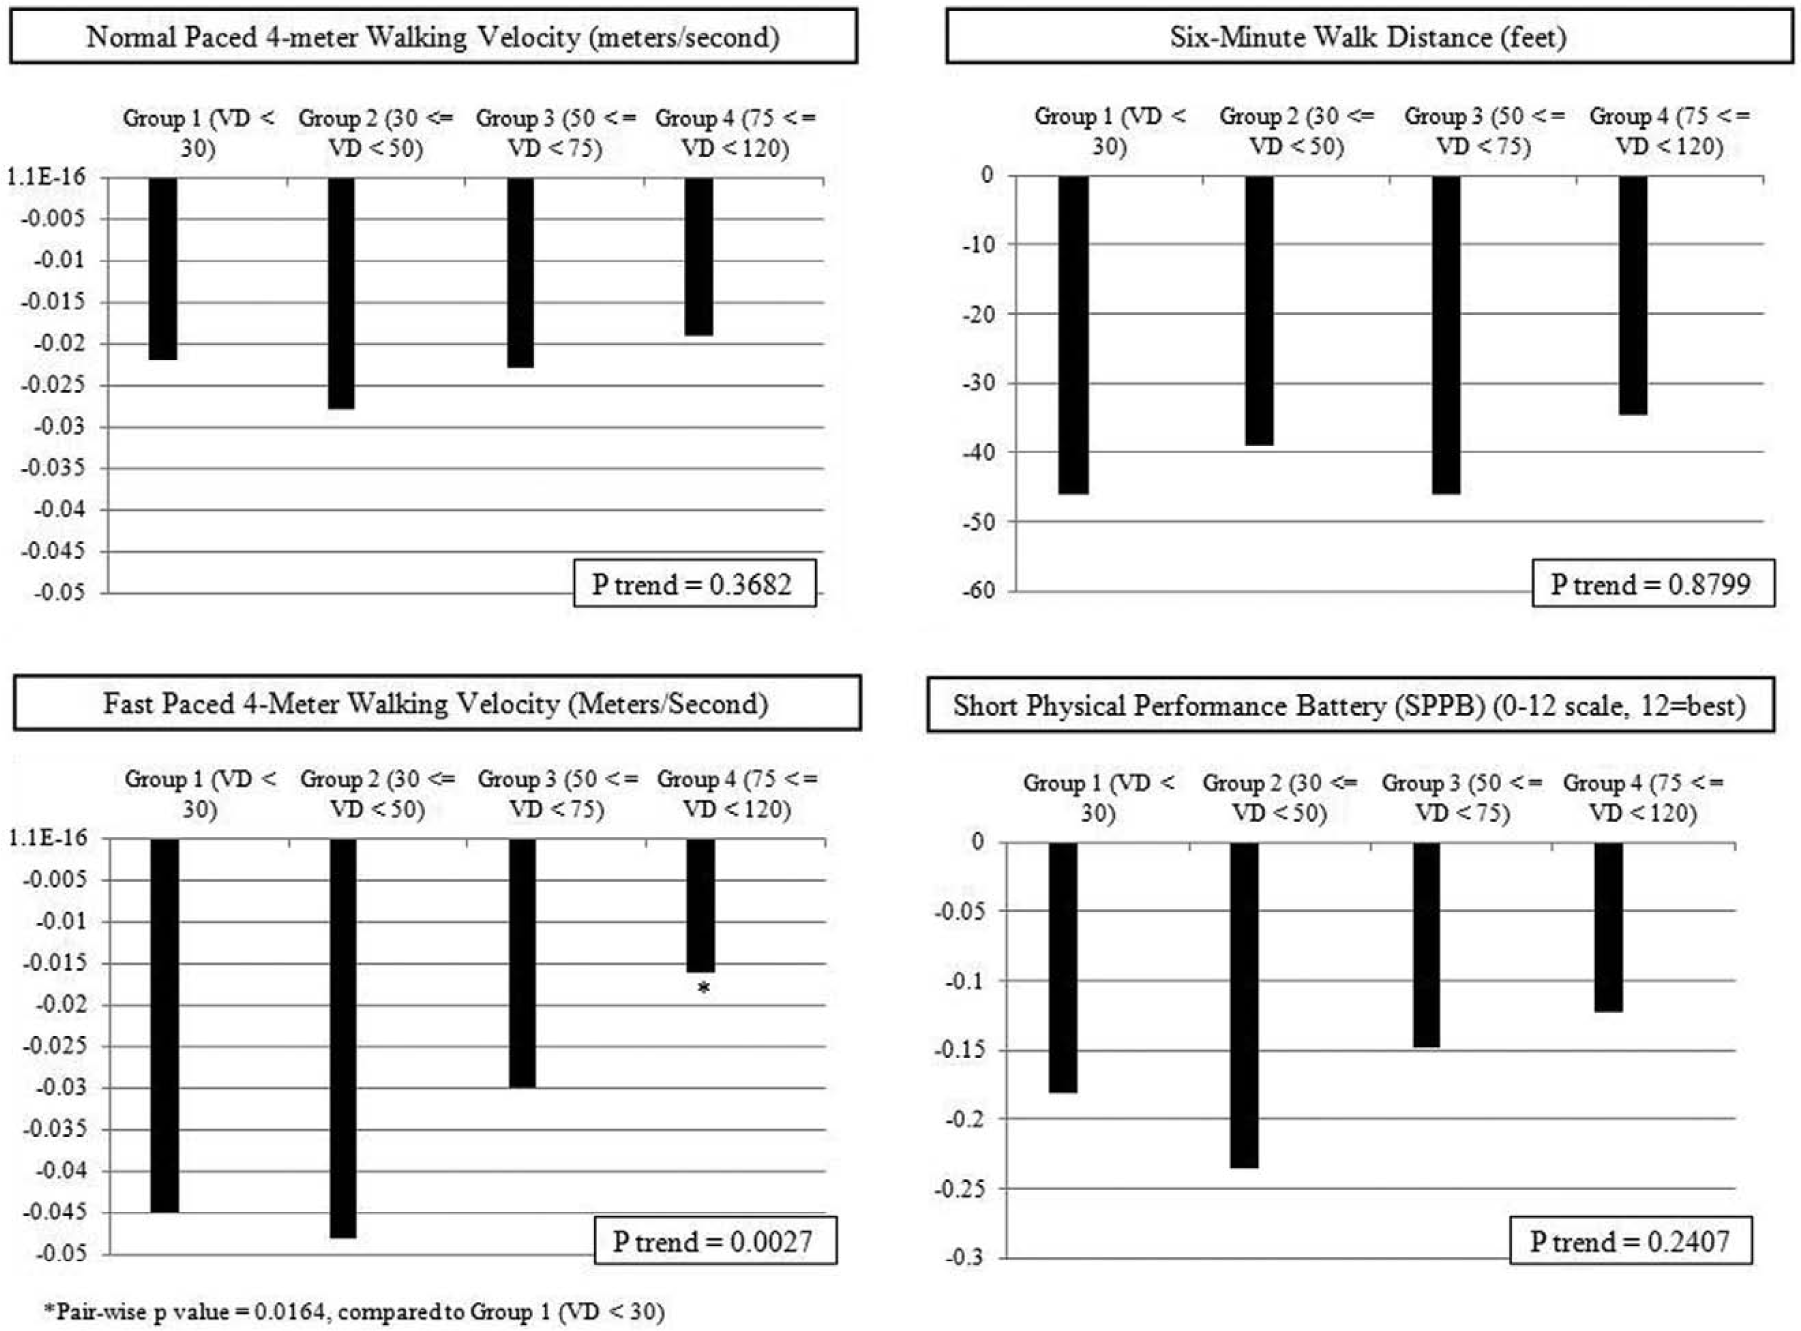
Adjusted average annual change in functional performance across baseline vitamin D categories among participants without peripheral artery disease.
Among participants with and without PAD, associations of baseline vitamin D with subsequent functional decline did not substantially change when analyses were repeated with additional adjustment for missing data patterns (data not shown). Associations of baseline vitamin D with subsequent functional decline did not substantially change when analyses were repeated separately among tertiles of physical activity, measured by blocks walked in the past week (data not shown).
Among PAD participants, 93 (24%) died during follow-up. Of these, 31 (33%) deaths were due to CVD. Among participants with PAD, there were no associations of baseline vitamin D levels with all-cause or CVD mortality, adjusting for age, sex, race, BMI, pulmonary disease, number of CVD diabetes (adjusted for in all-cause mortality analyses only), physical activity, or study cohort (Table 2).
Adjusted associations of baseline vitamin D levels with mortality among individuals with and without PAD.
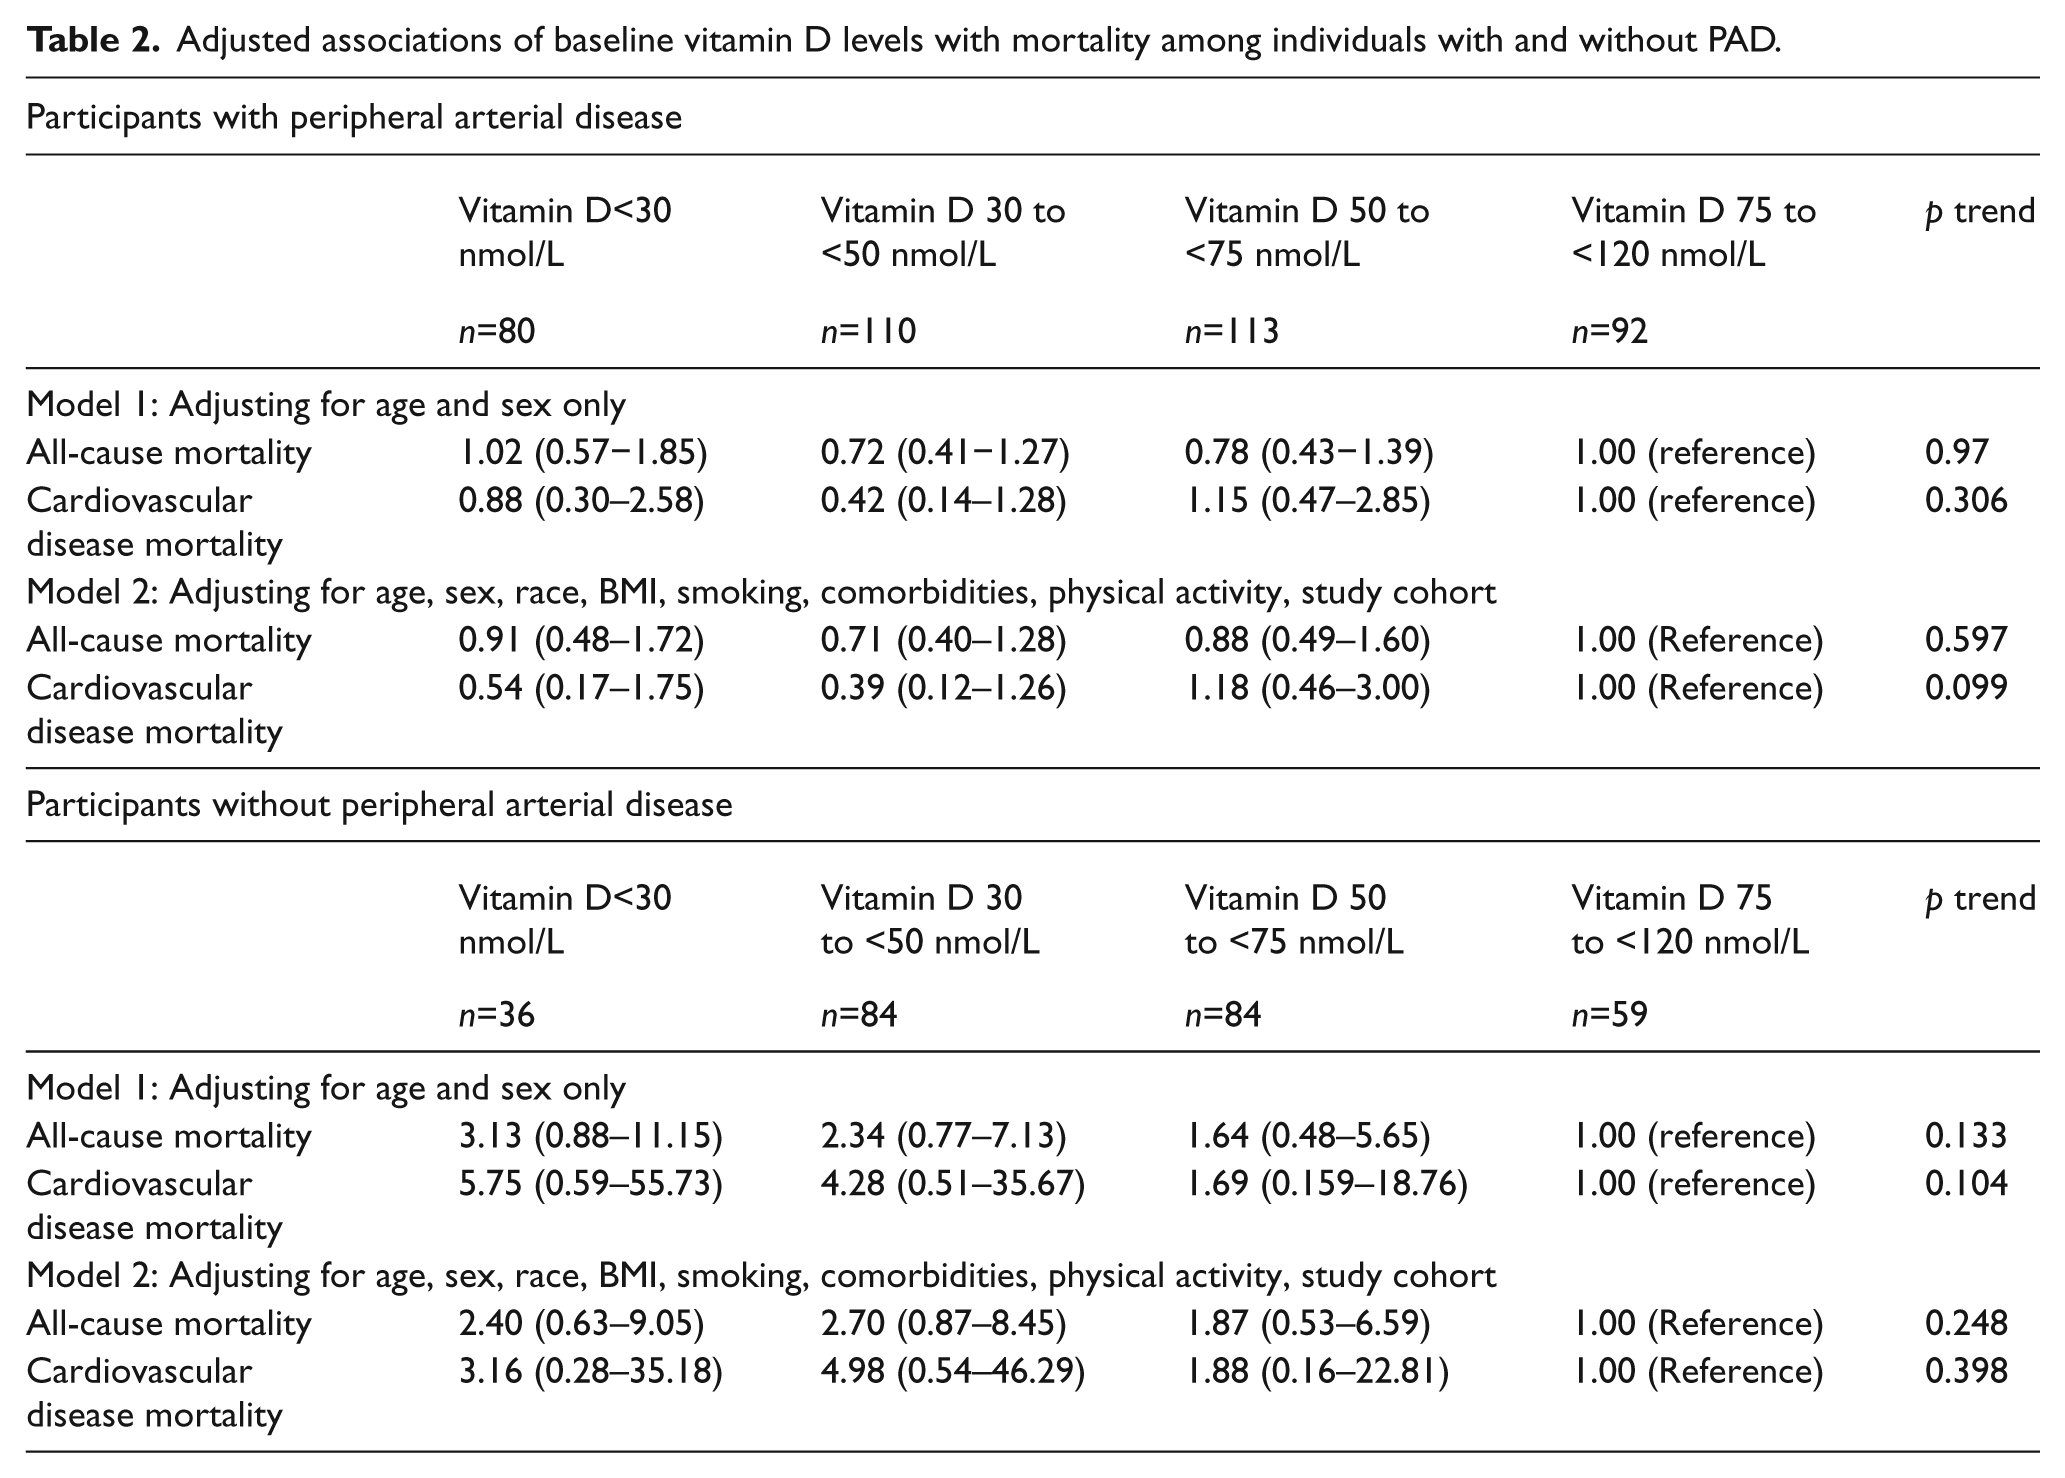
Among participants without PAD, 31 (12%) died during follow-up. Of these, 12 (39%) deaths were due to CVD.
Among participants with PAD, there were no associations of baseline vitamin D levels with all-cause or CVD mortality, adjusting for age, sex, race, BMI, pulmonary disease, number of CVD diseases, diabetes (adjusted for in all-cause mortality analyses only), physical activity, or study cohort (Table 2).
PAD participants with baseline vitamin D levels < 30 nmol/L had a greater decline in calf muscle area compared to those with baseline vitamin D levels of 50 to < 75 nmol/L (p=0.009), adjusting for age, sex, race, BMI, smoking, comorbidities, prior muscle measurements, and study cohort. There were no other significant associations of lower vitamin D levels with change in calf skeletal muscle characteristics (Appendix). Lower baseline vitamin D levels were not associated with greater declines in peripheral nerve function at 2-year follow-up, adjusting for confounders (Appendix).
Results did not change after additional adjustment for glomerular filtration rate (data not shown).
Discussion
Among PAD participants, we found that lower vitamin D levels were associated with a faster decline in the 6-minute walk distance at the 3-year follow-up when compared to higher vitamin D levels. The magnitude of difference in the average annual decline in the 6-minute walk between the lowest and highest categories of baseline vitamin D was larger than a small meaningful difference but smaller than a large meaningful difference. 27 PAD participants with baseline vitamin D levels < 30 nmol/L had faster SPPB score declines when compared to those with baseline vitamin D levels of 30 to < 50 nmol and compared to those with baseline vitamin D levels of 50 to < 75 mmol/L. These differences in SPPB decline were consistent with a small meaningful difference in the SPPB. 27 To our knowledge, no prior studies have assessed the associations of vitamin D levels with prospectively assessed outcomes in people with PAD.
Our findings are important because people with PAD have more adverse skeletal muscle characteristics and significantly faster functional decline and mobility loss compared to people without PAD. 14 Animal models suggest that low vitamin D may contribute to adverse changes in skeletal muscle and functional decline11,12 and recent data demonstrate that low vitamin D levels may be common in people with PAD. 17 Based on our findings reported here, further study is needed to determine whether vitamin D therapy improves walking endurance and other measures of functional performance in people with PAD. Our observational study design does not allow us to conclude that vitamin D therapy improves walking endurance or prevents a 6-minute walk decline in people with PAD.
People with PAD have reduced physical activity levels compared to people without PAD.16,25 Lower physical activity levels in people with PAD may lessen sunlight exposure, thereby lowering vitamin D levels. Furthermore, PAD patients with lower physical activity levels have faster functional decline than PAD patients with higher vitamin D levels. 25 To determine whether the association of low physical activity with reduced vitamin D levels explains our findings, we examined the association of vitamin D levels with decline in functional performance measures among PAD patients stratified by their physical activity levels. Our results showed that low vitamin D levels were associated with functional decline even within subgroups of PAD and non-PAD participants with low, medium, and high physical activity levels. These results suggest that differences in physical activity level across categories of vitamin D levels may not explain our results.
Previous studies among individuals without PAD suggest that vitamin D may be protective against cardiovascular events.5,28,30 However, among participants with PAD, our results show no association of lower baseline vitamin D levels with higher all-cause or CVD mortality. Although hazard ratios for participants without PAD suggested that low vitamin D was associated with increased all-cause and CVD mortality, results were not statistically significant. Together, these findings suggest that once significant atherosclerosis has developed, such as in patients with PAD, low vitamin D levels may not be an important determinant of mortality.
Our study has limitations. First, data were collected from participants in Chicago, IL, where colder winter climates may contribute to lower vitamin D levels as compared to PAD patients in southern latitudes. However, vitamin D levels among the PAD patients in our cohort are similar to those of PAD participants from the nationally representative sample of participants in the NHANES cohort. 14 Second, vitamin D levels were measured from blood samples collected between 2002 and 2004. Typical levels of vitamin D levels in patients with and without PAD may have increased or decreased since 2004. Third, our sample size may have been too small to demonstrate a significant association of low vitamin D levels with increased mortality among individuals without PAD.
In conclusion, low vitamin D levels are associated with faster declines in the 6-minute walk and SPPB score but not with increased all-cause or cardiovascular mortality among individuals with PAD. Further study is needed to confirm these findings and determine whether vitamin D supplementation improves the 6-minute walk and other functional performance measures among people with PAD who have low vitamin D levels.
Footnotes
Appendix
Adjusted associations of baseline vitamin D levels with annual change in calf muscle characteristics and peripheral nerve function among participants with and without peripheral artery disease.
| Vitamin D <30 nmol/L | Vitamin D 30 to <50 nmol/L | Vitamin D 50 to <75 nmol/L | Vitamin D 75 to <120 nmol/L | p trend | |
|---|---|---|---|---|---|
| Participants with peripheral arterial disease | |||||
| Calf muscle area | –344.7 (–443.7 to −245.7) | –280.6 (–357.0 to −204.3) | –173.8 (–248.5 to −99.20) a | –374.6 (–459.7 to −289.4) | 0.4153 |
| Calf muscle percent fat | 1.740 (0.919 to 2.560) | 1.147 (0.533 to 1.761) | 0.930 (0.335 to 1.525) | 1.647 (0.963 to 2.332) | 0.8011 |
| Calf muscle density | –0.341 (–0.765 to 0.084) | –0.824 (–1.124 to −0.524) | –0.760 (–1.046 to −0.474) | –0.823 (–1.157 to −0.489) | 0.3928 |
| Participants without peripheral arterial disease | |||||
| Calf muscle area | –399.7 (–506.3 to −293.2 | –240.6 (–307.1 to −174.1) | –244.8 (–312.9 to −176.8) | –234.8 (–308.4 to −161.2) | 0.3064 |
| Calf muscle percent fat | 3.078 (2.244 to 3.912) | 0.942 (0.425 to 1.459) | 0.987 (0.457 to 1.516) | 0.865 (0.293 to 1.437) | 0.0691 |
| Calf muscle density | –0.780 (–1.320 to −0.241) | –0.776 (–1.113 to −0.438) | –0.367 (–0.713 to −0.021) | –0.382 (–0.754 to −0.011) | 0.2557 |
| Participants with peripheral arterial disease | |||||
| Peroneal nerve conduction velocity | –2.10 (–4.99 to 0.77) | –3.56 (–5.82 to −1.31) | –1.82 (–4.08 to 0.44) | –2.112 (–4.68 to 0.46) | 0.519 |
| Sural nerve conduction velocity | –3.58 (–9.19 to 1.94) | –0.81 (–5.18 to 3.563) | 0.87 (–3.53 to 5.27) | –1.78 (–6.75 to 3.19) | 0.776 |
| Ulnar nerve conduction velocity | –2.35 (–3.82 to −0.88) | –1.54 (–2.72 to −0.36) | –0.99 (–2.17 to 0.18) | –1.14 (–2.48 to 0.20) | 0.405 |
| Participants without peripheral arterial disease | |||||
| Peroneal nerve conduction velocity | –1.30 (–3.54 to 0.94) | –1.69 (–3.02 to −0.35) | –1.05 (–2.38 to 0.28) | –1.35 (–2.82 to 0.12) | 0.676 |
| Sural nerve conduction velocity | 4.46 (–2.20 to 11.12) | –0.49 (–4.44 to 3.47) | –0.63 (–4.63 to 3.37) | –4.70 (–9.03 to −0.36) | 0.072 |
| Ulnar nerve conduction velocity | –0.58 (–2.31 to 1.14) | –0.57 (–1.62 to 0.47) | –1.58 (–2.63 to −0.53) | –1.60 (–2.76 to −0.44) | 0.230 |
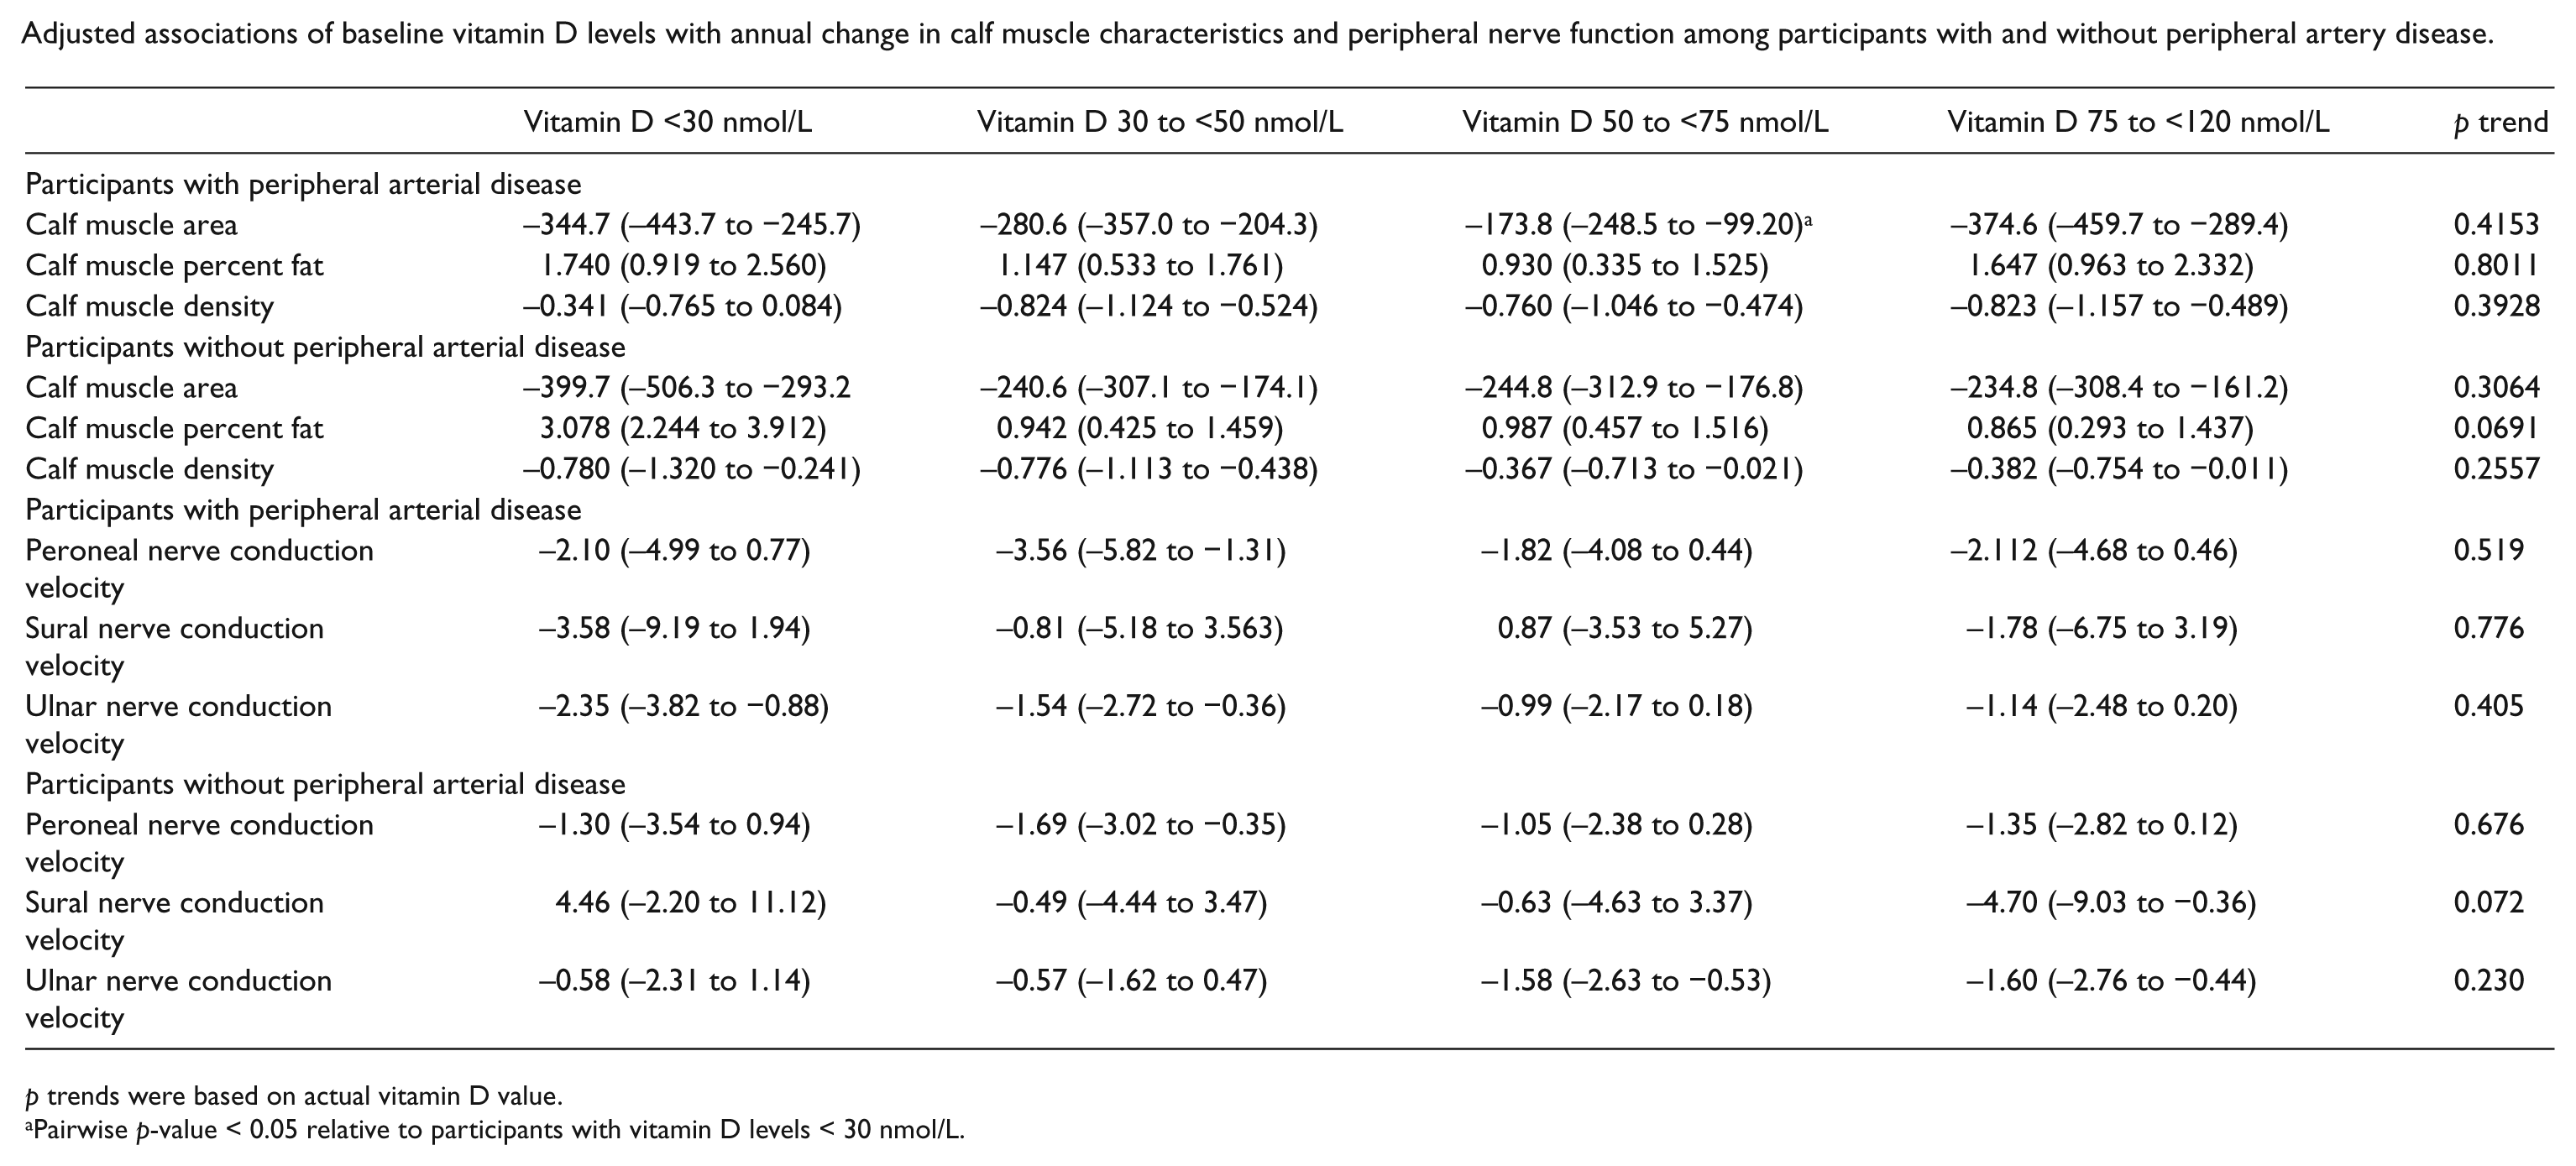
p trends were based on actual vitamin D value.
Pairwise p-value < 0.05 relative to participants with vitamin D levels < 30 nmol/L.
Declaration of conflicting interest
The authors declare that there are no conflicts of interest.
Funding
Funded by the National Heart, Lung, and Blood Institute and by the Office of Dietary Supplements, National Institutes of Health (R01-HL096849) (Bethesda, MD, USA). Supported by the National Institute on Aging (Bethesda, MD, USA).