
Abstract
Impaired fasting glucose (IFG) in diabetes is a risk factor for arterial stiffness and cardiovascular disease (CVD), but the impact of a slightly high-normal glucose level remains controversial. We investigated whether slightly high-normal fasting plasma glucose (FPG) was independently associated with arterial stiffness in non-diabetic community-dwelling persons. We recruited 114 men aged 69 ± 9 years (range 40–89) and 208 women aged 68 ± 7 years (range 36–84) during their annual health examination in a single community. Arterial stiffness was evaluated by the mean of the right and left brachial–ankle pulse wave velocity (ba-PWV). Age-adjusted ba-PWV increased significantly from the lowest to the highest FPG group (p < 0.001). Multiple linear regression analyses for ba-PWV revealed that FPG levels (β=0.154, p < 0.001) were independently and significantly associated with ba-PWV. The multivariate-adjusted ba-PWV value of the high-normal glucose group (Group 3: 95–100 mg/dL) was significantly higher than that of the lowest normal glucose group (Group 1: 52–89 mg/dL) (p=0.021), and the ba-PWV value in the IFG group (Group 4: 101–125 mg/dL) was significantly higher than those of the normal glucose groups (Group 1: <90 mg/dL; Group 2: 90–94 mg/dL) (p<0.001 and p=0.009, respectively). Slightly high-normal glucose levels were associated with arterial stiffness in Japanese community-dwelling persons.
Introduction
The progressive relationship between glucose level and cardiovascular risk extends below the diabetic threshold 1 and fasting plasma glucose (FPG) is an important predictor of cardiovascular disease (CVD) after adjusting for potential confounders. Hyperglycemia increases the production of reactive oxygen species in cells and stimulates the release of the potent proinflammatory cytokines such as IL-8 and TNF-alpha. 2 Several recent studies have shown that impaired fasting glucose (IFG) in diabetes is a risk factor for arterial stiffness3–8 and CVD, 9 but the impact of a slightly high-normal glucose level remains controversial and there are few studies to investigate the relationship between high-normal FPG and increased arterial stiffness. 8 The precise mechanisms by which the level causes CVD and mortality remain unelucidated.
Arterial stiffness can be easily and noninvasively assessed by measuring pulse wave velocity (PWV). 10 Recently, brachial–ankle PWV (ba-PWV) has been proposed in Japan,11,12 and the technical simplicity and short sampling time of the method make it more feasible for screening a large population than previous methods. This method cannot isolate changes in the muscular medium-sized arteries from those in the larger conduit arteries, but a ba-PWV of 1400 cm/s 12 is useful to discriminate middle-aged patients with CVD (e.g. coronary atherosclerosis and peripheral artery diseases).13,14 Thus, increased ba-PWV may be one important explanation linking the relationship between FPG and CVD.
We investigated whether increased FPG was associated with arterial stiffness by measuring ba-PWV, and whether this association is independent of sex, body mass index (BMI) and other confounders of CVD. For this, we used cross-sectional data from community-dwelling persons without diabetes.
Materials and methods
Subjects
Participants were recruited at the time of their annual health examination in a single community. We excluded subjects with a history of anti-diabetic medication or a fasting plasma glucose of ≥126 mg/dL. A total of 322 participants completed all the procedures, including PWV measurements. The Ethics Committee of Ehime University School of Medicine approved all the procedures and written informed consent was obtained from each subject.
Evaluation of risk factors
Information on medical history, present condition, smoking status and alcohol consumption, and medication were investigated by individual interviews using a structured questionnaire. Smoking status was classified into non-current smoker and current smoker. Daily alcohol consumption was classified into non-current drinker and current drinker. Information on demographic characteristics and risk factors was collected using the clinical files. BMI was calculated by dividing weight (in kilograms) by the square of height (in meters). We measured blood pressure in the right upper arm of participants while in the sedentary position using an automatic oscillometric blood pressure recorder (BP-103i; Colin, Aichi, Japan) after having rested for at least 5 minutes. Total cholesterol (T-C), triglycerides (TG), high-density lipoprotein cholesterol (HDL-C), FPG, and creatinine (enzymatic method) were measured at the laboratory of the health examination center during an overnight fast of more than 11 hours. The plasma samples were immediately frozen and stored at −80°C until measurements were taken at the laboratory of our department. The low-density lipoprotein cholesterol (LDL-C) level was calculated by the Friedewald formula. 15 Individuals with TG levels ≥400 mg/dL were excluded. IFG was defined as a FPG level of 100–125 mg/dL by the American Diabetes Association (ADA). The estimated glomerular filtration rate (eGFR) was calculated using the following equation: 194 × Cr−1.094 × age−0.287 × 0.739 (if female). 16 Participants with an eGFR < 30 mL/min/1.73 m2 were excluded.
Measurement of PWV
Pulse wave velocity was measured using an automatic waveform analyzer (form PWV/ABI; Colin Co. Ltd, Komaki, Japan). All individuals were examined after resting in the supine position for at least 5 minutes, as described previously. 17 This device records a phonocardiogram, electrocardiogram, volume pulse form, and arterial blood pressure at the left and right brachial arteries and ankles. Values of ba-PWV were calculated using time-phase analysis between the right brachial artery pressure and the volume waveforms at both ankles. The distance between the right brachium and the ankle was estimated based on the subject’s height. We used the mean of the right and the left ba-PWV as a marker of arterial stiffness.
Statistical analysis
Statistical analysis was performed using IBM SPSS Statistics version 20 (Statistical Package for Social Science Japan, Inc., Tokyo, Japan). Data are presented as mean ± standard deviation (SD) unless otherwise specified and, for parameters with non-normal distribution (TG), the data are shown as median (interquartile range) values. In all analyses, parameters with non-normal distribution were used after log-transformation. In these analyses, the subjects were divided into four categories based on quartiles of the FPG level (Group 1: 52–89 mg/dL; Group 2: 90–94 mg/dL; Group 3: 95–100 mg/dL; Group 4 (IFG): 101–125 mg/dL), and differences among the groups were analyzed by Student’s t-test for continuous variables or χ2 test for categorical variables. Pearson’s partial correlations, after adjusting for age, were calculated in order to characterize the associations between various characteristics and ba-PWV because the levels increased with age.17,18 Multiple linear regression analysis was used to evaluate the contribution of each confounding factor for ba-PWV. Analysis of covariance (ANCOVA) was performed using a general linear model approach to determine the association between the confounding factors and ba-PWV in these analyses, ba-PWV was the dependent variable, the four categories of FPG levels were the fixed factors, and significantly confounding factors were added as covariates. The Bonferroni correction is a multiple-comparison correction used when the statistical tests are significant. A value of p<0.05 was considered significant.
Results
Characteristics of various confounding factors of subjects categorized by FPG level
Table 1 shows the characteristics of subjects categorized by FPG level. The subjects comprised 114 men aged 69 ± 9 years (range 40–89) and 208 women aged 68 ± 7 years (range 36–84). BMI, systolic blood pressure (SBP), and presence of anti-hypertensive medication were significantly higher from the lowest to the highest group, but eGFR was significantly lower.
Characteristics of subjects categorized by fasting plasma glucose level (n=322).
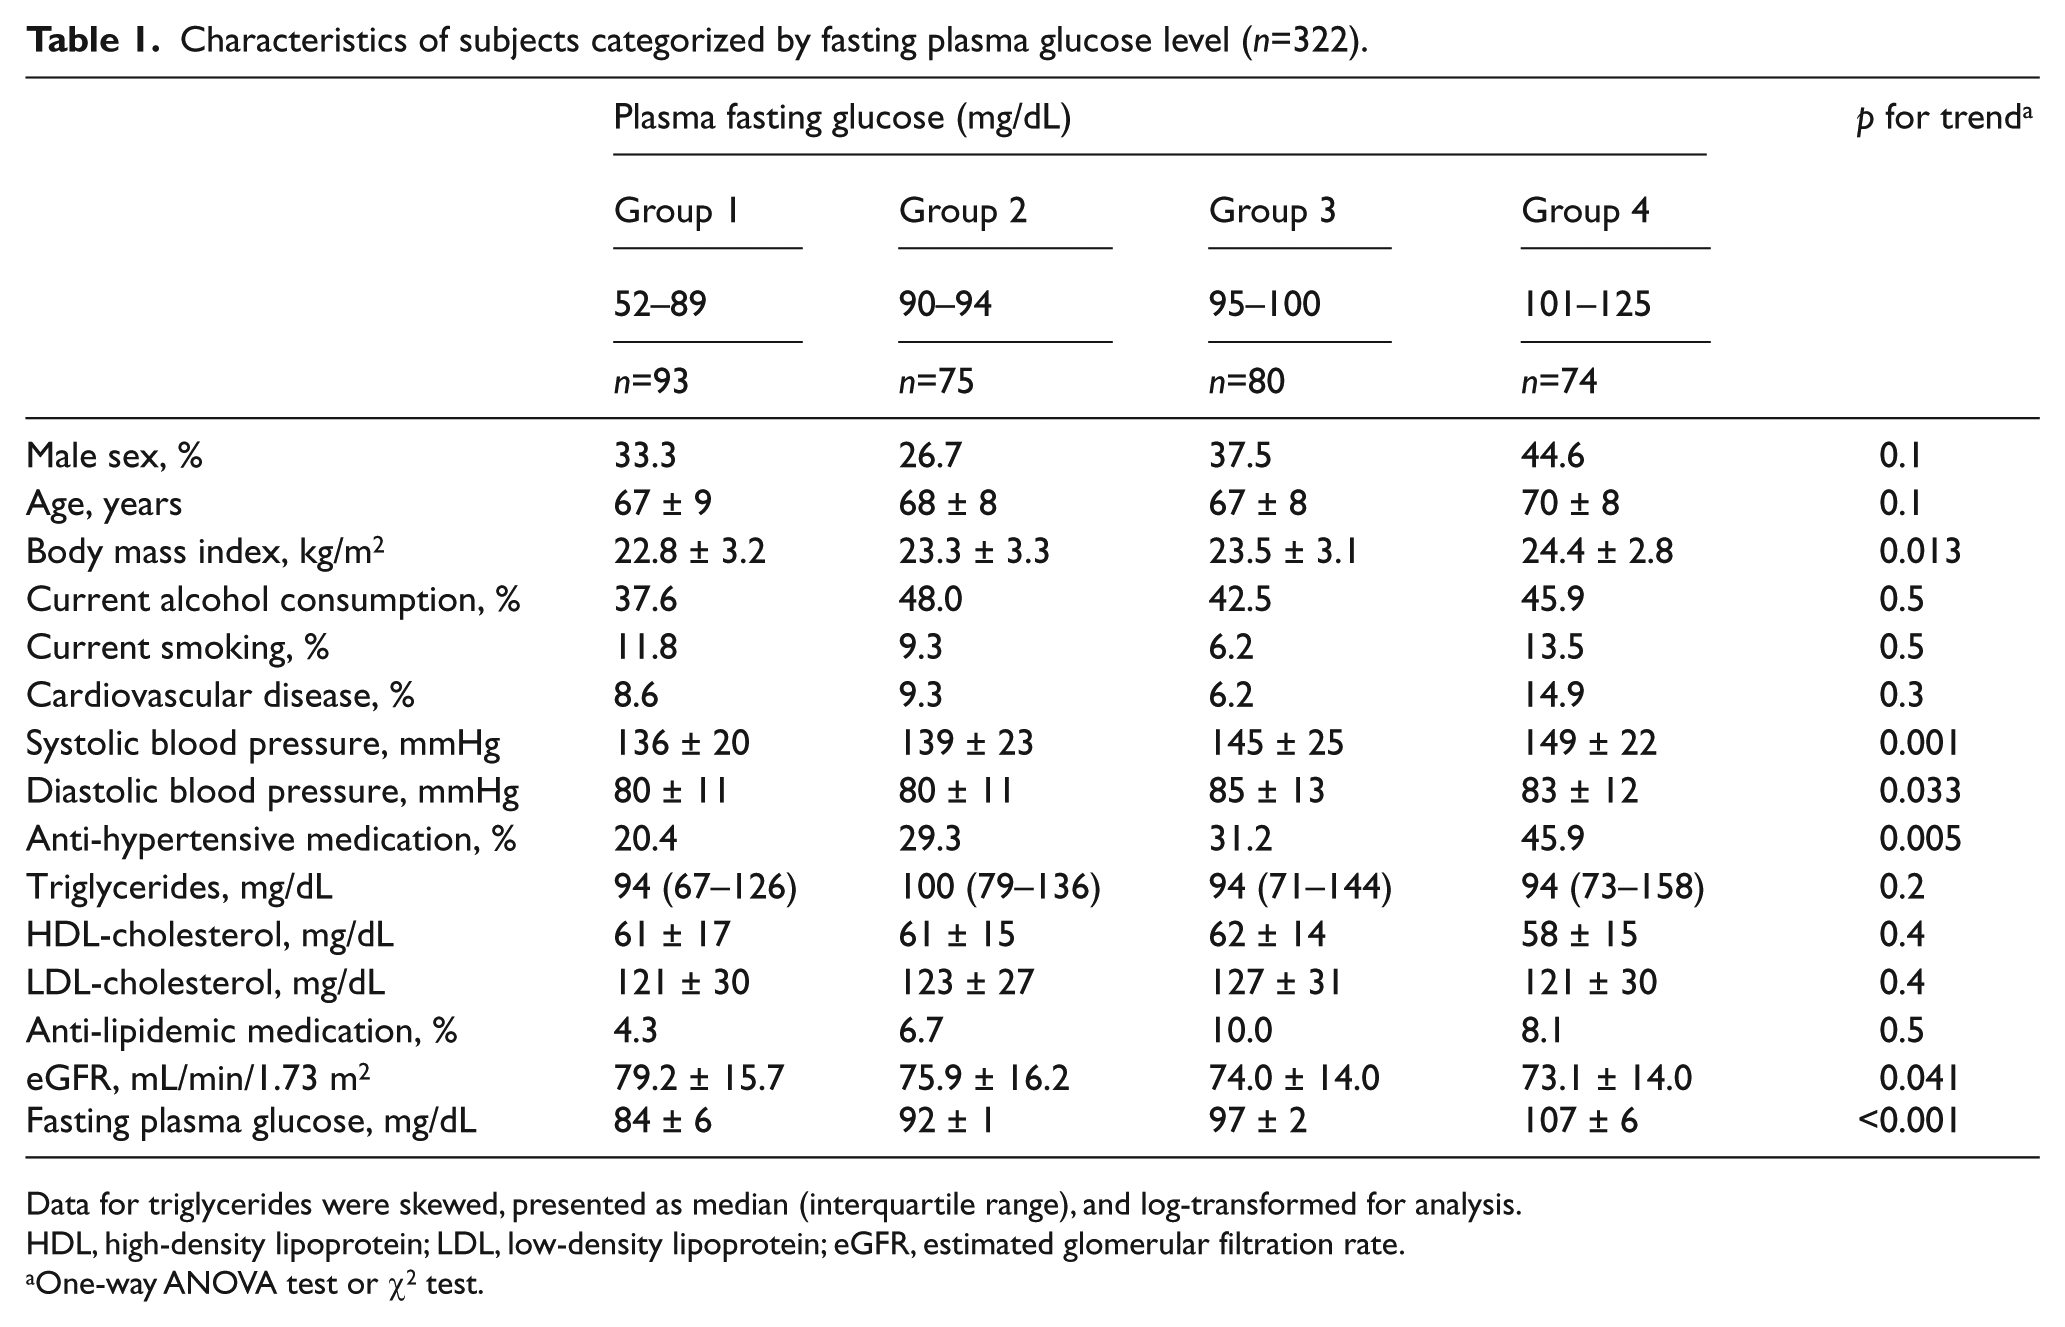
Data for triglycerides were skewed, presented as median (interquartile range), and log-transformed for analysis.
HDL, high-density lipoprotein; LDL, low-density lipoprotein; eGFR, estimated glomerular filtration rate.
One-way ANOVA test or χ2 test.
Relationship between FPG and ba-PWV
Ba-PWV increased significantly and progressively with increased FPG levels (Figure 1). As shown in Table 2, age-adjusted ba-PWV increased significantly from the lowest to the highest FPG group. Both ba-PWV values of the high-normal glucose group (Group 3: 95–100 mg/dL) and the IFG group (Group 4: 101–125 mg/dL) were significantly higher than those of the normal glucose groups (Group 1: 52–89 mg/dL; Group 2: 90–94 mg/dL).
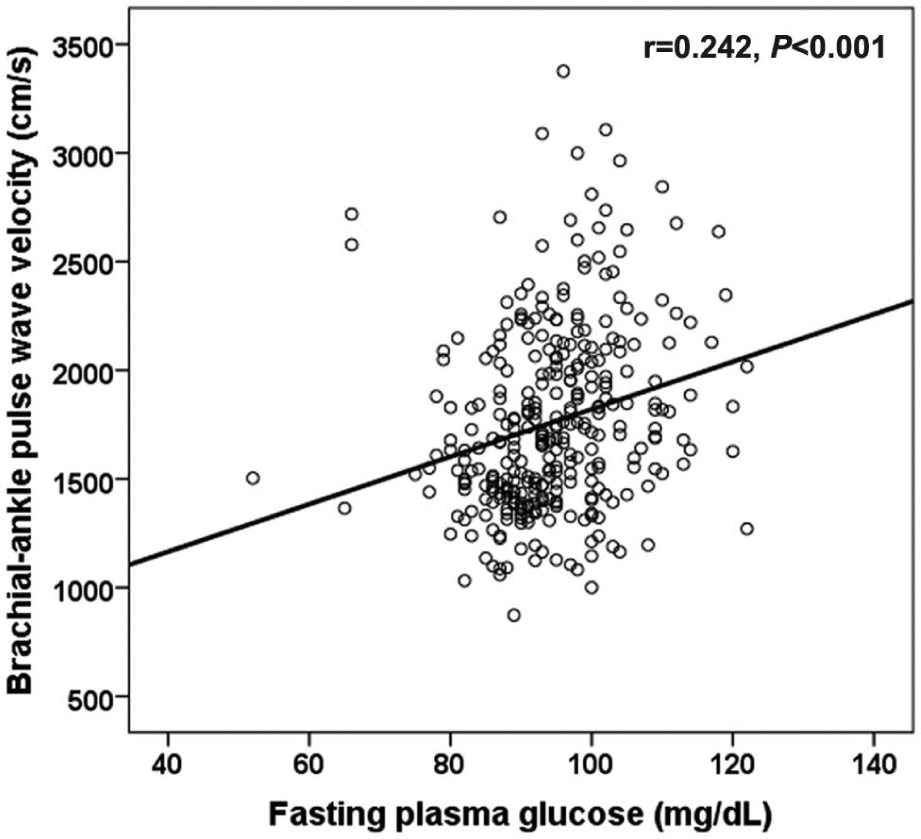
Relationship between fasting plasma glucose and brachial–ankle pulse wave velocity (ba-PWV). Ba-PWV increased significantly and progressively with increasing FPG level (r=0.242, p<0.001).
Age-adjusted pulse wave velocity of subjects categorized by fasting plasma glucose level (n=322).
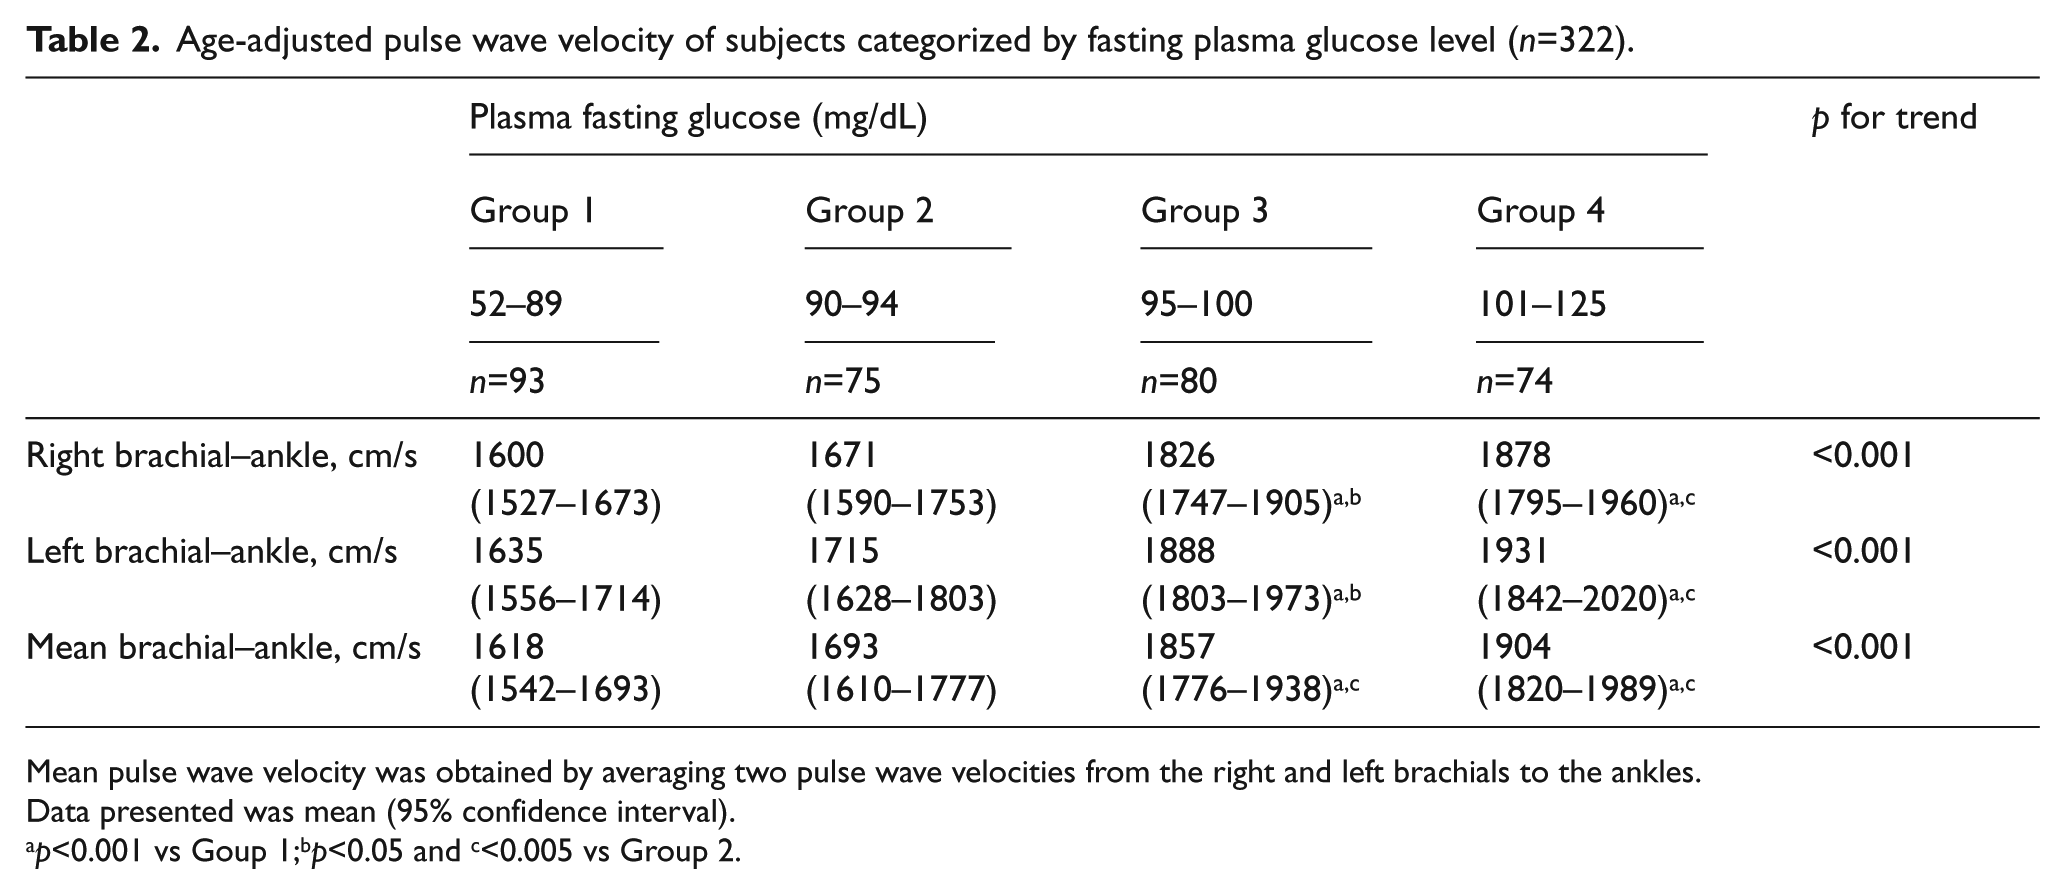
Mean pulse wave velocity was obtained by averaging two pulse wave velocities from the right and left brachials to the ankles.
Data presented was mean (95% confidence interval).
p<0.001 vs Goup 1;bp<0.05 and c<0.005 vs Group 2.
Relationship between various risk factors including FPG and ba-PWV
In Table 3, the age-adjusted Pearson’s partial correlation coefficient between confounding factors including FPG showed that FPG as well as SBP, diastolic blood pressure (DBP), presence of anti-hypertensive medication, TG, and presence of anti-dyslipidemic medication was directly associated with ba-PWV, while eGFR was inversely associated with ba-PWV.
Relationship between various confounding factors including plasma fasting glucose and brachial–ankle pulse wave velocity (n=322).
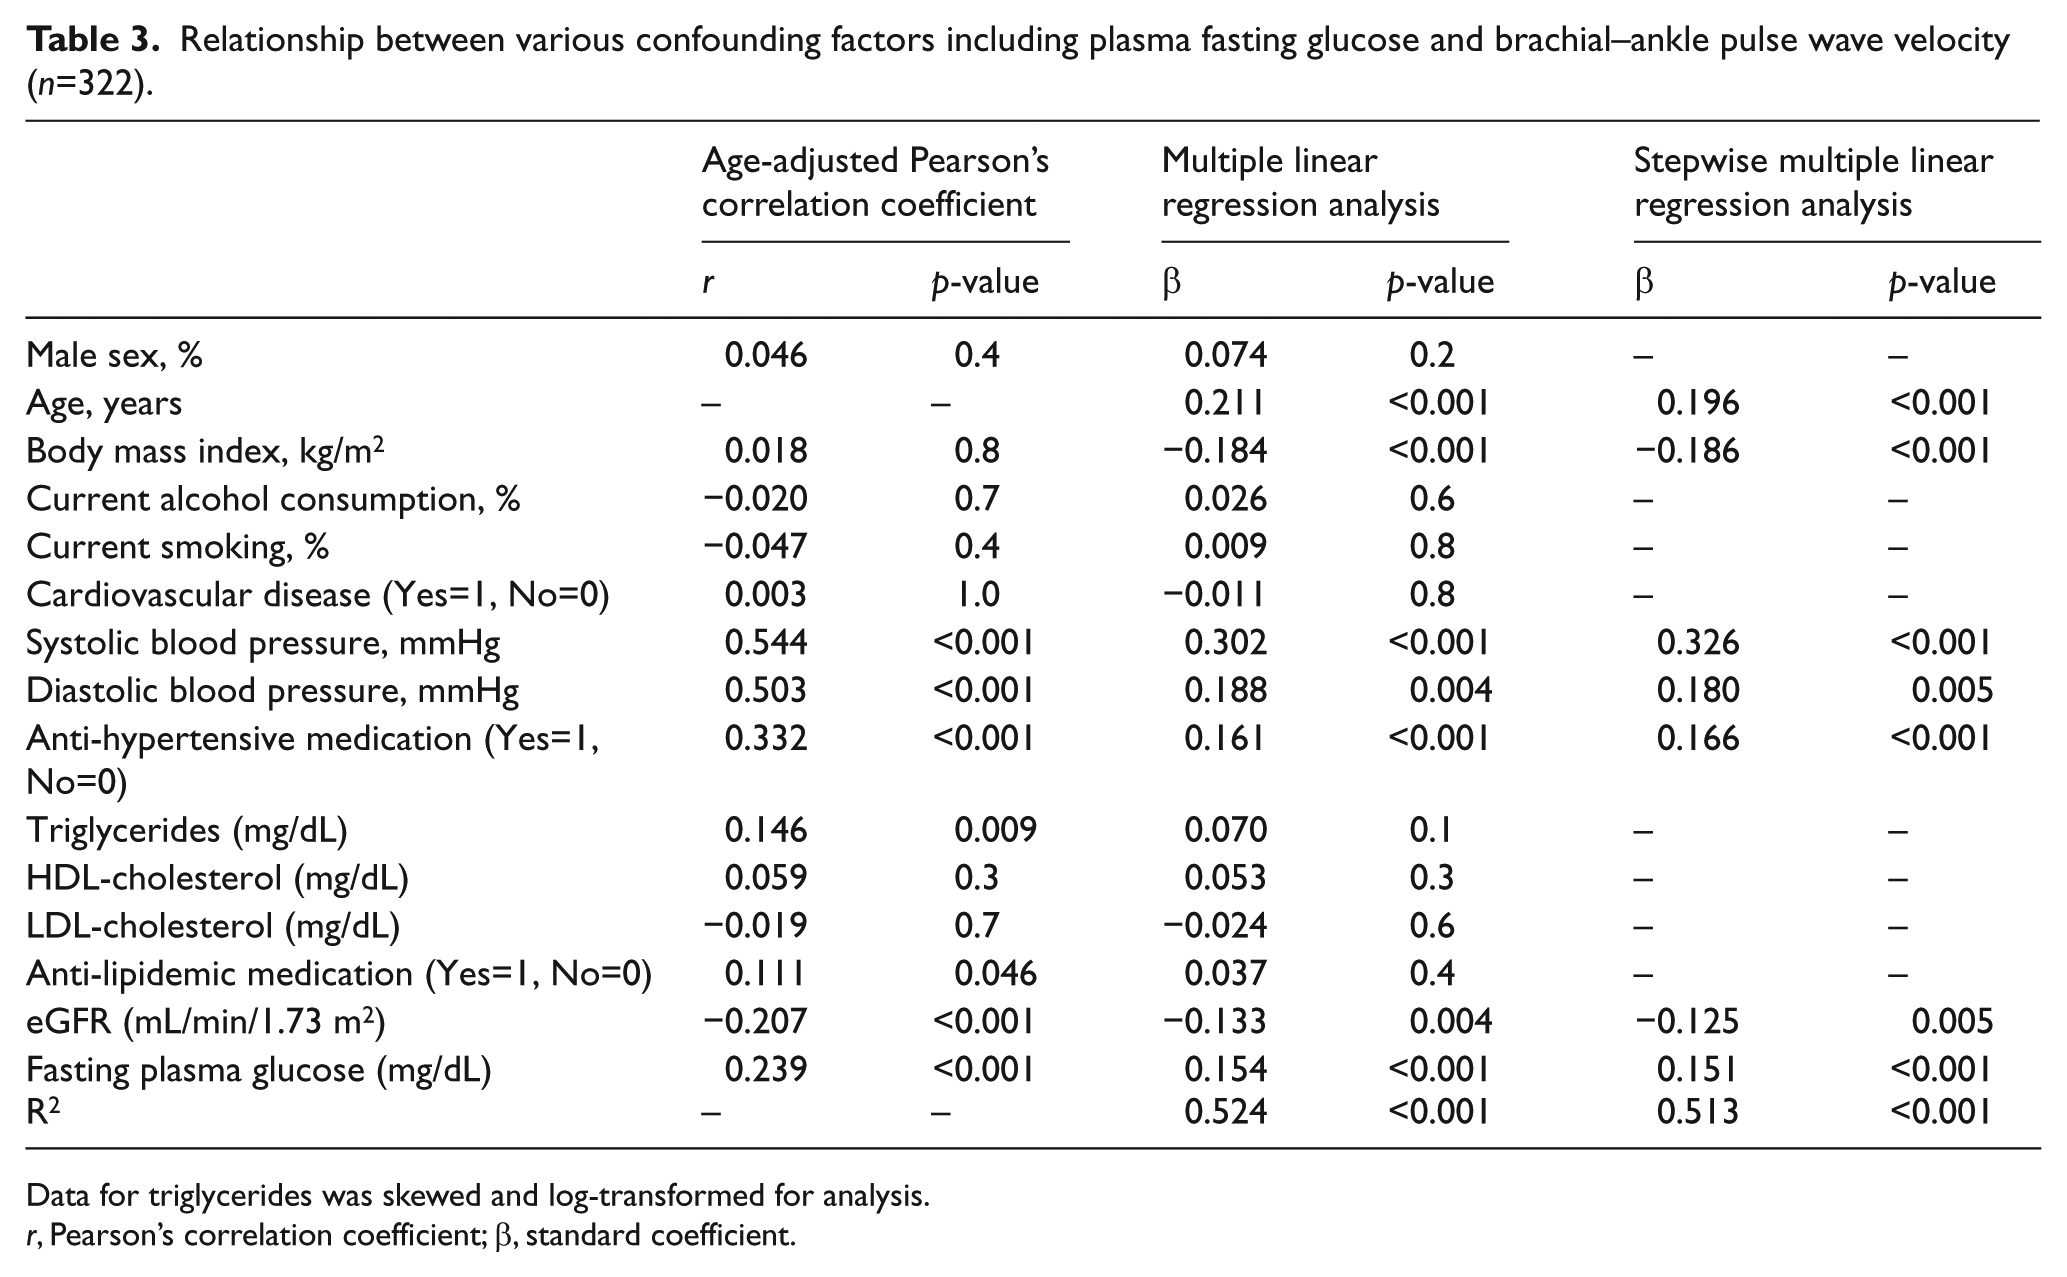
Data for triglycerides was skewed and log-transformed for analysis.
r, Pearson’s correlation coefficient; β, standard coefficient.
To further investigate whether FPG level can explain ba-PWV independent of other known confounding factors, multiple linear regression analyses for ba-PWV were performed (Table 3). They revealed that FPG levels (β=0.154) as well as age, BMI, SBP, DBP, presence of anti-hypertensive medication, and eGFR were significantly associated with ba-PWV.
Multivariate-adjusted ba-PWV of subjects categorized by FPG level
Figure 2 shows the multivariate-adjusted ba-PWV of subjects categorized by quartiles of FPG level. Ba-PWV was adjusted for sex, age, BMI, current alcohol drinker, current smoker, history of CVD, SBP, DBP, presence of anti-hypertensive medication, TG, HDL-C, LDL-C, anti-dyslipidemic medication, FPG, and eGFR. The ba-PWV value of the high-normal glucose group (Group 3: 95–100 mg/dL) was significantly higher than that of the lowest normal glucose group (Group 1: 52–89 mg/dL). The ba-PWV value in the IFG group (Group 4: 101–125 mg/dL) was significantly higher than those of the normal glucose groups (Group 1: 52–89 mg/dL; Group 2: 90–94 mg/dL).
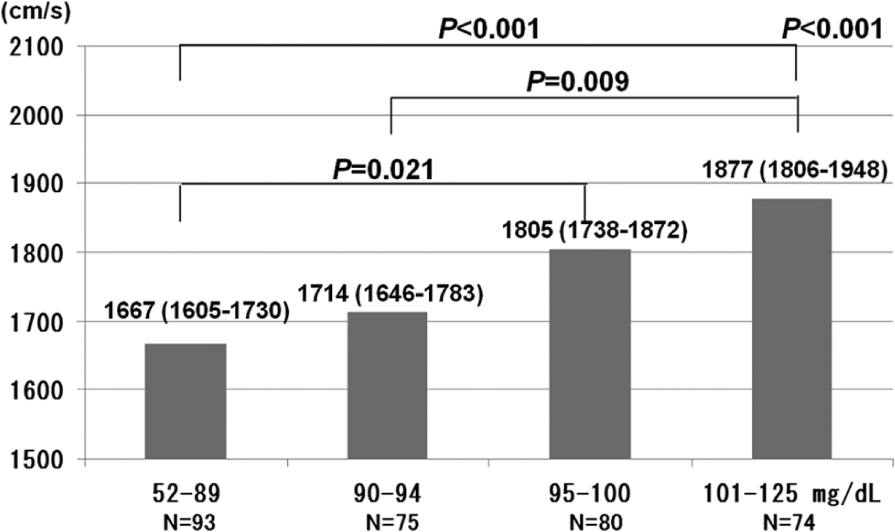
Multivariate-adjusted brachial–ankle pulse wave velocity of subjects categorized by fasting plasma glucose status. Data presented are the mean (95% confidence interval) values. Multivariate-adjusted for sex, age, body mass index, current alcohol drinker, current smoker, history of cardiovascular disease, systolic blood pressure, diastolic blood pressure, anti-hypertensive medication, triglycerides, HDL-cholesterol, LDL-cholesterol, anti-dyslipidemic medication, fasting plasma glucose, and estimated glomerular filtration rate.
Discussion
To determine the contribution of increased FPG to advanced arterial stiffness in the general population, we studied the relationship between CVD risk factors, including FPG, and arterial stiffness in non-diabetic community-dwelling persons after adjusting for confounding variables. This study showed that increased FPG was independently associated with arterial stiffness, as reflected by increased ba-PWV. In addition, we found that a slightly high-normal glucose level within a normal range is significantly associated with a higher ba-PWV.
Studies that demonstrate a relationship between FPG within a normal range and ba-PWV are very few. Xu et al. 5 showed that ba-PWV was increased in both IFG and impaired glucose tolerance (IGT) subjects compared with the normal glucose group (both p<0.001). Moreover, compared to subjects with IFG, those with IGT appeared to have a higher age- and sex-adjusted ba-PWV. However, the independent association between IFG and ba-PWV attenuated after adjustments for other confounding factors. Li et al. 6 also demonstrated that subjects with IGT and newly diagnosed diabetes, but not IFG, have a greater arterial stiffness after controlling for age, sex, BMI, waist to hip ratio, smoking status, alcohol consumption, habitual exercise, SBP, and lipid profiles. Rahman et al. 7 demonstrated that PWV was significantly higher in diabetic patients and of borderline significance in IGT subjects compared to normoglycemic individuals. Recent studies have demonstrated that FPG levels within the normal range also have an independent and positive association with ba-PWV after adjustments for confounding variables, and the mean ba-PWV of the high-normal glucose group was higher than that of the low-normal glucose group. 8 This discrepancy may be due to the adjustment of the variables and overestimation of the association between IFG and ba-PWV in their studies. 6
The mechanisms that lead to higher ba-PWV in individuals with increased FPG are not completely understood. We assumed that there are several possible mechanisms linking FPG and arterial stiffness, and several possible mechanisms linking FPG and high-sensitivity C-reactive protein (hs-CRP). In the same population, we have been shown that high FPG levels can increase levels of key proteins (e.g. hsCRP) that result in inflammation. 19 Previous epidemiological studies20,21 have suggested that the serum hsCRP level as well as confounding factors (e.g. age, BMI, SBP, heart rate, and lipid profile) were significant and independent predictors for ba-PWV. In experimental studies, hyperglycemia acutely increased levels of circulating cytokines such as tumor necrosis factor-alpha (TNF-α) and interleukin-6 (IL-6) production by human monocytes 22 and an oxidative mechanism. 23 Further, increased advanced glycation end-product (AGE) levels induced by hyperglycemia can lead to the loss of vascular and cardiac compliance. 24
Several limitations of this study must be considered. First, based on its cross-sectional design, the present findings are inherently limited in the ability to eliminate causal relationships between risk factors and PWV. Second, since the majority of the study population had several risk factors, including insulin resistance, hypertension, and advanced age, we could not eliminate the possible effects of underlying diseases and medications used for hypertension and dyslipidemia on the present findings. Third, FPG is based on a single assessment, which may introduce misclassification bias. Therefore, the demographics and referral source may limit generalizability.
In conclusion, the present study showed that a slightly high-normal glucose level is associated with an increased risk of PWV in the general population. The underlying mechanism behind this relationship is unclear, but it seems to be independent of traditional cardiovascular risk factors such as age, BMI, smoking, hypertension, dyslipidemia, and renal function. Further prospective population-based studies are needed to investigate the mechanisms underlying this association.
Footnotes
Declaration of conflicting interest
The authors declare that they have no competing interests.
Authors’ contributions
RK, YT, and KK participated in the design of the study, performed the statistical analysis and drafted the manuscript. TK and MA contributed to the acquisition of data and its interpretation. TM conceived the study, participated in its design and coordination, and helped to draft the manuscript. All authors read and approved the manuscript.
Funding
This work was supported in part by a grant-in-aid for Scientific Research from the Foundation for Development of Community (2012).