
Abstract
Recent evidence suggests that microvascular function may be important in cardiovascular risk prediction. One measure of microvascular function is hyperaemic velocity time integral (VTI). We assessed whether the VTI of more than one beat of reactive hyperaemia would provide a stronger correlate to traditional cardiovascular risk factors using a subset of subjects from the Firefighters and Their Endothelium (FATE) study. Vascular function was assessed by measurement of hyperaemic blood velocity with high-resolution ultrasound of the brachial artery. We evaluated three measures in the current analysis: the VTI of the first beat, average VTI of 10 beats, and maximum VTI of 10 beats post-cuff release. A total of 399 male subjects (45.5 ± 10 years) were included in this analysis. Univariate correlations between the three end points and cardiovascular risk factors were calculated, and multivariable regression models constructed. Intra-observer variability was approximately equal for all VTI end points (coefficient of variation: first = 1.6%, average = 1.4%, maximum = 1.4%). Univariate correlations between VTI and cardiovascular risk factors were similar across all three end points. In multivariable analyses, there were no differences in the relationships between cardiovascular risk factors and the various VTI end points (R2 from 0.090 to 0.102). Age, systolic blood pressure, and BMI were predictors of the three VTI end points (p < 0.05). In conclusion, the first beat of reactive hyperaemia remains the suitable measure of microvascular function.
Introduction
The vascular endothelium plays a key role in the development and progression of atherosclerosis. It releases a number of vasoactive substances such as nitric oxide to maintain vascular homeostasis and mitigate atherogenesis.1,2 The endothelium becomes dysfunctional if an imbalance exists between the contributing vasodilators and constrictors. 3 Endothelial dysfunction occurs in response to cardiovascular risk factors such as smoking, hypertension, dyslipidaemia, and diabetes. 4
Endothelial function can be evaluated using non-invasive techniques that induce reactive hyperaemia and result in endothelium-dependent brachial artery flow-mediated dilation (FMD). 2 FMD can be readily measured and has been widely used in research studies as a biomarker of cardiovascular risk.5,6 However, recent evidence suggests that the microvasculature controlling the reactive hyperaemic response may provide important information for risk prediction.7–10 One measure of microvascular function that has been reported is the hyperaemic velocity time integral (VTI). Although VTI has been shown to be more closely related to cardiac risk factors than FMD, as well as an independent predictor of cardiovascular events, the optimal VTI end point to measure the effect remains unclear.8,11 The purpose of this study was to determine whether the VTI of more than one beat of reactive hyperaemia provides better diagnostic validity than the first hyperaemic beat.
Methods
Study population and study design
This study included 399 male subjects, a subset of the Firefighters and Their Endothelium (FATE) study cohort. The FATE study protocol has been described previously. 12 Briefly, all subjects were assessed for cardiovascular risk factors through physical examination and blood work. The vascular health of every subject was evaluated through ultrasound of the brachial artery. The study was approved by the University of Calgary ethics committee and written informed consent was obtained from all participants.
Risk factor definition
Current smoking status was defined as daily cigarette smoking within the last year. Hypertension was defined as having a blood pressure > 140/90 mmHg or if the subject was currently taking antihypertensive medication. Diabetes mellitus was defined as having fasting glucose > 7.0 mmol/L, a self-reported history of diabetes, or currently taking diabetes medication. Identification of metabolic syndrome was based on the criteria outlined in the National Cholesterol Education Program’s (NCEP) Adult Treatment Panel III report. 13
Ultrasound imaging protocol
All ultrasound scans were performed according to a standardized protocol. A SONOS 5500 ultrasound machine (Philips, Amsterdam) equipped with a 12-MHz linear phase arrayed ultrasound transducer was used to capture two-dimensional images of the brachial artery to monitor arterial diameter as well as pulse-wave Doppler signals to monitor blood flow before and after a 5-minute upper arm cuff occlusion. Both the two-dimensional images and pulse-wave Doppler signals were sampled at a frequency of 29 Hz. The insonation angle of the ultrasound probe was maintained at 60 degrees for all study subjects. A blood pressure cuff inflated to 200 mmHg was placed on the upper right arm above the antecubital fossa. Brachial artery FMD was measured and microvascular function assessed by hyperaemic VTI.
Ultrasound image analysis
FMD is a measure of the increase in arterial diameter that occurs in response to increased shear stress. 14 The increase in shear stress is a result of an increase in blood flow through a blood vessel as part of the reactive hyperaemic response to cuff occlusion.15,16
VTI is a measure of arterial blood flow velocity. Ultrasound of the brachial artery using pulse-wave Doppler produces wave-like curves on a velocity–time graph. Using the software directly from the ultrasound machine, the waves can be manually traced and their VTI automatically determined. Baseline VTI is measured prior to cuff occlusion and another VTI measurement is taken during reactive hyperaemia after cuff release.
Previously, only the VTI of the first beat following cuff release was measured and used to evaluate microvascular function.10,11,17 In the current analysis, the first 10 beats following cuff release were measured. Further calculations were made to obtain the average and maximum VTI values from these 10 measurements.
Statistical analysis
The VTI of the first beat was the primary end point, and the average and maximum VTI were secondary end points. All three VTI end points were used in the following statistical analyses. The intra-observer variability, inter-observer variability, and repeatability of VTI measurements were assessed by calculation of the coefficient of variation. Intra-observer variability was evaluated between two sets of measurements analyzed 2 weeks apart collected from the same 20 subjects. Inter-observer variability was evaluated between the current and previous measurements of VTI of first beat from 389 subjects. Repeatability of VTI measurements from two different ultrasound scans of the same 50 subjects spaced 16 ± 4 months apart was also determined. The formula used to calculate the percentage of the coefficient of variation was: [(SD of the paired differences/the overall mean)/√2] × 100. Univariate correlations were calculated to examine individual relationships between the different VTI end points and cardiovascular risk factors and risk scores. Multivariable backwards regression was used to assess the strength of predictive models for each VTI end point. Statistical significance was defined as two-tailed at p < 0.05. All statistical analyses were carried out using SPSS Statistics version 17.0 software (SPSS, IBM Corp., NY, USA).
Results
Baseline patient demographics
Baseline demographics and cardiovascular risk factors of the study population are summarized in Table 1. All of these subjects were male and mostly middle-aged (mean age, 45.5 ± 10 years). Few had diabetes (2%), hypertension (18%), or metabolic syndrome (19%), with only 11% as current smokers.
Characteristics of study population
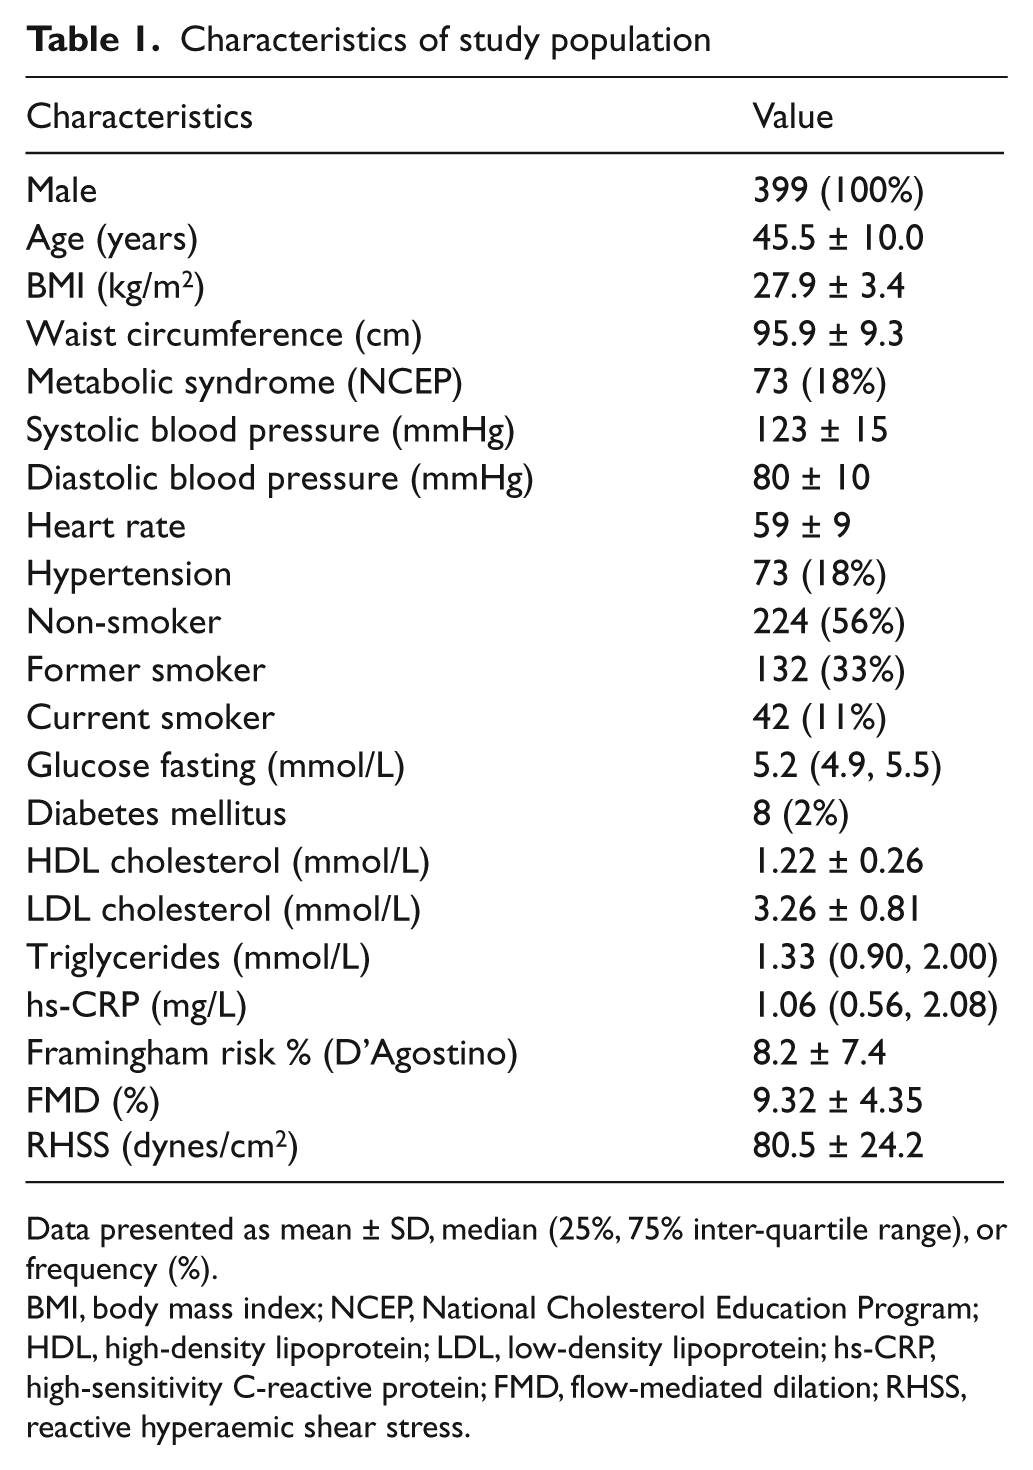
Data presented as mean ± SD, median (25%, 75% inter-quartile range), or frequency (%).
BMI, body mass index; NCEP, National Cholesterol Education Program; HDL, high-density lipoprotein; LDL, low-density lipoprotein; hs-CRP, high-sensitivity C-reactive protein; FMD, flow-mediated dilation; RHSS, reactive hyperaemic shear stress.
Temporal trends
From the total study population (n = 399), all 10 beats could be captured and measured in 316 subjects. Figure 1 shows the mean VTI for each of the 10 beats measured, which decreases steadily from the first beat to the tenth beat. The mean VTI of all first beats, average of 10 beats, and maximum of 10 beats were 118.2 cm, 104.7 cm, and 122.7 cm, respectively (Figure 1). A maximum VTI occurred as the first beat in 184 subjects (46%) (Figure 2). The number of maximum VTI occurrences decreased significantly from the first beat to the tenth beat.
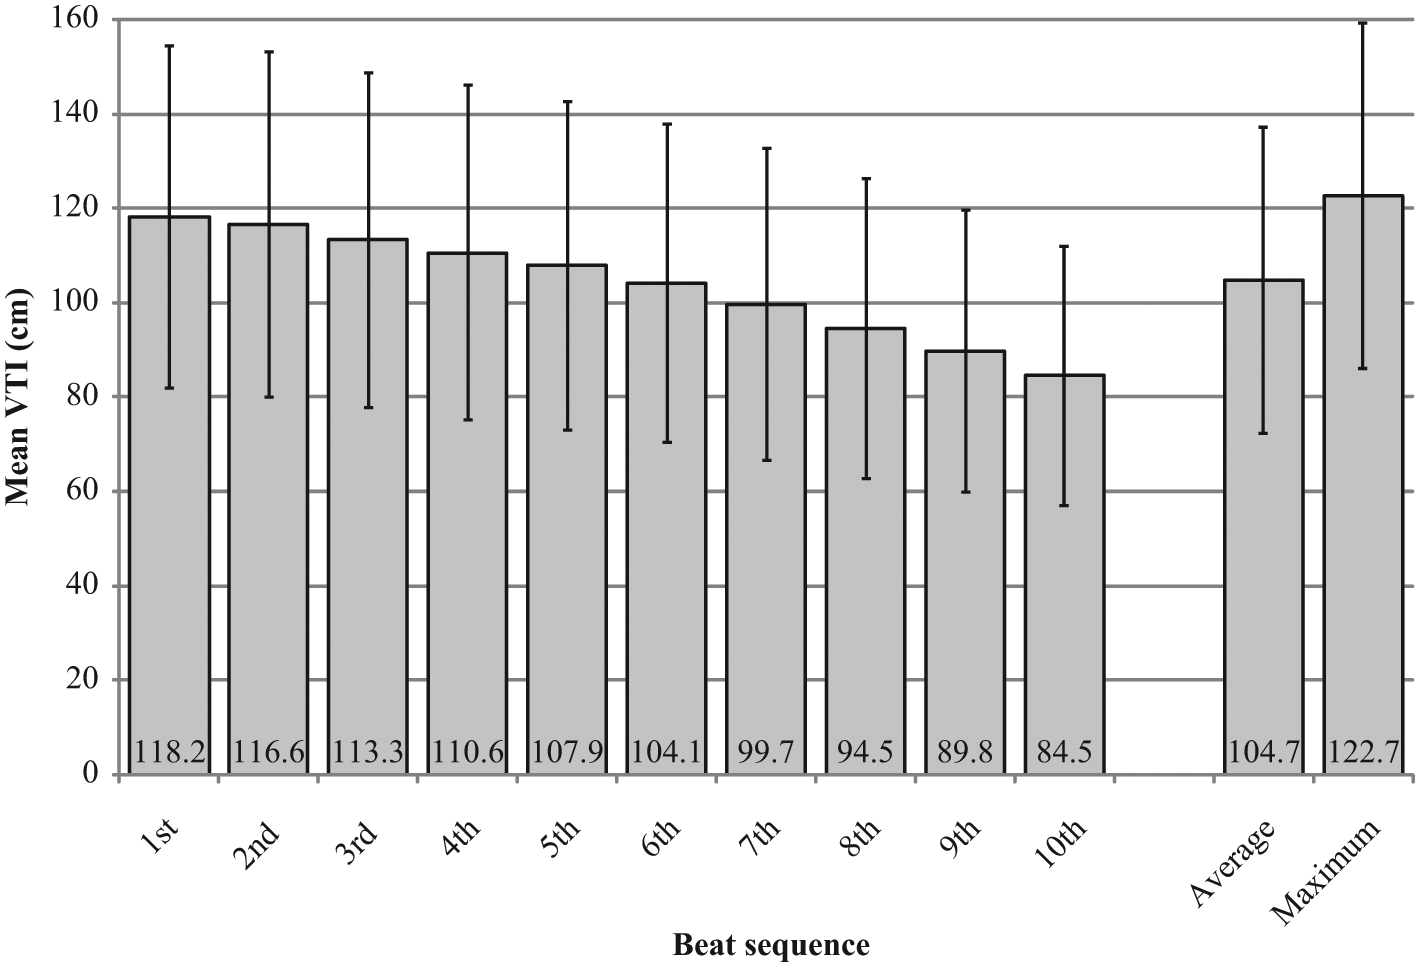
Temporal trends in velocity time integral (VTI).
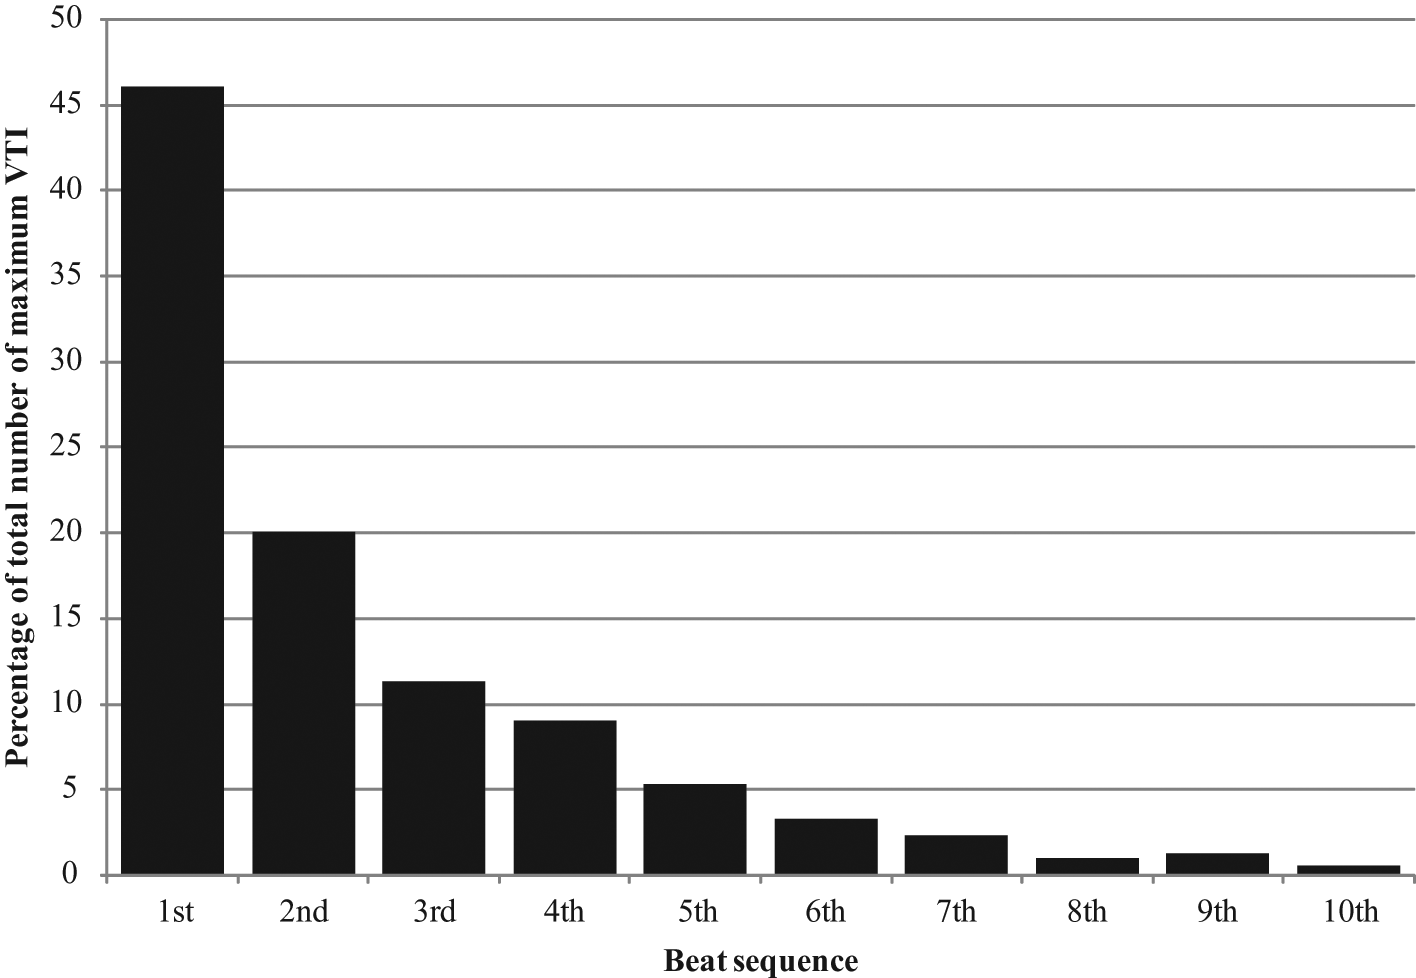
Distribution of maximum VTI within the 10 beat sequence.
Intra-/inter-observer variability and repeatability
Assessment of intra-observer variability for measurement of the same digitized image yielded coefficients of variation for VTI of first beat, average VTI, and maximum VTI of 1.6%, 1.4%, and 1.4%, respectively. For inter-observer variability, the coefficient of variation for VTI of first beat was 5.9%. The coefficients of variation for repeatability of VTI measurements (n = 50) were 15.1%, 14.8%, and 15.2% for VTI of first beat, average VTI, and maximum VTI, respectively. The mean of the paired differences corresponding to each coefficient of variation above can be found in Table 2.
Inter-/intra-observer and repeatability measures
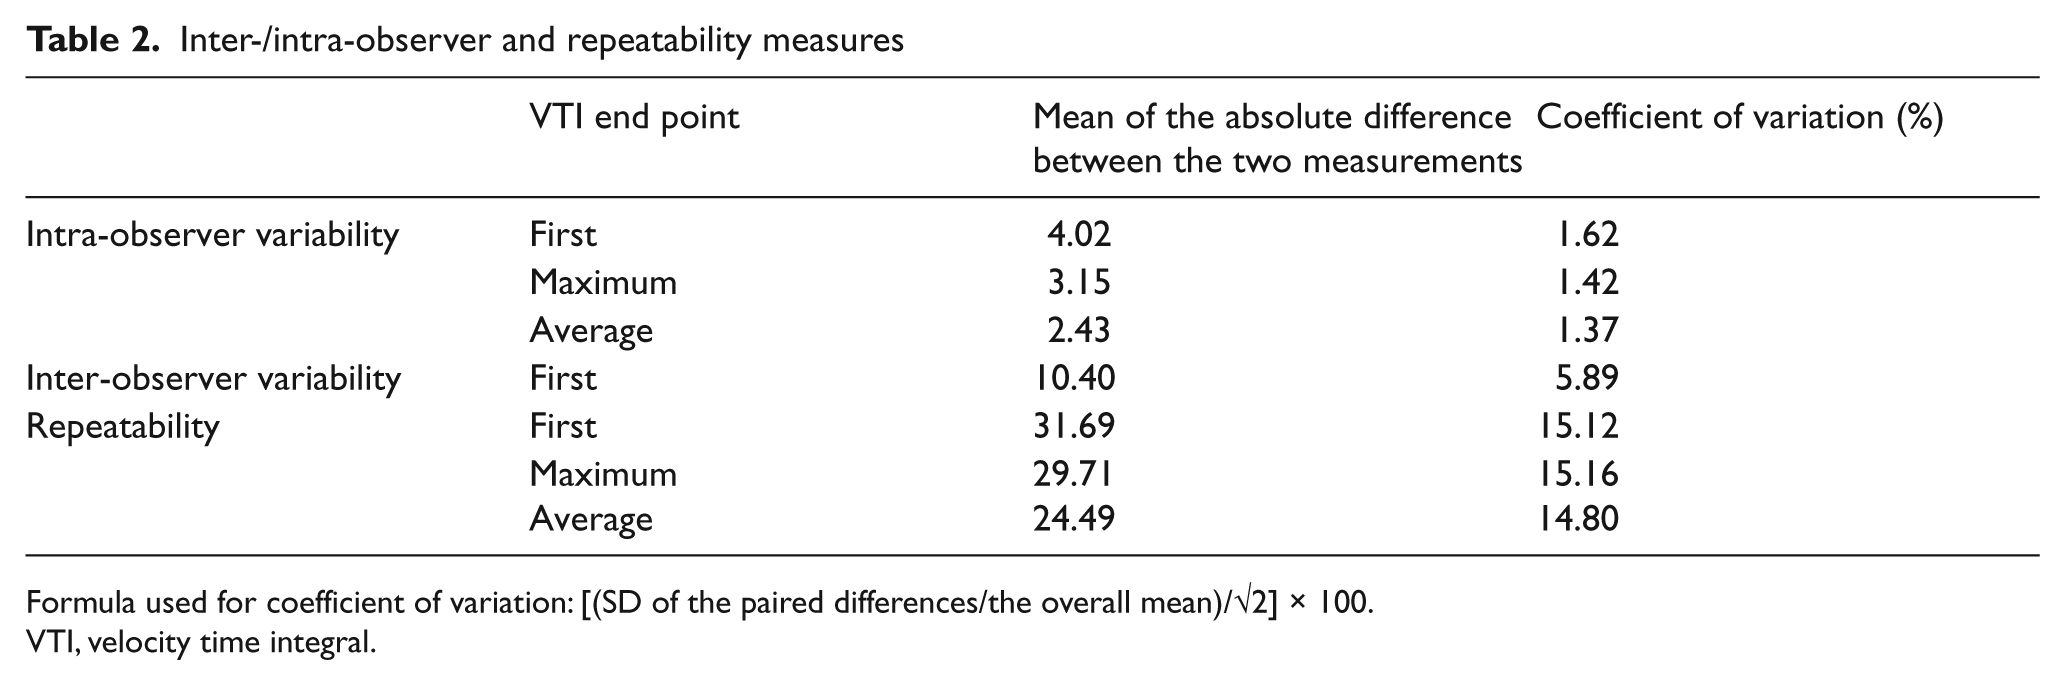
Formula used for coefficient of variation: [(SD of the paired differences/the overall mean)/√2] × 100.
VTI, velocity time integral.
Correlations with FMD and cardiovascular risk factors
No associations between the three VTI end points and FMD were found. FMD was not associated with any cardiovascular risk factors either. Univariate analyses between VTI and cardiovascular risk factors are presented in Table 3. Similar correlations were found across all three VTI end points. Age, waist circumference, BMI, smoking, diabetes, hypertension, systolic blood pressure, low-density lipoprotein (LDL) cholesterol, high-density lipoprotein (HDL) cholesterol, triglycerides, and Framingham risk percentage were associated with all three VTI end points (p < 0.05).
In multivariable analyses, there was no difference in the relationship between cardiovascular risk factors and the various VTI end points (R2 from 0.090 to 0.102) (Table 4). Age, systolic blood pressure, and BMI were predictors of the three VTI end points (p < 0.05). However, LDL cholesterol was only predictive of the VTI of first beat (p < 0.05). Fasting glucose, HDL cholesterol, and smoking status were all non-significant predictors for the three VTI end points (p > 0.05).
Univariable relationship of risk factors with FMD and three VTI endpoints: first, maximum and average
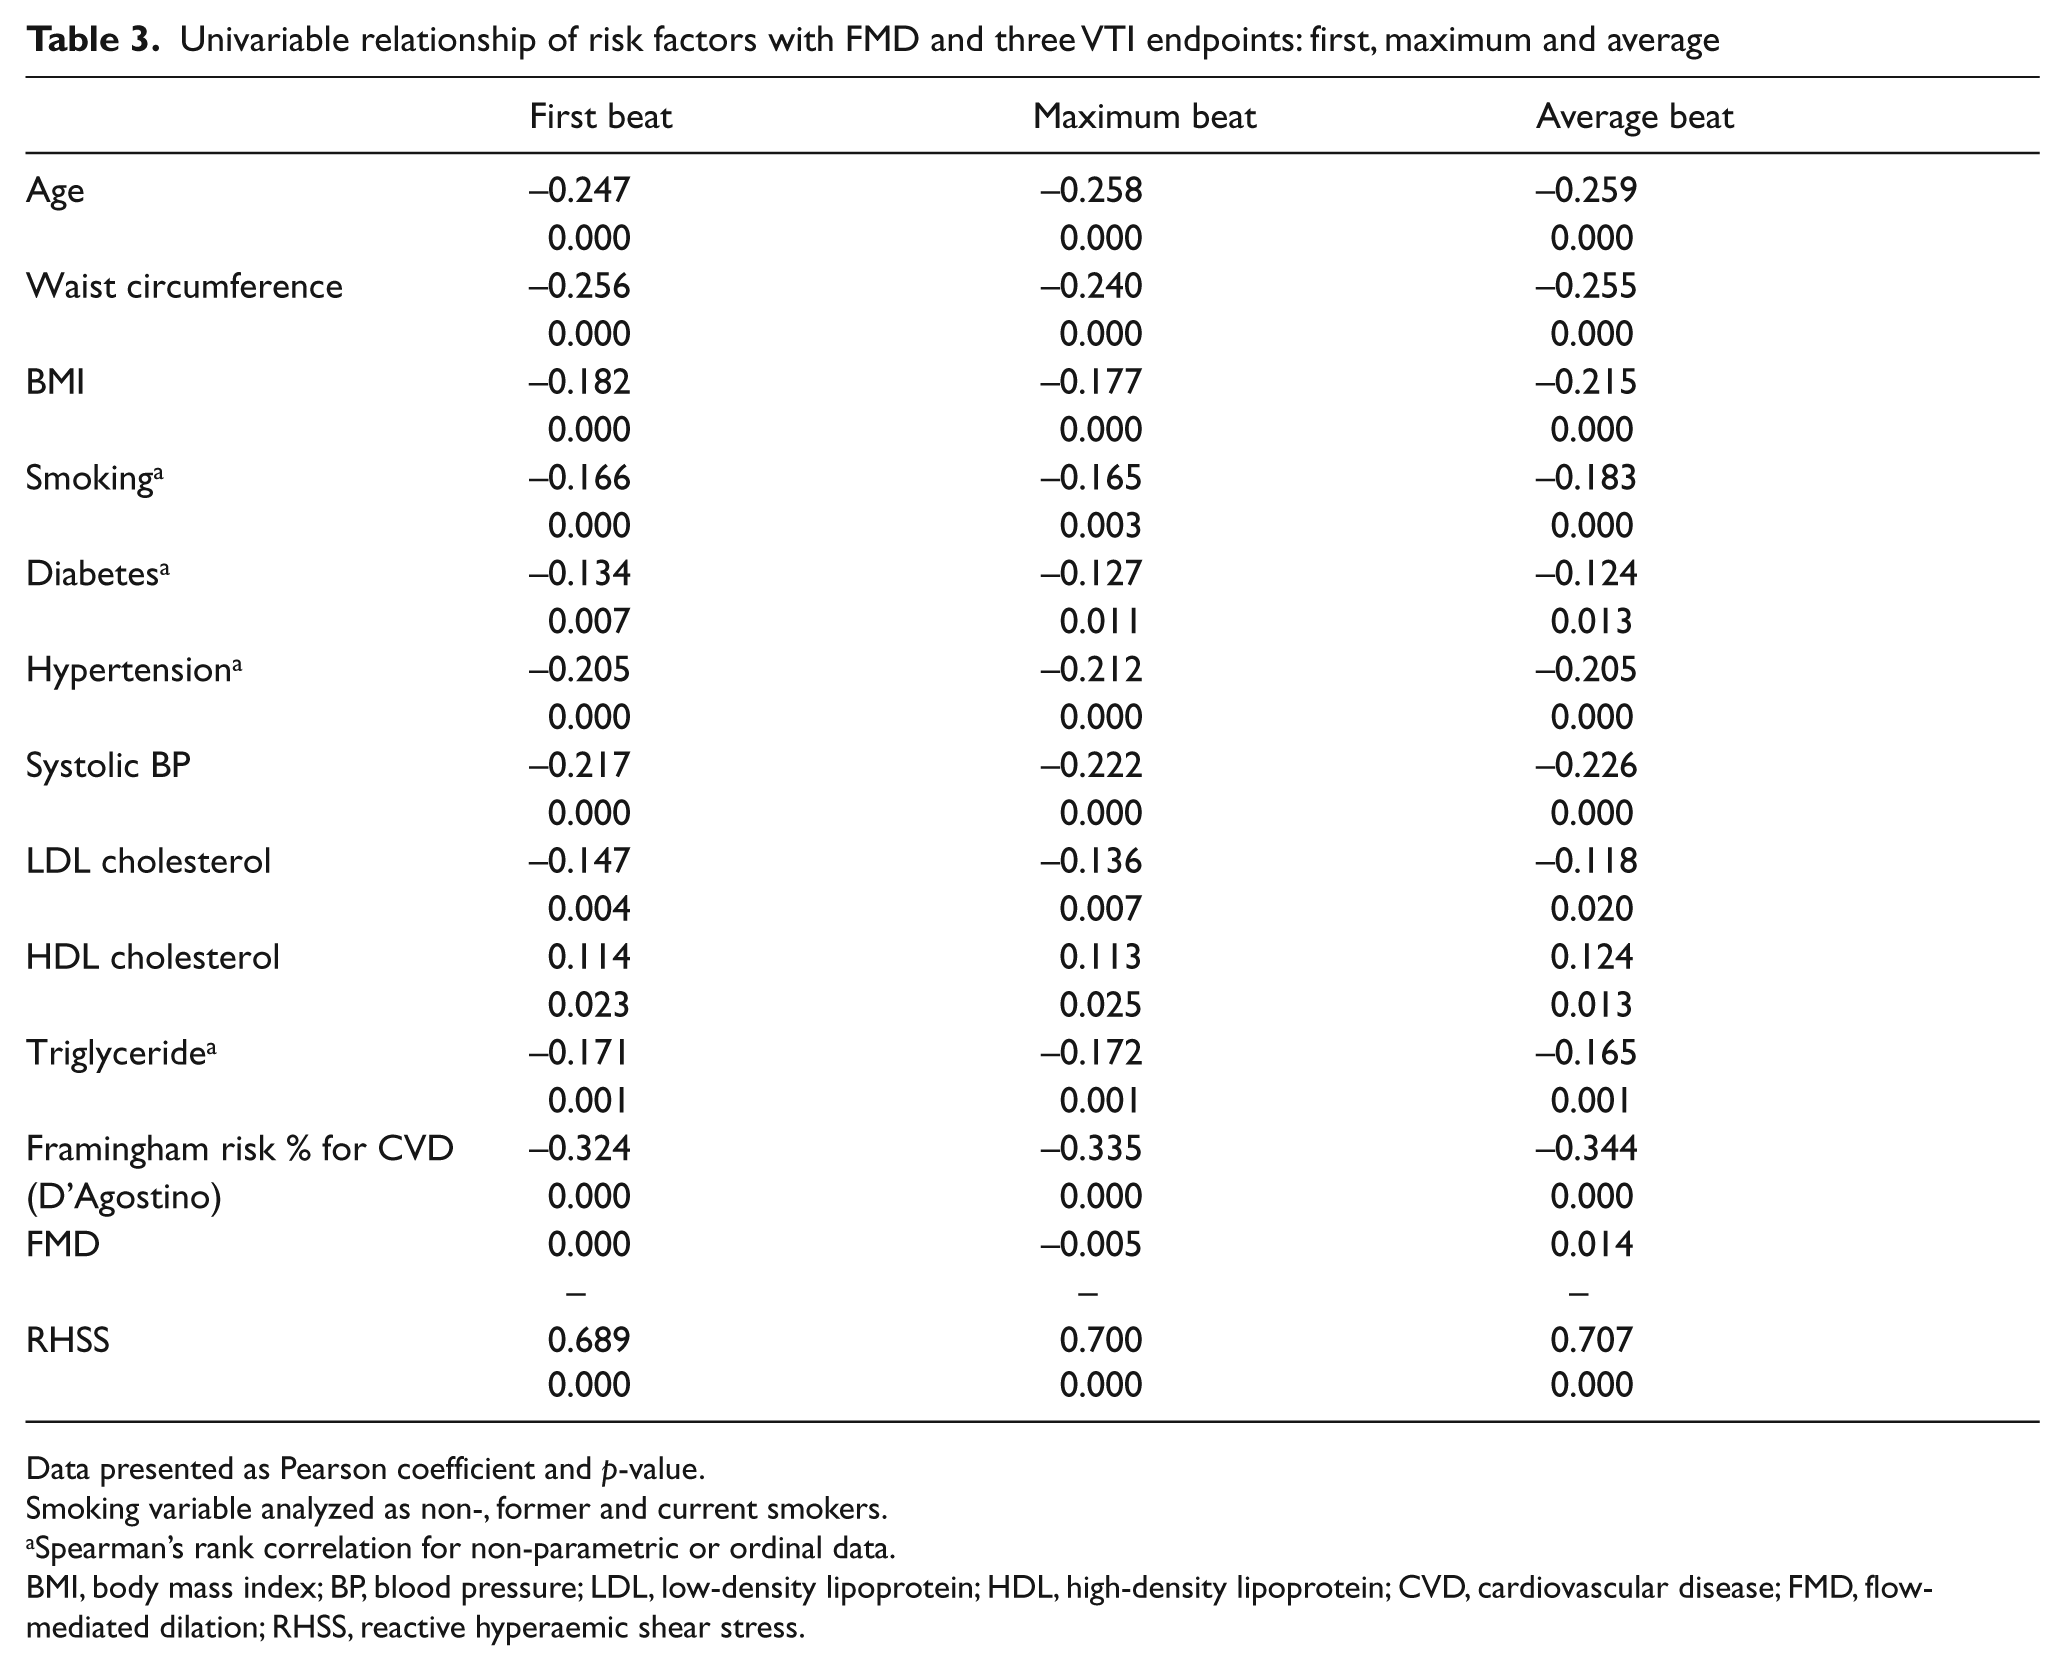
Data presented as Pearson coefficient and p-value.
Smoking variable analyzed as non-, former and current smokers.
Spearman’s rank correlation for non-parametric or ordinal data.
BMI, body mass index; BP, blood pressure; LDL, low-density lipoprotein; HDL, high-density lipoprotein; CVD, cardiovascular disease; FMD, flow-mediated dilation; RHSS, reactive hyperaemic shear stress.
Multivariable backward models predicting three VTI endpoints: first, maximum and average
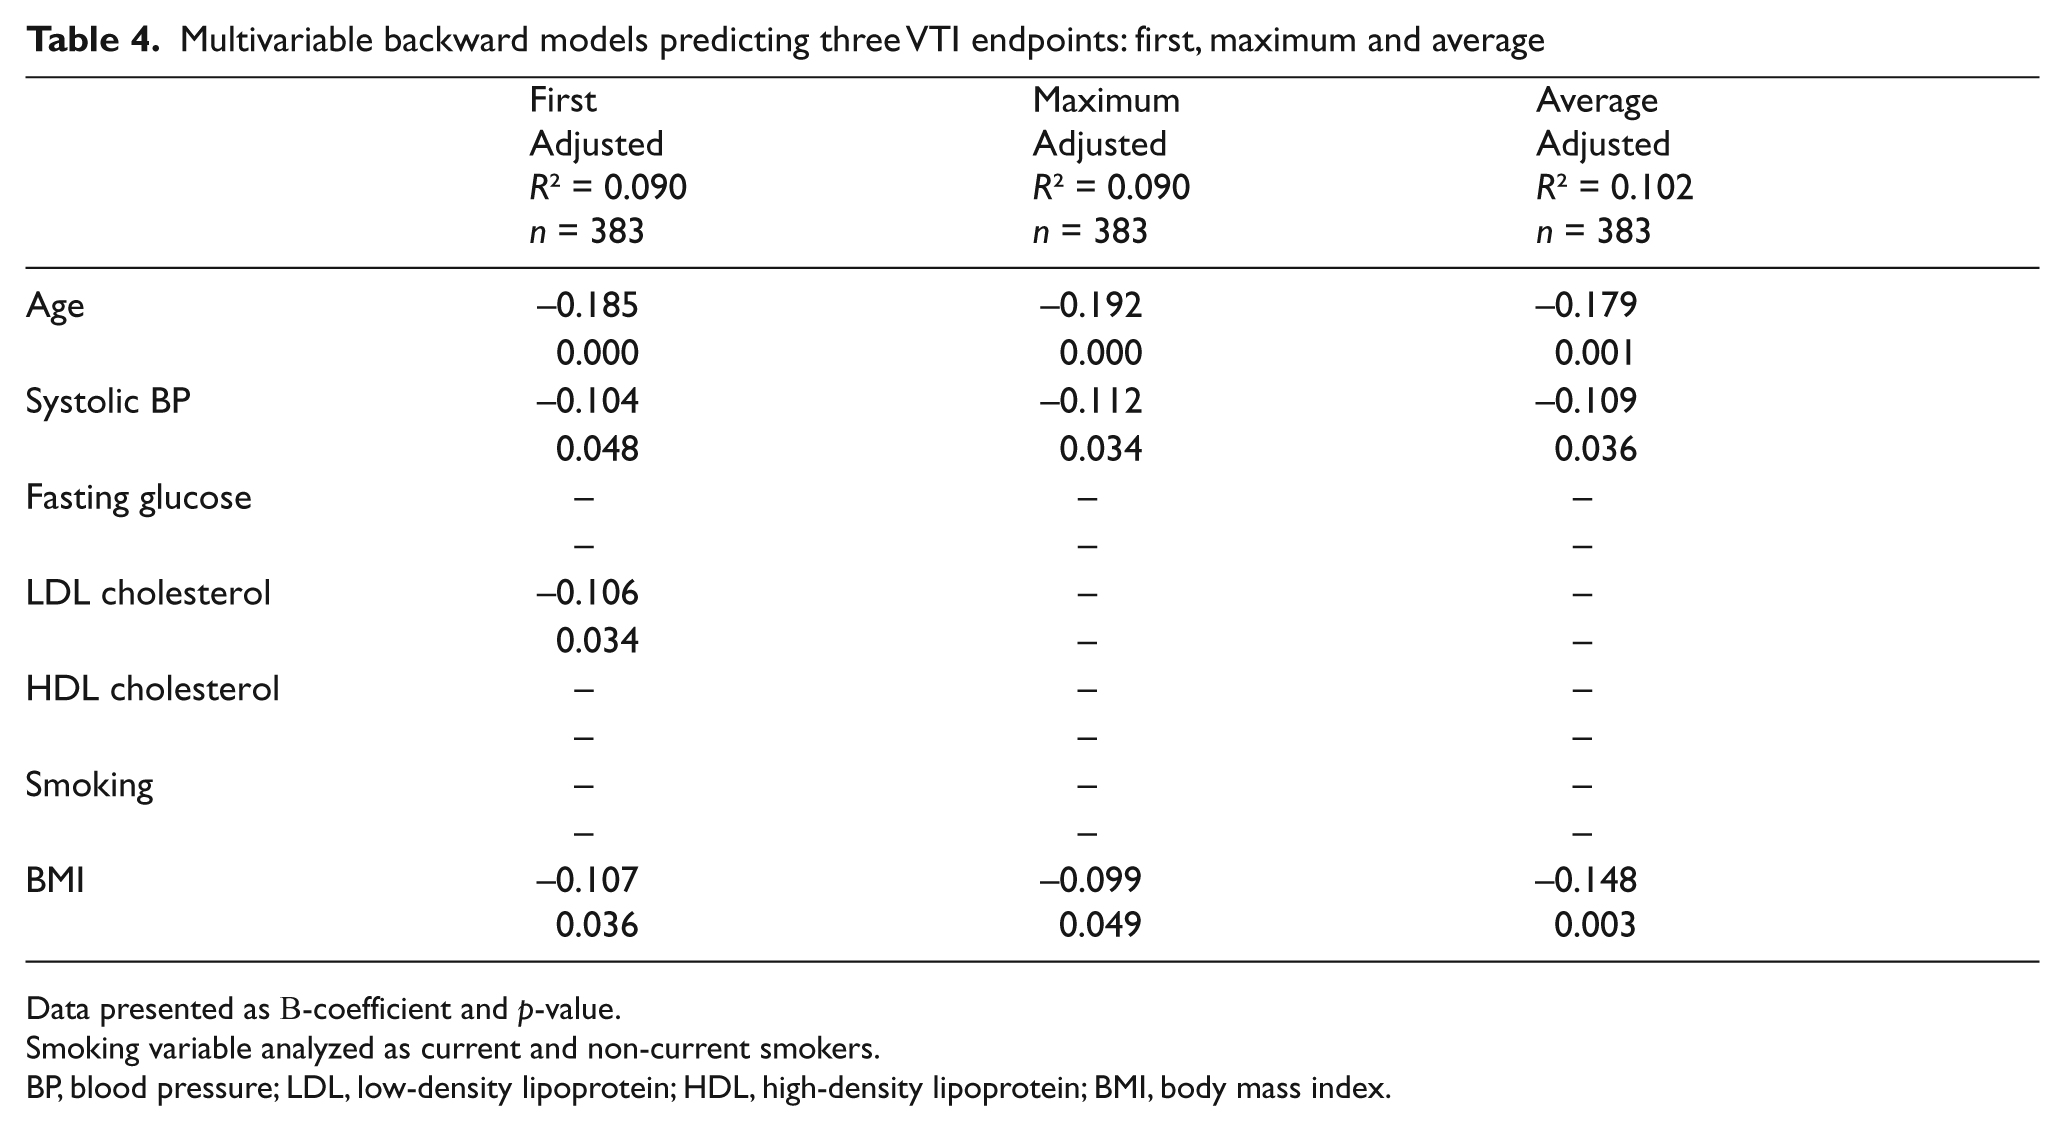
Data presented as B-coefficient and p-value.
Smoking variable analyzed as current and non-current smokers.
BP, blood pressure; LDL, low-density lipoprotein; HDL, high-density lipoprotein; BMI, body mass index.
Discussion
We have demonstrated that the VTI of the first 10 beats of reactive hyperaemia can be measured as precisely as the first beat alone. We have also shown that the ultrasound procedure used to generate the Doppler waveforms is reproducible. However, the average and maximum VTI were not more strongly correlated to cardiovascular risk factors than the first beat alone. This study confirms that the VTI of first beat is a suitable measure of microvascular function.
Assessment of microvascular function by hyperaemic velocity is already being employed in clinical research studies. Other methods of microvascular assessment have been reported and are related to cardiovascular risk factors as well. Studies of hyperaemic velocity have utilized different end points for this measure and little has been reported about the diagnostic validity of various measurements. In addition, some studies have utilized more complex variations of VTI. Mitchell et al. were the first to demonstrate significant relationships between several cardiovascular risk factors and hyperaemic diastolic shear stress. 8 Hyperaemic diastolic shear stress was calculated using a signal-averaging approach for all beats deemed representative of the peak flow response. From this, flow velocity during diastole was calculated and then converted to shear stress. In addition, Hamburg et al. also showed a significant correlation through multivariable analyses between hyperaemic flow velocity calculated using the same signal- averaging approach and risk factors for cardiovascular disease. 18 In our own research group, we have shown not only that VTI is related to cardiovascular risk factors, but that it is also predictive of long-term outcomes in low- to intermediate-risk men.10,11,17 Although our measurement of microvascular function was less complex than the signal-averaging approach, our findings were consistent with the Framingham group. Owing to the variety of hyperaemic velocity measures using first, average, or maximum VTI, it was important to affirm that the VTI of first beat is in fact an acceptable measurement to be used as a biomarker for cardiovascular risk stratification.
It is known that the microvasculature controls the reactive hyperaemic response following a period of ischaemia by cuff occlusion of the arm. Upon cuff release, blood rushes through the conduit brachial artery and reaches a peak in flow velocity almost immediately. Our results illustrate this well, as the blood flow velocity peaked on the first beat for nearly half of the study population. The increased blood flow velocity causes an increase in shear stress on the vascular endothelium. 19 This triggers a number of mechanisms, some of which involve endothelium-derived nitric oxide, adenosine, K+ ATP channels, and certain cyclooxygenase-derived metabolites to maintain the elevated flow velocity during the period of reactive hyperaemia.20–24 Peak hyperaemic blood flow is only partially regulated by the release of endothelium-derived nitric oxide. 25 On the other hand, among the various vasodilators, such as prostaglandins and endothelium-derived hyperpolarizing factor, released from the endothelium, nitric oxide is the primary mediator of FMD.3,26 Since the microvasculature is in control of the stimulus for dilation, it has been suggested that the associations observed between FMD and cardiovascular risk factors may be due, in part, to microvascular dysfunction rather than conduit brachial artery endothelial dysfunction. 8
Although we have shown that maximum and average VTI of the first 10 beats provides no more information than simply the VTI of first beat alone, other studies have used more elaborate measures to explore hyperaemic velocity and its association with cardiovascular risk factors. Jarhult et al. separated the VTI measurement of a single beat into systolic and diastolic components based on ECG. 27 Systolic hyperaemic velocity was found to be positively related to the Framingham Risk Score and systolic blood pressure. Diastolic hyperaemic velocity was related inversely to the Framingham Risk Score and fasting blood glucose. A systolic to diastolic hyperaemic velocity ratio was then calculated and found to correlate more strongly to systolic blood pressure, fasting blood glucose, smoking status, and Framingham Risk Score, than the systolic or diastolic velocity measures alone.
From the time it was first described by Celermajer and colleagues nearly two decades ago, the technique of assessing FMD has evolved. Guidelines have been developed by the International Brachial Artery Reactivity Task Force in an attempt to optimize as well as standardize the imaging and analysis protocol. 28 Much like FMD, hyperaemic velocity is now being refined as a measure of microvascular function. Perhaps a similar set of guidelines for the assessment of hyperaemic velocity would be helpful in future studies of cardiovascular risk.
Limitations
There were several limitations in this study. Our findings were based on a strictly male cohort with no known coronary artery disease, and thus our results may differ for females and for those with coronary artery disease. Further, all subjects underwent upper arm cuff occlusion according to our ultrasound protocol, though many studies of vascular function now use lower arm cuff occlusion.
Conclusions
Measuring the VTI beyond the first beat of reactive hyperaemia was not more closely associated with vascular risk factors or more precisely measured. The first beat of reactive hyperaemia remains a suitable measure of microvascular function in studies of endothelial health. As further research is conducted into hyperaemic velocity, a consensus in its measurement would allow for a more standardized methodology.
Footnotes
Acknowledgements
We are grateful to the FATE investigators for their dedication to the research study as well as to the participants for volunteering their time to participate.
Funding
Funding was provided by Pfizer Canada, the Canadian Institutes of Health Research, and the Heart and Stroke Foundation of Alberta.
TJA is a Senior Scholar of the Alberta Innovates-Health Solutions (Edmonton, AB). BJM is also funded by AI-HS with a Clinical Research Fellowship.
Conflict of interest
None reported.