
Abstract
This study compares the reliability and reproducibility of flow-mediated dilatation (FMD) and peripheral arterial tonometry (PAT) to assess endothelial function. Eighteen volunteers with coronary heart disease underwent simultaneous testing of FMD by means of brachial artery ultrasound scanning and PAT with the EndoPAT 2000. The subjects underwent both tests twice with an interval of 30 minutes and the same protocol was repeated 2 days later. The within-day variability was lower for the FMD measurements than for the PAT measurements (10% versus 18%; p < 0.05). The between-day variability was similar (11%). A significant correlation was found between PAT and FMD (r = 0.57, p < 0.001). The typical errors of measurements for FMD were lower than those for PAT. In conclusion, in this study, FMD demonstrated the best reliability for the within- and between-day and separate day measurements when compared to PAT.
Keywords
Introduction
The endothelium plays a central role in many physiological processes, including the regulation of smooth muscle tone and the inhibition of leukocyte and platelet cell adhesion.1–3 Endothelial dysfunction is the earliest event in the pathogenesis of atherosclerotic cardiovascular disease, 2 the leading cause of morbidity and mortality worldwide. 4 Risk factors for endothelial dysfunction include the typical cardiovascular risk factors such as smoking, diabetes mellitus, hypertension, dislipidemia, aging and physical inactivity. 5 Lifestyle changes and pharmacological interventions that improve endothelial function have been shown to improve cardiovascular risk and reduce cardiovascular morbidity and mortality. To assess the effect of an intervention on endothelial function, reliable methods to assess the endothelial function are needed.
However, the assessment of coronary artery endothelial function is an invasive procedure that requires specialized equipment and personnel and makes it therefore less suitable as a measurement method in a research setting. It is now well established that vascular endothelial function in the brachial arteries correlates well with endothelial function in the coronary arteries. 6
The most popular clinical method to assess vascular endothelial function is flow-mediated dilatation (FMD) by means of brachial artery ultrasound scanning (BAUS). This technique, recommended by the international Brachial Artery Reactivity Task Force, is based on the percent change of the brachial artery diameter (%FMD) caused by reactive hyperemia. 7 A shortcoming of BAUS encompasses considerable intrasubject and intersubject variability. That is, BAUS requires highly trained operators, and is therefore prone to operator bias and high variability. 8
Recently, an alternative method, reactive hyperemia peripheral arterial tonometry (PAT), has been used to identify patients with coronary endothelial dysfunction by measuring pulse volume changes at the fingertips after an occlusion of the brachial artery of the dominant arm. This method showed a significant correlation with FMD (r = 0.55, p < 0.0001) 9 and has the advantage of being operator independent. When studying the effect of an intervention on endothelial function, the between-day variability of these techniques should be evaluated and these studies are lacking for the PAT method. Therefore, the aims of the present study were (1) to determine the within- and between-day variability of the PAT and FMD measurements and (2) to assess the reliability of both techniques by quantifying the typical error of measurements (TEM) for both techniques.
Methodology
Subjects
Eighteen male patients with coronary artery disease (CAD) and without a cardiovascular incident during the last 9 months, participating in sporting activities of a maintenance program for patients with cardiovascular disease, volunteered for this study. All volunteers were non-smokers and free of arrhythmias. The study was approved by the biomedical ethical committee of the KU Leuven and written informed consent was obtained from all participants after a full explanation of the aims and procedures.
Experimental procedure
Endothelial function was assessed simultaneously by the two techniques that are the FMD method and the PAT method (EndoPAT 2000; Itamar Medical Ltd, Caesarea, Israel). Each subject was tested twice on the same day with an interval of 30 minutes between test and retest. The same protocol was repeated 2 days later at the same time of the day and under similar circumstances. The first test was considered a familiarization test. All tests were performed by one blinded observer (SO) who was not aware of the results obtained during the tests.
Participants were instructed to refrain from exercise for at least 24 hours prior to the measurement. Subjects were allowed to consume a light bread meal 3 hours before the measurements but were asked not to ingest substances that might affect endothelial function, such as caffeine, high-fat foods, tobacco and alcohol. Medication had to be taken at the same time of the day.
All measurements were performed in a dark, noise- and temperature-controlled room. The participants relaxed in a supine position with both arms resting on arm support pads to avoid muscular activity of the arm and fingers. They were instructed to remain quiet during the measurements.
BAUS was performed following a protocol similar to that initially described by Celermajer. 10 Longitudinal brachial artery images were obtained with a high-resolution (12 MHz) linear-array vascular ultrasound scanning transducer (Vivid 7; GE Healthcare) mounted on a fixed support. After a 10-minute equilibration period, baseline two-dimensional images of the right brachial artery were obtained approximately 2 cm above the antecubital fossa. A blood pressure cuff, placed proximal to the imaging transducer on the upper arm, was inflated to at least 200 mmHg and at least 50 mmHg over the systolic pressure for exactly 5 minutes. The vessel was imaged continuously for 1 minute after release of the occlusion, and reactive hyperemia was confirmed with pulse-wave Doppler scanning. For analyzing the images and to measure the diameters of the brachial artery, the edge-detection software FMD-i (FLOWMEDI, Brussels, Belgium) was used. FMD is defined as the ratio of the brachial artery diameter during reactive hyperemia relative to the baseline value; that is, FMD = [(POBAD – BBAD)/BBAD]*100, where POBAD corresponds to the post-occlusion brachial artery diameter after 60 seconds and BBAD corresponds to the baseline brachial artery diameter. For each time period five brachial artery diameters were measured and the average for each time period was used.
Finger pulse wave amplitude (PWA) was recorded with the PAT device placed on the tip of each index finger. One PAT finger probe was placed on the index finger of the hand undergoing hyperemia testing (right hand), and a second PAT probe was placed on the contralateral index finger (left hand). The principle of PAT has been described previously. 11 Briefly, a blood pressure cuff is placed on one upper arm while the contralateral arm serves as the control arm. After a 5-minute equilibration period, the cuff is inflated to a pressure of 50 mmHg above the systolic pressure or 200 mmHg for 5 minutes and then deflated to induce a reactive hyperemia. The PAT hyperemia ratio or reactive hyperemia index (RHI) is defined as the ratio of the average PWA during the 1-minute period starting 60 seconds after cuff deflation divided by the average PWA of a 210-second pre-occlusion baseline period. In an effort to correct for confounding variables such as potential systemic effects of unilateral arm ischemia, this ratio is normalized to the concurrent signal from the contralateral, non-ischemic hand. PAT testing was performed simultaneously with BAUS.
Statistical analysis
All analyses were performed using the statistical software package SAS 9.2 for Windows (SAS Institute, Inc., Cary, NC, USA). Distributions were checked for normality with the Shapiro–Wilk statistic. To determine the within-day reproducibility of each technique, we compared the two measurements obtained during the second day. To evaluate the between-day reproducibility, we compared the second measurement obtained during both days.
A paired t-test was used to identify differences between the values obtained during the tests and retests. We calculated the intraclass correlation coefficient (ICC) as a measure of agreement between test and re-test values of each measurement technique for day 1 and day 2. The coefficients of variation (CV) were calculated for every subject by dividing the standard deviation for each pair of measurements by their mean values: CV = (SD/mean)*100. The TEM was calculated as TEM = SD / √2. 12 Pearson correlation was performed to asses the potential associations between FMD and PAT. The method suggested by Bland and Altman 13 was used to determine the degree of concordance between the pairs of measurements obtained on the same and separate days. Therefore, the mean of the difference between each pair of measurements was determined. For all statistical tests, the alpha level adopted for significance (two-tailed) was set at p < 0.05.
Results
The baseline characteristics of the subjects are presented in Table 1.
Baseline characteristics of the 18 male patients with CAD
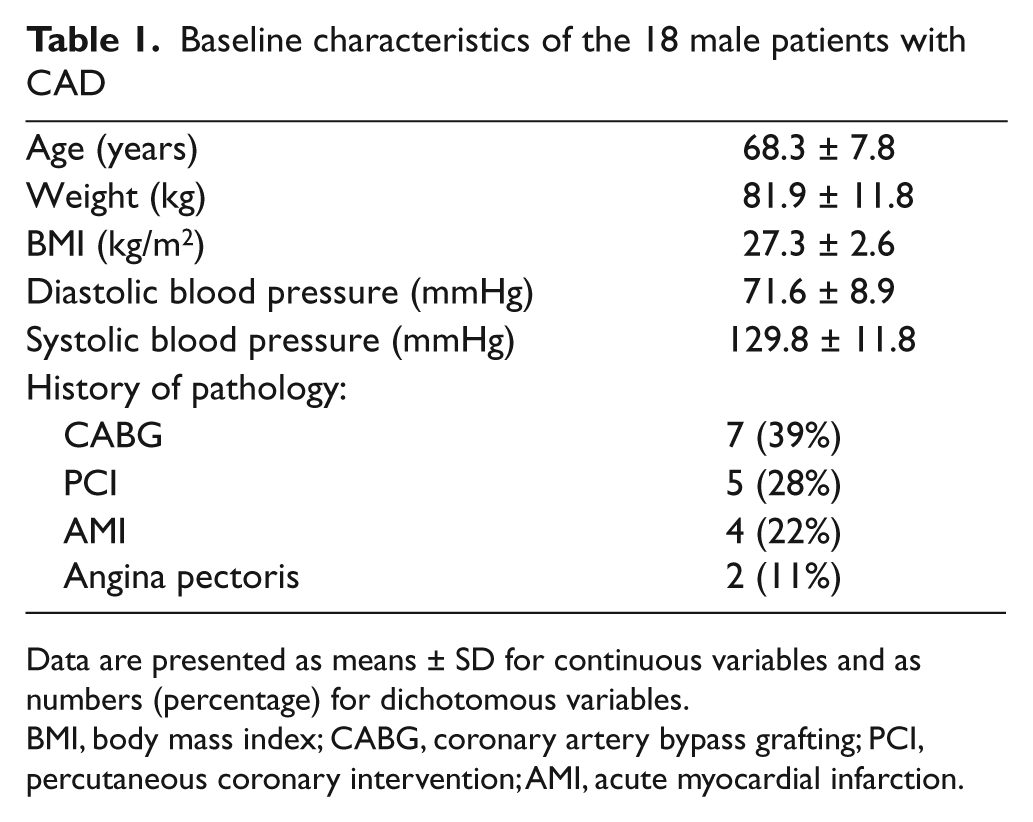
Data are presented as means ± SD for continuous variables and as numbers (percentage) for dichotomous variables.
BMI, body mass index; CABG, coronary artery bypass grafting; PCI, percutaneous coronary intervention; AMI, acute myocardial infarction.
The results of the paired t-test did not show any significant differences between the pairs of measurements obtained on the separate day (FMD: p = 0.90; PAT: p = 0.26). However, significant differences were observed between values obtained by PAT on the same day (p = 0.01).
Tables 2 and 3 show the within- and between-day variability of the FMD measurements. The highest CVs were found for the between-day values. In contrast, the TEM values were higher for the within-day measurements. The ICCs were all statistically significant (p < 0.01 for both).
Reliability statistics of the FMD measurements obtained on the same (the second) day
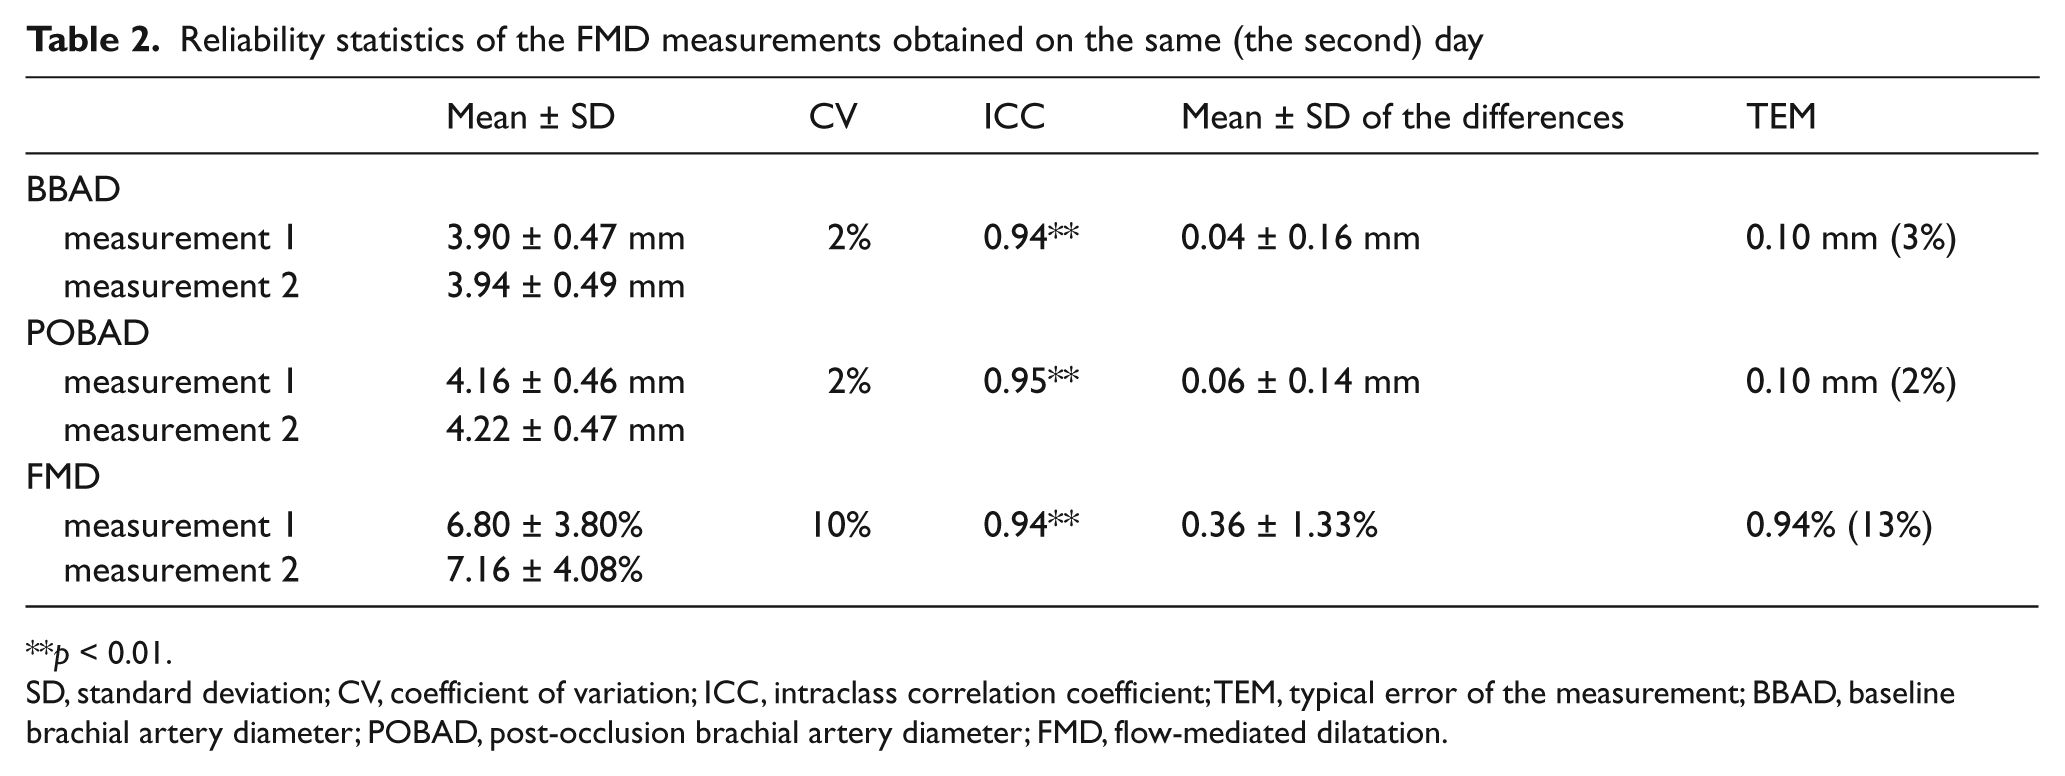
p < 0.01.
SD, standard deviation; CV, coefficient of variation; ICC, intraclass correlation coefficient; TEM, typical error of the measurement; BBAD, baseline brachial artery diameter; POBAD, post-occlusion brachial artery diameter; FMD, flow-mediated dilatation.
Reliability statistics of FMD tests obtained on separate days
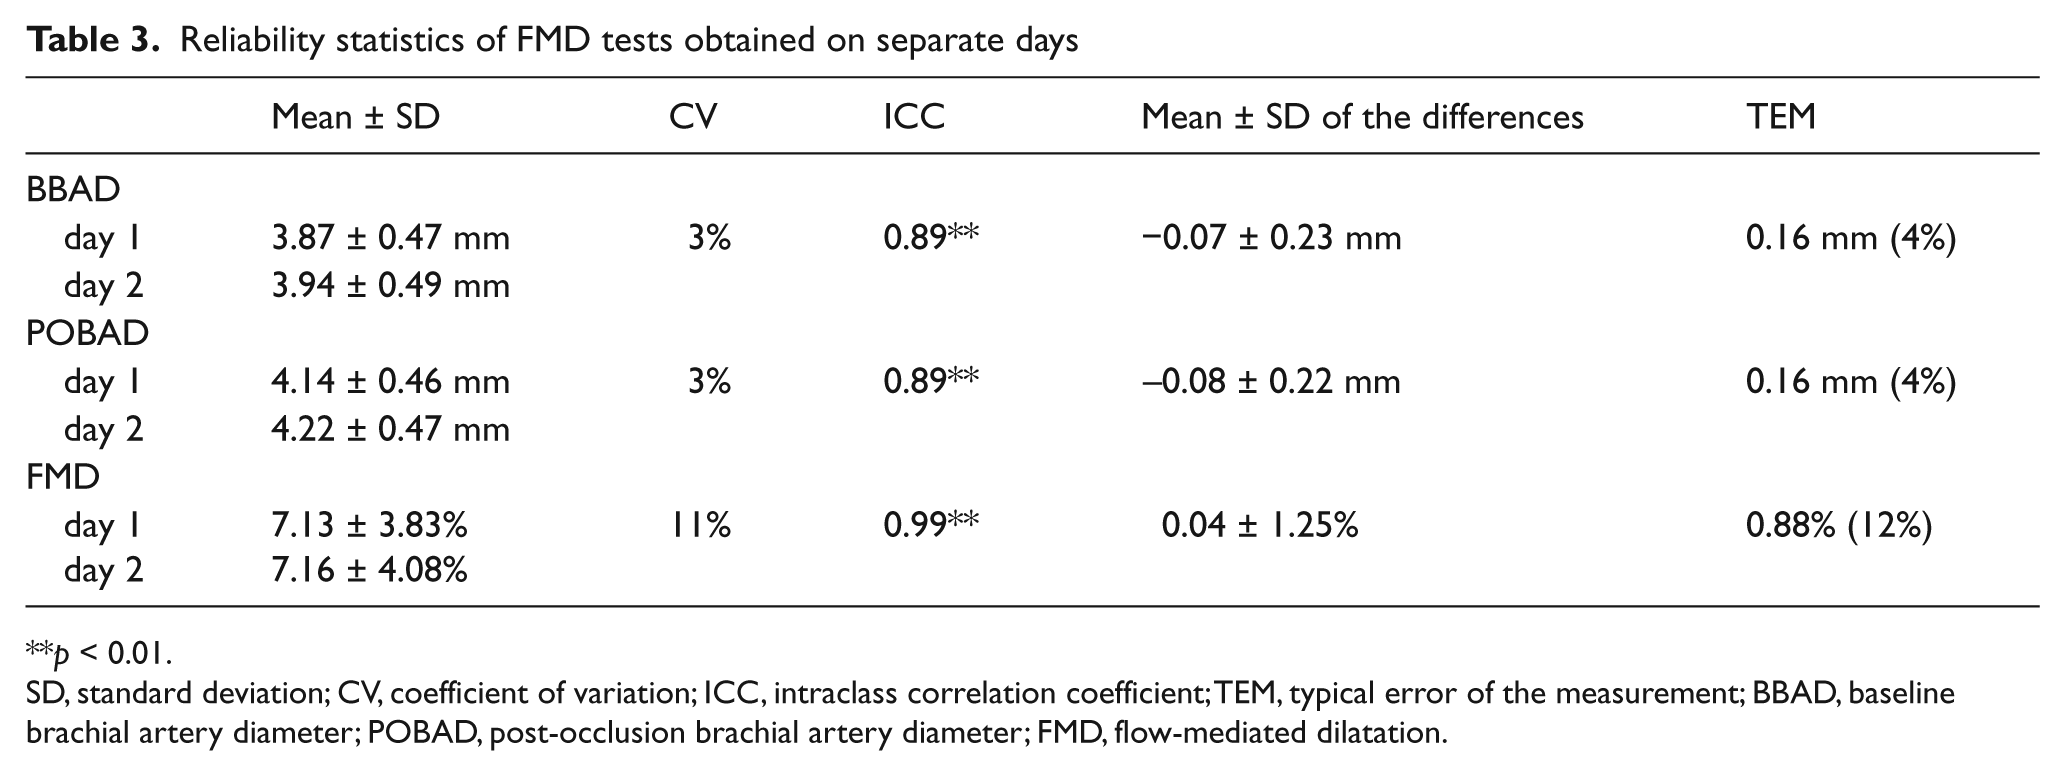
p < 0.01.
SD, standard deviation; CV, coefficient of variation; ICC, intraclass correlation coefficient; TEM, typical error of the measurement; BBAD, baseline brachial artery diameter; POBAD, post-occlusion brachial artery diameter; FMD, flow-mediated dilatation.
Tables 4 and 5 show the RHI on the same and separate days, respectively. In contrast with the results of the FMD measurements, the highest CVs were found for the within-day measurements. The TEM values were higher than those of the FMD measurements. The ICCs were all statistically significant (p < 0.01 for both), but were less strong compared to FMD measurements. A significant correlation was found between RHI and FMD (r = 0.57, p < 0.001; not shown).
Reliability statistics of the PAT measurements obtained on the same (the second) day
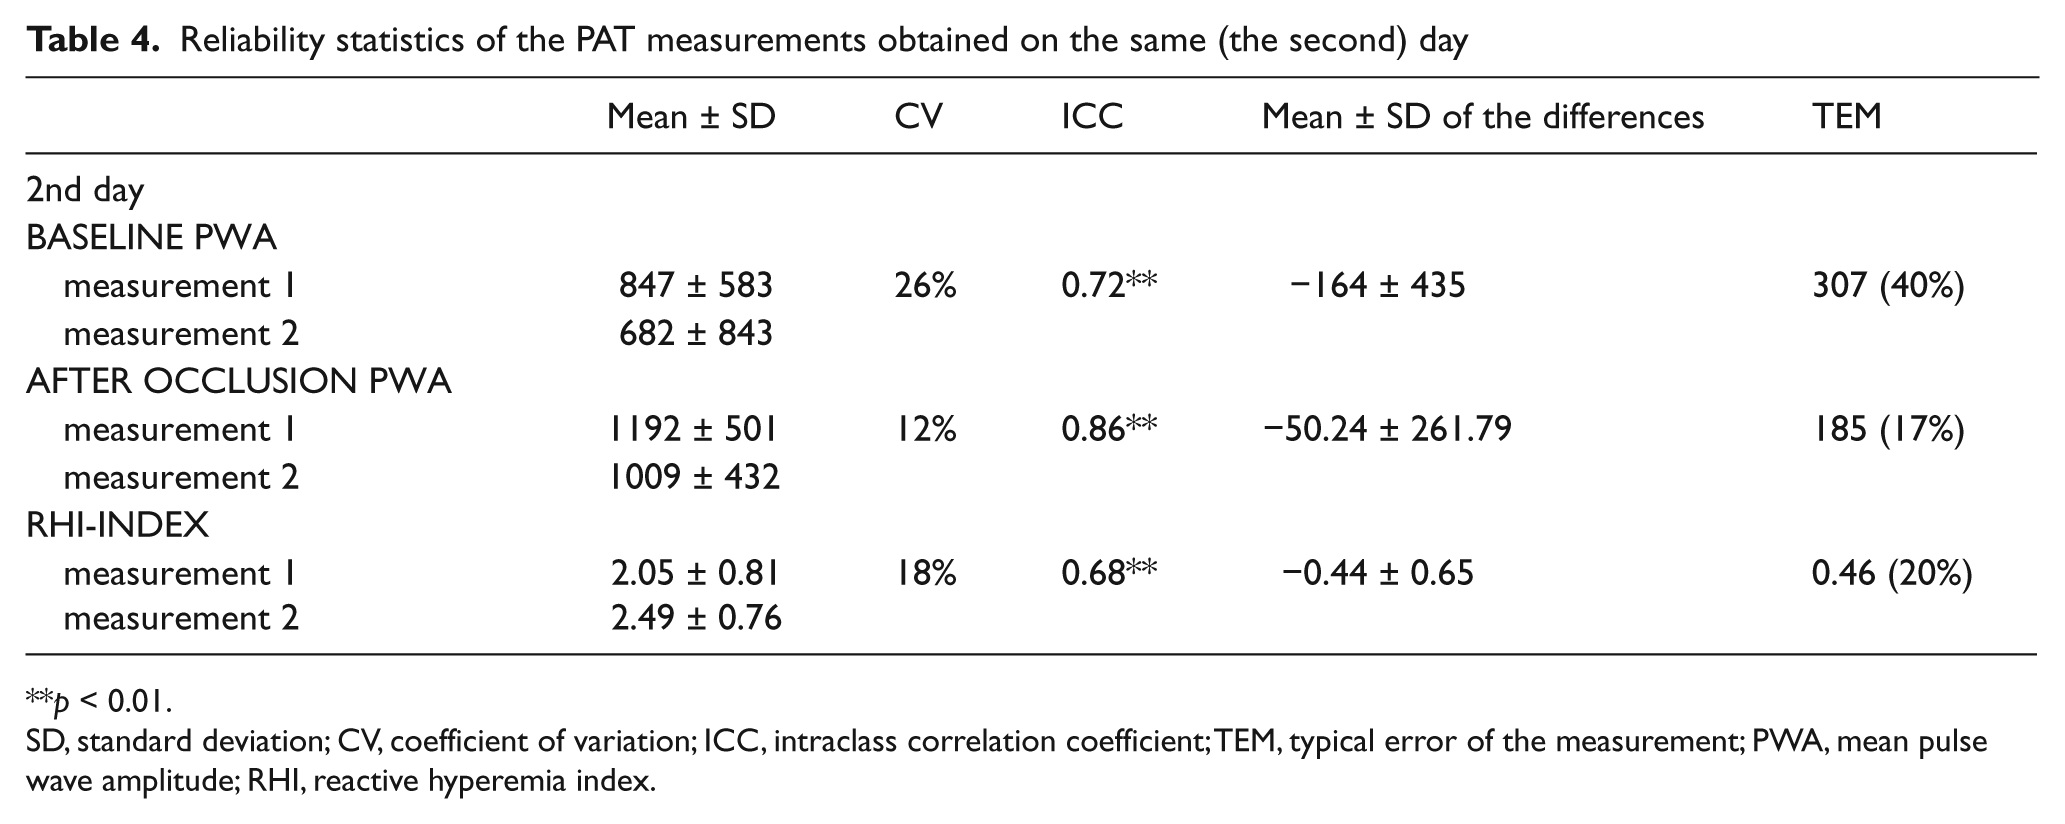
p < 0.01.
SD, standard deviation; CV, coefficient of variation; ICC, intraclass correlation coefficient; TEM, typical error of the measurement; PWA, mean pulse wave amplitude; RHI, reactive hyperemia index.
Reliability statistics of PAT tests obtained on separate days
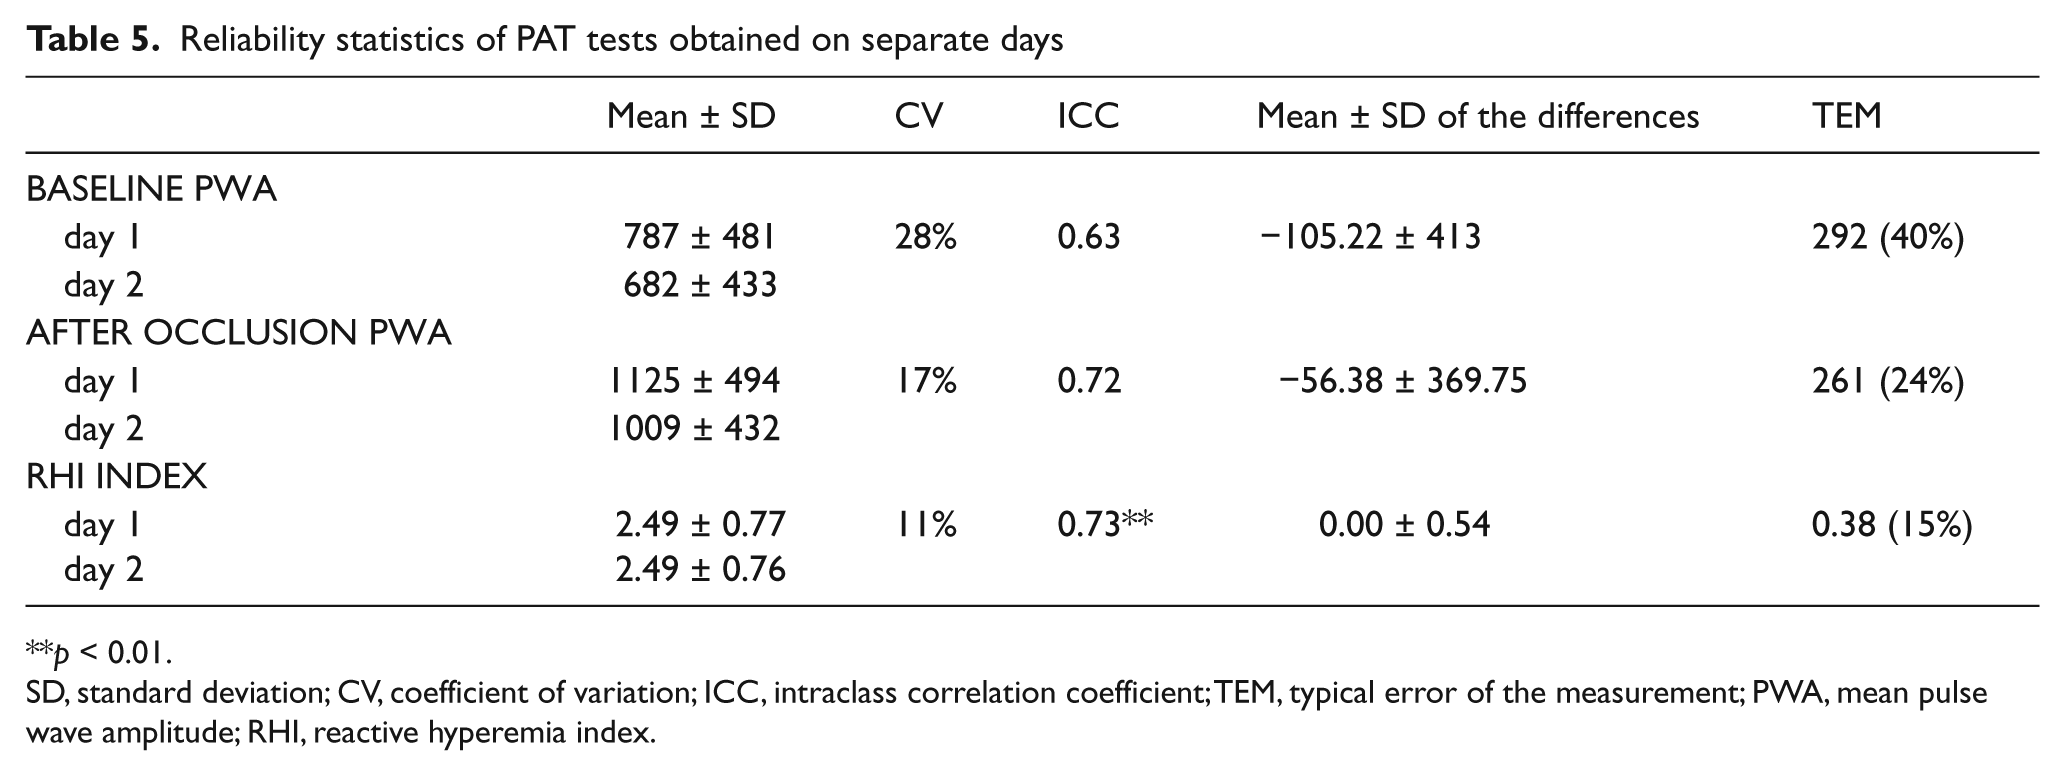
p < 0.01.
SD, standard deviation; CV, coefficient of variation; ICC, intraclass correlation coefficient; TEM, typical error of the measurement; PWA, mean pulse wave amplitude; RHI, reactive hyperemia index.
The Bland–Altman graphs demonstrating the degree of concordance between the pairs of measurements obtained on the same and separate days are shown in Figure 1. For the within-day measurements of RHI, three subjects did not fall within the limits of concordance. For the between-day measurements of both RHI and FMD, one subject did not fall within the concordance limits.
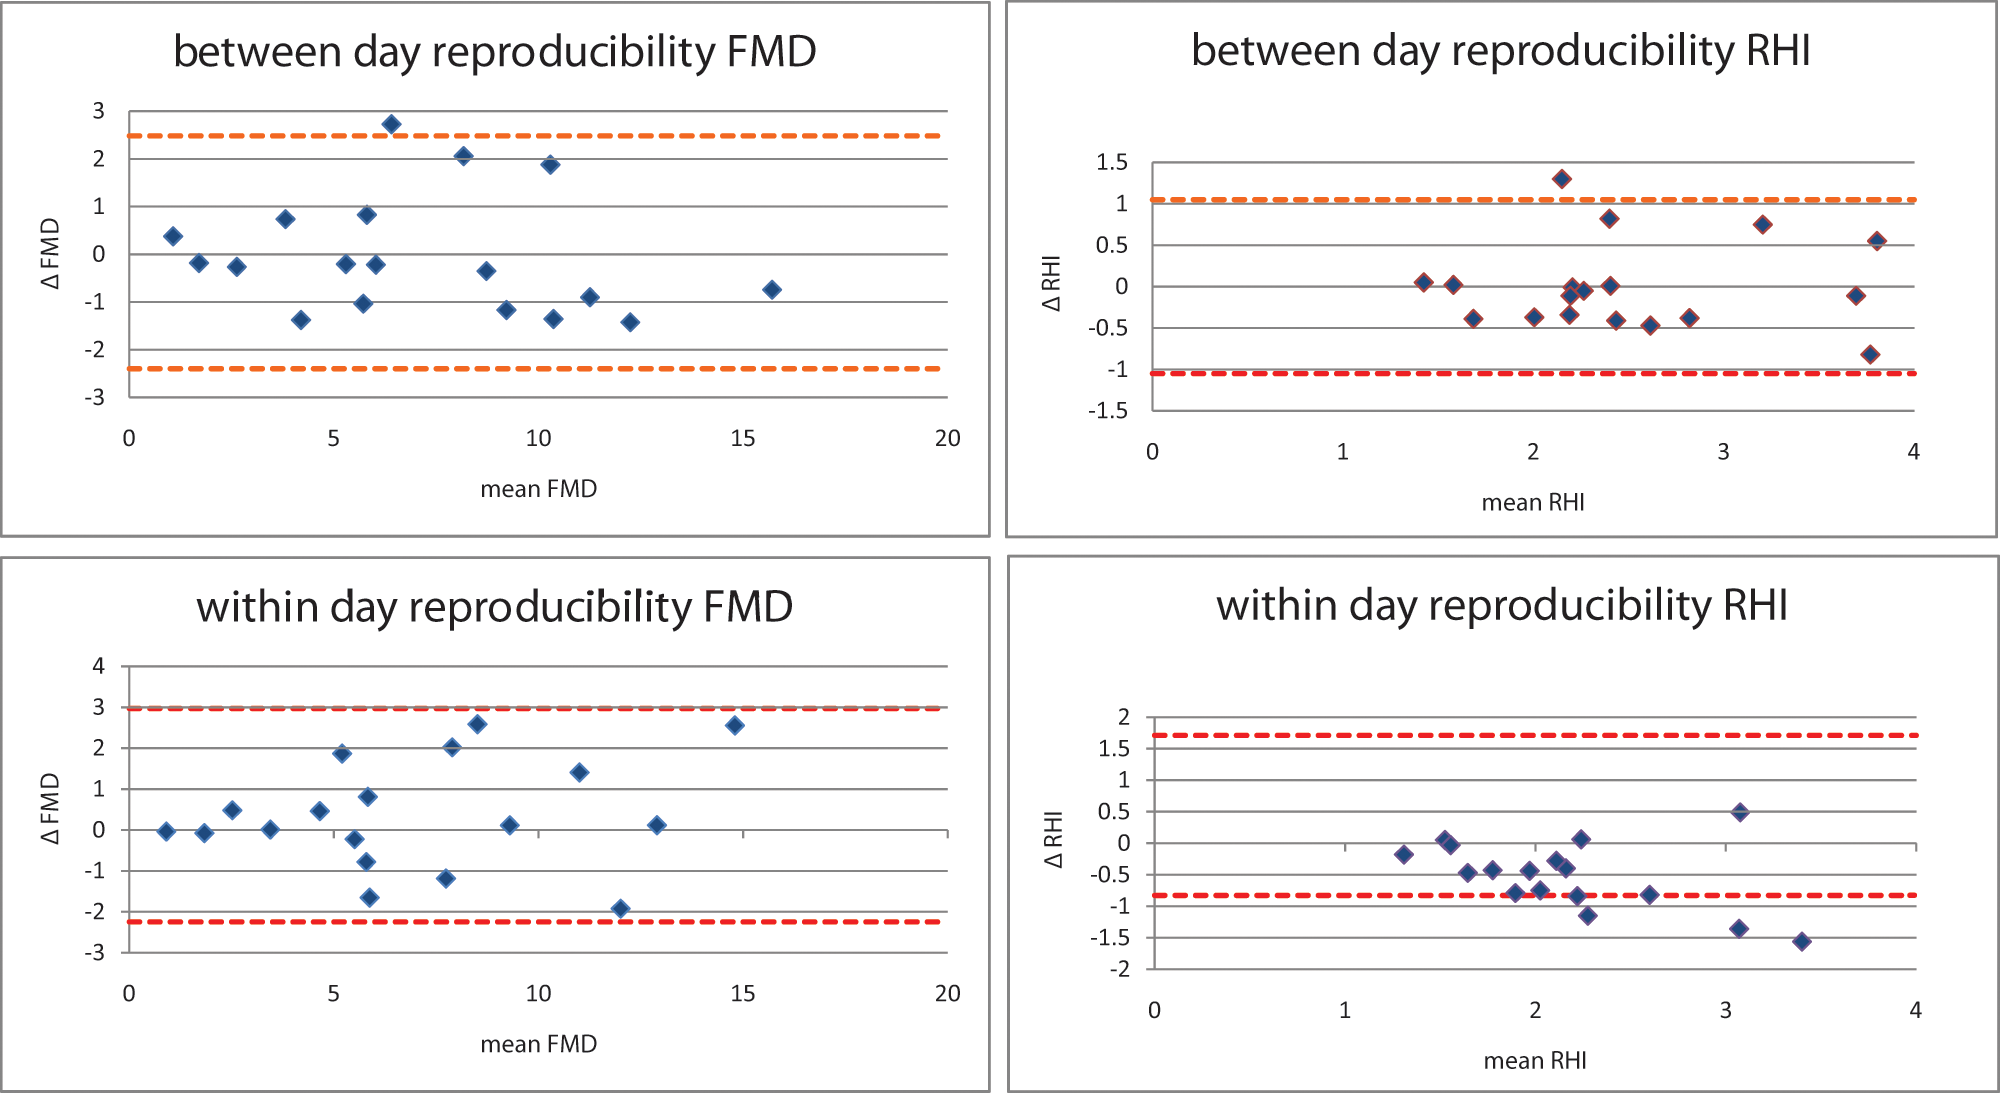
Within- and between-day reproducibility of FMD and RHI illustrated by means of Bland–Altman analysis. The limits of concordance are represented by broken lines.
Discussion
In the present study, we determined the within-day variability of PAT and FMD by repeating the measurements after 30 minutes on the same day and evaluated the between-day variability of both techniques by repeating the measurements after a few days. The reliability of both tests was assessed to quantify the typical error for both techniques. We observed that the within-day variability was lower for the FMD measurements than for the EndoPAT measurements (CV: 10% versus 18%; p < 0.05). For the between-day variability the values were similar (CV: 11% versus 11%). Furthermore, a significant correlation was found between PAT hyperemia and FMD of the brachial artery (r = 0.57, p > 0.001). Finally, the TEM for FMD were lower than those for EndoPAT measurements.
To the best of our knowledge, the present study is unique by evaluating simultaneously endothelial function by BAUS and EndoPAT, both on the same day and on separate days in patients with CAD.
Little information is available in relation to the within-day variability of the FMD measurements. Mannion et al. described only the mean test–retest differences of the BBAD and POBAD measurements, which are similar to the present study (BBAD: 0.07 ± 0.07 mm versus 0.04 ± 0.16 mm; POBAD: 0.14 mm (SD not reported) versus 0.06 ± 0.14 mm). 14 Meirelles et al. found a lower CV and ICC for FMD, as found in this study (CV: 5.8% versus 10%; ICC: 0.7001 versus 0.94). 15
For between-day variability, the coefficients of variation of FMD measurements reported in the literature were extremely inconsistent with means between 2% and 84%.10,16 Our results are similar with those of Meirelles et al. (CV FMD: 12.3% versus 12%). 15
A part of this inconsistency in the literature can be explained by differences in transducer frequency and analysis methods, for example. In our study, we used a computerized edge-detection and wall-tracking software program to allow a more accurate and reproducible measurement. Woodman et al. compared the reliability of manual and semi-automatic measurements using software. The respective CVs for the manual and semi-automatic techniques were 24.8% and 6.7% for FMD (p < 0.05). 17
FMD reliability can also be affected by the frequency of the transducer. Herrington et al. found significantly better results for the FMD separate day measurements when using a 13-MHz transducer (CV: 26.3%) in comparison with a 7.5-MHz transducer (CV: 45.3%). 18 In the present study, longitudinal brachial artery images were obtained with a high-resolution (12 MHz) linear-array vascular ultrasound scanning transducer.
Most studies used healthy male and female volunteers; we only used male volunteers with a cardiovascular history, so there are possible influences of the disease and the medication use on the FMD values and the stability of the FMD values. West et al. found that subjects with more variable values for glucose, insulin and heart rate also showed the greatest variation in FMD across testing days. 19
Owing to the many variables that can affect measurement reliability, a well-described standard protocol is needed with a focus on occlusion time, cuff placement site, transducer resolution, software application and a sonographer’s experience.
Data on the reliability of the PAT technique are scarce. We found a higher variability for the measurements of endothelial function that were assessed with the PAT technique compared to the FMD measurements (CV: 9.94% versus 18.2%). Earlier, Liu et al. measured endothelial function with PAT five to seven times a day and found comparable within-day variability, that is 22.6%, 16.1% and 15.3% (CV) for 2-hour, 1-hour and 0.5-hour intervals between the measurements, respectively. 20 When measurements were performed at 0.5-hour intervals, they found a significant increase of the RHI from measurement 1 to measurement 6, indicating a crossover effect. Such a crossover effect was not found for FMD measurements 21 and might therefore explain the higher variability we observed for the PAT technique between the test–retest values on the same day in our study. Although the guidelines of the International Brachial Artery Reactivity Task Force are followed, a longer time between test–retest is recommended to avoid crossover effects. Further, in agreement with Liu et al., we also found a lower interday reproducibility of the RHI measurements (ICC: 0.47 versus 0.73). 20
When the effect of an intervention – such as a physical activity program or a pharmacological intervention – on the endothelial function is evaluated, the increase in FMD must be higher than our TEM results in order to eliminate interferences caused by evaluator inaccuracy and biological measurement variability.
Thus, when the influence of an intervention on FMD is evaluated, the expected increase in FMD must be higher than 12% of the baseline FMD. Edwards et al. found a significant increase in brachial artery FMD from 7.9% to 11.1% after a 12-week exercise program in patients with CAD. 22 Lavrencic et al. found an increase in FMD from 5.3% to 7.3% in patients with polymetabolic syndrome after a 12-week exercise program, 23 suggesting that the FMD method can be used to determine the effects of an exercise program on endothelial function. No literature was found on the influence of an exercise program on PAT ratio. A significant correlation was found between FMD values and PAT ratio, indicating that PAT may be used to determine the effects of an exercise program on endothelial function. However, the increase in PAT ratio must be higher than 20% to eliminate possible measurement errors.
Conclusions
In this study, the FMD method demonstrated a high reliability for same- and separate-day measurements and can be used to assess changes in endothelial function due to an intervention in patients with cardiovascular diseases. The PAT method showed a poorer reliability and fewer studies that describe the influence of an intervention on the PAT ratio were found. However, when FMD can be performed by a single observer, the same-day and different-day reproducibility was better than for the PAT method, which has the advantage of being less operator-dependent. To generalize these results more subjects are needed. For both methods it is very important to have a well-standardized protocol to minimize the variability.
Footnotes
Acknowledgements
We wish to thank J Voigt, Department of Cardiovascular Diseases, KU Leuven, Belgium for sharing his experience and providing valuable advice and Gregory Szczesny of FLOMEDI for the developing the software program. The assistance of G Pieters and M Tillekaerts is gratefully acknowledged.
This study was supported by grants from the Fund for Scientific Research – Flanders / Fonds voor Wetenschappelijk Onderzoek – Vlaanderen, Belgium (FWO grant G.0624.08) and from the Research Council of the University of Leuven / Onderzoeksraad KU Leuven, Belgium (grant OT/07/064). VC is supported as a Postdoctoral Fellow by Research Foundation Flanders (FWO).
None declared.