
Abstract
A high serum uric acid (SUA) level is a known risk factor for cardiovascular disease. However, little is known about the relationship between arterial stiffness and uric acid in healthy subjects with a normal SUA level. We assessed whether a high-normal uric acid level increased arterial stiffness by measuring brachial–ankle pulse wave velocity (ba-PWV) in healthy subjects. Among 779 subjects who visited the health promotion center, 393 men and 234 women with normal SUA levels (male: 3.5–8.0 mg/dl, female: 2.5–5.4 mg/dl) were divided into quartiles: in men, Q1 (n = 90, 3.5–4.3 mg/dl), Q2 (n = 94, 4.4–5.1 mg/dl), Q3 (n = 106, 5.2–5.9 mg/dl) and Q4 (n = 103, 6.0–8.0 mg/dl); in women, Q1 (n = 57, 2.5–3.6 mg/dl), Q2 (n = 49, 3.7–4.1 mg/dl), Q3 (n = 61, 4.2–4.6 mg/dl) and Q4 (n = 67, 4.7–5.4 mg/dl). The mean values of ba-PWV increased gradually by SUA quartile. The men’s SUA had an independent, positive association with ba-PWV after correcting for age, glucose, body mass index, blood pressure, resting heart rate, high-sensitivity C-reactive protein (hs-CRP), high-density lipoprotein (HDL)-cholesterol and triglyceride (R2 = 0.39, adjusted R2 = 0.37, p < 0.001). The odds ratios (95% CI) for high ba-PWVs (> 75th percentile, 1473 cm/s) in men were 1.89 (0.69–5.20, Q2), 2.36 (1.10–5.08, Q3), and 2.91 (1.39–6.11, Q4), after adjusting for confounding factors (p < 0.001). In women, SUA showed no independent association with ba-PWV (p = 0.186). After adjusting for confounding factors, the mean ba-PWV values of Q3 (1418 cm/s) and Q4 (1421 cm/s) in men were higher than those of Q1 (1355 cm/s) (p < 0.05). Above the SUA level of 5.2 mg/dl, arterial stiffness was increased in healthy Korean men.
Introduction
Hyperuricemia is a known risk factor for kidney disease1-3 and cardiovascular disease.4,5 Supported by a few experimental studies, uric acid may be associated with arterial stiffness by regulating critical proinflammatory pathways, 6 by way of inducing endothelial proliferation related with nitric oxide 7 and stimulating vascular smooth muscle proliferation. 8 Recently, in a cross-sectional study, hyperuricemia increased arterial stiffness and blood pressure in Chinese men. 9 On the contrary, in a Korean study, serum uric acid (SUA) level was not correlated with arterial stiffness. 10 These previous studies represented that the relevance of SUA level as a risk factor for arterial stiffness remains controversial. 11
Arterial stiffness can be easily and non-invasively assessed by measuring brachial–ankle pulse wave velocity (ba-PWV),12,13 which is a suitable screening measure for vascular dysfunction and the development of atherosclerosis in a preventive setting. 14 We previously found that subjects with a high-normal level of cardiovascular risk factors were characterized by a greater incidence of arterial stiffness. 15 Arterial stiffness may develop even in a normal range of risk factors. The relationship between arterial stiffness and normal uric acid levels in healthy subjects has not been examined. Therefore, we assessed whether a high-normal uric acid level was associated with increased arterial stiffness in healthy subjects with no history of cardiovascular disease, hypertension, diabetes mellitus, or dyslipidemia.
Methods
Study population
We recruited 779 subjects (483 men, 296 women) older than 20 years who visited the health promotion center of a university hospital from May 2007 to August 2008. We excluded 64 subjects (42 men, 22 women) with a history of anti-diabetic, anti-hypertensive, or lipid-lowering medications, stroke, or cardiovascular disease such as coronary heart disease, peripheral artery disease, arrhythmia, congestive heart failure, or valvular heart disease. We also excluded 83 subjects (43 men, 40 women) whose uric acid level was not in the normal range, four men who had taken uric acid-lowering agents and diuretics and one man with a low ankle–brachial index (ABI) (< 0.9) that suggested the presence of peripheral artery disease. Ultimately, 627 subjects (393 men and 234 women) were included in this study.
The institutional review board of Gangnam Severance Hospital, Yonsei University College of Medicine approved this study, and informed consent was obtained from each participant.
All of our subjects had a normal SUA level (male: 3.5–8.0 mg/dl; female: 2.5–5.4 mg/dl) and were divided into quartiles according to SUA level: in men, Q1 (3.5 mg/dl ≤ SUA < 4.4 mg/dl), Q2 (4.4 mg/dl ≤ SUA < 5.2 mg/dl), Q3 (5.2 mg/dl ≤ SUA < 6.0 mg/dl), and Q4 (6.0 mg/dl ≤ SUA ≤ 8.0 mg/dl), and in women, Q1 (2.5 mg/dl ≤ SUA < 3.7 mg/dl), Q2 (3.7 mg/dl ≤ SUA < 4.2 mg/dl), Q3 (4.2 mg/dl ≤ SUA < 4.7 mg/dl), and Q4 (4.7 mg/dl ≤ SUA ≤ 5.4 mg/dl). Blood pressure and resting heart rate (RHR) were measured after more than 5 minutes of rest. Anthropometric measurements were used to calculate body mass index (BMI). To reduce inter-observer variation in measurements, one researcher gathered all anthropometric parameters throughout the study. A questionnaire was used to obtain information about a participant’s medical history and lifestyle, including exercise, smoking habits, and alcohol consumption. In this study, smokers were defined as current smokers who had smoked more than 100 cigarettes during their lifetime and answered in the affirmative to the question, ‘Do you currently smoke?’ The exercise group was defined as doing regular exercise for over 4 hours per week. Subjects were instructed to refrain from alcohol the day before testing as well as smoking, coffee, tea, and pain medication on the day of measurement.
After an overnight fast, serum glucose, total cholesterol, triglyceride, and high-density lipoprotein (HDL)-cholesterol levels were measured via enzymatic procedures using an autoanalyzer (Bayer, Terrytown, NY, USA). Low-density lipoprotein (LDL)-cholesterol was calculated by the Friedewald formula. 16 High-sensitivity C-reactive protein (hs-CRP) was measured using a latex-enhanced immunoturbidimetric assay in an ADVIA 1650 Chemistry System (Bayer). SUA and creatinine were measured using a Hitachi 7600-110 Chemistry Autoanalyzer (Hitachi, Tokyo, Japan).
PWV measurement
Ba-PWV was measured using a volume plethysmographic instrument (PWV/ABI; Colin Co, Komaki, Japan), which recorded a phonocardiogram, electrocardiogram, volume pulse form, and arterial blood pressure at the left and the right brachial arteries and ankles. The ba-PWV was calculated using time-phase analysis between the right brachial artery pressure and the volume waveforms at both ankles. The distance between the right brachium and the ankle was estimated based on the subject’s height. We used the mean ba-PWV in analyses. Both ba-PWV values were measured after allowing the patient to rest in the supine position for at least 5 minutes in an air-conditioned room (24–26°C). The validity, reliability, and reproducibility of this instrument were assessed in a previous study. 17
Statistical analysis
SAS 9.1 was used for statistical analyses (SAS Institute, Cary, NC, USA). Mean values of the clinical characteristics were compared among the four subject groups using the ANOVA test for continuous variables and the chi-squared test for categorical variables according to SUA quartiles and sex. The hs-CRP was logarithmically transformed to correct a skewed distribution, but untransformed raw data are presented as the mean ± standard deviation (SD) in tables. Pearson’s correlation coefficients were calculated in order to evaluate the relationships between ba-PWV and clinical variables. Multiple linear regression analysis with a stepwise forward selection procedure was performed to identify any independent associations between ba-PWV and SUA levels. A high ba-PWV group was defined as greater than 1473 cm/s (> 75th percentile). The odds ratios (95% confidence intervals [CIs]) for high ba-PWVs were calculated using a multivariable logistic regression analysis after adjusting for age, blood pressure, fasting plasma glucose, BMI, resting heart rate, hs-CRP, triglyceride, and HDL-cholesterol. The mean ba-PWV of each quartile was analyzed using an ANCOVA test considering confounding factors. A p-value less than 0.05 was considered statistically significant.
Results
The characteristics of the men and women enrolled in this study are shown in Tables 1 and 2. Age, BMI, systolic/diastolic blood pressure, fasting plasma glucose, hs-CRP, creatinine, HDL-cholesterol, triglyceride level, the proportion of current smokers, alcohol consumption and exercise differed between the four quartile groups. The ba-PWV increased with each SUA quartile: Q1, 1283 cm/s; Q2, 1357 cm/s; Q3, 1402 cm/s; and Q4, 1418 cm/s in men; and Q1, 1279 cm/s; Q2, 1284 cm/s; Q3, 1336 cm/s; and Q4, 1354 cm/s in women.
Clinical and metabolic characteristics of healthy Korean men according to the serum uric acid (SUA) quartile (n = 393)
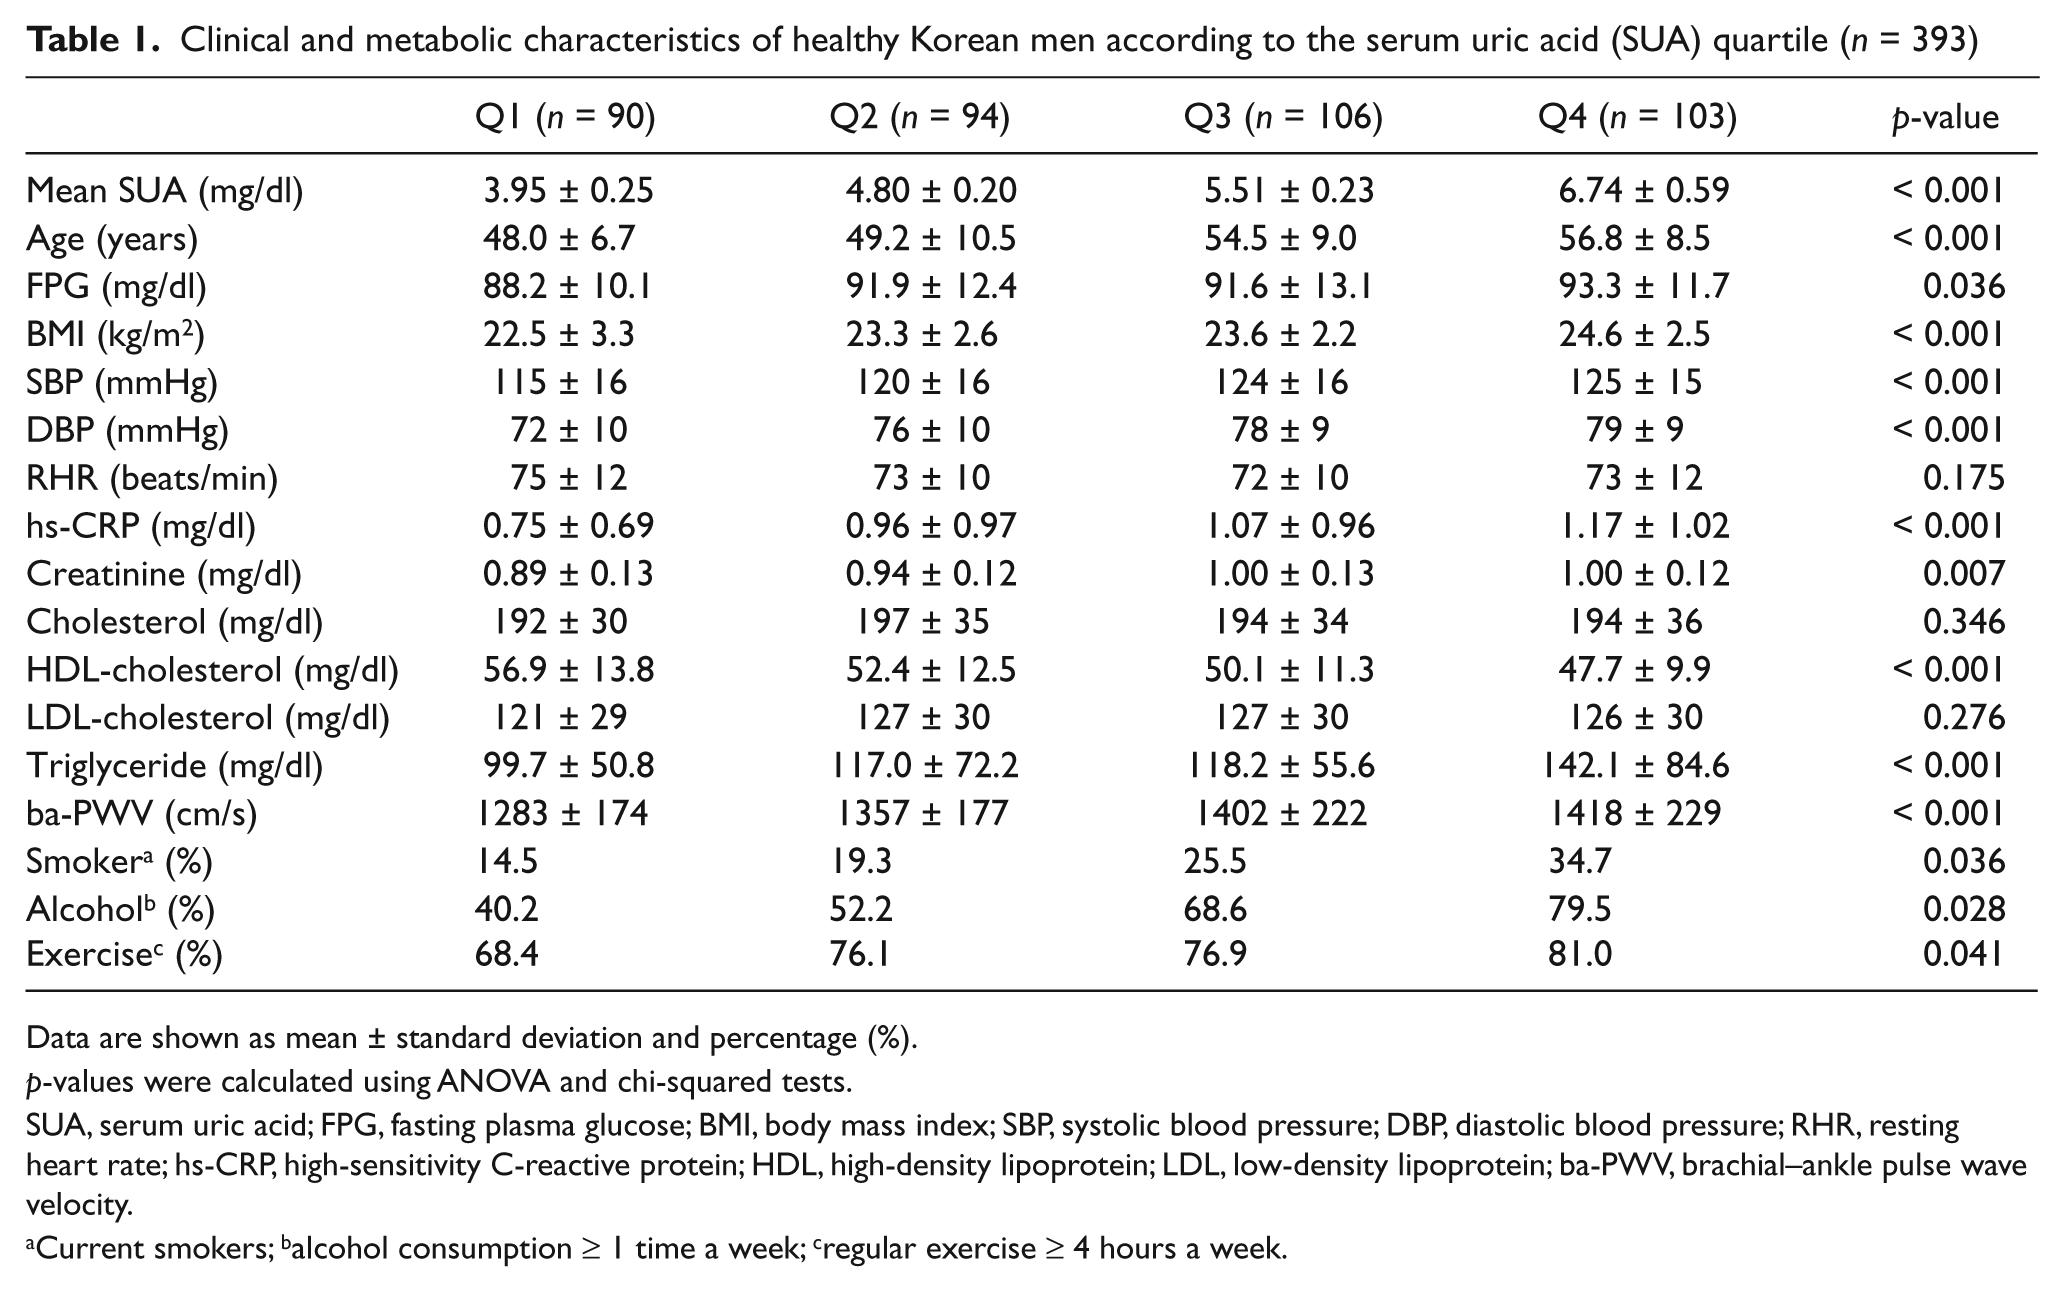
Data are shown as mean ± standard deviation and percentage (%).
p-values were calculated using ANOVA and chi-squared tests.
SUA, serum uric acid; FPG, fasting plasma glucose; BMI, body mass index; SBP, systolic blood pressure; DBP, diastolic blood pressure; RHR, resting heart rate; hs-CRP, high-sensitivity C-reactive protein; HDL, high-density lipoprotein; LDL, low-density lipoprotein; ba-PWV, brachial–ankle pulse wave velocity.
Current smokers; balcohol consumption ≥ 1 time a week; cregular exercise ≥ 4 hours a week.
Clinical and metabolic characteristics of healthy Korean women according to the serum uric acid (SUA) quartile (n = 234)
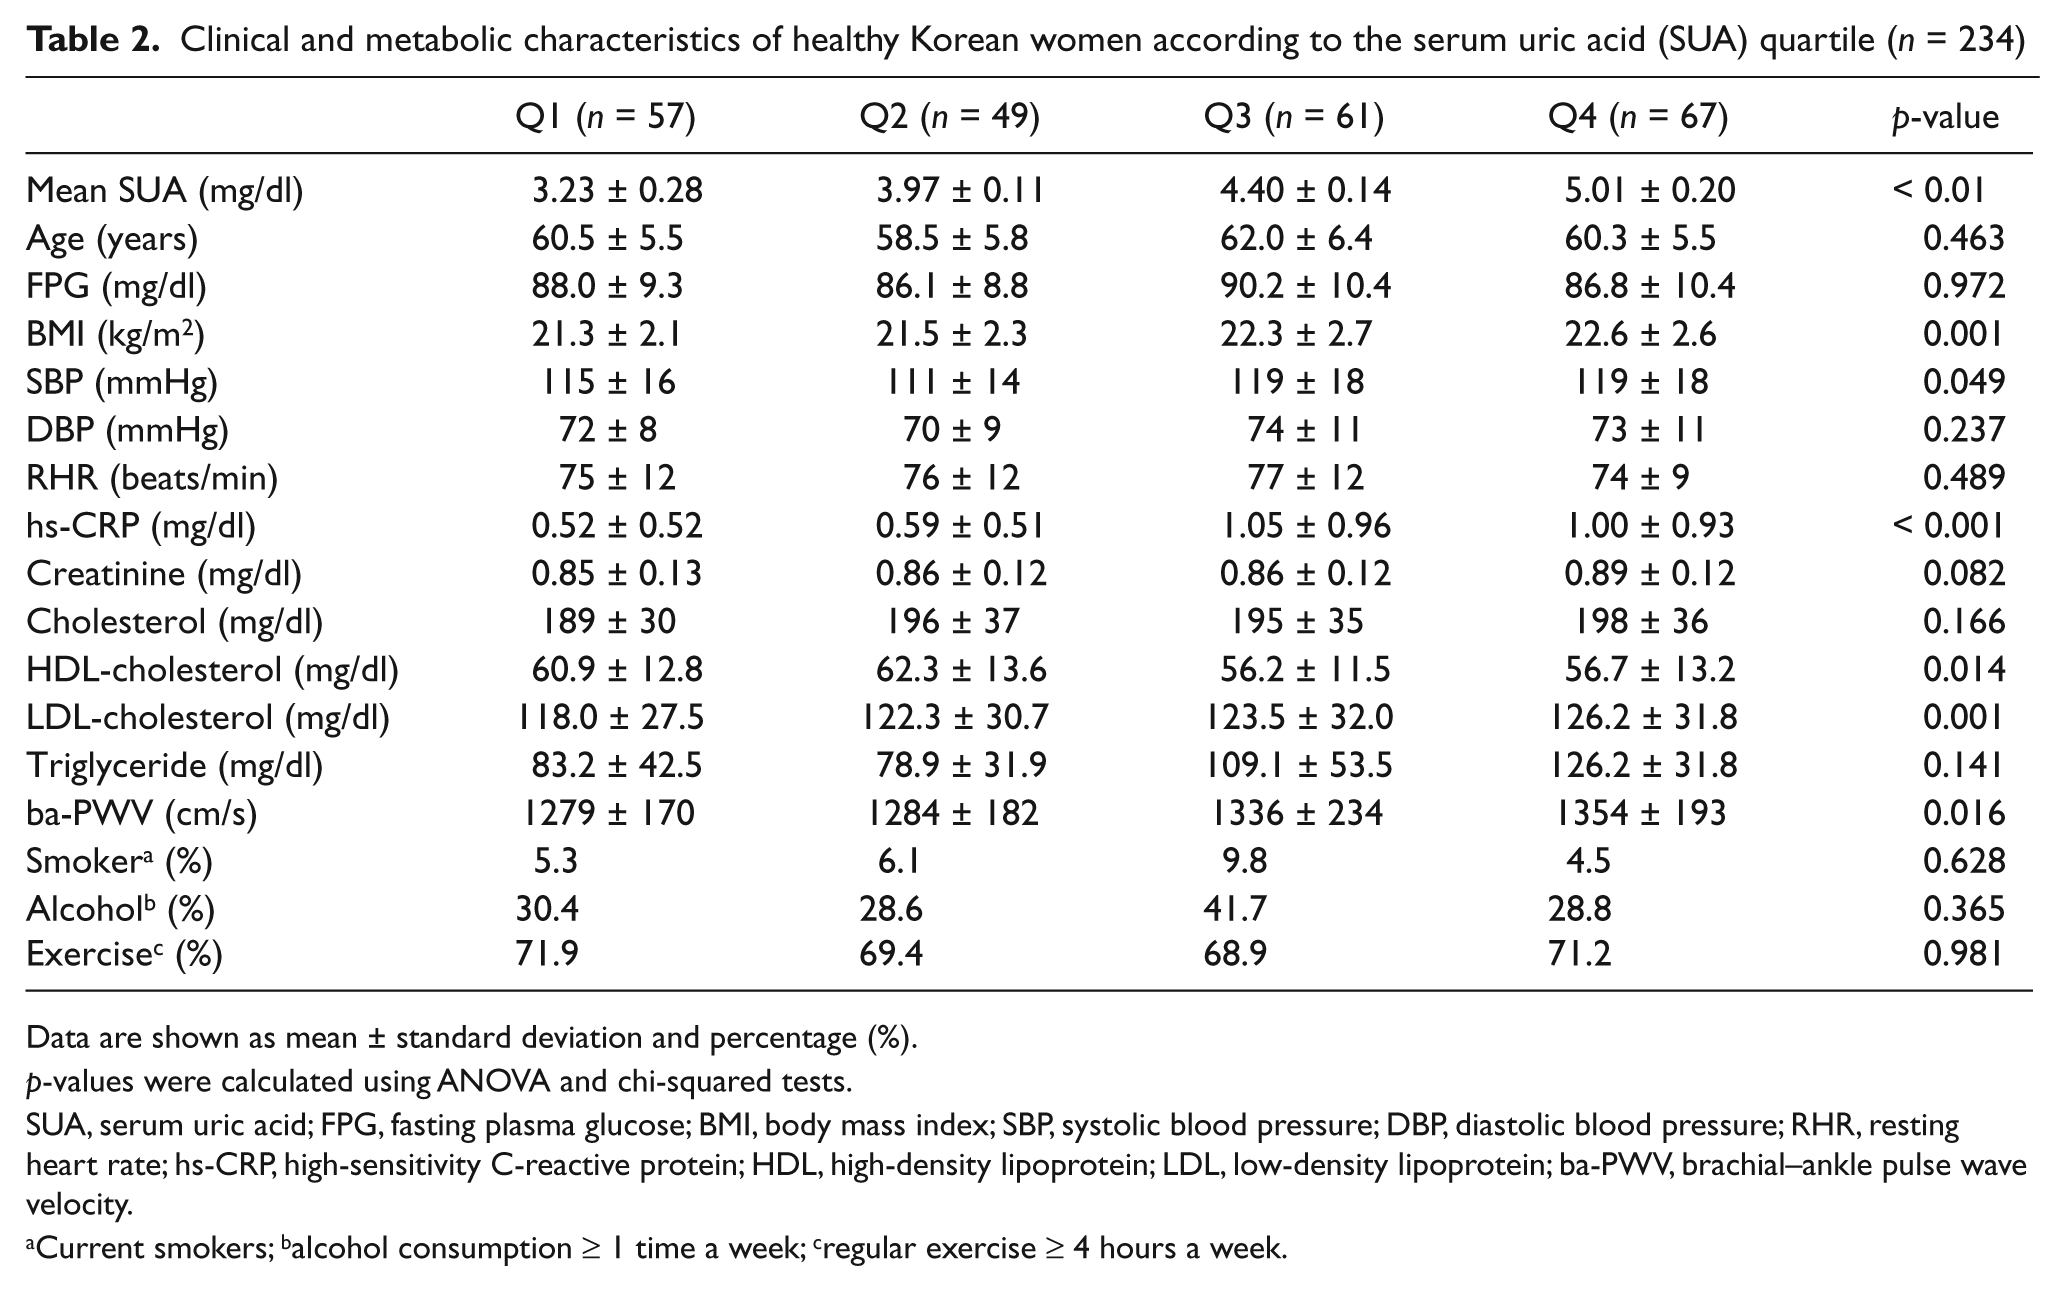
Data are shown as mean ± standard deviation and percentage (%).
p-values were calculated using ANOVA and chi-squared tests.
SUA, serum uric acid; FPG, fasting plasma glucose; BMI, body mass index; SBP, systolic blood pressure; DBP, diastolic blood pressure; RHR, resting heart rate; hs-CRP, high-sensitivity C-reactive protein; HDL, high-density lipoprotein; LDL, low-density lipoprotein; ba-PWV, brachial–ankle pulse wave velocity.
Current smokers; balcohol consumption ≥ 1 time a week; cregular exercise ≥ 4 hours a week.
On age-adjusted Pearson’s correlation analysis, ba-PWV was correlated with SUA, BMI, systolic and diastolic blood pressure, resting heart rate, fasting plasma glucose, hs-CRP, HDL-cholesterol, and triglyceride levels in men. In women, ba-PWV was correlated with LDL-cholesterol as well as these variables (Table 3). After correcting for significantly correlated variables, in men, SUA was independently associated with ba-PWV in a multiple linear regression analysis (R 2 = 0.39, adjusted R 2 = 0.37, p < 0.001; Table 4). However, in women, SUA was not independently associated with ba-PWV (p = 0.186). Further analyses of women were not performed. The odds ratios (95% CIs) of men for high ba-PWVs (> 75th percentile, 1473 cm/s) according to SUA quartile were 1.00 (Q1), 1.89 (0.69–5.20, Q2), 2.36 (1.10–5.08, Q3), and 2.91 (1.39–6.11, Q4) after adjusting for confounding factors (p < 0.001; Table 5). After adjusting for age, systolic/diastolic blood pressure, fasting plasma glucose, BMI, resting heart ratio, logarithmically transformed hs-CRP, creatinine, cholesterol, LDL-cholesterol, HDL-cholesterol, triglyceride, alcohol consumption, smoking habit, and exercise, the mean ba-PWV values of Q3 (1418 cm/s) and Q4 (1421 cm/s) were higher than those of Q1 (1355 cm/s) in men (p < 0.05; Figure 1).
Age-adjusted correlations between brachial–ankle pulse wave velocity and various parameters in healthy Korean subjects
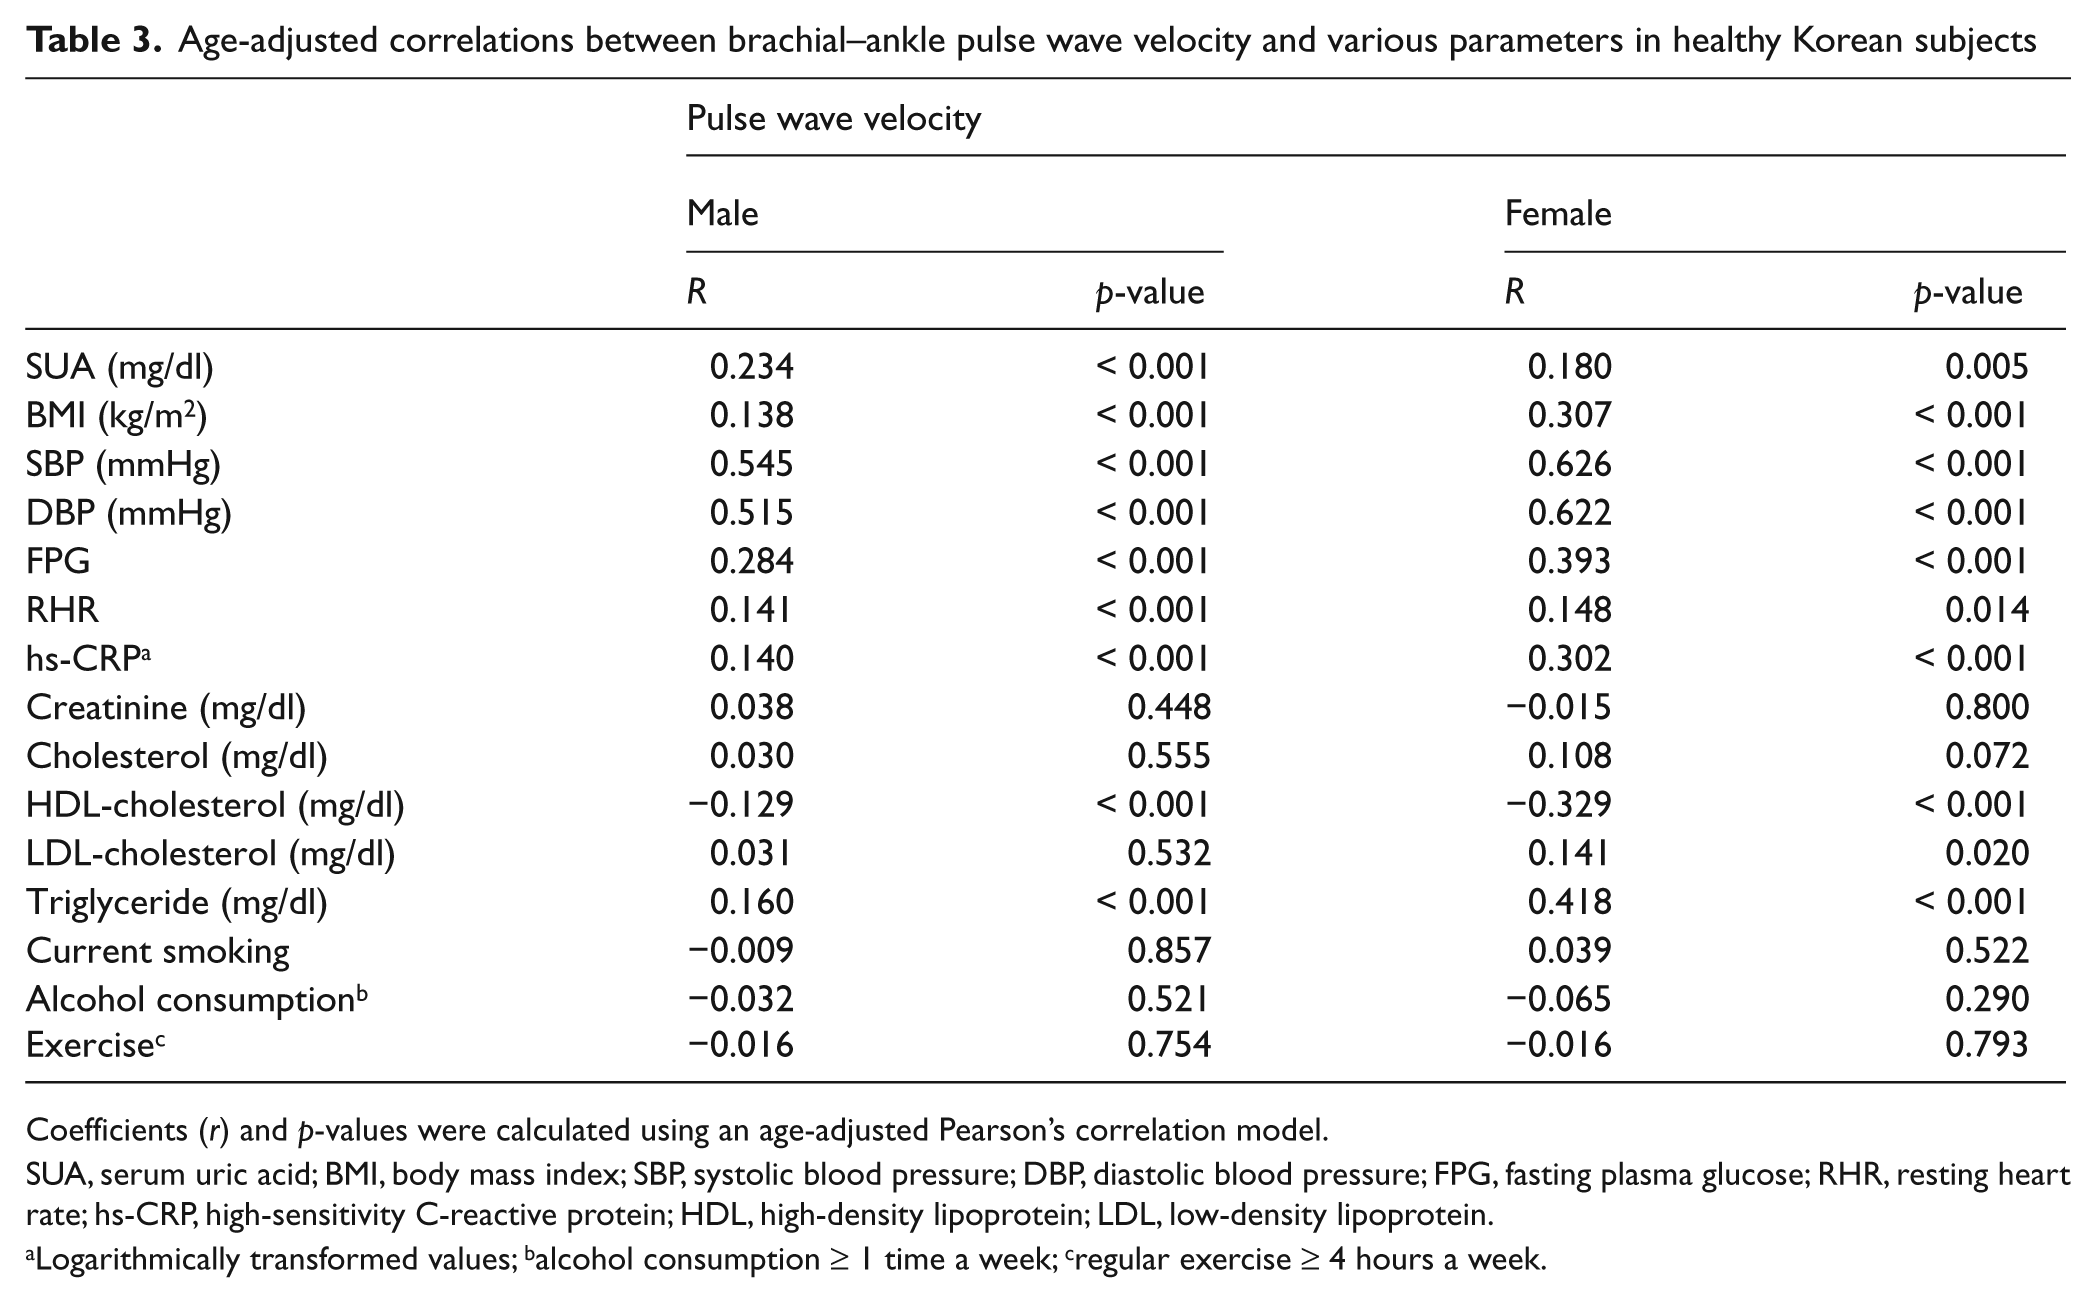
Coefficients (r) and p-values were calculated using an age-adjusted Pearson’s correlation model.
SUA, serum uric acid; BMI, body mass index; SBP, systolic blood pressure; DBP, diastolic blood pressure; FPG, fasting plasma glucose; RHR, resting heart rate; hs-CRP, high-sensitivity C-reactive protein; HDL, high-density lipoprotein; LDL, low-density lipoprotein.
Logarithmically transformed values; balcohol consumption ≥ 1 time a week; cregular exercise ≥ 4 hours a week.
Multiple linear regression analyses with forward stepwise selection between pulse wave velocity and clinical variables in healthy Korean subjects
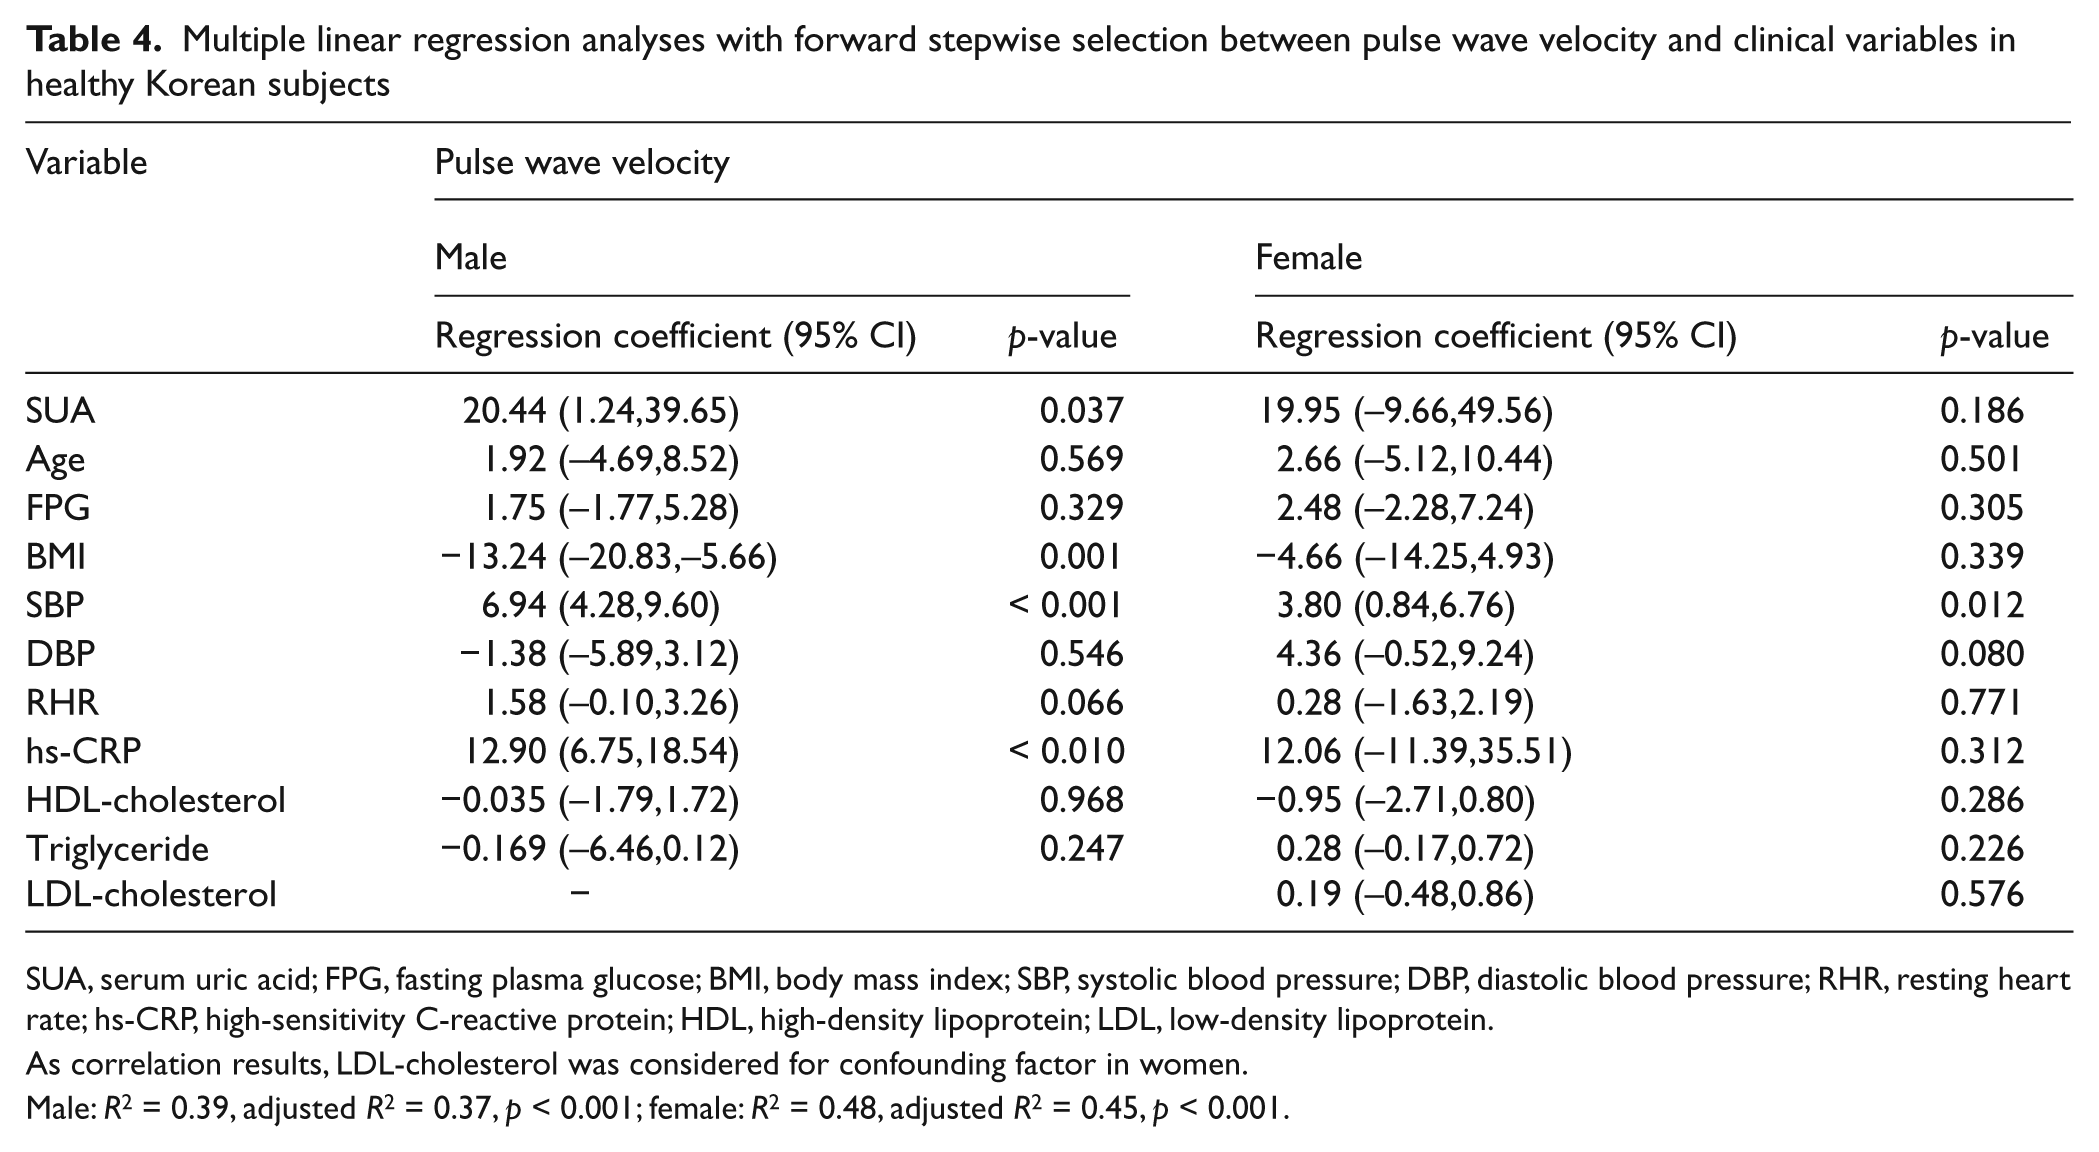
SUA, serum uric acid; FPG, fasting plasma glucose; BMI, body mass index; SBP, systolic blood pressure; DBP, diastolic blood pressure; RHR, resting heart rate; hs-CRP, high-sensitivity C-reactive protein; HDL, high-density lipoprotein; LDL, low-density lipoprotein.
As correlation results, LDL-cholesterol was considered for confounding factor in women.
Male: R2 = 0.39, adjusted R2 = 0.37, p < 0.001; female: R2 = 0.48, adjusted R2 = 0.45, p < 0.001.
Odds ratios (95% CIs) AQ4: Table 5 legend: added ‘95% CIs’ here. OK?according to the serum uric acid quartile in healthy Korean men
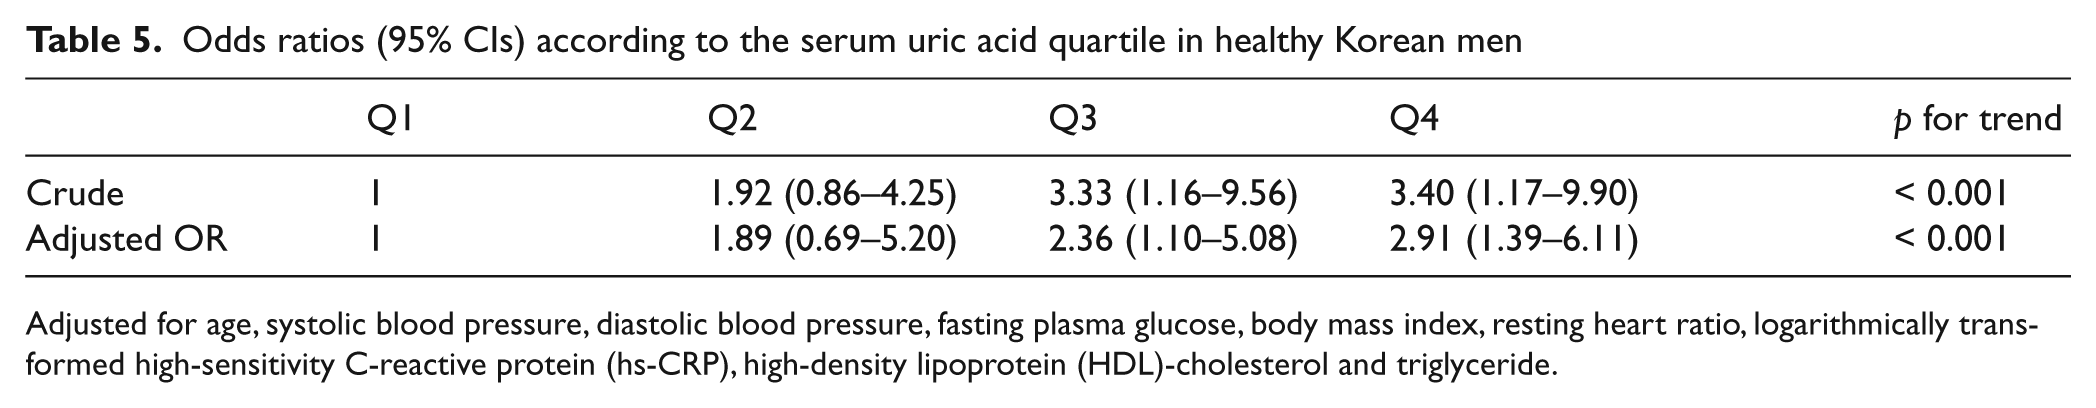
Adjusted for age, systolic blood pressure, diastolic blood pressure, fasting plasma glucose, body mass index, resting heart ratio, logarithmically transformed high-sensitivity C-reactive protein (hs-CRP), high-density lipoprotein (HDL)-cholesterol and triglyceride.
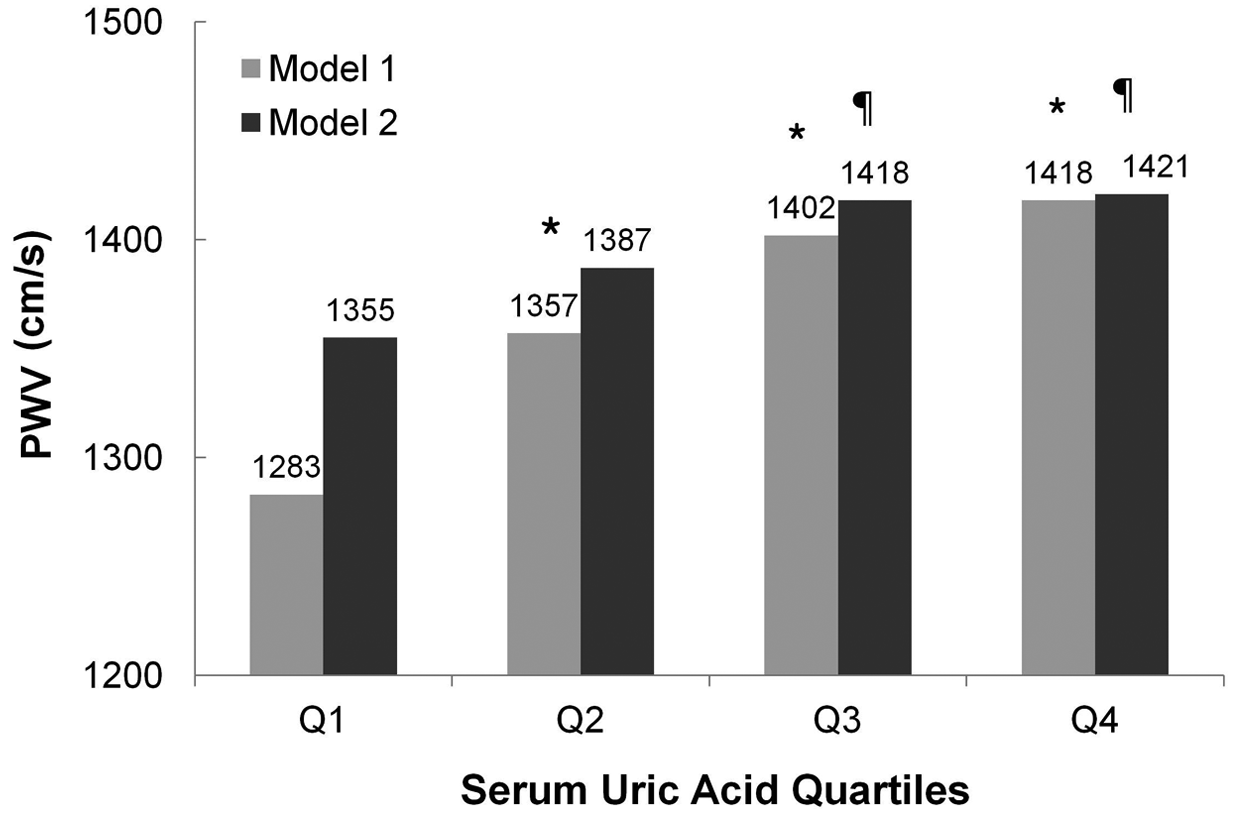
Mean values of brachial–ankle pulse wave velocity according to the serum uric acid quartile in healthy men. *p < 0.001 vs Q1, ¶p < 0.05 vs Q1. Model 1: crude analysis; Model 2: adjusted for age, systolic blood pressure, diastolic blood pressure, fasting plasma glucose, body mass index, resting heart ratio, logarithmically transformed high-sensitivity C-reactive protein, creatinine, cholesterol, low-density lipoprotein-cholesterol, high-density lipoprotein-cholesterol, triglyceride, alcohol consumption, smoking habit and exercise.
Discussion
Our study found that SUA level, even within the normal range, is associated with aggravation of arterial stiffness in healthy Korean men. Based on the odds ratios between the quartile divisions, arterial stiffness may already be occurring above the Q3 (5.2 mg/dl) level. Our findings may prove useful for early assessment of disease progression before the development of hypertension, diabetes, and hyperuricemia.18–20 However, we do not insist that SUA levels below the Q3 (5.2 mg/dl) level indicate a lesser risk of arterial stiffness.
Our study offers a design that controls for creatinine levels, 21 past medical history and medications (uric acid-lowering agents and diuretics). As renal function deteriorated in the hypertensive patients, arterial stiffness could be overestimated. 22 Autonomic tone, and sympathetic/parasympathetic activity may increase vascular tone and resistance. 23 Therefore, we considered resting heart rate as a confounding factor. According to the Pearson’s correlation, SUA is closely related to blood pressure and fasting glucose. Nevertheless, SUA is independently associated with arterial stiffness adjusting for blood pressure and glucose. Also, this result helps confirm the relationship between uric acid and blood pressure in Chinese men. 9 There was no independent association in this study of SUA with ba-PWV in women (β = 19.95 (–9.66, 49.56), p = 0.186, adjusted R 2 = 0.45). This sex difference was probably due to the narrow normal range of uric acid level and weak statistical power, as the total number of enrolled women (n = 234) was smaller than that of the men.
Several studies have found a relationship between uric acid and ba-PWV, but this is the first examination of healthy subjects with normal uric acid levels. Saijo et al. reported a relationship between SUA and arterial stiffness, but did not distinguish between normal and high uric acid levels. 24 Ishizaka et al. described an independent association between SUA and PWV, but did not control for confounding factors and also included subjects with hypertension, diabetes mellitus, and hyperlipidemia. 25 Lim et al. found no correlation between SUA and ba-PWV in Korean subjects with metabolic syndrome, but did not adjust for blood pressure, which has a known association with PWV. 10 They reported that SUA was not correlated with systolic/diastolic blood pressure or fasting plasma glucose, triglyceride, or HDL-cholesterol levels, which were related to SUA in the MONICA/KORA cohort study of Meisinger et al. 26 Although our data were not shown, SUA correlated with all of these variables.
High-normal uric acid levels may promote the development and progression of arterial stiffness by producing superoxide and oxidative stress via the xanthine oxidase pathway 27 and by stimulating inflammation, considering the correlation of SUA and hs-CRP in this study. 6
Although the rates of smoking, heavy alcohol intake and regular exercise differed among the SUA quartiles, these variables were not correlated with ba-PWV in our study and were excluded in the multivariable analysis through forward stepwise selections. The influence of chronic smoking on increasing arterial stiffness remains controversial, 28 even though Yufu et al. found no significant differences between smokers and non-smokers when evaluating ba-PWV. 29 However, since it cannot be ruled out that smoking cessation may improve arterial stiffness, 30 we defined smokers as current smokers. Also, because acute smoking (5–15 minutes before the measurement of PWV) may increase PWV values, 28 we instructed all study participants to refrain from smoking on the day measurements were to take place to exclude the influence of acute smoking. McClean et al. reported that acute (within 60 minutes), moderate exercise had no effects on PWV. 31 Nevertheless, we made sure that blood pressure, ba-PWV and resting heart rate were measured after at least 5 minutes of rest to minimize the influence of exercise.
Our study had several limitations. First, because we did not measure levels of insulin, we cannot comment on the effect of insulin on uric acid metabolism. Further study is needed to adjust for insulin resistance. 32 Second, as this study was cross-sectional and was carried out in only one location, it was not possible to establish the exact pathophysiology linking SUA and ba-PWV. Also, we could not explain the characteristics of diverse local environments. Nonetheless, this study is the first attempt to compare arterial stiffness as measured by ba-PWV according to quartiles of normal SUA for the purpose of early detection and prevention of arterial stiffness.
Conclusions
SUA level, even within the normal range, is associated with an increase in arterial stiffness in healthy men. Further research is needed to elucidate the role of SUA in arterial stiffness and to determine the optimal uric acid level for the prevention of arterial stiffness.
Footnotes
This research received no specific grant from any funding agency in the public, commercial, or not-for-profit sectors.
The authors have no conflicts of interest to declare.