
Abstract
Objective
We compared the impact of accessing healthcare (1) by telehealth (via telephone or video) vs face-to-face; and (2) by telephone vs video telehealth care, on escalation to emergency care.
Methods
We searched Medline, Embase and Cochrane CENTRAL to 24 July 2023; and conducted a citation analysis on 19 September 2023. We included randomised controlled trials. Risk of bias was assessed using Cochrane Tool 2. We calculated risk ratios for dichotomous outcomes and standardised mean difference for continuous outcomes.
Results
Ten trials compared telehealth (five telephone, four video, one both) to face-to-face care. Six were overall low, three some concerns and one high risk of bias. There were no differences between telehealth and face-to-face for visits to the emergency department (RR 1.07, 95% CI 0.89 to 1.29), hospitalisations up to 12 months (RR 0.89, 95% CI 0.56 to 1.41), deaths or other adverse events. Costs of care were similar, as were patient satisfaction scores.
Six trials compared telephone to video telehealth: three were overall low, two some concerns, and one high risk of bias. There were no differences between telephone and video for visits to the emergency department (RR 0.67, 95% CI 0.41 to 1.12), hospitalisations (RR 1.04, 95% CI 0.73 to 1.48), deaths, other adverse events, costs, or patient satisfaction. Healthcare provider satisfaction was high.
Conclusions
Telehealth care – delivered by telephone or by video – may be an appropriate alternative to face-to-face provision of care, as it does not increase the likelihood of escalation of care to the emergency department for patients in primary care, hospital outpatients, post-discharge patients or residents in aged care.
Background
Telehealth involves the provision of healthcare services remotely, using information and communications technologies, such as video conferencing, teleconferencing, remote monitoring, mobile apps and other technologies; it may be provided synchronously (‘live’) or asynchronously (e.g., through remote monitoring).1,2
Prior to 2020, telehealth was available in Australia on a limited basis. 3 However, with the declaration by the World Health Organisation of the COVID-19 pandemic in March 2020, 4 the temporary payment of benefits for telehealth was enabled in Australia, allowing for the ongoing provision of telehealth care services by general practitioners, allied healthcare professionals and specialists. 5 The adoption of telehealth has been considerable. In 2022, there were over 45 million telehealth consultations in Australia. By provider, telehealth consultations represented 22% of all GP consultations, 14% of specialist consultations, 27% of mental health consultations, 28% of nurse practitioner consultations and 15% of allied health consultations. 6 In December 2021, the Australian Government announced an investment of $106 M to support the permanent implementation of telehealth services as part of the Medicare Benefits Schedule. 7
Telehealth can increase the accessibility of health care services particularly in areas of provider shortages, 8 improve healthcare equity, 2 reduce costs to the healthcare system 9 and reduce travel time and inconvenience to patients. 10 Patients are often satisfied or very satisfied with telehealth care 11 and previous systematic reviews have shown no differences in satisfaction scores between those patients who received care face-to-face and those who received it by telehealth.12–15 Evidence also suggests that outcomes for clinical care provided by live telehealth (e.g., by telephone or videoconferencing) are no different to those for face-to-face care, for a broad range of clinical areas and conditions, in primary, allied and specialist care.16–18
However, whilst diagnostic accuracy requiring history-taking only is similarly effective for telehealth and face to face care, tele-diagnosis can be challenging when physical examination is necessary,17,19 raising the question of whether telehealth may have higher rates of patient transfer to emergency care than face to face care.
To our knowledge, no systematic review has thus far been conducted to answer this question, although a recent scoping review, focusing specifically on residential aged care population, explored the evidence around the impact of the use of telehealth for transfers to emergency care. 20 We therefore conducted a systematic review with meta-analyses, with a broader focus – i.e., including individuals in both primary and aged care settings – and comparing the effect of live telehealth and face-to-face care, on patient transfer to the emergency department.
Methods
This systematic review is reported following the Preferred Reporting Items for Systematic Reviews and Meta-Analyses (PRISMA) statement and the review protocol was developed prospectively although was not made publicly available. We followed the ‘2-week systematic review’ (2weekSR) processes for this review.16,21
Inclusion criteria
Participants
We included studies conducted in people of any age, gender, or condition, receiving care in primary care and/or in residential aged care (nursing home, residential aged care homes, etc.) setting. We excluded studies in tertiary care (in-hospital patients). Studies conducted in people discharged from hospital and undergoing care by one of the following care providers were included.
Care had to be provided by:
General Practitioners Allied healthcare providers: e.g., psychologist, occupational therapist, physiologist, practice nurse, speech pathologists, Aboriginal and Torres Strait Islander healthcare practitioners and workers, etc. Nurse practitioners Midwives
We excluded studies in which care was provided by specialists (e.g., psychiatrists, dermatologists, rheumatologists, etc.), unless the care also included both the patient and one of the includable healthcare providers (i.e., the care involved, for example, a patient, a GP and a psychiatrist). Solely clinician-to-clinician consultations (i.e., those not involving patients) were excluded.
Interventions
We included studies evaluating the effectiveness of real-time (synchronous) consultations via video or telephone. Studies of consultations involving asynchronous provision of care (e.g., store and forward of patient generated data) were excluded.
We excluded studies evaluating mobile apps, virtual reality, texting (e.g., reminders), online based platforms (e.g., information and support systems), telemonitoring and studies of novel (non-standard) interventions.
Consultations could include single or multiple episodes of care, but the compared groups had to receive similar care in terms of frequency, duration and healthcare provider.
Comparators
Comparison 1: We included studies comparing consultations via video or telephone, to face-to-face (in-person) consultations.
Comparison 2: We included studies comparing consultations via video to consultations provided by telephone. This addition is a deviation from the protocol, and was added following a request of the Department of Health (Australia) which commissioned this review (see Conflict of Interest/Funding statement).
Outcomes (primary, secondary)
The primary outcomes were: visits to the emergency department (Emergency Department, Emergency Room, Accident & Emergency, etc.) and hospital admissions (hospital admittance, hospitalisations, etc.)
The secondary outcomes were: safety (including adverse events, mortality), costs (cost effectiveness, direct costs, etc.), patient satisfaction and healthcare provider satisfaction.
Study design
We included randomised controlled trials (RCTs) of any design (parallel, cluster, crossover, factorial or mixed), with more than 10 participants. Systematic reviews were excluded, although where identified, they were searched for additional includable studies. All other study designs (non-randomised trials, observational studies, qualitative-only studies) and all other types of reviews (e.g., literature, scoping, etc.) were excluded.
Publication type and language
We did not impose restrictions by language (i.e., publications in any language were includable). We included only those publications that were published in full. That is, we excluded publications available as abstract only (e.g., conference abstract) with no additional results information available (e.g., from a clinical trial registry record).
Search strategies to identify studies
We searched the following databases, from inception to 24 July 2023: Medline (via PubMed), Embase (via Elsevier.com) and CENTRAL via the Cochrane Library (which includes the clinicaltrials.gov and the World Health Organisation's International Clinical Trial Registry Platform, ICTRP). Full search strings are provided in Appendix 1. On 19 September 2023, we performed a backwards and forwards citation analysis on all included studies, using SpiderCite (https://sr-accelerator.com/#/spidercite).
Study selection and screening
Pairs of review authors (AMS, TA, MvdM, SS, PG) independently screened the titles and abstracts, and full-texts for inclusion. Any disagreements were resolved by discussion, or reference to another author. The selection process was recorded in sufficient detail to complete a PRISMA flow diagram, as well as a list of excluded (full-text) studies with reasons for exclusions (Appendix 2 and 3).
Data extraction
We used a data extraction form to extract data from each included study. The form was piloted on two studies. Pairs of review authors (AMS, PG, TA) independently extracted the data, and where discrepancies were identified, they were resolved by discussion or by reference to another author. Data were extracted on each study's:
Study characteristics and methods, including participants, interventions and comparators Primary and secondary outcomes prespecified in the ‘outcomes’ section, above Data to inform the risk of bias ratings
Assessment of risk of bias in included studies
Two review authors (AMS, TA) independently assessed the risk of bias for each included study using the RoB 2 tool, as outlined on the Cochrane Handbook. 22 (This is a deviation from the protocol, which pre-specified Cochrane Risk of Bias Tool 1). Cochrane Risk of Bias 2 was used for parallel arm randomised trials, and Cochrane Risk of Bias Tool 2 for cluster-randomised trials was used for cluster trials. Each potential source of bias was graded as low, high or some concerns, with judgements supported by a quote from the relevant trial.
Measurement of effect and data synthesis
RevMan 5 was used to calculate the treatment effect. We used risk ratios or rate ratios for dichotomous outcomes – risk ratios for results reporting the number of individuals with an event, and rate ratios for the results reporting the number of events only. For continuous outcomes, we used mean difference or standardised mean difference as appropriate.
We undertook meta-analyses when ≥2 studies or comparisons reported the same outcome; anticipating considerable heterogeneity, we used a random effects model. We used the I2 statistic to measure heterogeneity among the included trials.
The individual was used as the unit of analysis, where possible. However, where data on the number of individuals with primary and secondary outcomes of interest was not available, we extracted the information as it was presented.
We did not contact investigators or study sponsors to provide missing data.
We planned to assess publication bias using a funnel plot but as there were fewer than 10 trials included in any meta-analysis this was not possible.
Subgroup and sensitivity analyses
We had intended to conduct subgroup analyses by condition and by timepoint at which the event was measured. Data were not sufficient to conduct subgroup analyses by condition, but we were able to conduct subgroup analyses by timepoint for the hospitalisation outcome. We had intended to conduct a sensitivity analysis by including versus excluding studies at high risk of bias (three or more domains rated at high risk of bias), but none of the included studies had three or more domains rated at high risk of bias.
Results comparison 1: telehealth (phone or video) vs. Face-to-Face care
Results of the search
The searches yielded in total 1925 references; 658 duplicates were removed and 1267 references were screened in title and abstract. We excluded 1217 references, and screened 50 references in full-text. We included 10 studies comparing telehealth (by phone or video) to face-to-face provision of care (Figure 1).
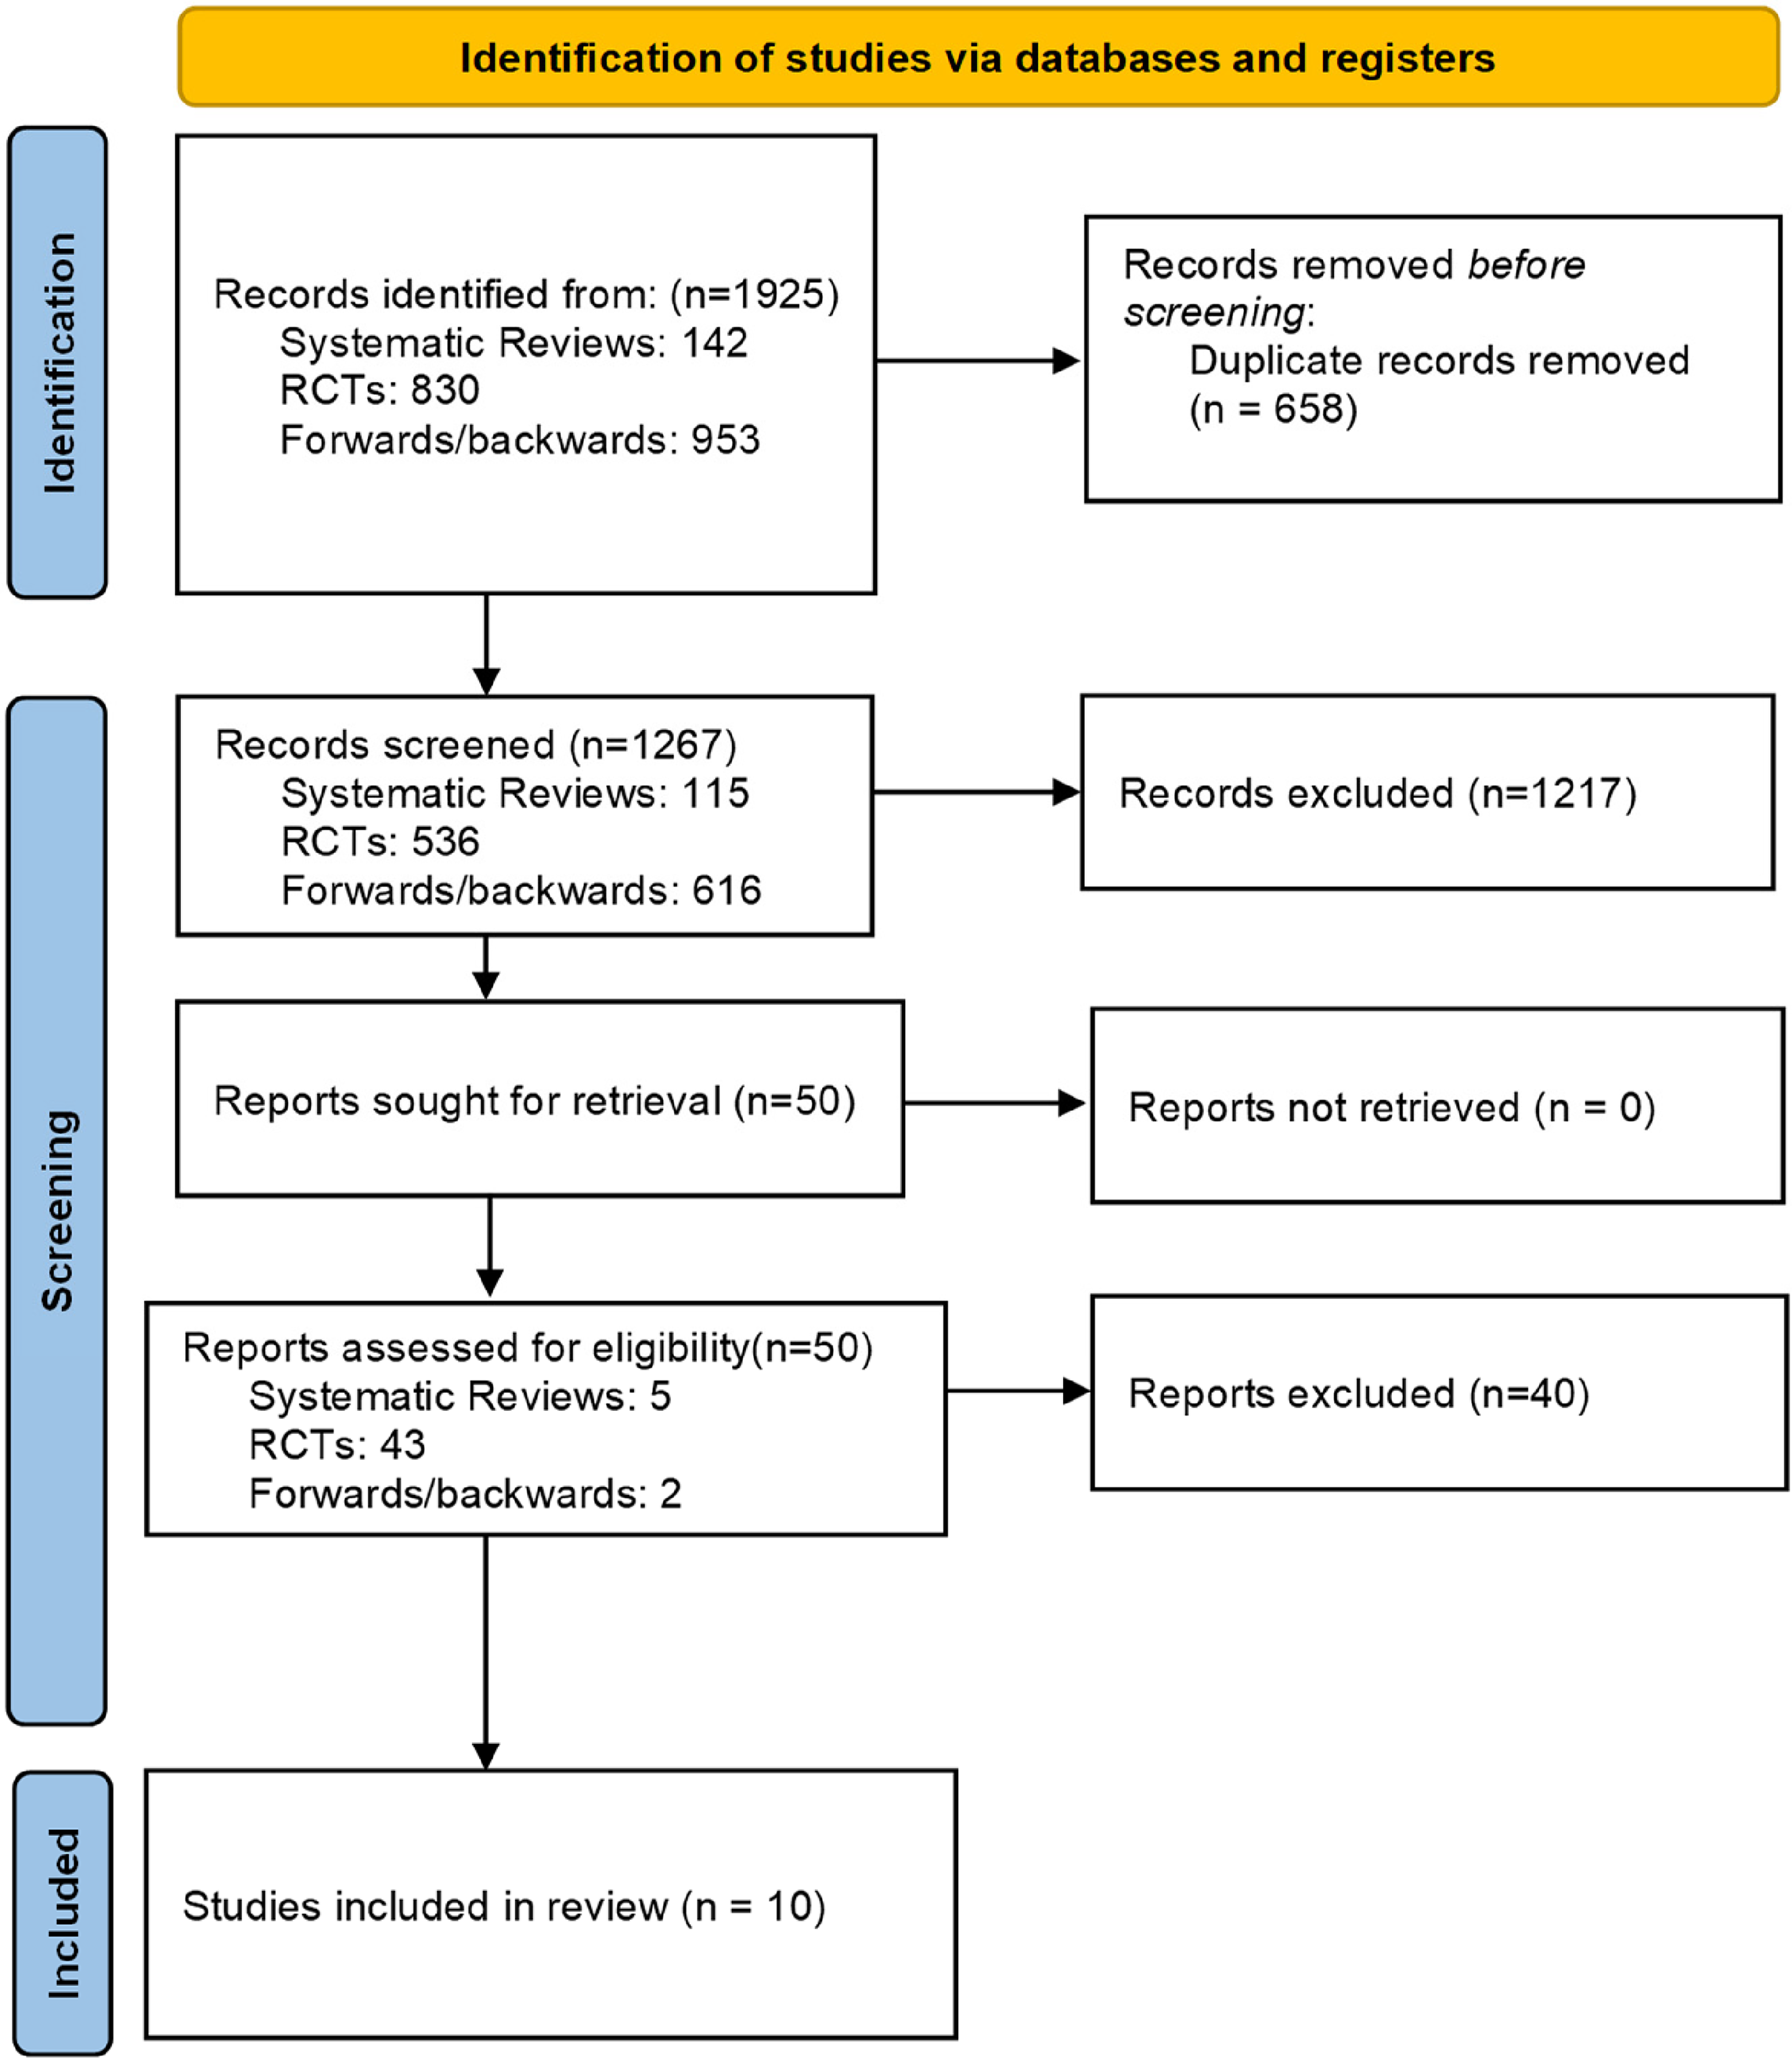
PRISMA flow diagram.
Characteristics of the included studies
All trials were conducted in high-income countries, including the UK (three trials), USA (two trials), Denmark (two trials) and Norway, France and Greece (one trial each). Two trials were cluster and eight were parallel arm trials (six 2-arm trials and two 3-arm trials). Follow-up duration was most commonly for 12 months (five trials), with the remainder lasting up to 90 days (five trials). Participant populations varied, including general practice patients (three trials), nursing home residents (one trial) and patients discharged from the hospital or outpatient care (six trials). The individually randomised trials ranged in size from 103 to 388 participants; the two cluster randomised trial ranged in size from 428 to 20,990 participants in aggregate. Telehealth care was provided either by phone (five trials) or by video (four trials); one trial enabled participants to access care via telephone or video conferencing. Comparators were face-to-face consultations with the healthcare providers (Table 1).
Characteristics of included studies (comparison 1: telehealth vs face-to-face care).
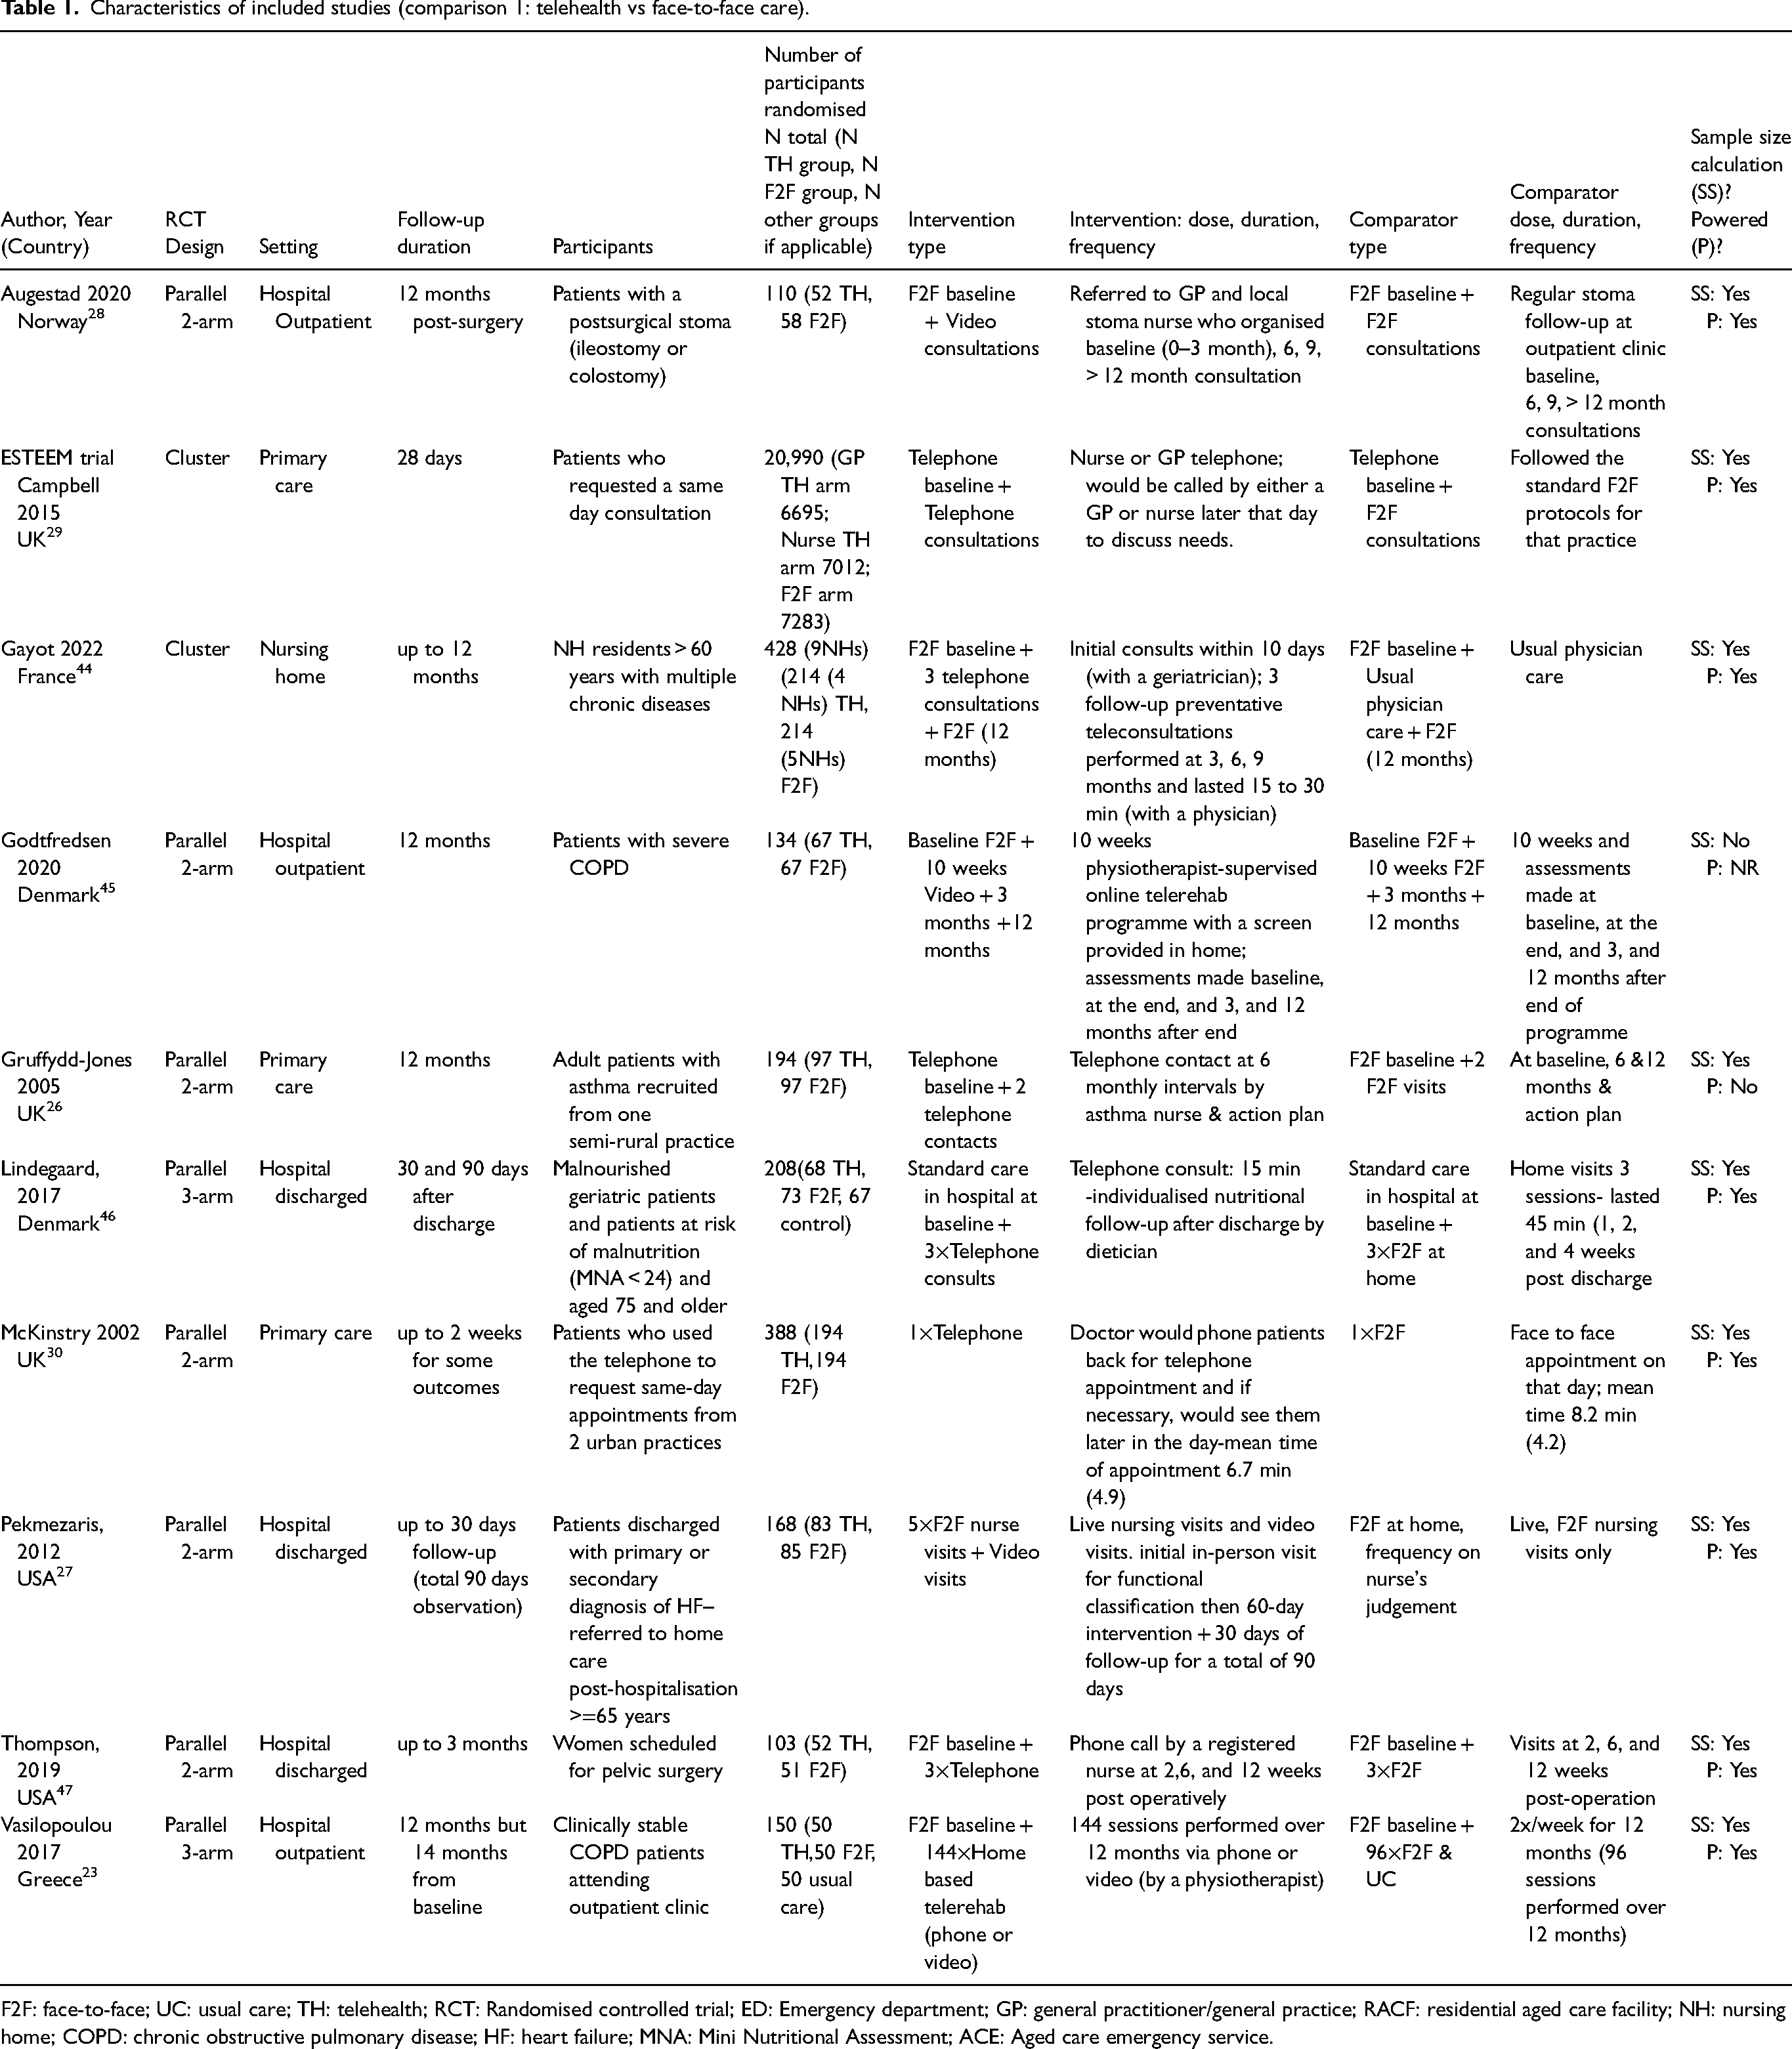
F2F: face-to-face; UC: usual care; TH: telehealth; RCT: Randomised controlled trial; ED: Emergency department; GP: general practitioner/general practice; RACF: residential aged care facility; NH: nursing home; COPD: chronic obstructive pulmonary disease; HF: heart failure; MNA: Mini Nutritional Assessment; ACE: Aged care emergency service.
Assessment of risk of bias
Risk of bias for parallel arm trials (n = 8)
For parallel arm trials, the risk of bias was generally low or some concerns. Bias due to missing outcome data, bias in measurement of the outcome and bias in the selection of the reported result were low for all studies. Bias due to the randomisation process was low in six of the eight trials (two were rated some concerns). One trial was rated at high risk of bias due to deviations from the intended intervention; remaining trials were rated low risk of bias. Overall, risk of bias was rated as low for five trials, some concerns for two trials, and high for one trial (Figure 2).
Risk of bias (parallel arm randomised trials).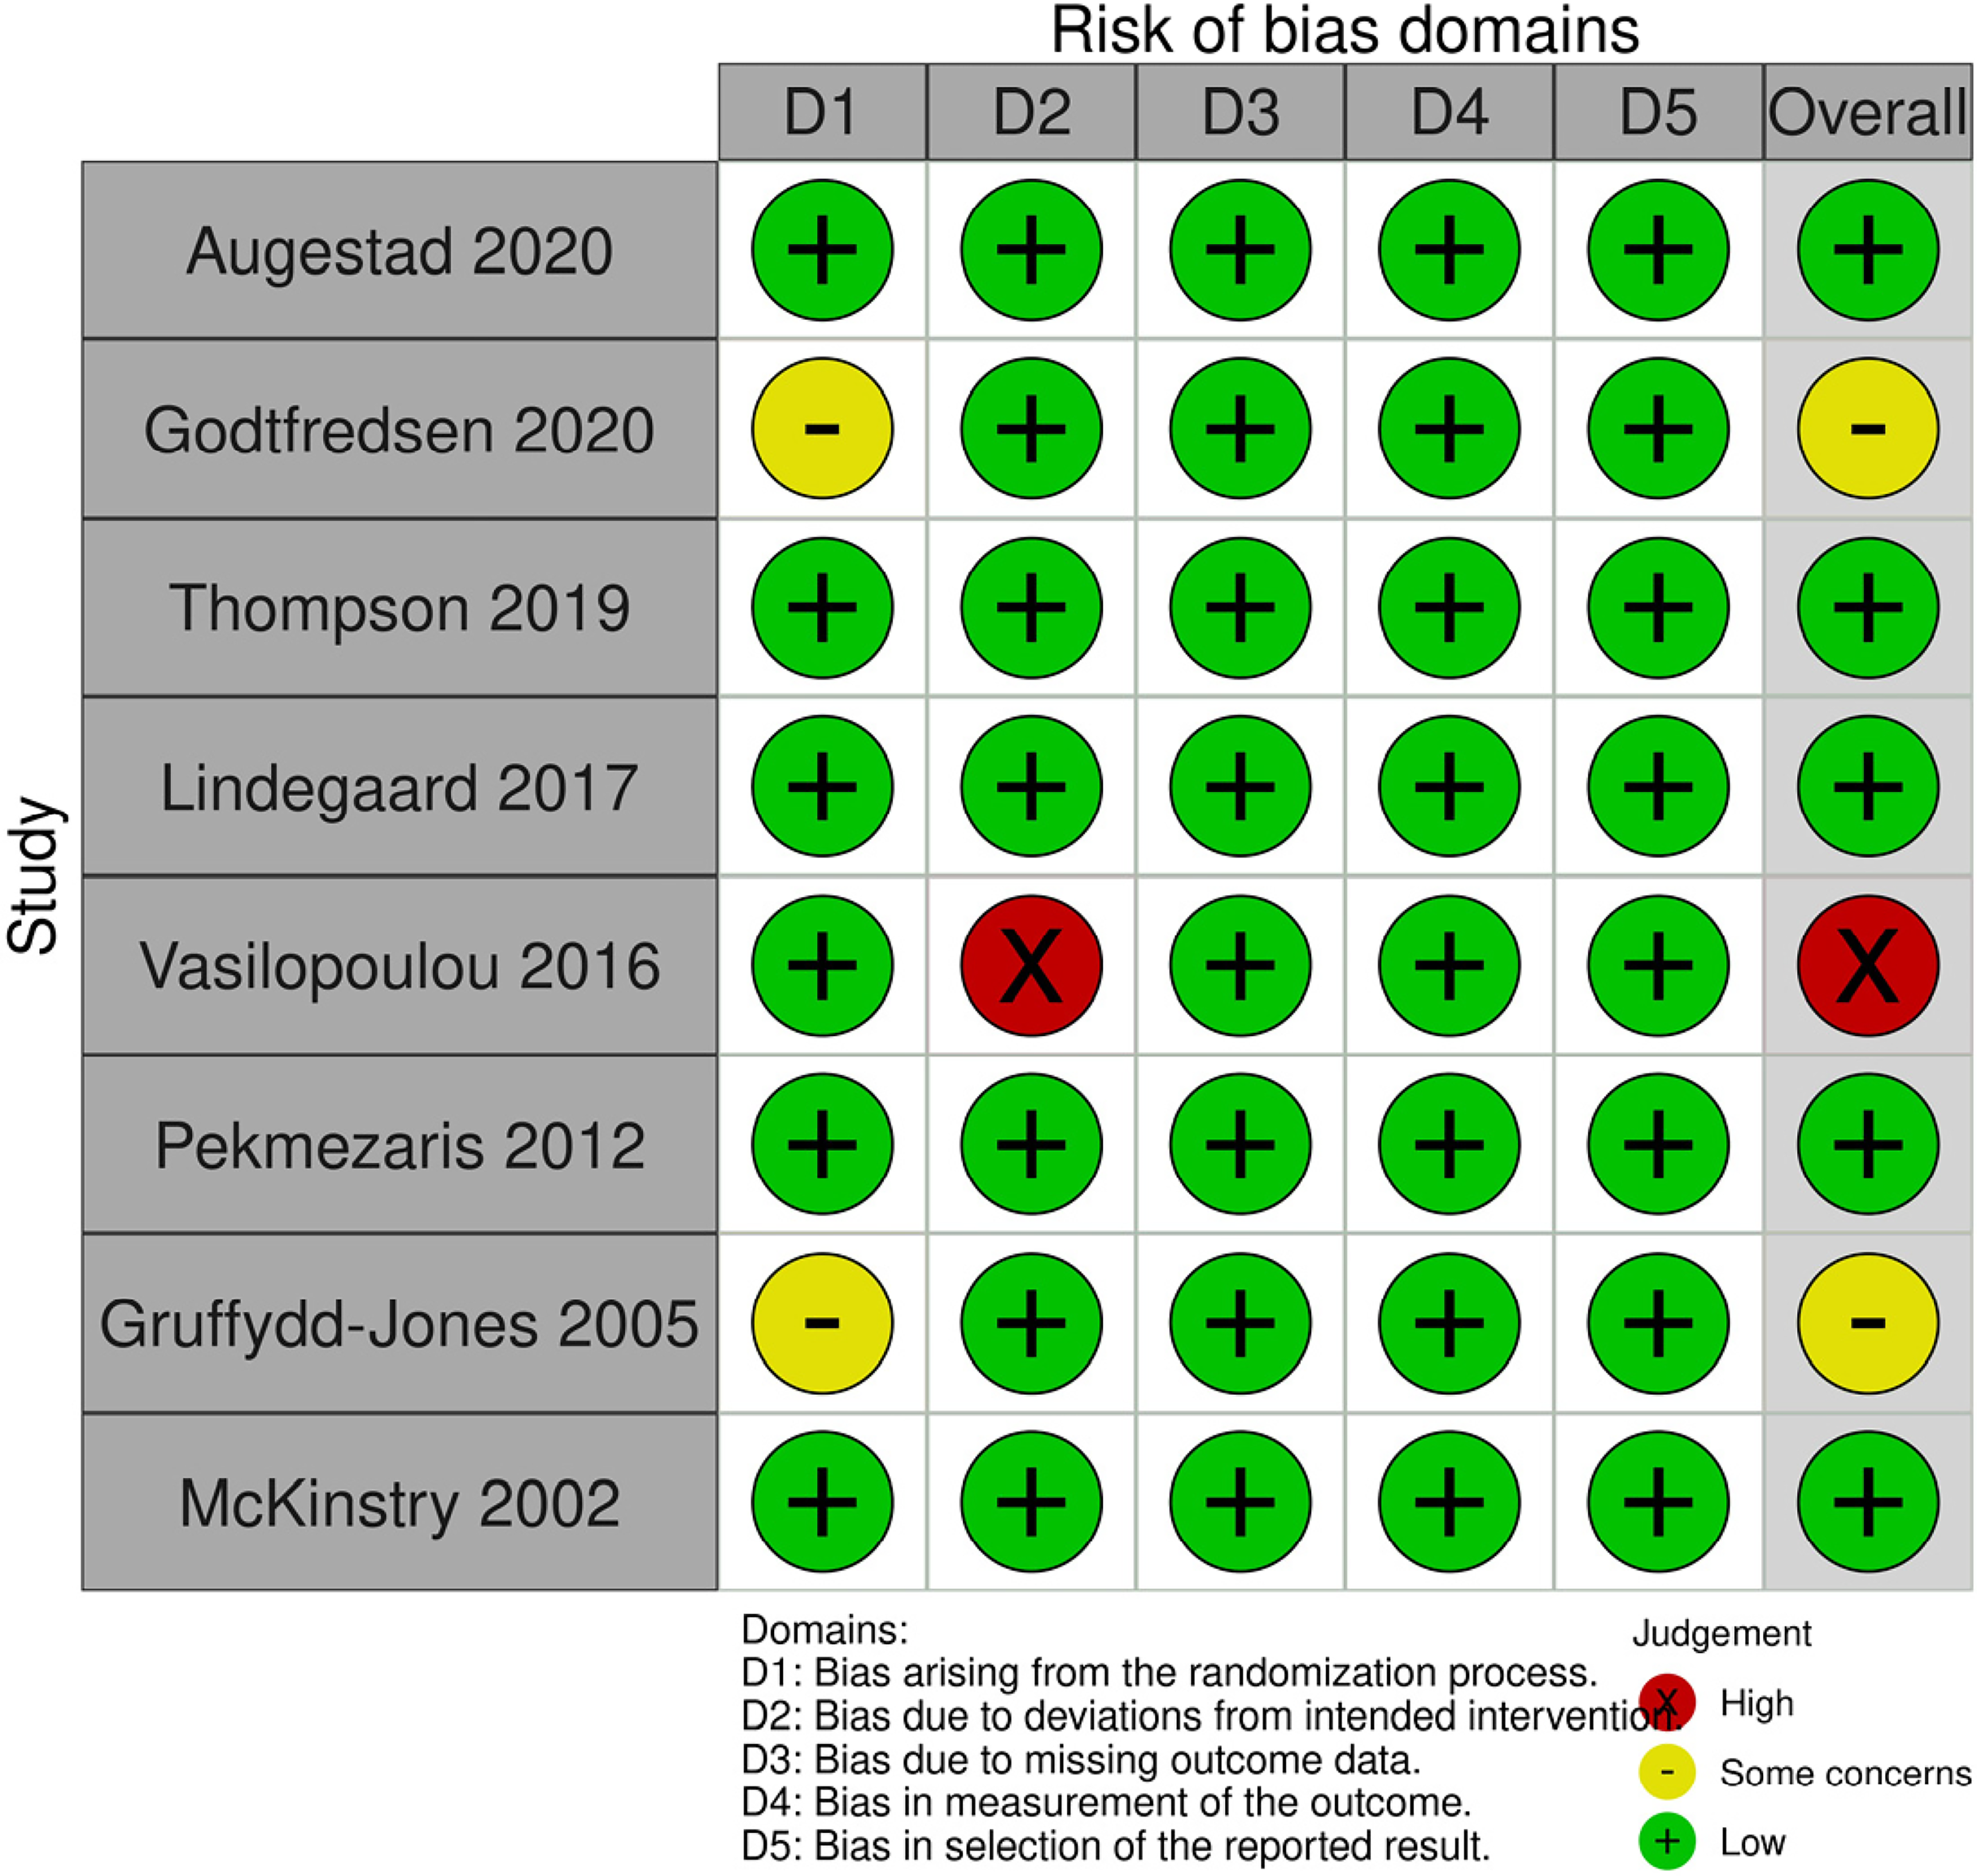
Risk of bias for cluster randomised trials (n = 2)
Both trials were rated at low risk of bias for timing of the identification and recruitment of individual participants, deviations from the intended intervention, missing outcome data, measurement of the outcome and selection of the reported result. One trial was rated at low risk of bias, and one was rated unclear risk of bias in the randomisation process. Overall, the risk of bias was low for one trial and some concerns for one trial (Figure 3).
Risk of bias (cluster randomised studies).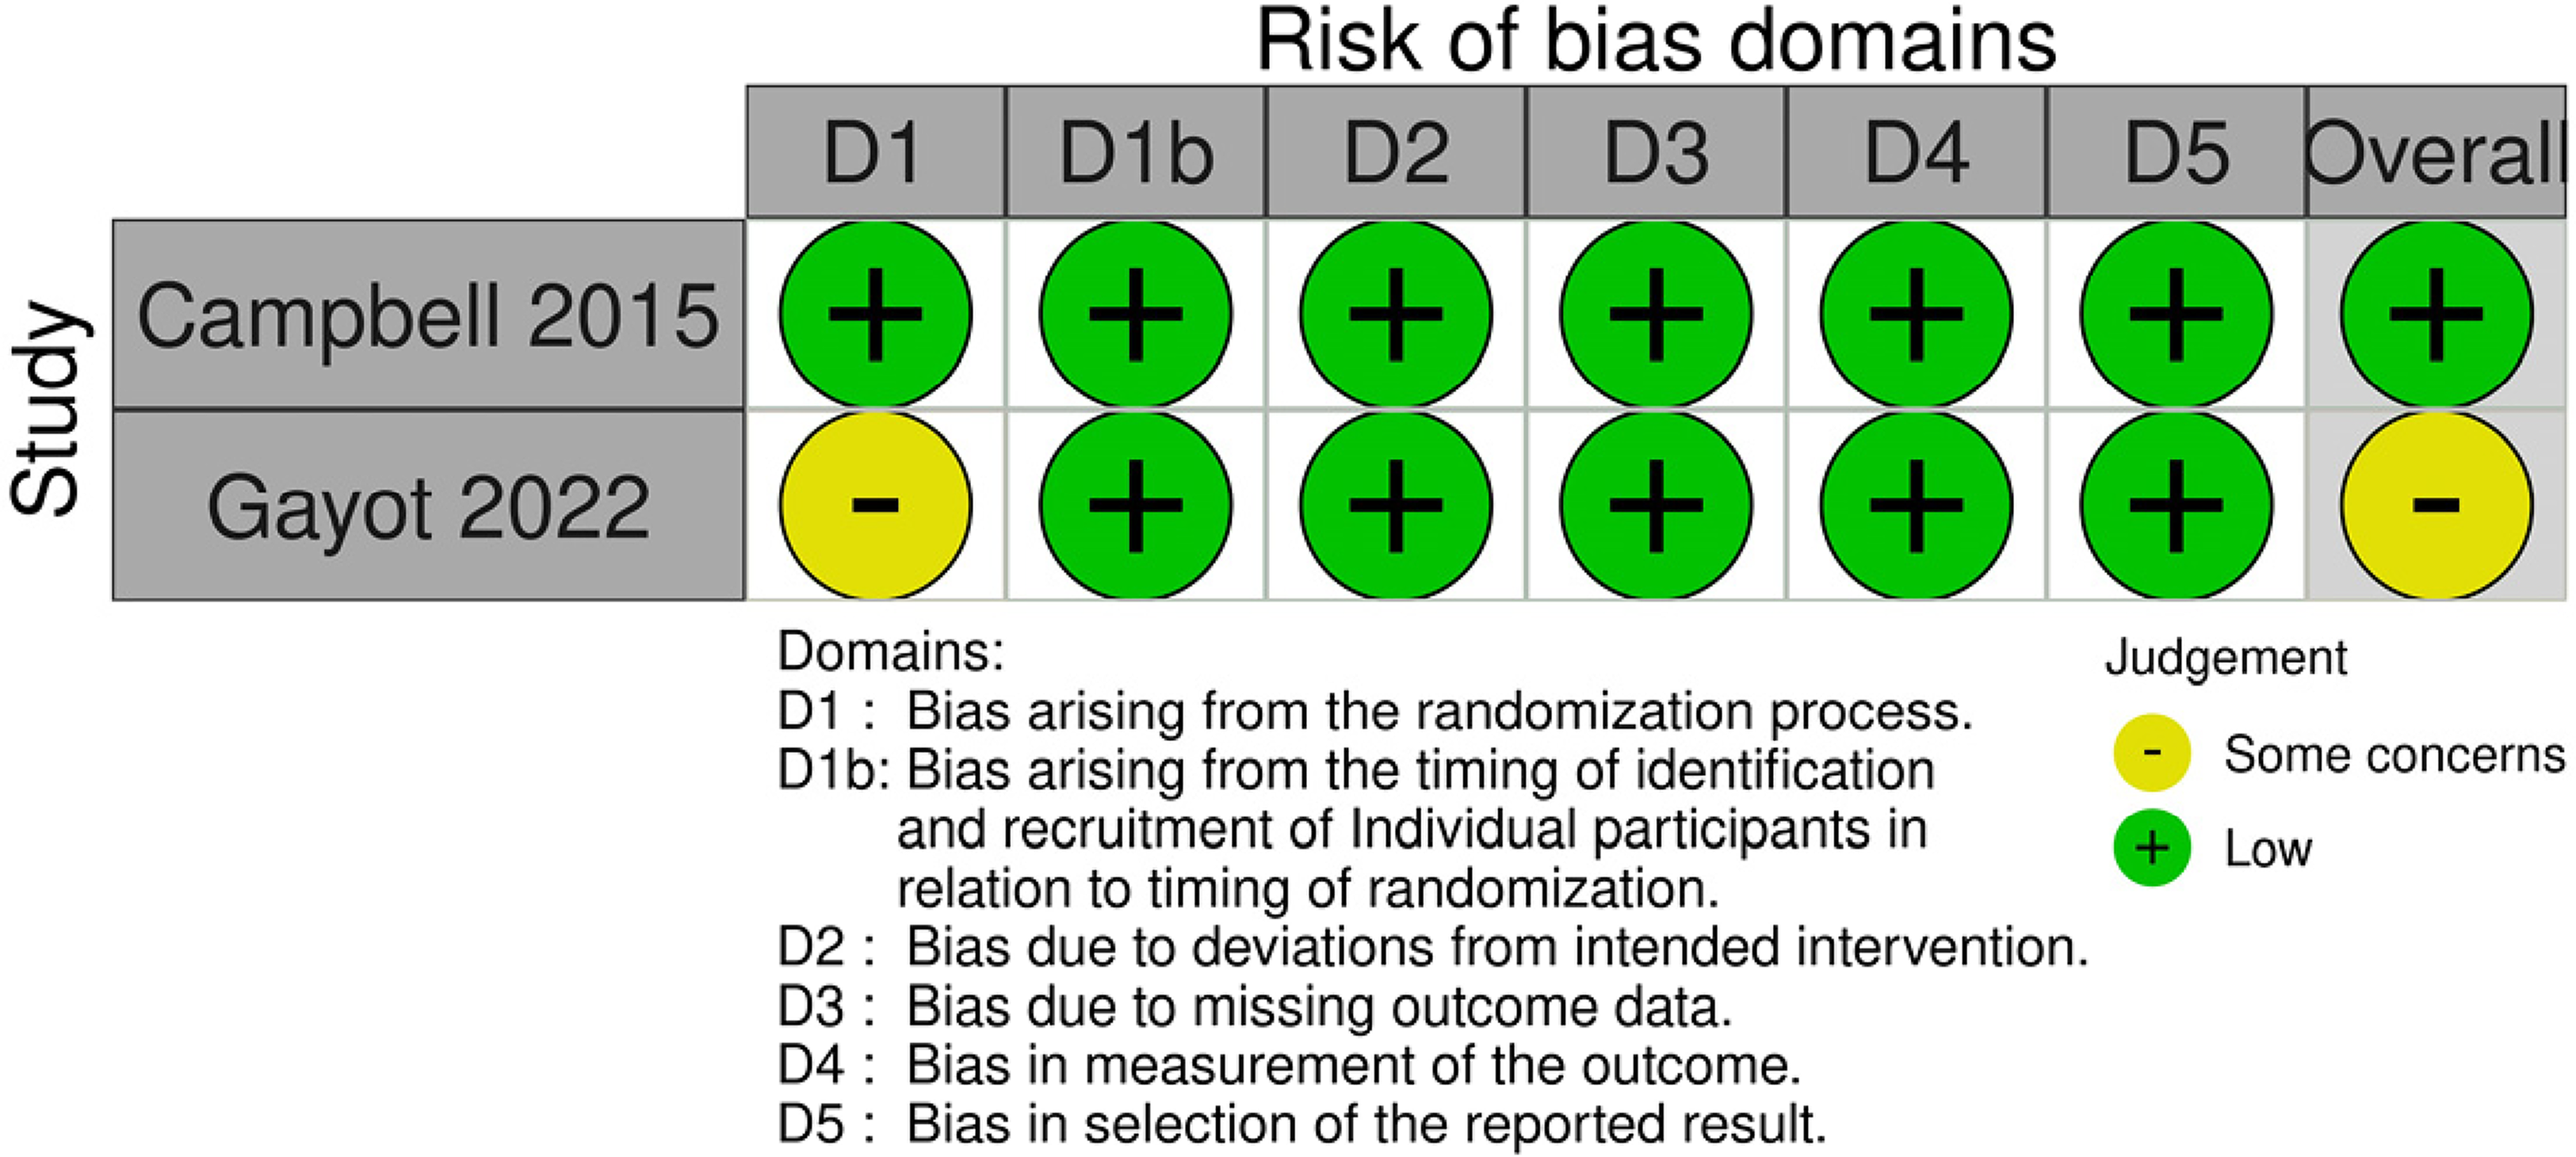
Primary outcome: visits to the emergency department
Four trials reported on the visits to the emergency department; three were meta-analysable. There was no difference between the telehealth and face-to-face groups for visits to the emergency department (three trials, n = 11,539, RR 1.07, 95% CI 0.89 to 1.29, p = 0.49). Heterogeneity was very low between the studies (I2 = 0%) (Figure 4).
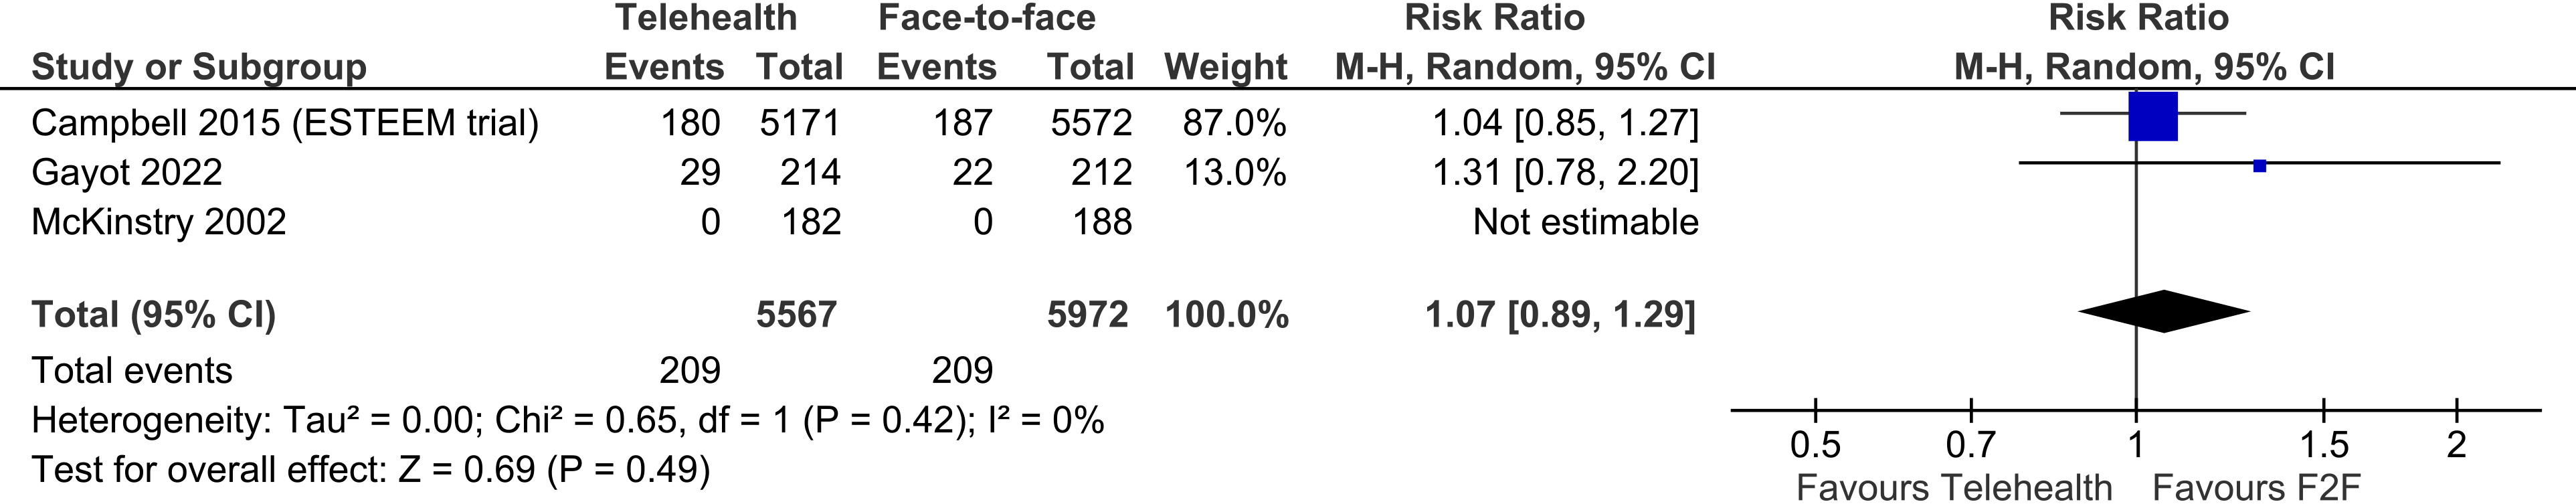
Telehealth vs face-to-face – visits to the emergency department.
One trial, conducted with clinically stable COPD patients, either attending hospital outpatient clinic (face-to-face) or receiving rehabilitation over video was not meta-analysable. 23 The video (telerehabilitation) group had a significantly lower rate of visits to the ED in the 12 months of follow-up than the face-to-face group (TH mean 0.5 +/- 0.9 vs F2F mean 1.8 +/- 1.5; p < 0.001).
Primary outcome: hospital admissions
Hospitalisations were reported by eight trials; seven were meta-analysable, and could be subgrouped by timepoint up to which hospitalisations were measured. In trials measuring hospitalisations up to one month post-intervention, there was no difference between telehealth and face-to-face groups (three trials, n = 11,052, RR 1.17, 95% CI 0.89 to 1.54, p = 0.26, I2 = 0%). Three trials measured hospitalisations up to three months, showing no difference between telehealth and face-to-face groups (three trials, n = 409, RR 1.14, 95% CI 0.87 to 1.50, p = 0.33, I2 = 0%). Finally, there was also no difference in hospitalisations between groups up to 12 months (three trials, n = 206, RR 0.89, 95% CI 0.56 to 1.41, p = 0.61), however, heterogeneity between the trials was high (I2 = 69%). (Removing the Gayot study decreases the heterogeneity to 0%, and the difference between groups remains non-significant: RR 1.14, 95% CI 0.88 to 1.48, p = 0.33, I2 = 0% – data not shown) (Figure 5).
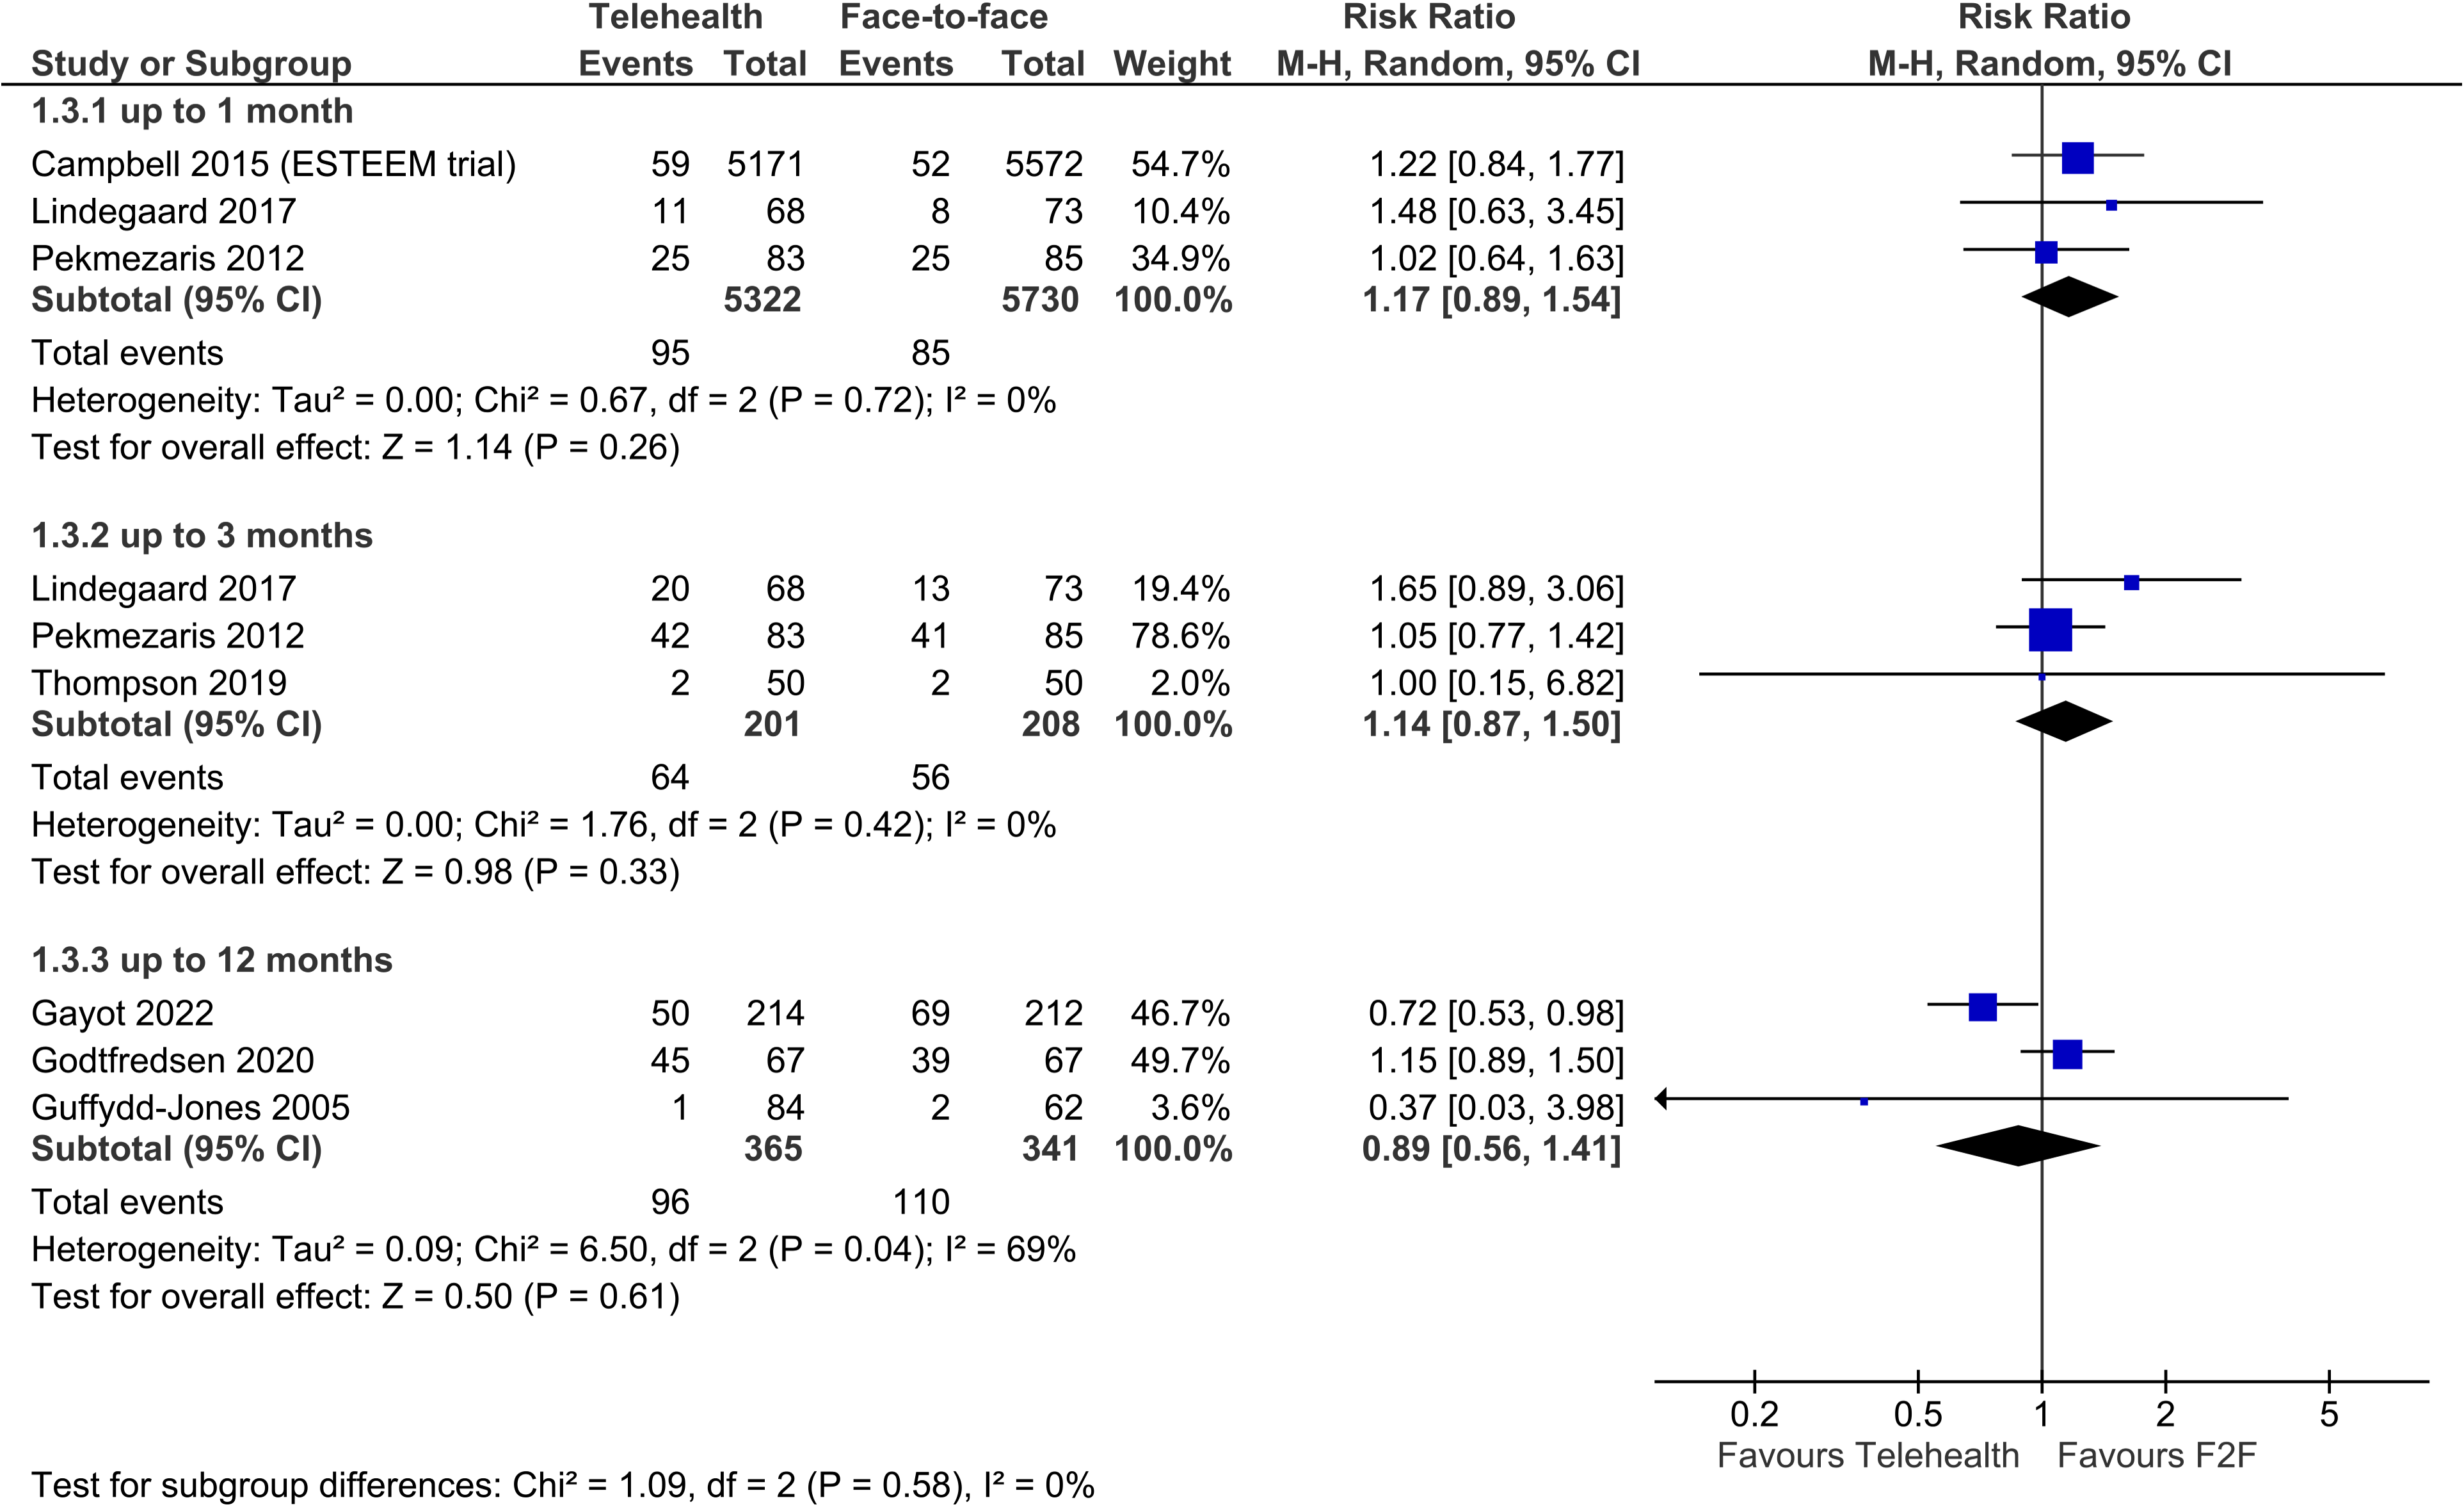
Telehealth vs face-to-face – hospitalisations.
One non-meta-analysable trial, conducted with clinically stable COPD patients, found that the video and face-to-face rehabilitation groups had very similar rates of hospitalisations for acute exacerbations of COPD: telehealth group (mean 0.3 +/- 0.7) and face-to-face group (mean 0.3 +/- 0.6). 23
Secondary outcome: safety (including adverse events, mortality)
Deaths
Four trials reported on deaths, showing no difference between telehealth and face-to-face groups in this outcome (four trials, n = 11,444, RR 0.99, 95% CI 0.61 to 1.61, p = 0.96, I2 = 14%) (Figure 6).
Telehealth vs face-to-face – deaths.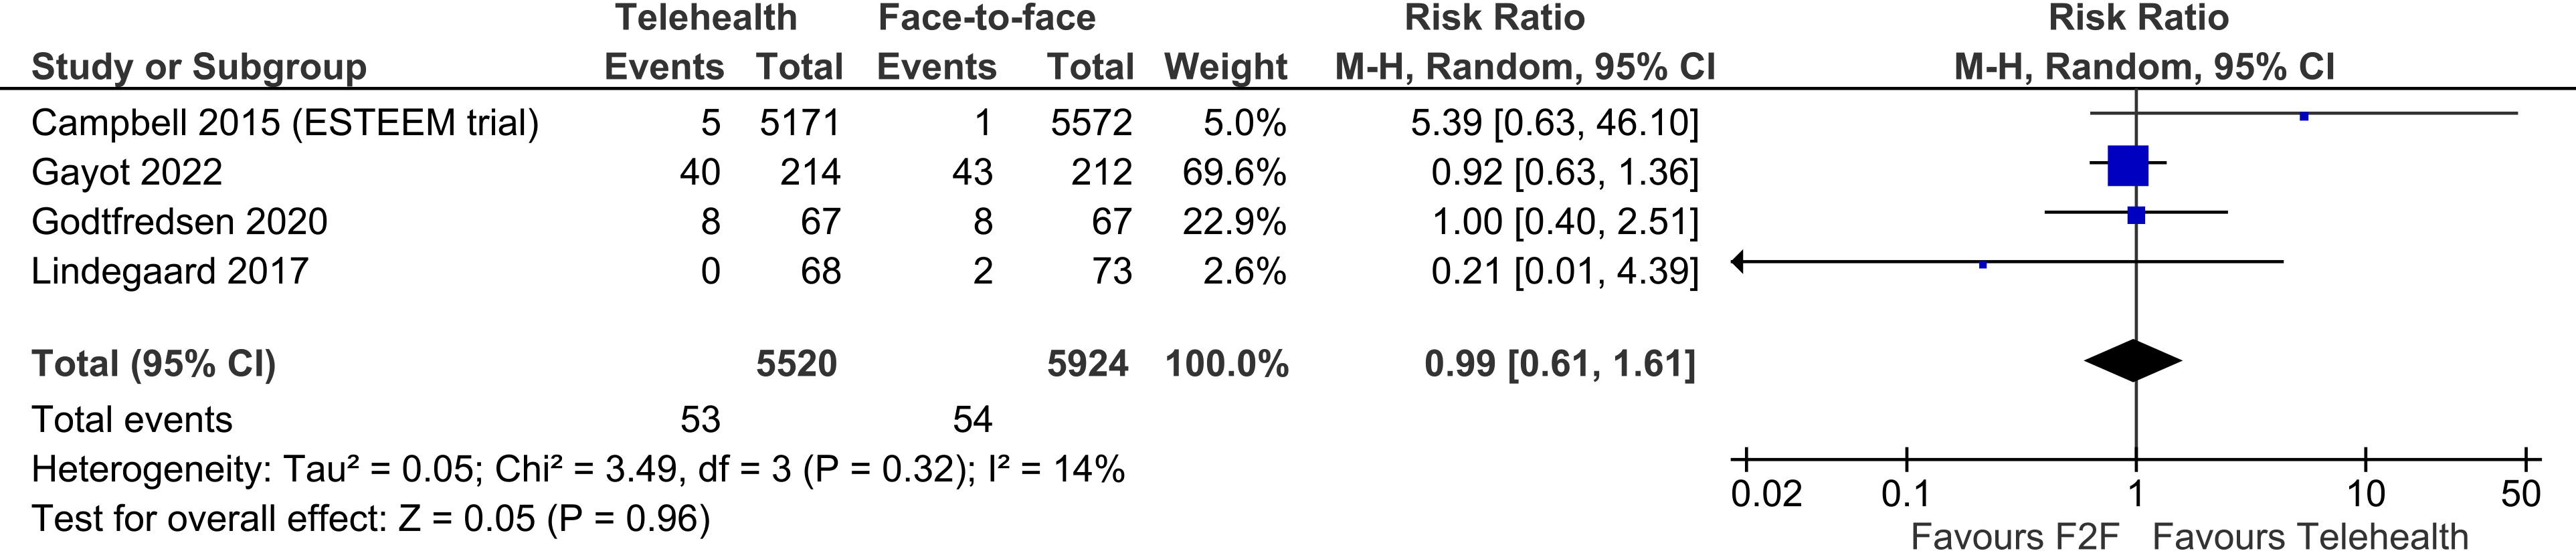
Adverse events (other than death)
Three trials reported on adverse events other than deaths, showing no difference between telehealth and face-to-face groups (three trials, n = 351, RR 0.73, 95% CI 0.40 to 1.31, p = 0.29, I2 = 0%). (Figure 7)
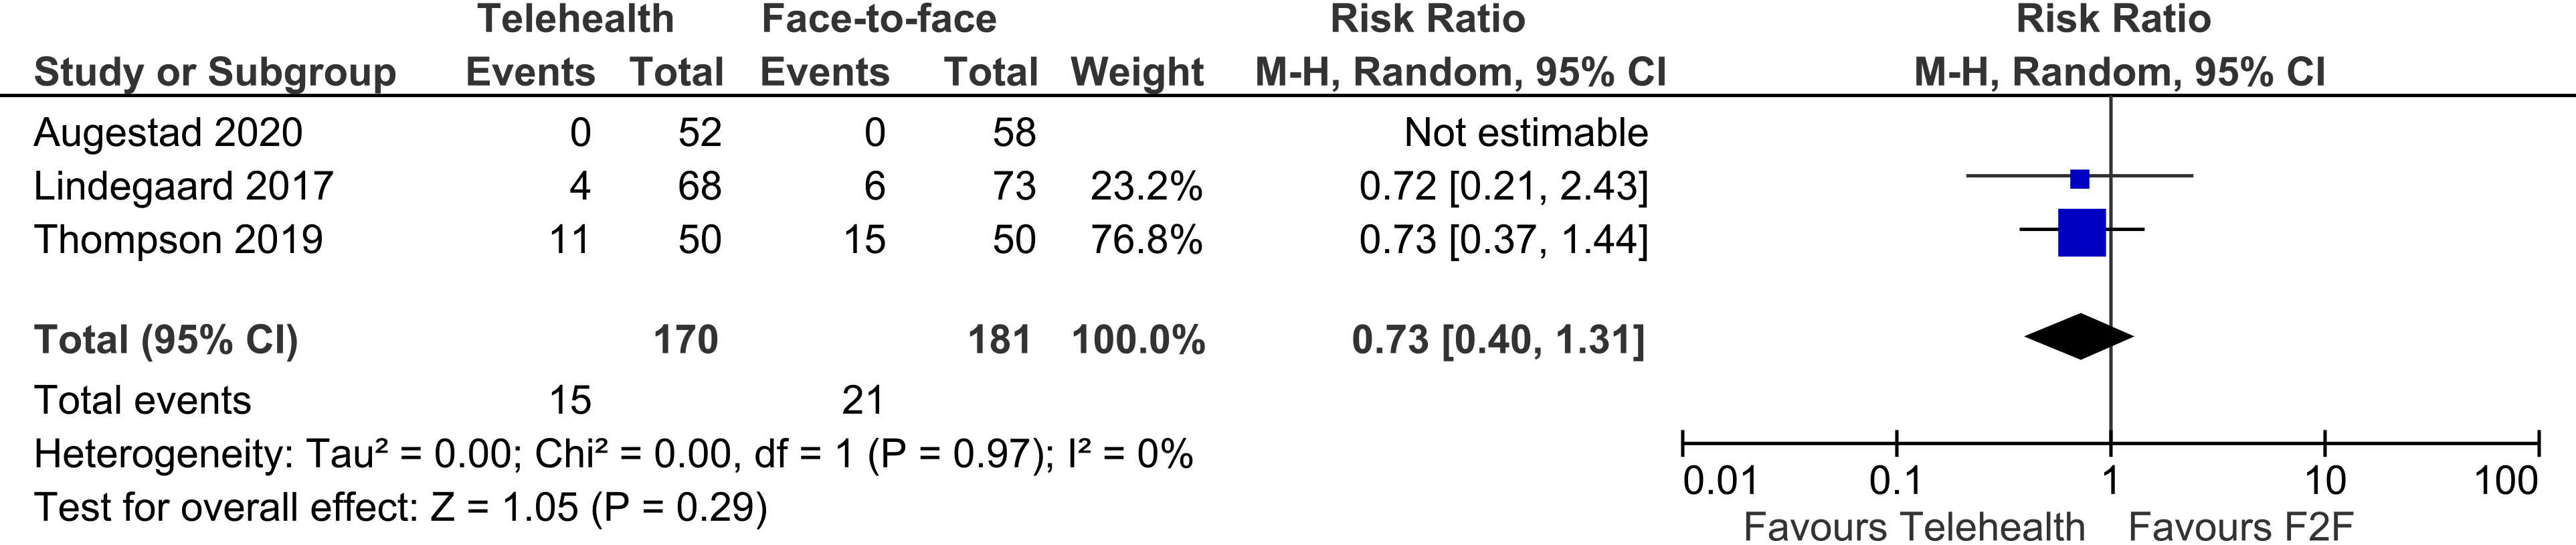
Telehealth vs face-to-face – adverse events (other than death).
Secondary outcome: costs
Four trials reported on costs but were not meta-analysable, and are therefore summarised narratively.
Campbell 2014 (the ESTEEM trial) 24 found very similar costs for telehealth and face-to-face follow-up of primary care patients in the UK. The estimated 28 day follow-up mean costs per patients was 75.41 GBP for face-to-face and 75.21 GBP for the telehealth follow-up.
Gayot (2022) 25 was based in France, with nursing home residents with multiple chronic diseases. The cost differences were not significant from the perspective of health insurance (telehealth mean and SD: $1900 +/- $3040, face-to-face: $2250 +/- $3450, p = 0.274); or from the perspective of the care provider (telehealth mean and SD: $2290 +/- $4600, face-to-face $2470 +/- $4120, p = 0.662).
Gruffydd-Jones (2005) 26 reported on mean National Health Service (NHS) costs of care for patients with asthma in the primary setting in the UK. The difference between telehealth group (mean NHS cost 210 GBP/patient/year) and face-to-face group (mean NHS cost 334 GBP/patient/year) was not significant (p = 0.071).
Pekmezaris (2012) 27 examined the Medicare costs of heart failure patients receiving care via video versus face-to-face, in the US setting. At 30 days, the average cost to Medicare for the telehealth patients was $4686 (SD $11,447) and face-to-face patients $4149 (SD $12,038). At 90 days, the average cost to Medicare for the telehealth patients was $7267 (SD $13,355) and face-to-face patients was $8048 (SD $15,118).
Secondary outcome: patient satisfaction
Four trials reported on the patient satisfaction with care, however, data were not meta-analysable.
Augestad 2020 28 reported that 59% of the face-to-face consultations and 41% of the telehealth consultations were rated as a ‘good overall experience’ by patients.
Campbell 2015 (the ESTEEM trial) 29 reported patient satisfaction scores with care received on the day. Very similar percentages of patients responded that they were very satisfied (66% F2F, 65% telehealth); fairly satisfied (26% F2F, 25% telehealth); neutral (5% F2F, 5% telehealth); fairly dissatisfied (2% F2F, 3% telehealth); and very dissatisfied (1% F2F, 1% telehealth).
Gruffydd-Jones 2005 26 reported that all of the patients in both the face-to-face and telehealth groups ‘were “satisfied” or “very satisfied” with the system of asthma care that they had received over the year.’
McKinstry 2002, 30 measured the patient perception of the consultation using the Patient Enablement Instrument (PEI). Patient perceptions of the consultation were found to be similar in telehealth and face-to-face groups.
Secondary outcome: care provider satisfaction
No trials reported on this outcome.
Results comparison 2: telehealth via video vs. telehealth by telephone
Results of the search
The searches yielded a total of 1812 references – 972 from database searches and 840 from forward and backward citation search. After deduplication, 1475 references were screened in title and abstract, and 1455 were excluded. We screened 20 references in full text; six trials (reported across eight references) were included (Figure 8).
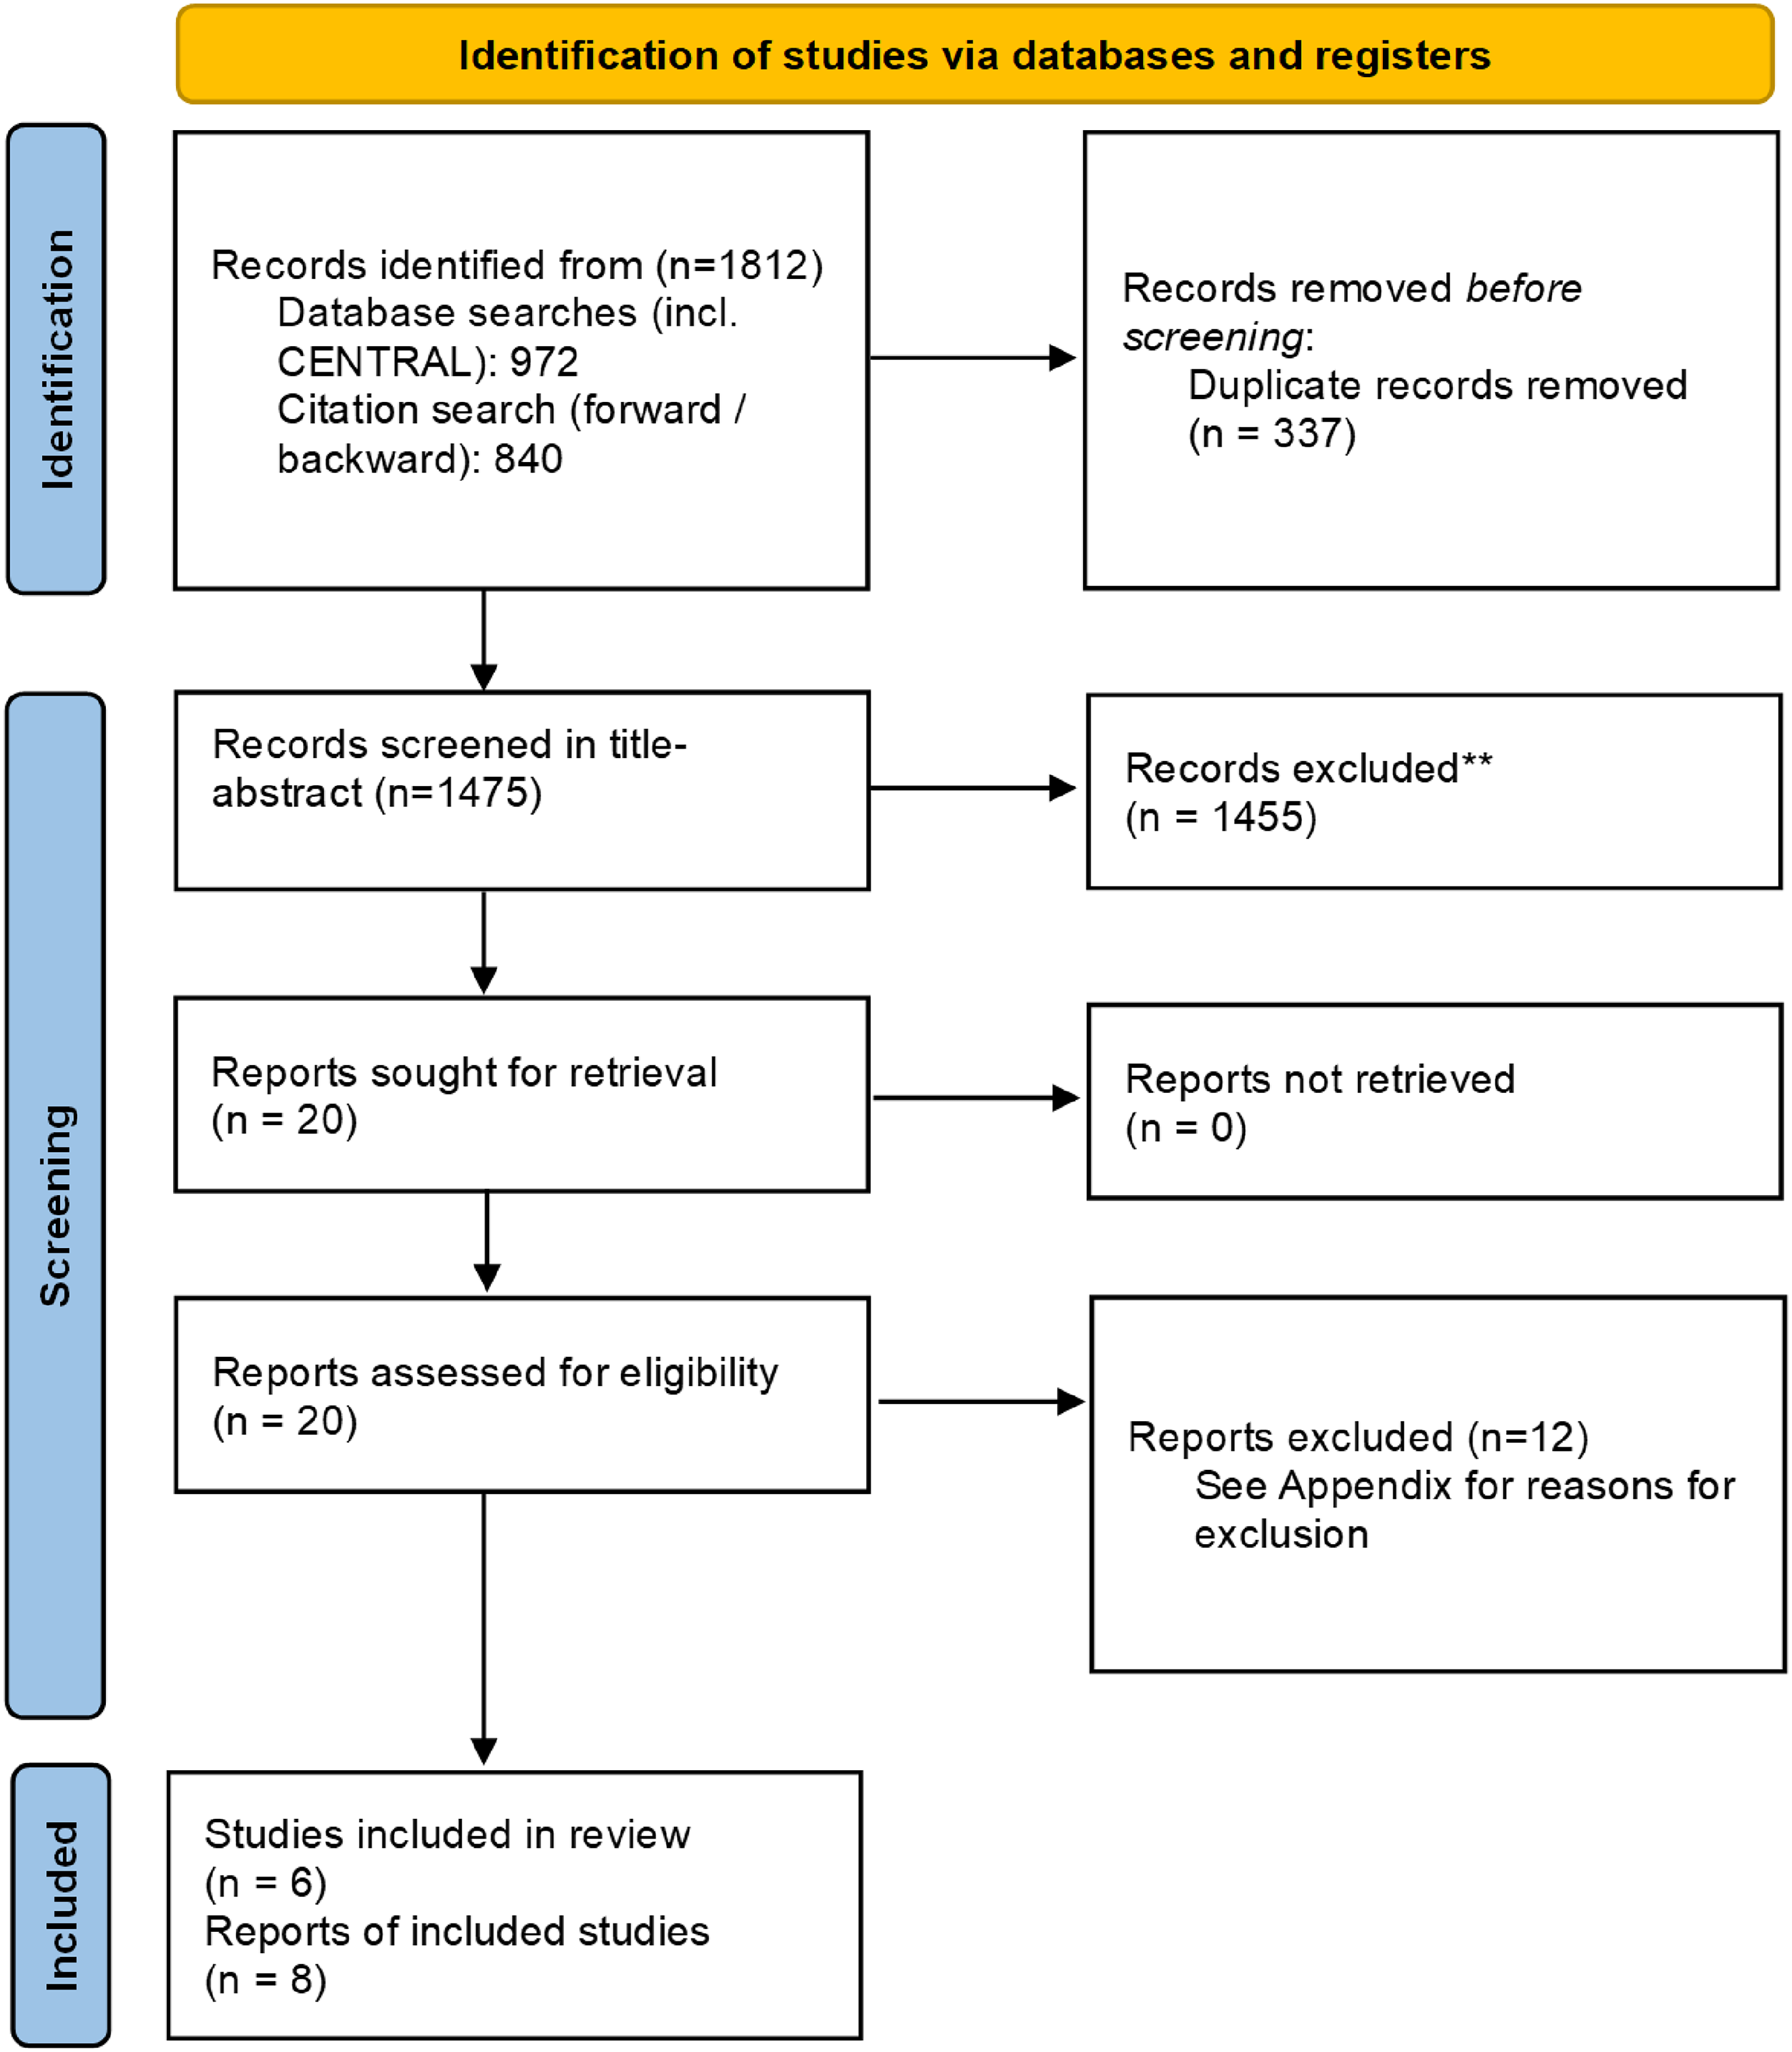
PRISMA flow diagram.
Characteristics of the included studies
Characteristics of included studies (comparison 2: video vs telephone care).
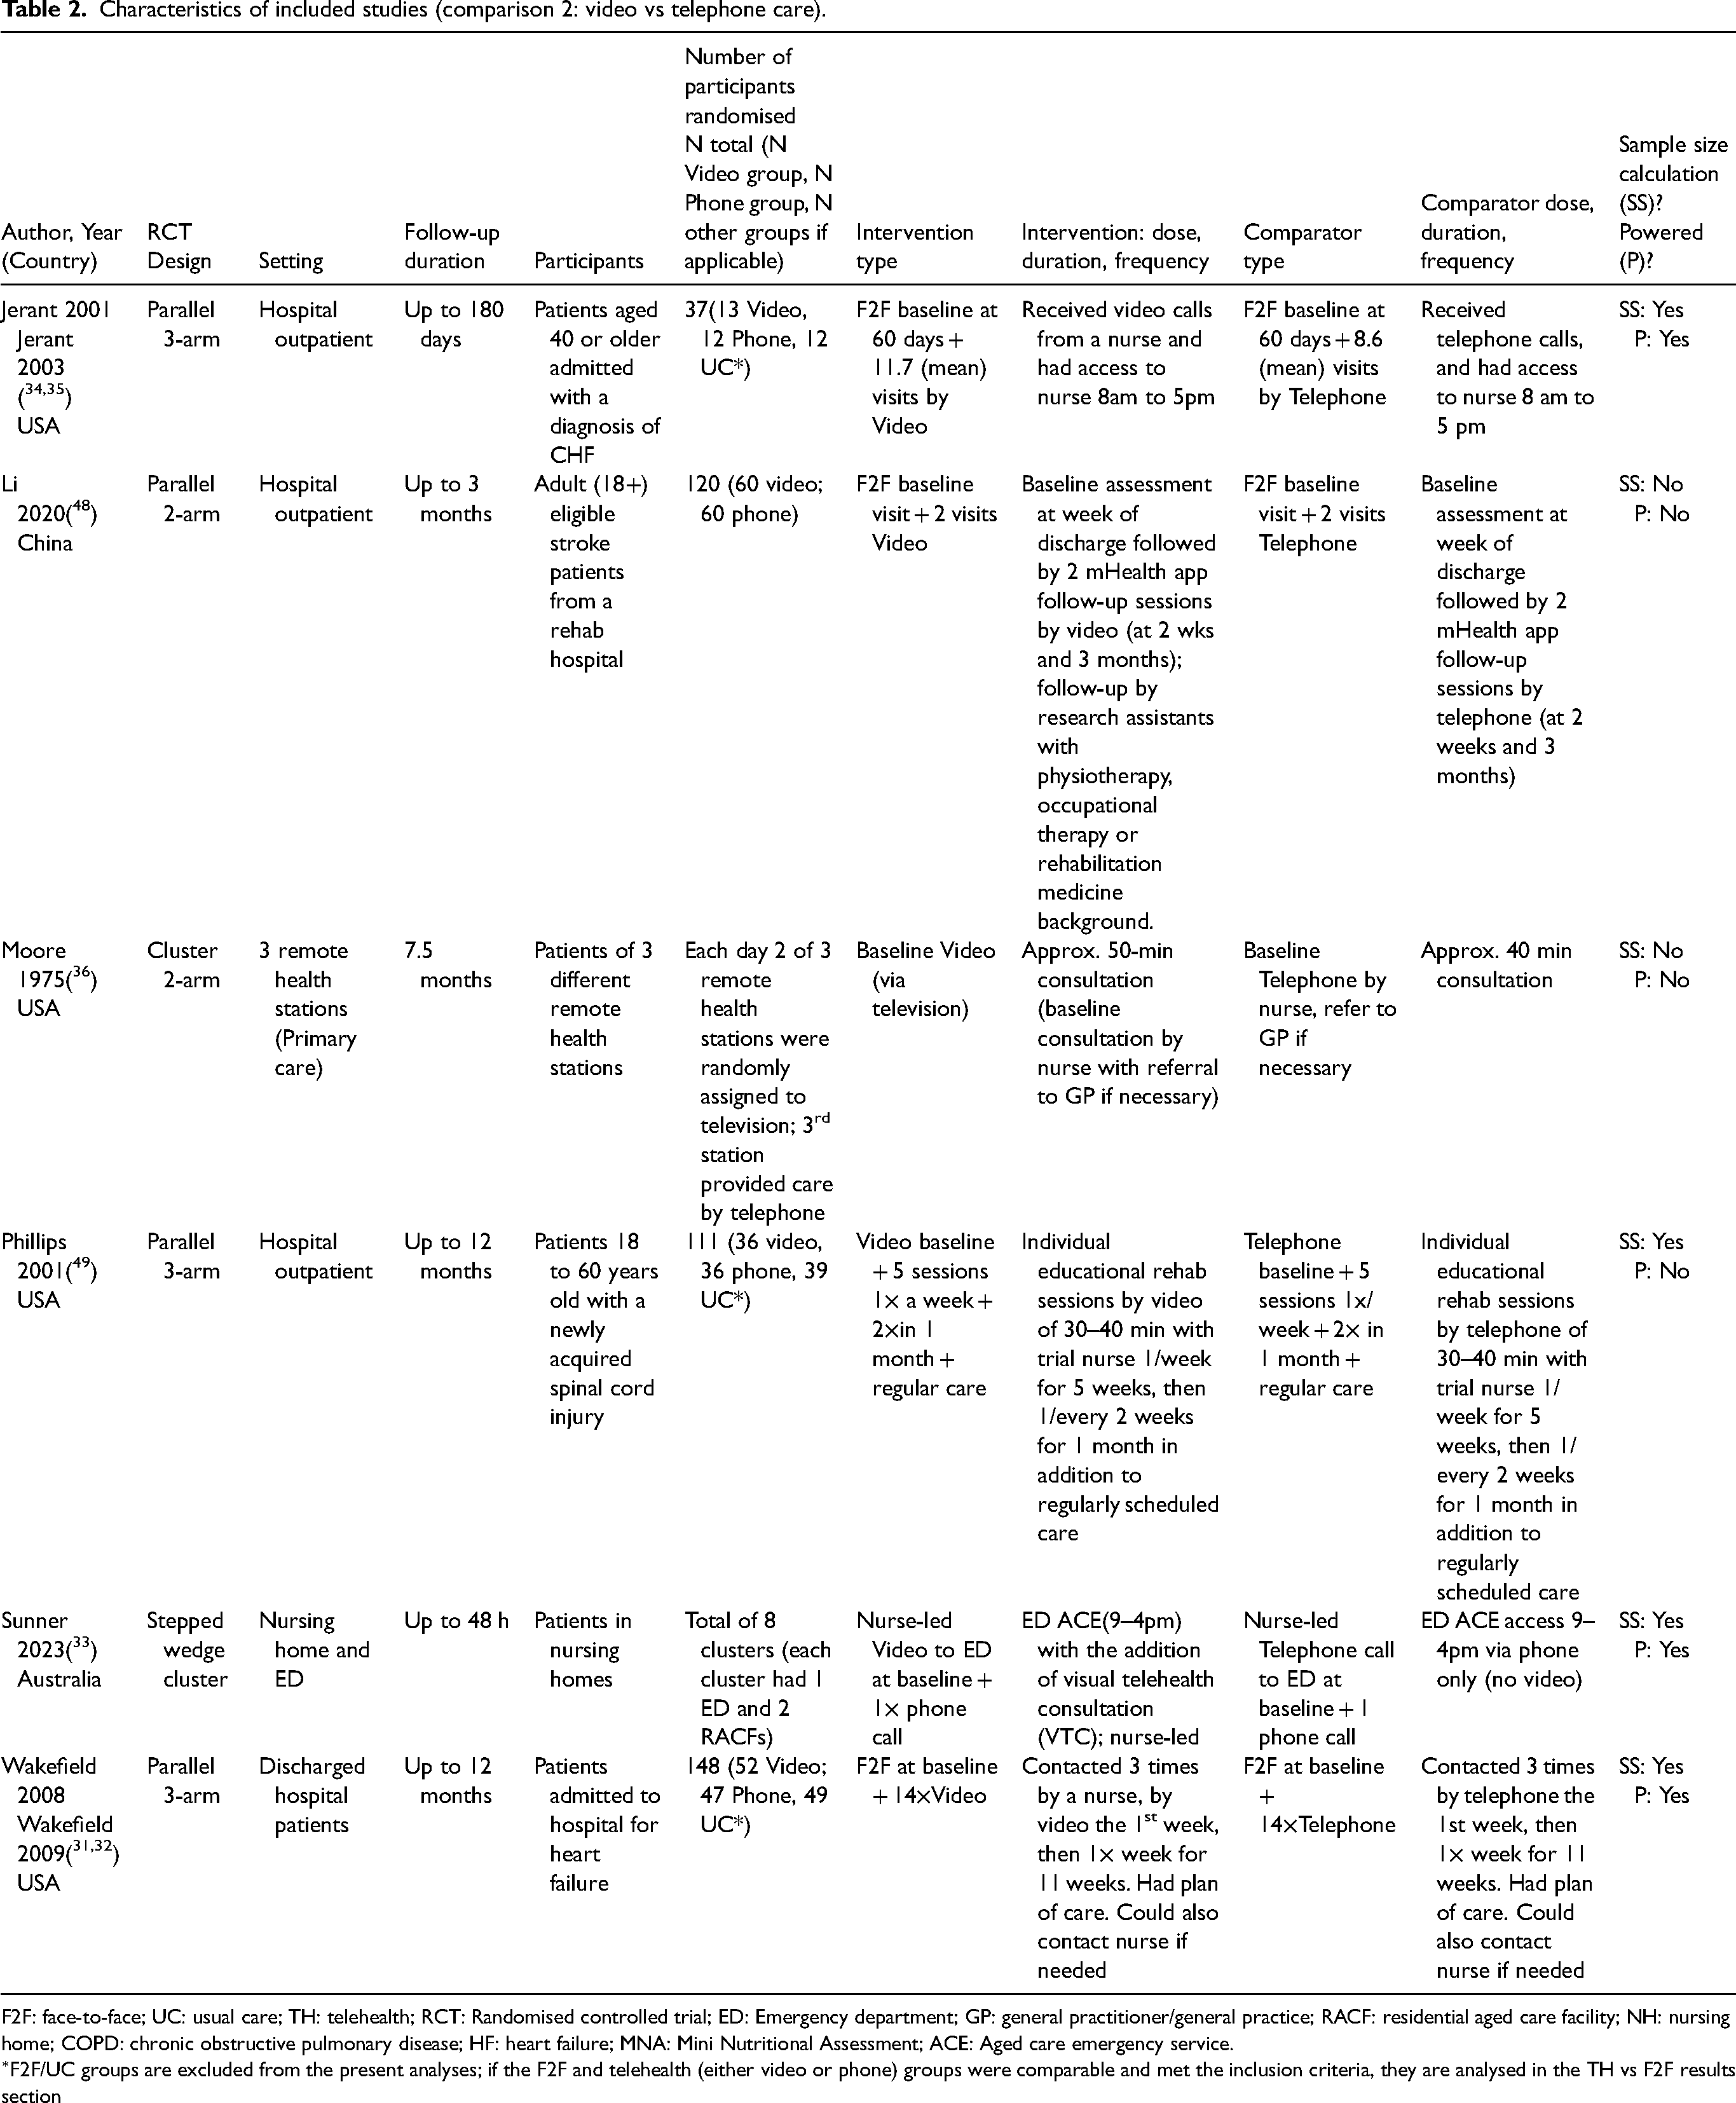
F2F: face-to-face; UC: usual care; TH: telehealth; RCT: Randomised controlled trial; ED: Emergency department; GP: general practitioner/general practice; RACF: residential aged care facility; NH: nursing home; COPD: chronic obstructive pulmonary disease; HF: heart failure; MNA: Mini Nutritional Assessment; ACE: Aged care emergency service.
∗F2F/UC groups are excluded from the present analyses; if the F2F and telehealth (either video or phone) groups were comparable and met the inclusion criteria, they are analysed in the TH vs F2F results section
Assessment of risk of bias
Risk of Bias Tool-2 for parallel arm trials (n = 4 trials)
Four included parallel arm trials were overall rated at either low risk of bias (two trials) or some concerns (two trials). The rating of some concerns was due to concerns about the measurement of the outcome in one trial, and due to randomisation process in one trial (Figure 9).
Risk of bias (parallel arm randomised trials).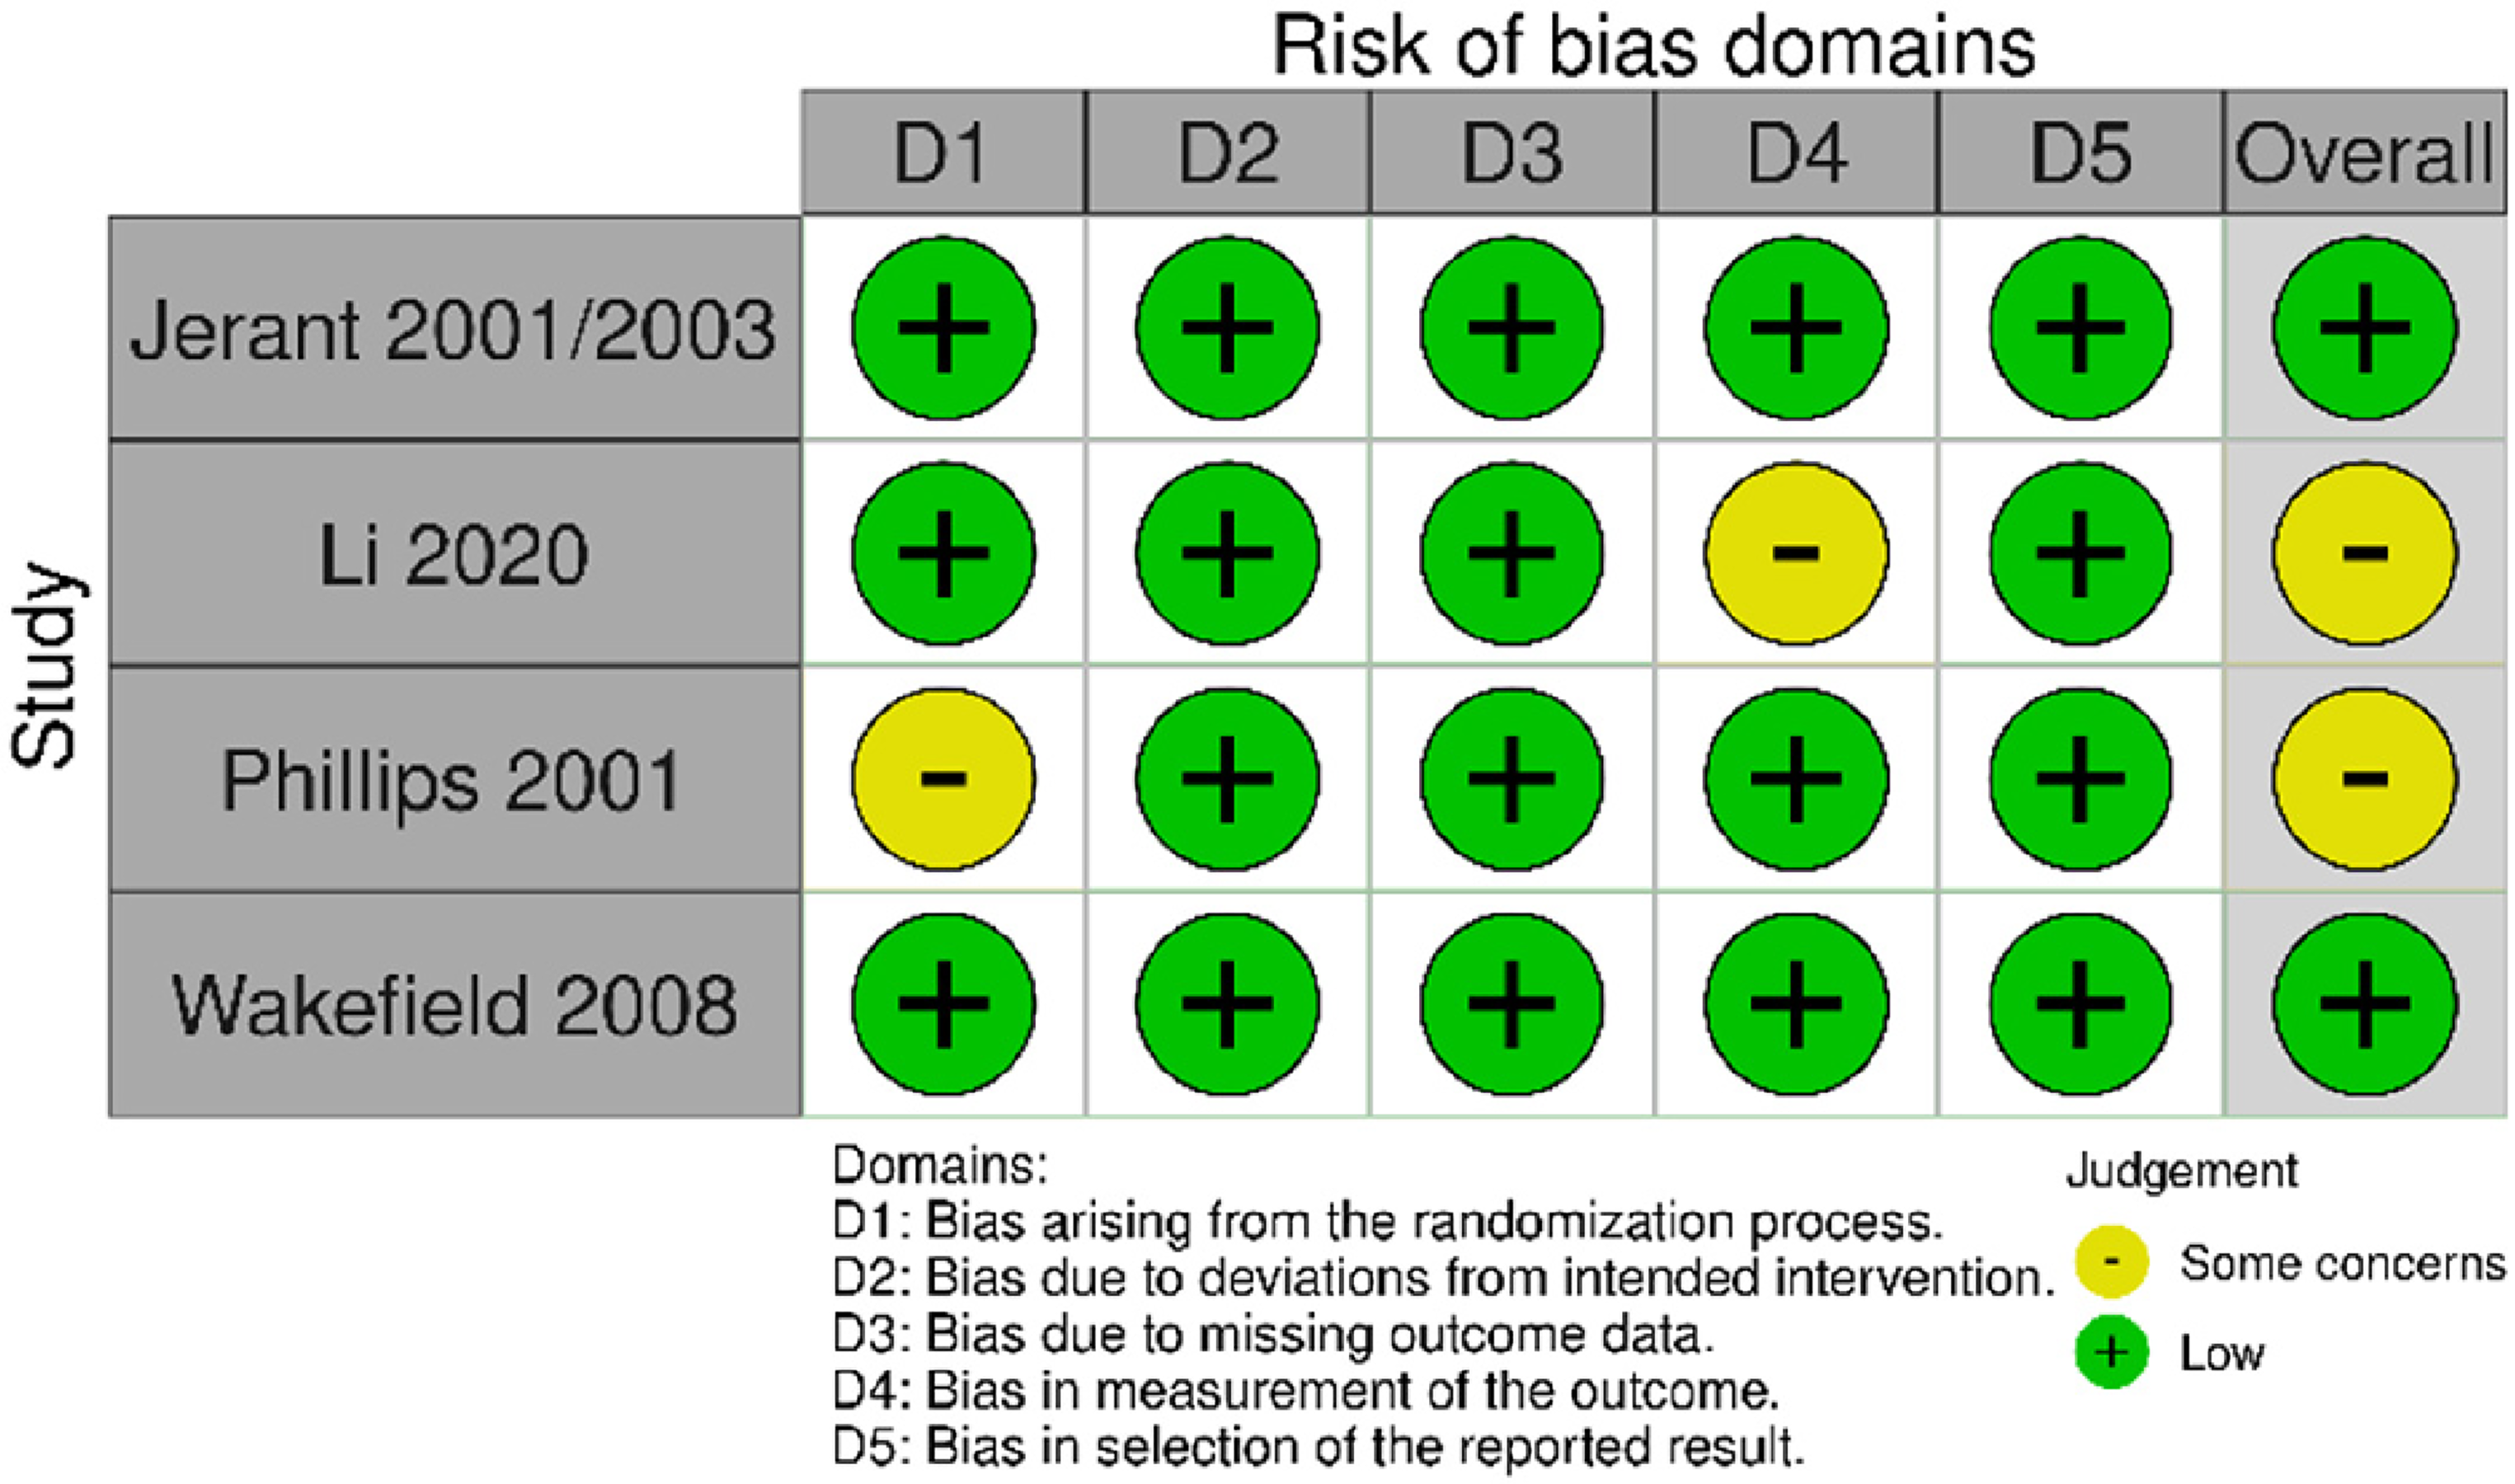
Risk of Bias Tool 2 for cluster randomised trials (n = 2)
Two cluster randomised trials were included. One trial was rated at an overall low risk of bias, owing to low risk of bias rating across all domains. Another trial was overall rated at high risk of bias, due to a high risk of bias rating for the missing outcome domain; it was also rated as some concerns in the randomisation, outcome measurement and selection of the reported result domains (Figure 10).
Risk of bias (cluster randomised studies).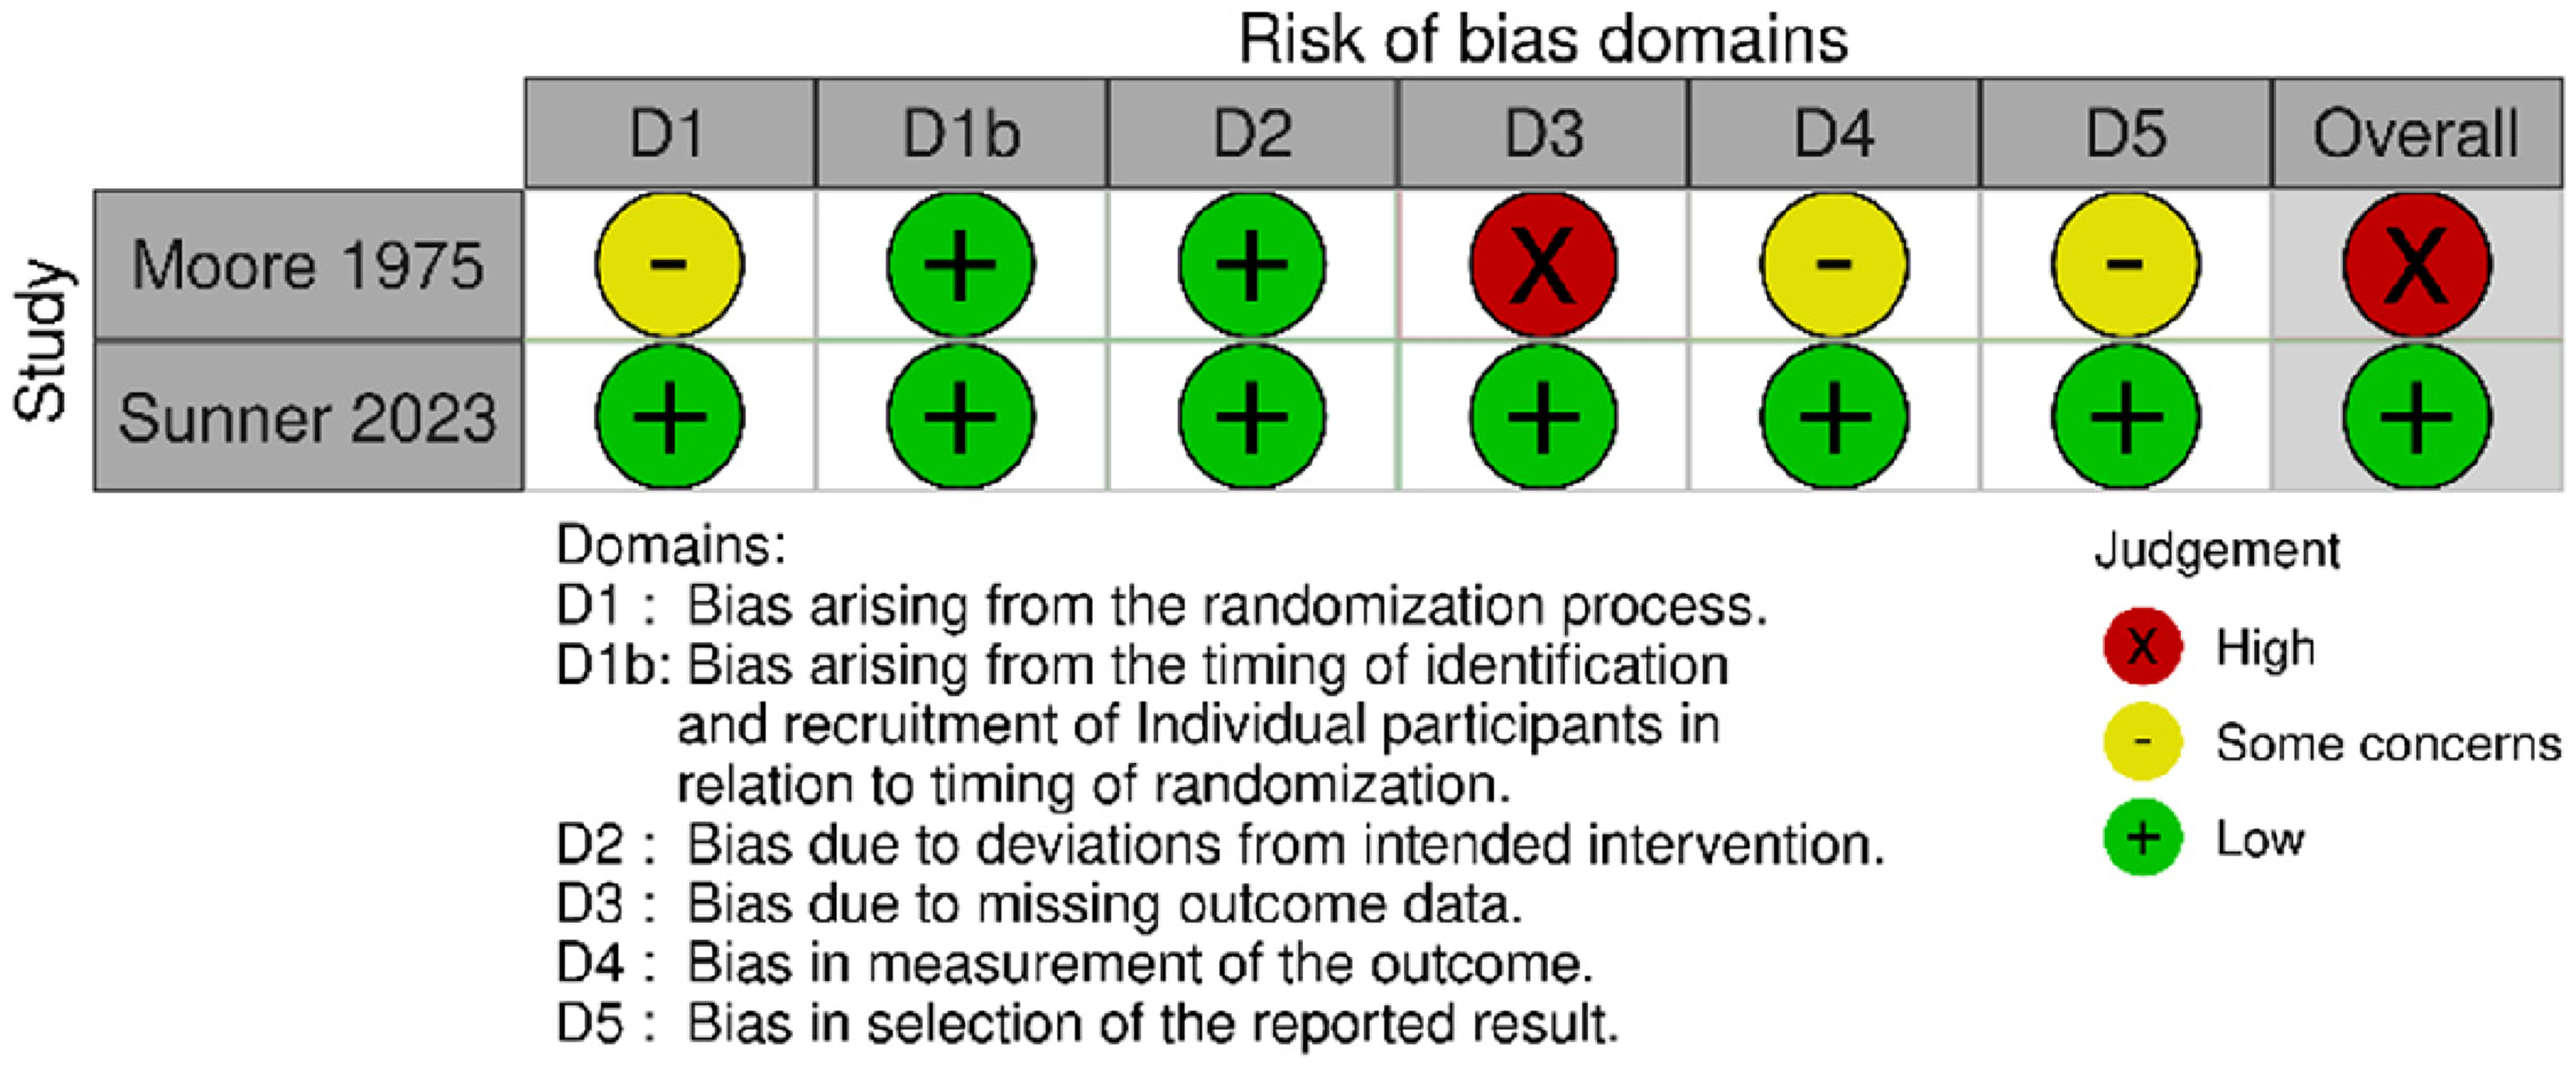
Primary outcome: visits to the emergency department
Four trials reported on this outcome; three trials were meta-analysable.
There was no significant difference between the video and phone groups for visits to the emergency department (three trials, RR 0.67, 95% CI 0.41 to 1.12, p = 0.13); heterogeneity of the pooled trials was low (I2 = 38%) (Figure 11).
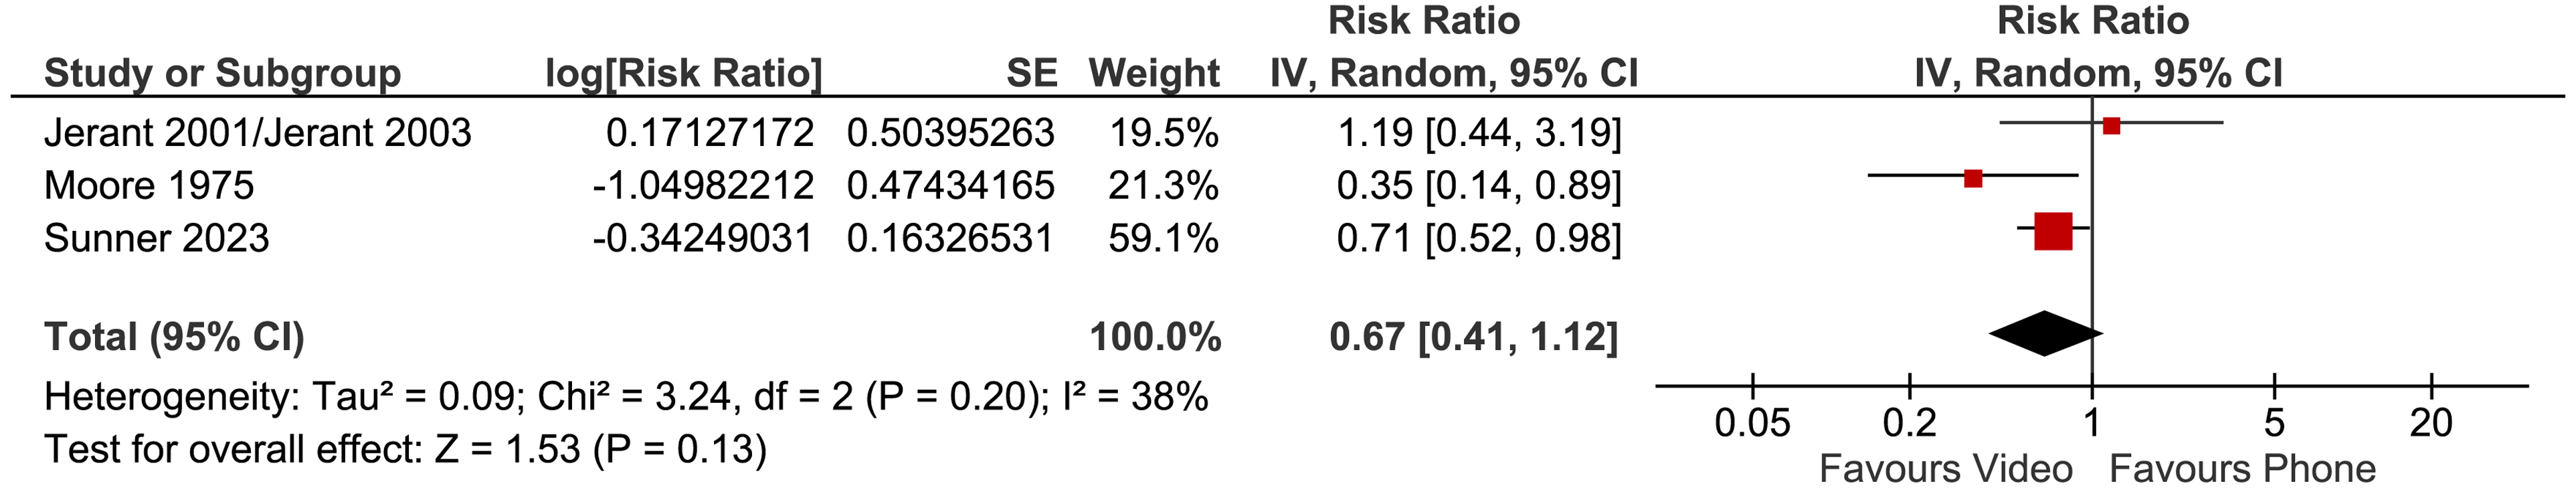
Video vs phone telehealth – impact on visits to the emergency department – random effects model (prespecified approach).
We conducted an exploratory analysis to test the impact of using the fixed effects model instead of the random effects model (as prespecified in the protocol). When the fixed effects model was applied, there was a significant difference, favouring video (three trials, RR 0.69, 95% CI 0.52 to 0.93, p = 0.01); heterogeneity of the pooled trials was low (I2 = 38%). This finding needs to be interpreted with caution, however, due to the small number of included trials, and the exploratory (post-hoc) nature of the analysis (Figure 12).
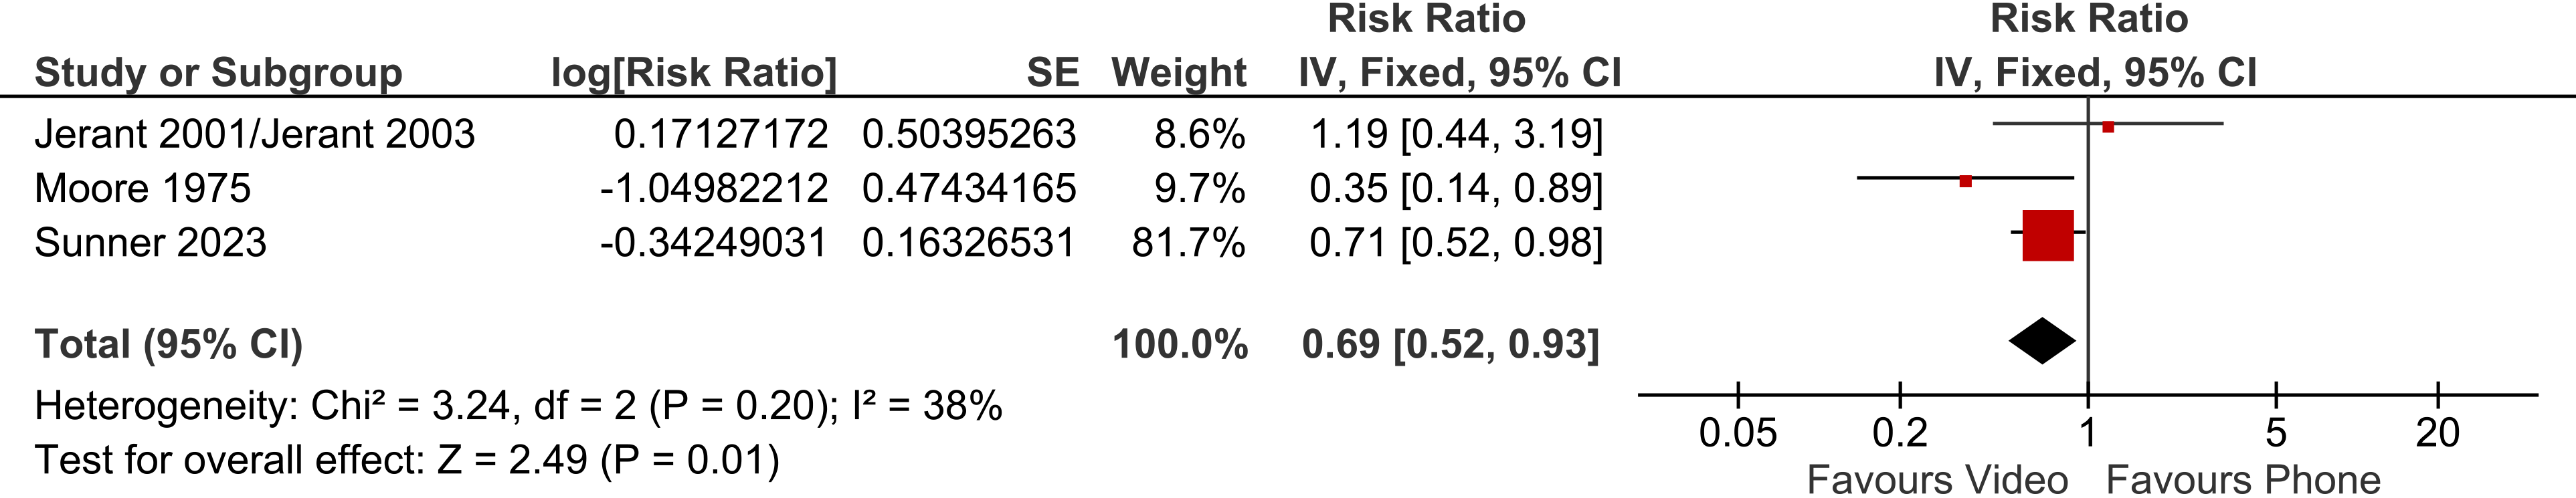
Video vs phone telehealth – impact on visits to the emergency department – fixed effects model (exploratory approach).
One trial reported on this outcome but was not meta-analysable. The trial evaluated discharged American patients after hospitalisation for heart failure, found no significant difference in emergency department visits between the patients in the video and the phone groups.31,32
Primary outcome: hospital admissions
Three trials reported on hospitalisation outcome. There was no significant difference between the video group and the phone group in the number of hospitalisations (three trials, n = 196, RR 1.04, 95% CI 0.73 to 1.48, p = 0.85); heterogeneity between trials was very low (I2 = 1%) (Figure 13).
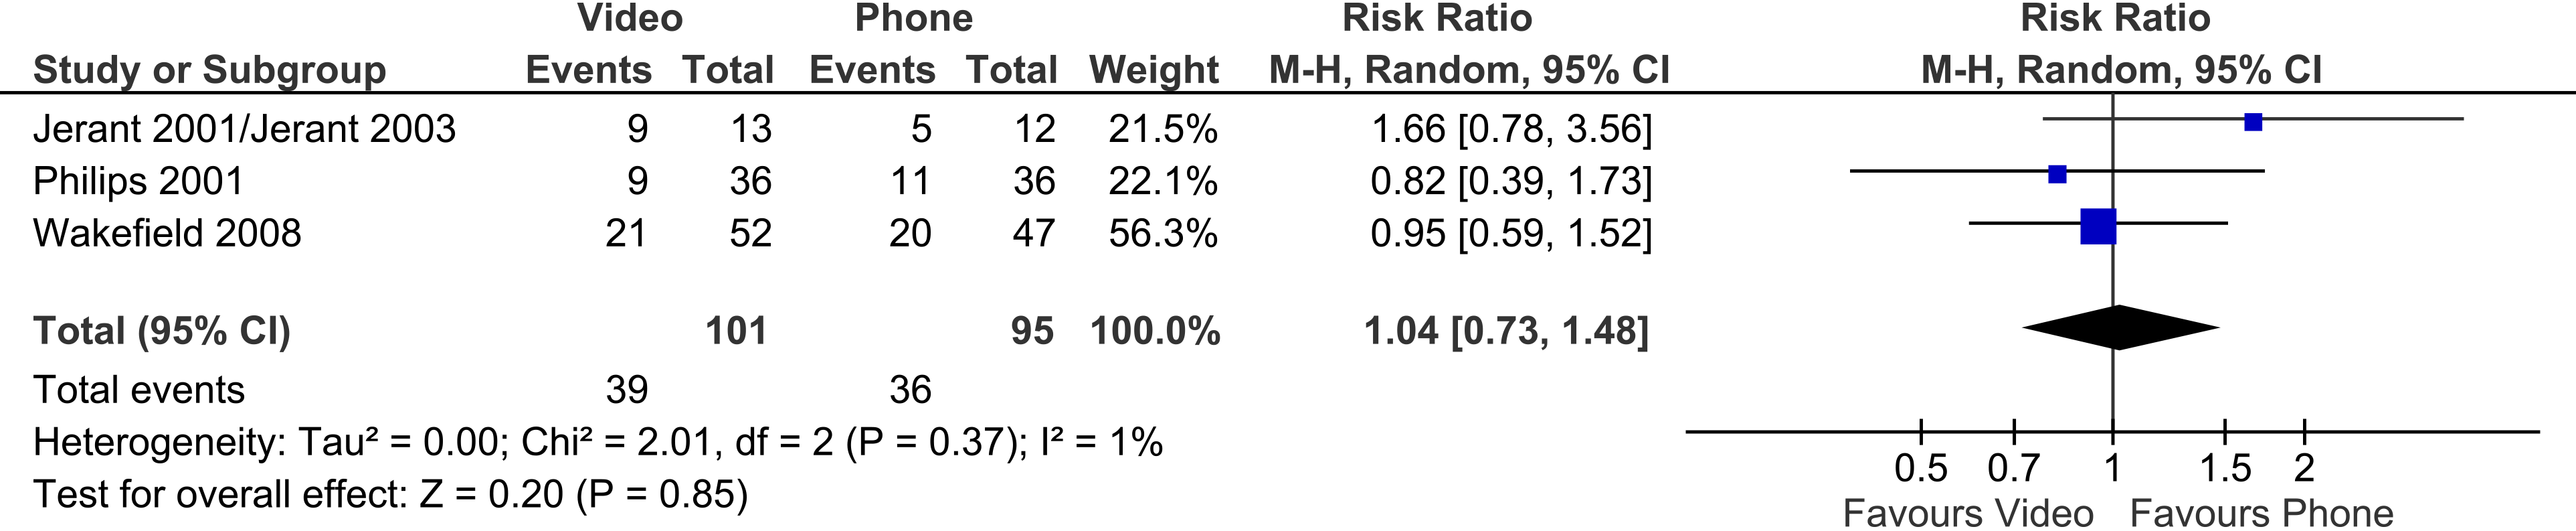
Video vs phone telehealth – impact on hospitalisations.
Secondary outcome: safety (including adverse events, deaths)
Three trials reported on safety outcomes
Two meta-analysable trials reported the number of deaths, showing no significant difference between the video and the phone groups (two trials, 92 patients, RR 0.89, 95% CI 0.10 to 7.61, p = 0.92). Heterogeneity was moderate (I2 = 55%) (Figure 14).
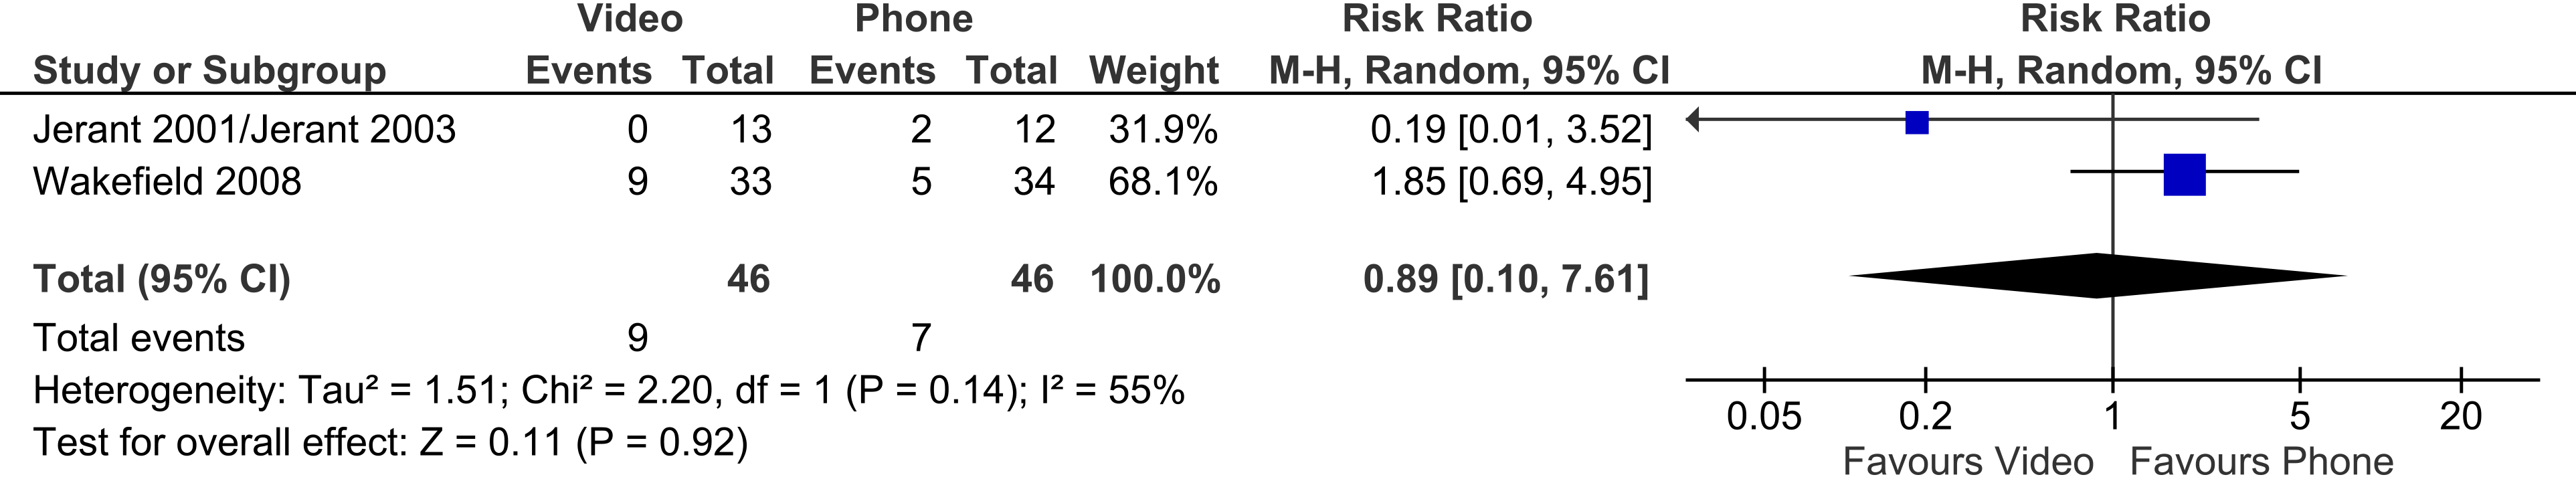
Video vs phone telehealth – impact on deaths.
One trial reported on the presentations to the emergency department after video consultations to identify adverse events. 33 Whilst telephone care was implemented, one aged care resident had an unplanned presentation to emergency within 48 h to identify adverse events. Whilst video care was implemented, two aged care residents had unplanned presentations (although neither had reported adverse events – one required referral for wound care follow-up; one required investigation for hip pain).
Secondary outcome: costs
One trial34,35 evaluated the total care charges for patients with congestive heart failure, who were followed up for one year after discharge from a hospital in the United States. Median total care charges for the video group were $7487, and for the phone group $7117. Mean (standard deviation) total care charges for the video group were $29,701 (SD $49,219), and for the phone group $28,888 (SD $38,799). The differences between groups in total care charges were not significant.
Another, recently completed Australian trial, indicated that a future publication from the trial will present the cost consequence analysis. 33
Secondary outcome: patient satisfaction
Four trials reported on patient satisfaction; three trials were meta-analysable. There was no significant difference, between patients accessing care via video and via telephone in patient satisfaction scores (three trials, n = 177, SMD 0.28, 95% CI −0.32 to 0.88, p = 0.35). Heterogeneity between trials was high (I2 = 71%). (The level of heterogeneity is driven by the inclusion of the Li 2020 trial. Its removal from meta-analysis decreases the heterogeneity to 0%, whilst the difference between groups remains non-significant: SMD −0.04, 95% CI −0.48 to 0.40, p = 0.84, I2 = 0%) (Figure 15).
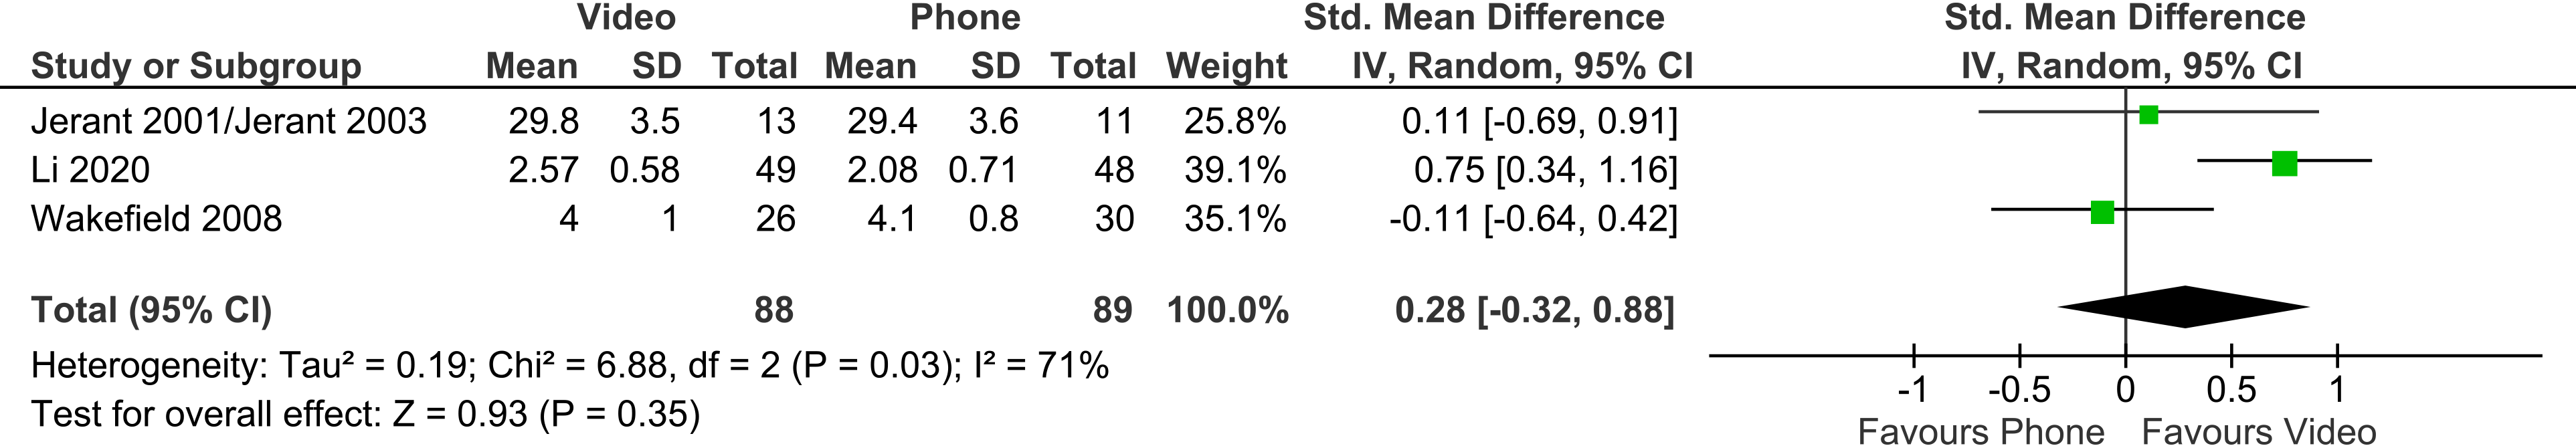
Video vs phone – patient satisfaction.
One non-meta-analysable trial found that patients were generally satisfied with both video and phone consultations, and further reported that: ‘when asked if they would prefer to have seen the physician in person, less than 5% said that they would, with no difference between television and telephone users.’ 36
Secondary outcome: care provider satisfaction
Two trials reported on care provider satisfaction, but reporting precluded meta-analyses.
One trial found that nurses and physicians had a similar, high level of satisfaction with video and phone consultations, with no strong preference for either modality. However, care providers seemed more likely to prefer video, when either visualisation of findings or patient teaching was required. 36
One trial, which surveyed 44 care providers (majority were nurses), found that 38 of 44 respondents (88%) strongly agreed or agreed that the video teleconferencing was easy to set up, and 39/44 (91%) strongly agreed or agreed that it was easy to use. All respondents (44/44) agreed that video telehealth enhanced communications, and 97% felt that video telehealth provided a person-centred approach. 33
Discussion
In comparison 1, we identified 10 trials comparing telehealth care (five trials by telephone; four trials by video; one trial by both) to face-to-face care for transfers to the emergency departments. All trials were conducted in high-income countries, across a variety of settings, including: primary care (three trials); nursing home (one trial); hospital outpatient (two trials); hospital patients post-discharge (four trials). The quality of the evidence was good; six of the trials were rated low risk of bias overall, three were rated as some concerns and one overall high risk of bias. Overall, these trials found no difference between telehealth and face-to-face consultation for transfers to ED and hospitalisations.
In comparison 2, we found six trials comparing live telehealth via video to live telehealth via phone. Most trials were US-based (n = 4), but involved a variety of participants, including hospital outpatients, discharged patients, nursing home residents and primary care patients. The quality of the evidence was mixed, with half of the trials (n = 3) rated at low risk of bias. Overall, there was no difference between the video and telephone groups for: visits to the emergency department, hospitalisations, safety (deaths), costs and patient and care provider satisfaction.
We identified several knowledge gaps in the existing evidence. First, the number of trials is limited to 10 (for the telehealth via video or phone to face to face comparison) and six (for the video to phone comparison). The limited volume of trial evidence precluded us from conducting planned subgroup analyses by health condition. The volume of the existing evidence would also be insufficient to analyse whether the use of telehealth has different impacts on escalation to emergency departments or on hospital admission by the different patient groups, i.e., primary care patients, hospital discharged or outpatients and nursing home patients. However, this may change as the volume of evidence on live telehealth increases with its greater integration into health systems post-COVID. Second, the existing evidence is predominantly from higher income countries. Fifteen of the included studies were from Europe, United States or Australia; only one trial was from China. This shows important gaps in the existing evidence from Asia, Africa and South America. Finally, the evidence for the care provider satisfaction outcome is limited to two studies, both in the video to phone telehealth comparison. As healthcare providers’ dissatisfaction with it may limit its adoption, 37 it is important to collect this outcome as part of future telehealth trials.
Our findings are consistent with other systematic reviews, which showed that there are generally no differences in outcomes for live telehealth versus face to face care,12,38–40 or for live telehealth via video versus by phone, 41 for a broad range of patient groups and health conditions. They are also consistent with the findings of an analysis of over 6900 electronic health records of discharged patients with heart failure, which showed that a 30-day hospital readmission rate was similar for patients receiving telemedicine visits (15%) and those receiving in-person visits (14%). 42 On the other hand, a previous scoping review, examining whether telehealth influences the decision to transfer the residents of aged care facilities specifically to the emergency departments, 20 found mixed results. This may be due to the fact that it included predominantly non-randomised studies, and did not meta-analyse the studies. There is systematic review evidence, that telehealth decreases the number of hospitalisations, and the number of all-cause hospital days for patients across a broad range of conditions. 43 However, the difference in finding to our review may be due to the comparison (to usual care) and the broader inclusion of telehealth types (including both synchronous and asynchronous telehealth).
The strengths of our review include a comprehensive search of databases, trial registries and a forward and backward search on the included studies to identify further evidence. The synthesised trials also evaluated outcomes for range of patient groups, including from primary care, hospital discharged or outpatients and nursing home patients. However, one of its limitations is the inclusion of only the evidence from randomised controlled trials. By excluding evidence from observational studies, we limited the total volume of evidence that may have otherwise been includable. This choice was driven by the consideration that biases are likely greater for non-randomised study designs when addressing intervention questions. 22 The review also excluded studies that provided asynchronous telehealth (such as via mobile apps, online platforms, text, email support and store and forward technologies, for example), which also decreased the volume of includable evidence. Finally, as noted above, because all but one of the included studies were from Australia, North America or Europe, the generalisability of the present findings is limited outside of those settings.
Telehealth care – delivered by telephone or by video – may be an appropriate alternative to face-to-face provision of care, as it does not increase the likelihood of escalation of care to the emergency department for patients in primary care, hospital outpatients, post-discharge patients or residents in aged care. This is a relevant consideration particularly for those clinicians who provide care to those patient groups, and for the healthcare systems which utilise separate funding mechanisms for the funding of primary and hospital care.
Footnotes
Declaration of conflicting interests
The authors declared no potential conflicts of interest with respect to the research, authorship, and/or publication of this article.
Funding
The authors disclosed receipt of the following financial support for the research, authorship, and/or publication of this article: This systematic review was commissioned by the Department of Health and Aged Care, Canberra, Australia, as part of a series of systematic reviews on the effectiveness of telehealth within primary care in 2020-21 and their update in 2023. The funder was involved in establishing the parameters of the study question (PICO). The funder was not involved in the conduct, analysis, or interpretation of the systematic review, or in the decision to submit the manuscript for publication.
Data availability statement
The data for this systematic review has been derived from publicly available, peer-reviewed articles. Reference for each included article is provided in the references section.