
Abstract
This article shows how a realist portfolio analysis was operationalised as part of an evaluation of a donor-funded development programme. This programme supports small and medium-sized enterprises with data analytics and business coaching to make their sourcing and service delivery models more smallholder inclusive. After ranking all projects on relative effectiveness in convincing business owners to change their business model, we applied an iterative, abductive process of realist causal explanation. For the portfolio analysis, we used the realist evaluation question, ‘What works, for whom, under what conditions, and why’ as the key learning question. We then developed a methodological bricolage of variable-based regressions, case-based truth table analyses, reflection workshops and case study interviews to detect candidate casual factors and configurations and distil insights for better targeting of that support. In the realist explanation and theory adjudication, we relied on academic and practical knowledge about the role of organisational social capital in value chains.
Introduction
There is a growing tendency within international development cooperation to invest in support programmes to private companies in order to advance public goals, such as poverty alleviation and job creation. Evaluation of these projects and programmes is needed, both from an accountability perspective – channelling public resources to private interests is highly contestable when this does not contribute to public goals – and from a learning angle, to help future programmes achieve these public goals more effectively and equitably. This article presents a real-world example of a portfolio analysis aimed to distil actionable insights from the available data on supported companies to inform and improve the targeting policy. In this portfolio analysis several methods have been combined to learn about ‘What works, for whom, under what conditions, and why?’
The portfolio analysis was a work package within a broader evaluation of IDH Farmfit Africa, carried out between 2021 and 2024 (Ton et al., 2024). IDH is the Sustainable Trade Initiative, headquartered in the Netherlands. The main support modality of IDH Farmfit (2024a) was business analytics and coaching to companies involved in smallholder-inclusive business models, such as contract farming. The findings of the portfolio analysis were input for a reflection session during the midterm evaluation in 2022. Subsequently, the analysis was updated and upgraded with a stronger realist focus in 2024.
The portfolio analysis provides a good example of a real-world evaluation in which different methods are used to generate input for discussions about effectiveness. Real-world evaluations need to cope with resource constraints in data collection and analysis, and, therefore, need a pragmatic mixing of methods to get insights and evidence that can support evaluative conclusions (Faling et al., 2024; Morgan, 2007; Ton, 2012). This need for the creative mixing of methods within a relatively low budget envelope sets the evaluation field apart from the largely disciplinary-siloed academic social science field where single-method approaches are more common, more suited for being published as academic articles and easier to explain to students in teaching.
The process of intentionally and pragmatically combining methods is known as ‘methodological bricolage’, especially in the more qualitative research traditions (Pratt et al., 2022; Rogers, 2012), and may combine social inquiry paradigms that are otherwise viewed as in tension and even incommensurate (Mason and Mumford, 2024). Practical accounts of this art and craft of bricolage in evaluation (Aston and Apgar, 2022) are scarce, due to the validity threats inherent to this pragmatic mixing of methods (Ton, 2012), which may not pass the peer-review process of academic journals. This article is one contribution to filling this void. Moreover, by reflecting on the methodological bricolage in a mixed-methods evaluation with a strong quantitative component, the article applies the concept of methodological bricolage beyond the domain of qualitative research. The article describes how elements of regression-based exploratory statistics and truth table analysis have been combined to explore meaningful and actionable insights to better target the support provided by IDH Farmfit. Sense-making workshops and case study interviews helped to distil patterns that were meaningful and to expose the causal explanation and generative mechanisms involved. With this combination of methods, we stay within the post-empiricist paradigm of realist evaluation that aims to generate plausible and actionable middle-range theories, acknowledging that these are contestable, generated from imperfect information about reality and valid only when some key assumptions about the contextual conditions hold. Realist middle-range theories are always plausible theories, never iron laws (Pawson, 2024).
During the inception phase, the evaluation team designed the data collection with a mix of methods that combined quantitative and qualitative methods. Following Brady and Collier (2004), the design was based on a combination of data set observations (the administrative data about the projects in the portfolio) and causal-process observations (process information and case studies for within-case analysis). However, during the implementation of the evaluation methods, it became clear that the data pattern analysis was less straightforward than we anticipated: many patterns and correlations needed to be scrutinised on relevance and plausibility, while the process information available on each of the cases in the portfolio to do so was limited. Similarly to the experience of Befani et al. (2007), the selection of meaningful causal patterns from the qualitative comparative analysis (QCA) proved challenging. Where academic social science research would have required a structured process of step-wise elimination of each detected pattern by looking at within-case process information, the portfolio analysis needed to select patterns that were plausible and meaningful in only a couple of days and based on imperfect information. That is, it needed to do what evaluators normally tend to do: apply an imperfect process of causal inference that is, nevertheless, good enough for learning about an intervention’s effectiveness.
The data analyses and pattern detection were mainly done at midterm. However, at endline, we could repeat our data set analysis with a larger set of projects (IDH Farmfit had a growing portfolio) and around 10 cases for which there was more in-depth qualitative information available. Moreover, at endline, in 2024, we could interview the managers of six supported companies and the respective support staff to reflect on the emerging insights of the portfolio analysis, especially the relevance of local organisational social capital in their business models.
In this article, we want to show how explorative statistics and truth table analyses can help to distil nuggets of wisdom that provide actionable insights on what works, for whom, under what conditions and why. These patterns detected in the data set need to be supported by theories that explain how causal mechanisms are triggered and why these conditions matter. Pawson (2024) emphasises that ‘Inquiry might well be prompted by the discovery of interesting empirical regularities and puzzling statistical traces, but it is never complete without an understanding of the mechanisms that generate them’ (p. 22). Thus, the challenge in our explorative portfolio analysis was to judge the discovered patterns based on the plausibility of the causal mechanism involved, thinking as a realist (Pawson, 2024).
The different data set analytical methods are derived from different schools of causal inference (Beach, 2018; Palenberg, 2023; Pawson, 2024; Thiem et al., 2015). The essential difference with mainstream successionist causal inference through statistical analysis is the realist focus on generative causality (Glennan, 1996; Pawson, 2024). The notion of generative causality assumes that causal mechanisms reveal themselves during the implementation of an intervention within a given context and are thus sensitive to the variations of context (Befani et al., 2007; Lacouture et al., 2015).
Realist evaluation was developed by Pawson and Tilley (1997) as a critique to mainstream evaluation approaches that focused on average effects. Instead, realists explore when and why an intervention triggers mechanisms in a social regularity that changes course and creates an outcome pattern of interest. The goal is to build middle-range theory: actionable insights that bridge the gap between detailed empirical observations and grand, all-compassing social theories (Merton, 1968). Developing and refining these middle-range theories is considered more useful than estimating the net effects of context-specific projects, because these theoretical insights can be applied on a wider scale, beyond the project or ‘social regularity’ that has been studied or evaluated (Pawson and Tilley, 1997).
Explorative pattern detection, looking for configurations of conditions with casual explanation, can be compared with trying to capture a radio signal within the ether. First of all, the signal needs to exist; the radio does not make the signal, it only receives it. Second, the further away the source, the weaker the signal will become in relation to the noise; the receiver needs to be fine-tuned to separate the noise from the signal. And, third, some receivers have only a limited number of frequencies to search for signals; short-wave and long-wave radio capture different types of signals. Similarly, the results of a portfolio analysis depend on the existence of meaningful causal patterns in the real world (= the signal) and the pattern detection device used to search for the pattern (= the receiver). It is certainly possible that the complexity is such that there are simply no portfolio-wide lessons to be learned, and all cases might be unique and unpredictable in the way that they react to the support.
The process of methodological bricolage and the main activities that this implied are described in Table 1. For space and didactic reasons, this article will focus on the detection and explanation of the data patterns during the endline phase of the evaluation The detected candidate causal configuration had a plausible causal explanation that resonated with the author’s earlier research and theoretical knowledge about the role of collective action in value chain coordination and governance (Ton, 2015; Ton et al., 2007, 2018) and, specifically, the findings of a systematic review of effectiveness studies on contract farming (Ton et al., 2018). The systematic review developed the hypothesis that the involvement of farmer organisations would improve the effectiveness of a contract farming arrangement, especially in non-perishable crops (Ton et al., 2018: 59). In this portfolio review, we could not assess effectiveness by looking at income effects, as done in the systematic review, but we could assess the likely effects of contract farming on smallholder inclusion indirectly, through a short-term proxy indicator: whether companies responded better to the business advice and coaching that aimed to make the contract farming more smallholder inclusive and remunerative.
Methodological bricolage in the portfolio evaluation.
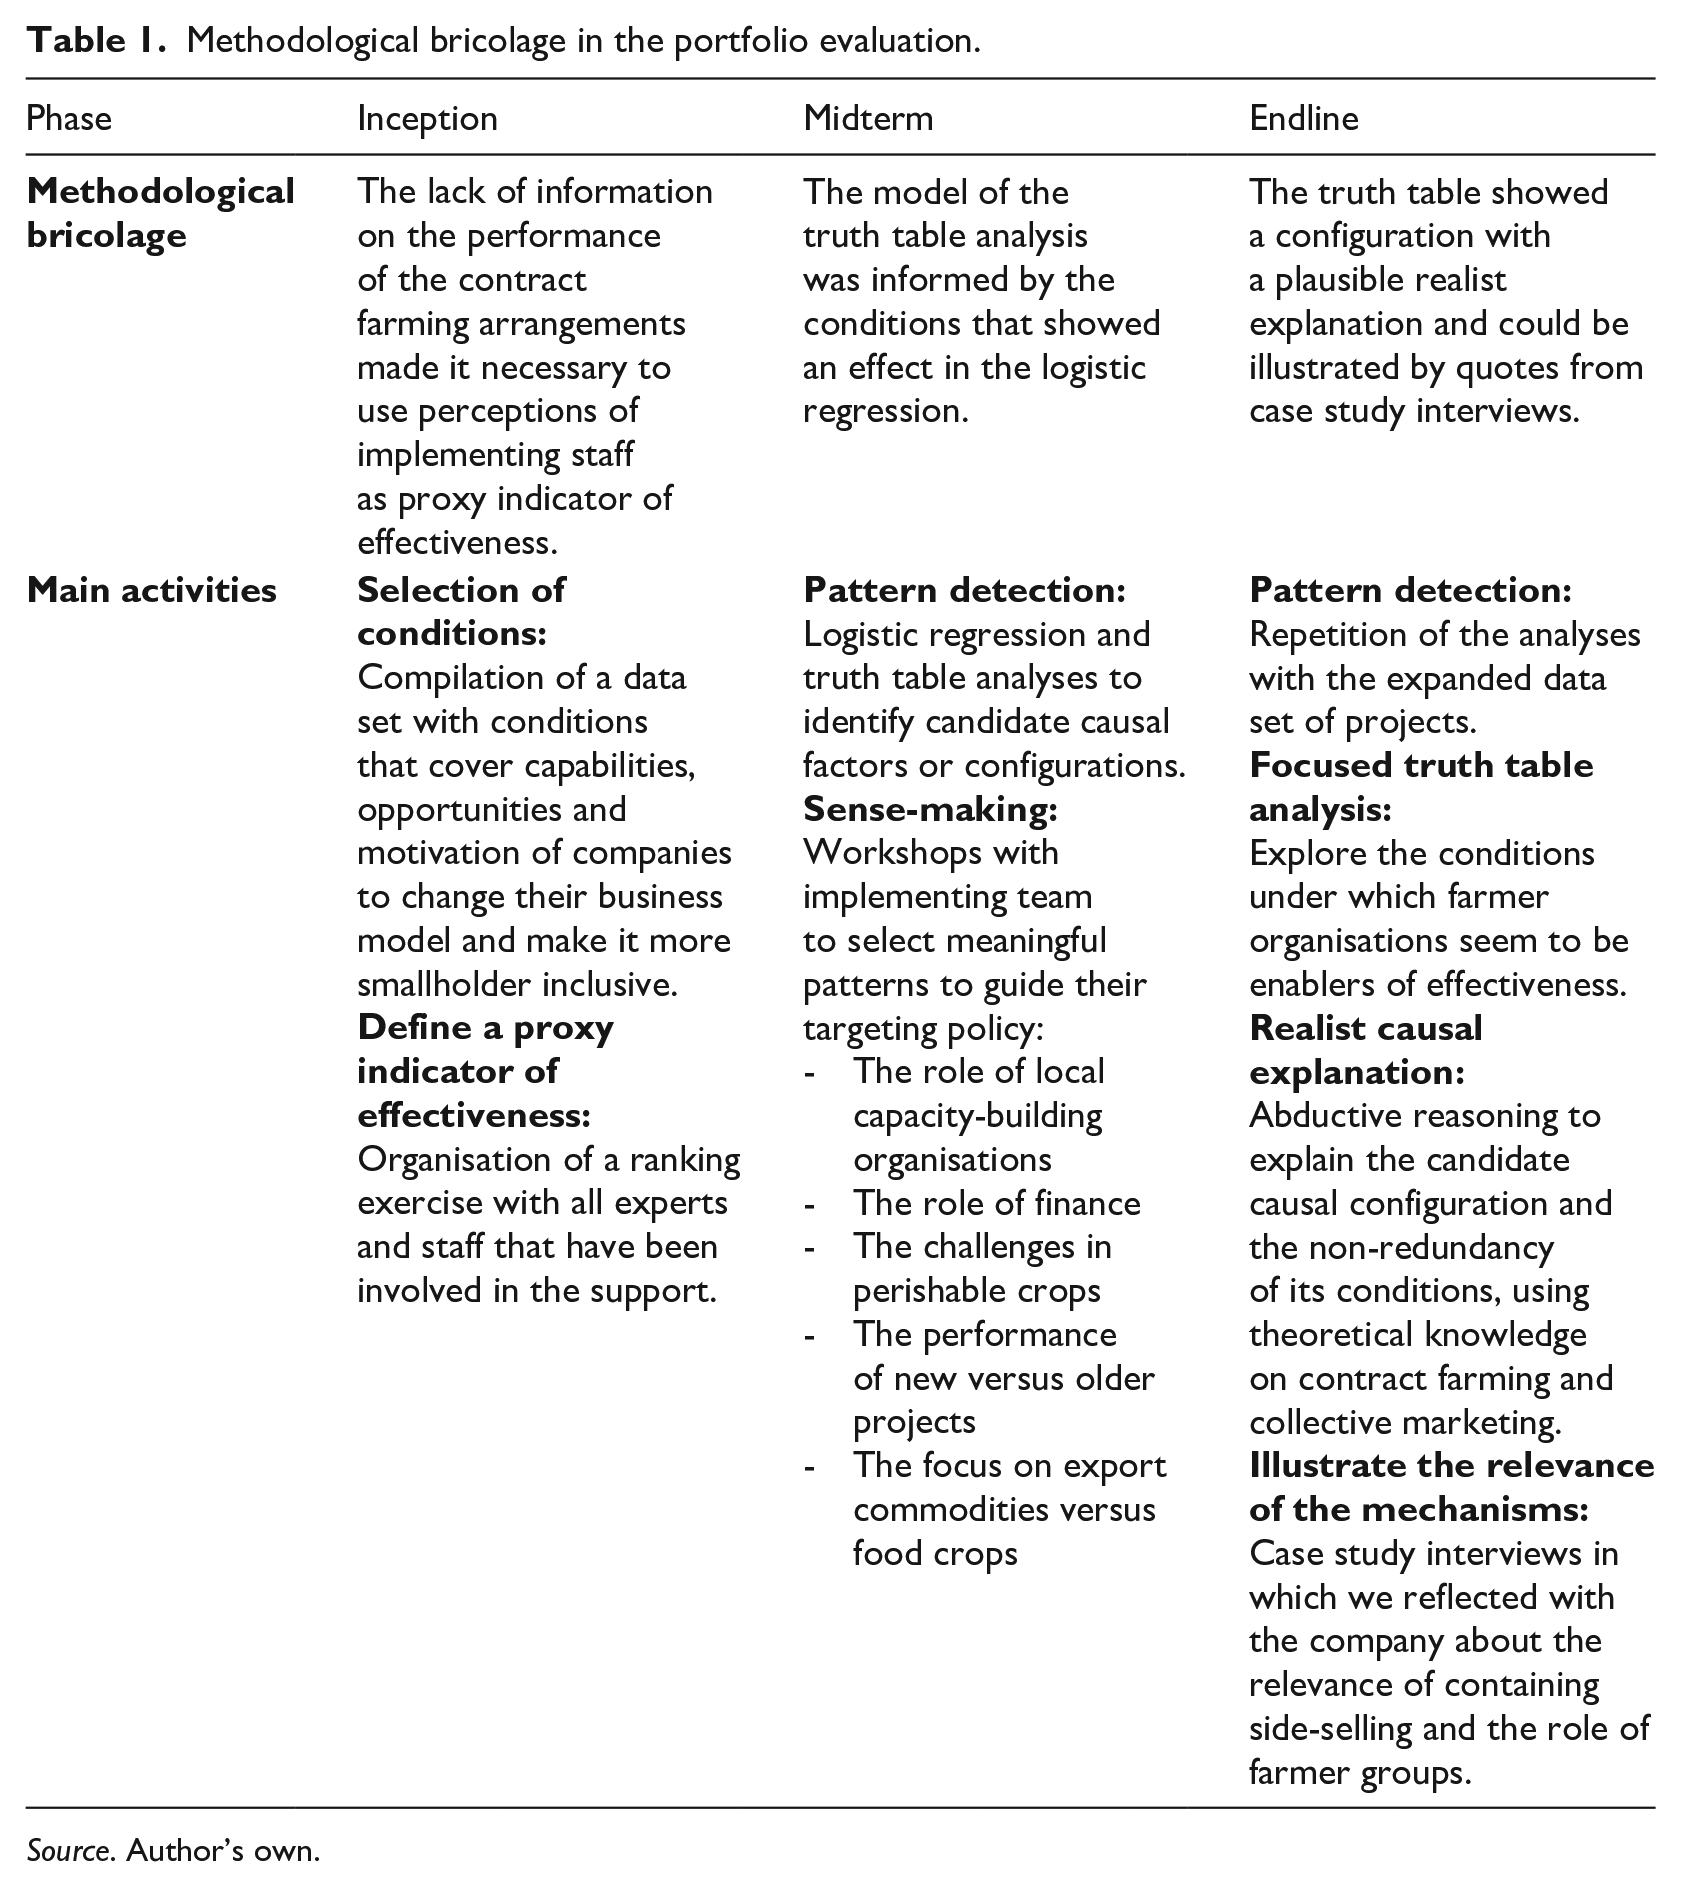
Source. Author’s own.
Analytical framework
The portfolio analysis reported in this article was part of a broader evaluation of a donor-funded development programme, IDH Farmfit, which supports companies in Africa to make their business practices more smallholder inclusive. 1 IDH Farmfit supports the development, strengthening, scaling and replication of inclusive, sustainable and commercially viable business models through holistic service provisioning by companies or service coalitions and using the power of purchasing firms to incentivise sustainable practices (Adjogatse and Saab, 2022). The business advice was based on a detailed data-driven analysis of the performance of the sourcing and service delivery modalities used by the company. The programme also aimed to motivate other companies replicating some of the innovations in sourcing and service delivery models. To do so, IDH Farmfit manages a web-based portal for learning about inclusive business models, called the Farmfit Insights Hub (https://farmfitinsightshub.org/insights-explorer), where users can compare the performance of service delivery models against multiple indicators (IDH Farmfit, 2024b). The ultimate outcome of the core support, depicted as ‘company coaching’ in Figure 1, was for smallholder farmers to have better access to services that make them more resilient, with increased income. The more immediate outcome of the support provided is a company’s decision to change its current business model.
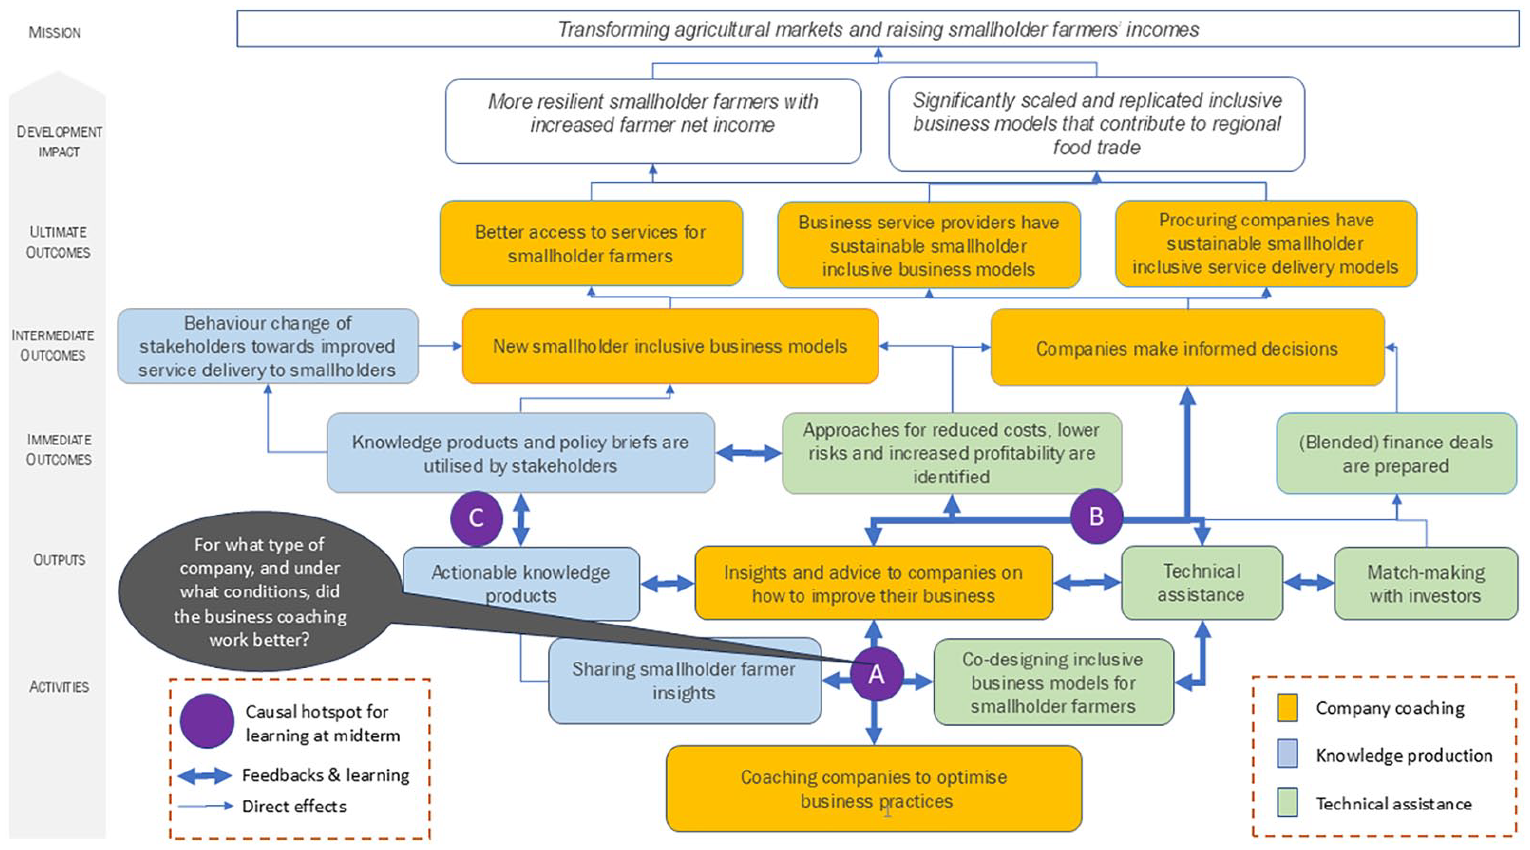
Theory of change with causal hotspots for contribution analysis.
The evaluation used contribution analysis (Mayne, 2012, 2023) to assess the contribution claims and verify the key assumptions inherent to the theory of change. Contribution analysis is a six-step process of theory-based evaluation that is geared to concentrate additional data collection on some critical assumptions in the theory of change, labelled as ‘causal hotpots’ by Apgar and Ton (2021). Following Mayne (2023), we distinguish two types of assumptions: cause–effect assumptions and causal link assumptions. Cause–effect assumptions analyse whether the effect took place and whether there are plausible alternative explanations for the effect. Causal link assumptions explore the conditions needed for the effect to happen and how these conditions reflect the heterogeneity of causal process.
Based on a reflection on the evidence available and needed for learning and accountability, in the inception phase, three causal hotspots were selected. One causal hotspot was the question ‘For what type of company, and under what conditions did the coaching work better?’, which ended up being prioritised as the main learning question at midterm (marked with an A in Figure 1). The realist portfolio analysis, described in this article, was designed to generate input for a reflection on this question with IDH Farmfit staff.
In the portfolio analysis, we searched for context–intervention–mechanisms–outcome configurations (CIMOs) that explain the causal links between the different outcome levels in the impact pathway or theory of change (Denyer et al., 2008; Punton et al., 2020). CIMOs are causal packages in which an intervention (I) changes the context (C) in a way that triggers or activates mechanisms (M) in a certain social regularity and produces an outcome pattern (O). The CIMO analysis can take place at different levels of abstraction. We focused on the micro-level business behaviour as the social regularity that the intervention intends to change in order to make it more inclusive.
This change in the company’s business behaviour is a complex change process in which multiple factors influence the motivation of the manager of the contract farming arrangement to implement the insights and advice given by the support organisation. Changes in the company’s business practices imply opportunities and risks for the company, and the results of these changes in the business model in terms of company performance are contingent on the dynamics of markets and economies. Understandably, the mechanisms that are triggered by the support will motivate the manager to opt for changes in the business model only when the required contextual conditions are in place.
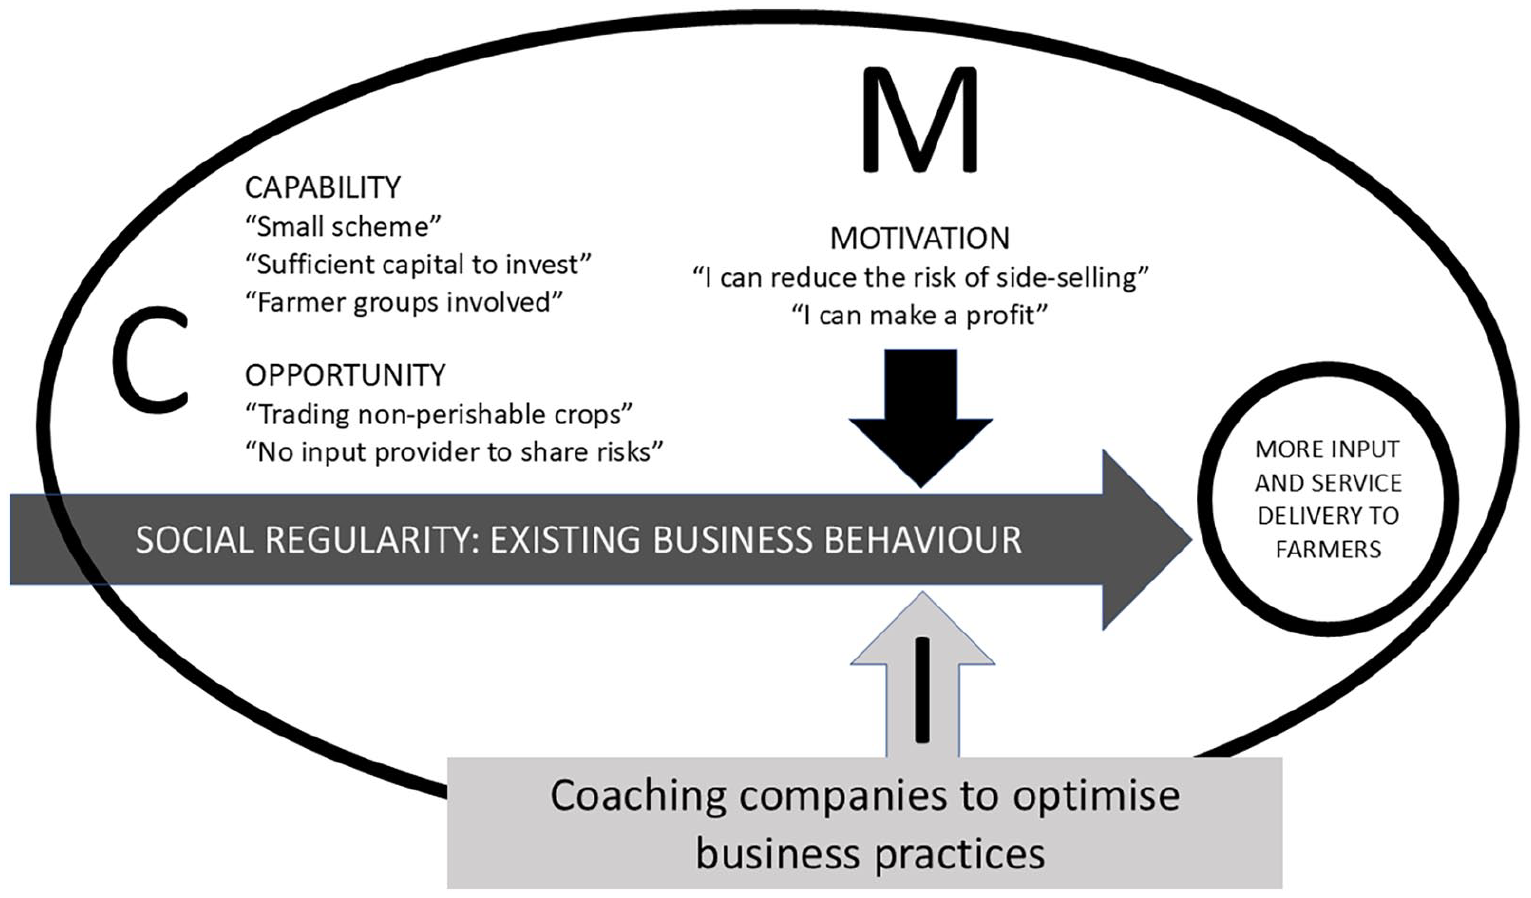
Ton and Vellema (2022) suggest an analytical framework that links the CIMO model of realist evaluation with the capabilities, opportunities and motivation for behaviour change (COM-B) model that has been developed by Michie et al. (2011). In this integrative framework (Figure 2), the realist notion of mechanism is the reasoning and resources that motivate businesses to become more smallholder inclusive. The capabilities and opportunities cover key contextual conditions that influence this motivation and create heterogeneity. Both the capabilities and opportunities constrain and enable the motivation of the company manager to implement smallholder-inclusive business practices. The wording and intuitive logic of the COM-B model helped to operationalise and communicate the realist analysis to the evaluation stakeholders.
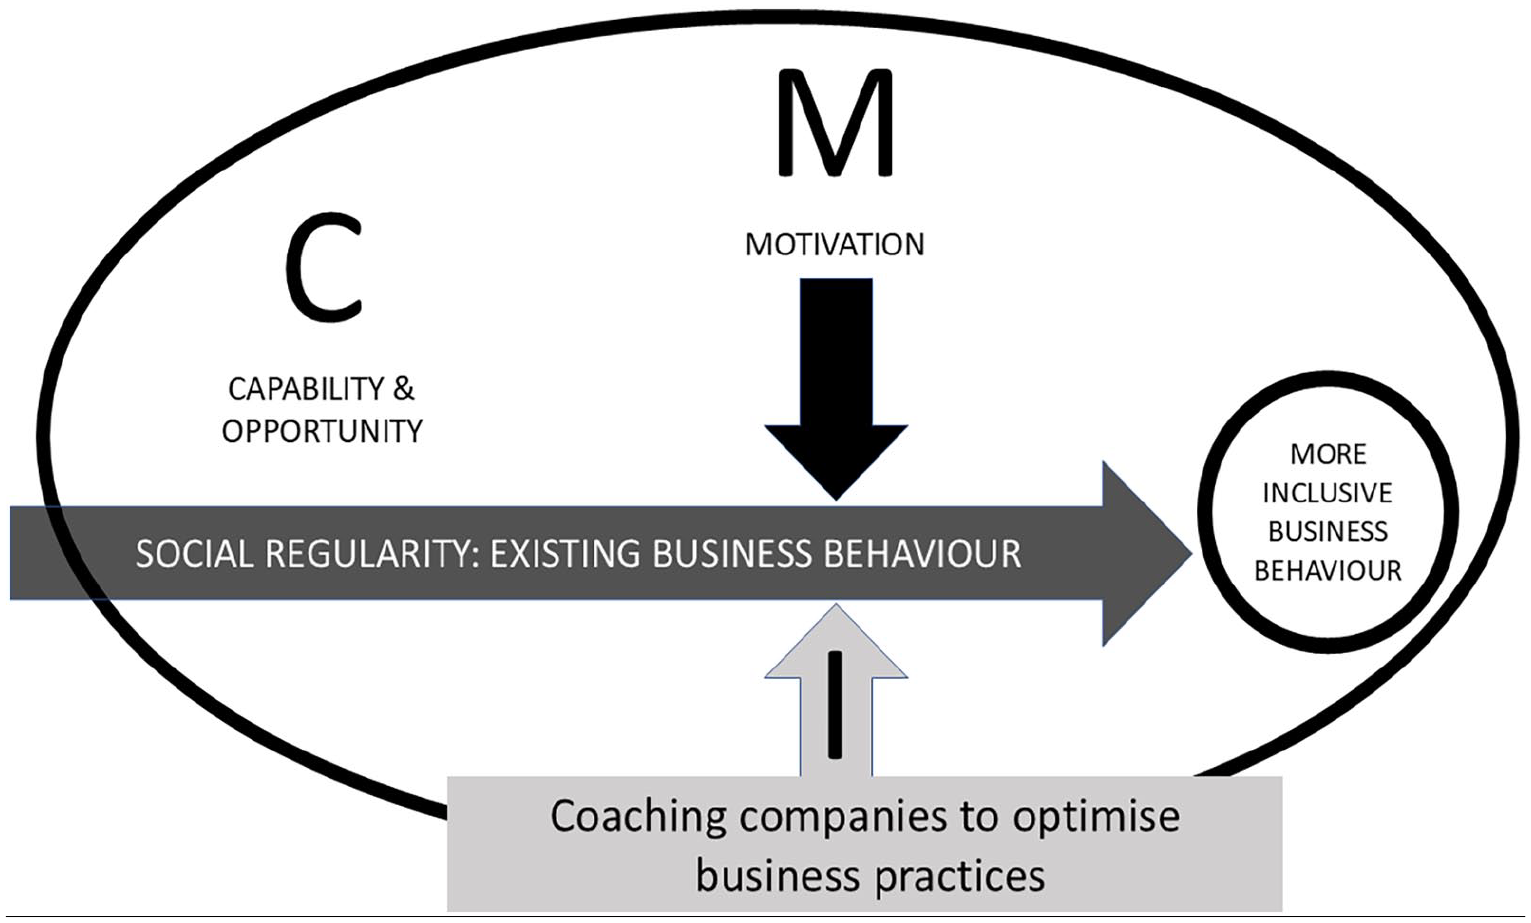
The CIMO framework used to answer the learning question.
Methods
For the portfolio analysis, we used two explorative methods to detect patterns in the data: logistic regressions and iterative truth table analyses. For both analyses, we used free-ware software to motivate IDH Farmfit to replicate and refine the midterm analyses as part of their regular monitoring system. We used Jamovi, a free-ware statistics programme, to search for conditions that are significantly associated with success. We used the QCA software Kirq 2.1.12 to search for candidate causal configurations.
IDH Farmfit was a data-rich programme that collected a wealth of information on the business models of the supported projects. This information was used to give an overview of the portfolio in a descriptive manner. The main limitation for more in-depth analysis through explorative statistics and regression analysis was the absence of a common outcome that could be used as the dependent variable in a regression. Regressions have the advantage above descriptives that they compute the marginal effect of a variable of condition in a model of multiple conditions – that is, the approximate effect of a condition while keeping the other conditions constant.
One of the main tasks was therefore to define an appropriate outcome as the proxy indicator for effectiveness that could be used in the pattern detection exercise. We used statistics to explore whether individual conditions had a correlation with the outcome and QCA to explore configurations of conditions that are consistently related to the outcome (the dependent variable). We used the same data set for both analyses to show that these two methods yield different results. This implied that any scale variables in the data set needed to be calibrated as set conditions. Set conditions indicate the case’s membership of the group of cases that have a certain characteristic, coded as true/false.
We explain the QCA methodology in more detail and consider that the statistics behind a regression are sufficiently known to the reader. The QCA methodology has been developed by the political scientist Charles Ragin (2008) and promoted in the evaluation field by Befani et al. (2007), Befani (2013), Thiem (2017) and Vis (2012). A QCA starts with a data set that has the identifier (name of the organisation), several conditions and an outcome variable. Several cases may share the same set of conditions, while some combinations of conditions will register no empirical case.
To get an overview of all possible combinations of conditions (configurations) and the number of cases that share the same combination, QCA uses a matrix called a ‘truth table’. The origin of the truth table as a device to represent all combinations of conditions involved in a causal explanation is ascribed to the 19th-century American philosopher and logician Charles Peirce (Anellis, 2012). Not all rows in the truth table are necessarily covered by empirical cases. The rows that are not covered are so-called logical remainders. The truth table rows that are consistently related to the outcome are combined and simplified to distil from various rows only those conditions that appear as non-redundant. This process of Boolean minimisation uses the Quine-McCluskey algorithm (McCluskey, 1956). Essentially, each truth table row that covers cases that are consistently associated with the outcome can be considered as a candidate causal configuration. However, often these patterns appear by change, accidentally, not because they are in any way causal and predictive of future success or failure. Therefore, empirical statements derived by a QCA must be substantively interpreted and need to have supportive evidence or theory that explain the underlying causal relationship (Pawson, 2024; Rutten, 2023).
In large truth tables with many conditions and relatively low sample size (Thiem and Mkrtchyan, 2024), the process to distil meaningful, potentially causal configurations is challenging due to the presence of multiple empty truth table rows as logical remainders (Dușa and Marx, 2024; Marx, 2006). When doing a QCA rigorously (Rihoux and Ragin, 2009; Schneider and Wagemann, 2012), fine-tuning the model based on the results of the analysis takes a lot of time and checking whether the patterns can be interpreted as causal configurations requires detailed within-case information to be readily available. Especially when QCA is performed iteratively, the time and data constraints are such that in evaluation practice there is a need for shortcuts, while maintaining quality standards.
In our explorative analysis using QCA, we followed the advice of Byrne (2009) and Collier (2014) to focus especially on the truth table and less on the results of the Boolean minimisation algorithm. This is a shortcut of how a QCA needs to be performed as presented in the main handbooks (Rihoux and Ragin, 2009; Schneider and Wagemann, 2012). We visually scanned truth tables for candidate causal configurations, iteratively using various combinations of four or five conditions. We looked for configurations (truth table rows) that appeared relatively consistent (consistency score > 0.75) and that were supported by at least two cases. Crucially, we took a conservative approach of only considering the QCA results as non-spurious and meaningful when these resonated with the researcher’s theoretical knowledge and could be confirmed by the (tacit) expert knowledge of the implementing staff in the workshops or through interviews with the company owners.
Ideally, QCA is performed on cases for which there is sufficient information available about the change dynamics (Byrne, 2009; Rihoux and Ragin, 2009). Each of the cases had a detailed business analytics report. However, we had only scant qualitative process information on the dynamics after the business advice had been provided, and lacked the resources to interview supporting staff on each of the 101 cases in the portfolio to reconstruct these. In spite of this, the pattern detection and reflection exercise was considered as a useful component of the evaluation, as the support provided to these cases was quite similar, the business models had similar objectives and the sense-making events provided a moment to sense-check the findings.
Findings
Data set for the portfolio analysis
To explore for configurations of factors that are related to the presence or absence of an outcome condition by logistic regression and QCA, we compiled a data set with cases, conditions and an outcome.
First, we had to define a useful outcome variable for the truth table analyses. To get information about the outcome of interest, we contacted all consultants who helped with the business analysis. In total, this was a relatively large group of 32 people, all with knowledge of only a small number of cases (support trajectories with a company). The number of cases that each expert was knowledgeable about ranged between 4 and 8. These consultants and implementing staff ranked the companies they had knowledge of according to their perception of the extent to which the supported firms used the business analysis for making new decisions about their service delivery model. For each case ranked, they gave a short explanation. Fortunately, most projects had more than one support staff and an overlapping sub-portfolio of cases. This overlap in rankings could be exploited to reach an overall consolidated ranking. Based on the interpretation of the explications given for each ranking, the consolidated ranking was subsequently converted into two groups (sets): ‘Being a member of the group of relatively high-ranked cases’ and ‘Being a member of the group of relatively low-ranked cases’. Only a few cases could not be properly ranked and have been coded as fuzzy sets.
Second, we had to find appropriate context conditions. The choice of conditions in the analysis needs to be guided by theory as well as previous empirical studies (Befani et al., 2007; Rihoux and Ragin, 2009). The first workshop with the team of IDH Farmfit’s business analysts, during the inception phase in 2022, had shown that they mostly mentioned motivation-related factors when asked why some projects were more successful than others in changing the business model. However, managers of contract farming schemes may have good reasons not to follow up advice from the coaches, even when they are psychologically motivated to do so. We therefore introduced the COM-B model (Michie et al., 2011), described earlier, in a subsequent workshop to make an inventory of potentially relevant contextual conditions. Subsequently, the monitoring and evaluation (M&E) staff in IDH Farmfit suggested administrative data points that could function as proxy indicators for these identified conditions. Ultimately, the support organisation could provide information for almost all cases on 13 conditions that covered the capability-space, opportunity-space and motivation-space in which business owners enacted on the business advice. Each of these 13 conditions had a proxy indicator for which data were available on most cases in the data set (see Table 2).
Conditions used in the portfolio analysis.
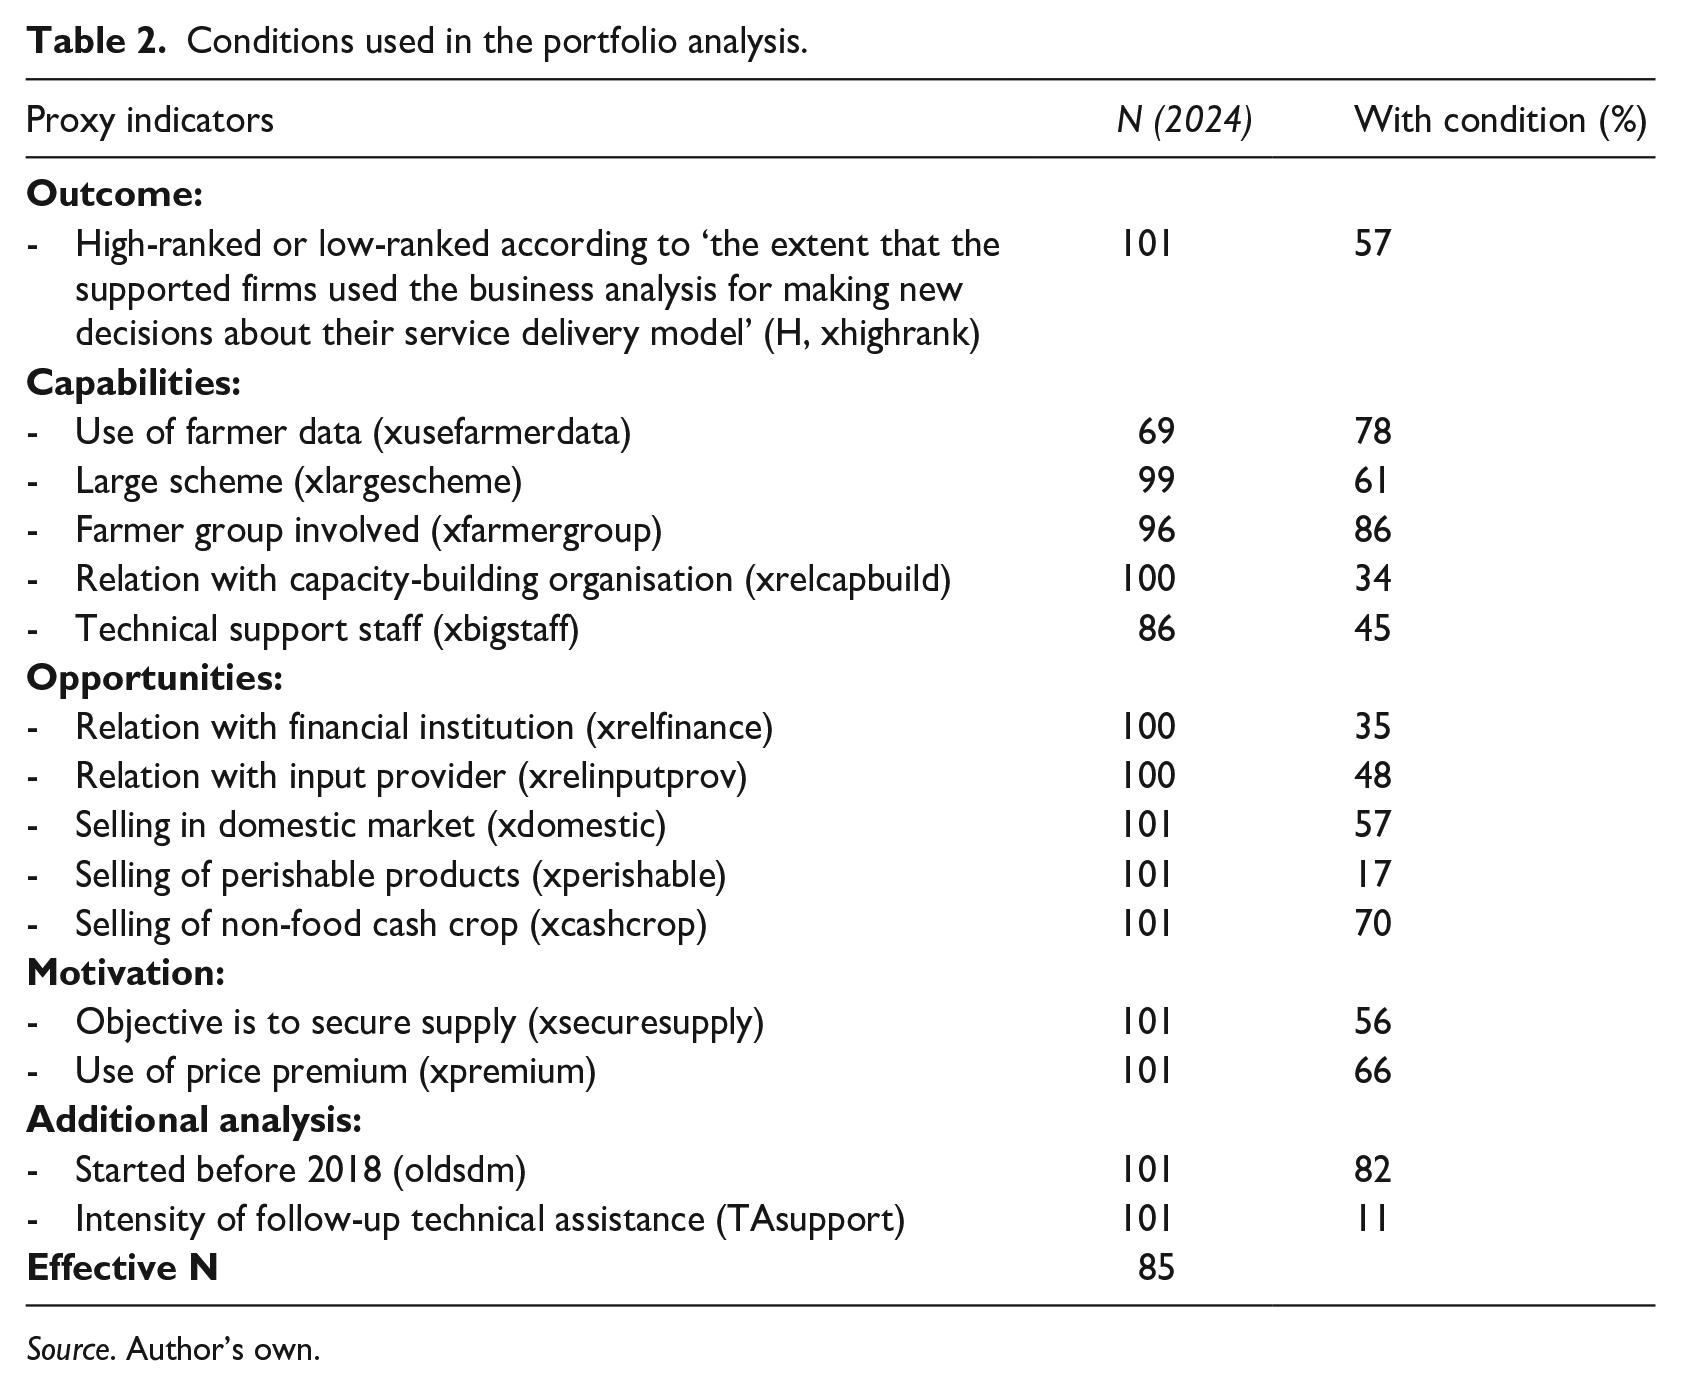
Source. Author’s own.
Causal attribution
The data set used to detect causal patterns was the same for both types of analyses reported in this article – the logistic regression and the truth table analysis in QCA.
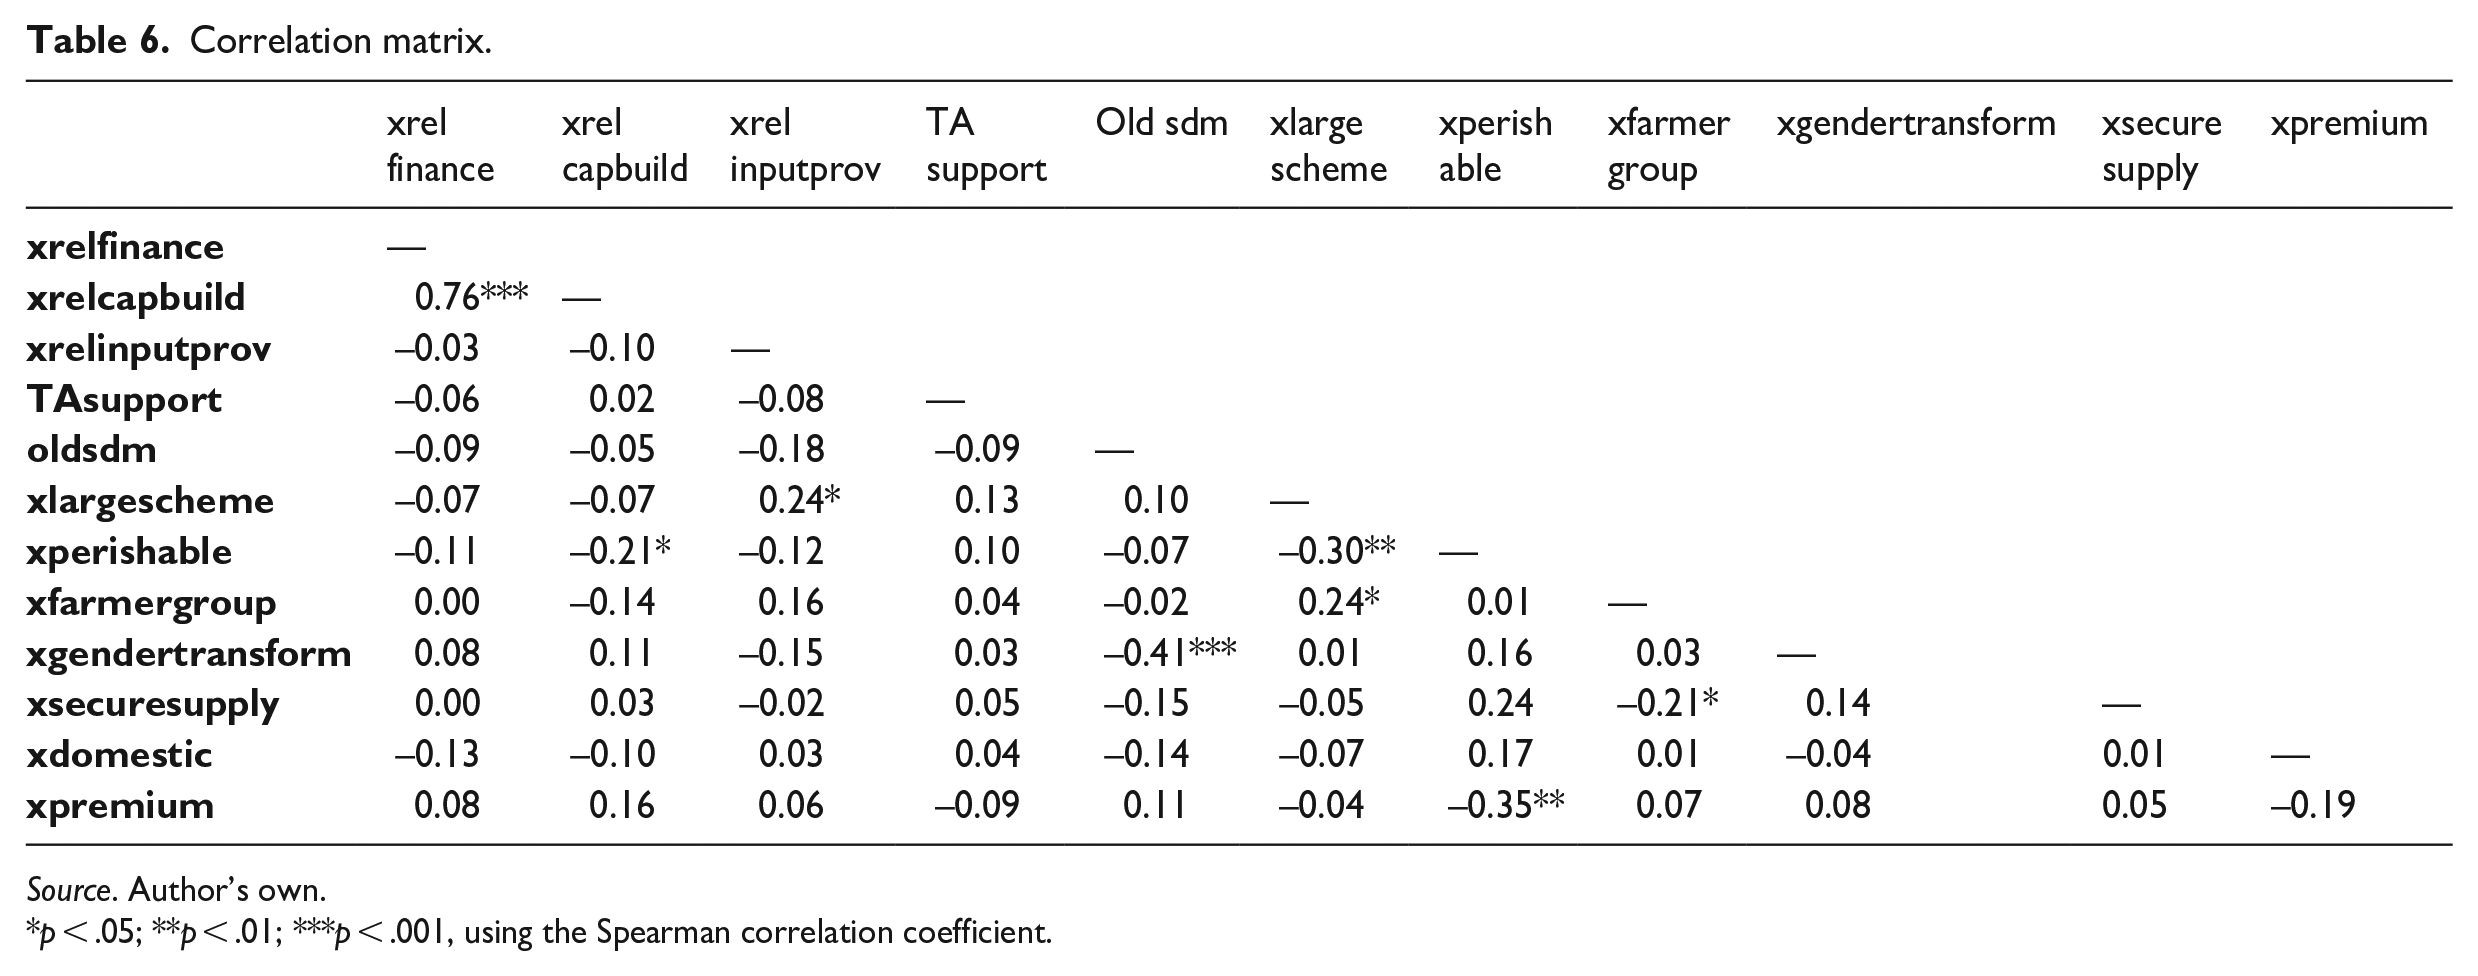
Before we performed the regressions, we checked whether the data met the assumptions for the data in the regression. Table 2 shows that the conditions xusefarmerdata and xbigstaff had relatively large shares of missing data, which lowers the effective N for pattern detection. We therefore decided to exclude these two variables from the pattern detection exercise. Moreover, the correlation matrix showed that some conditions are highly correlated (see Annexe 1, Table 6). The conditions xperishable, xcashcrop and xpremium are highly correlated, which suggests that we can only use one of them in our regression. Similarly, xrelcapbuild and xrelfinance are highly correlated and only one of them could be included in the regressions. We decided to keep xperishable and xrelcapbuild in the regressions that we present in this article for having the most straightforward interpretation and leave out xcashcrop and xrelfinance. However, the strong correlation between xrelcapbuild and xrelfinance (Annexe 1, Table 6) was one of the meaningful patterns that we discussed in the workshop with implementing staff.
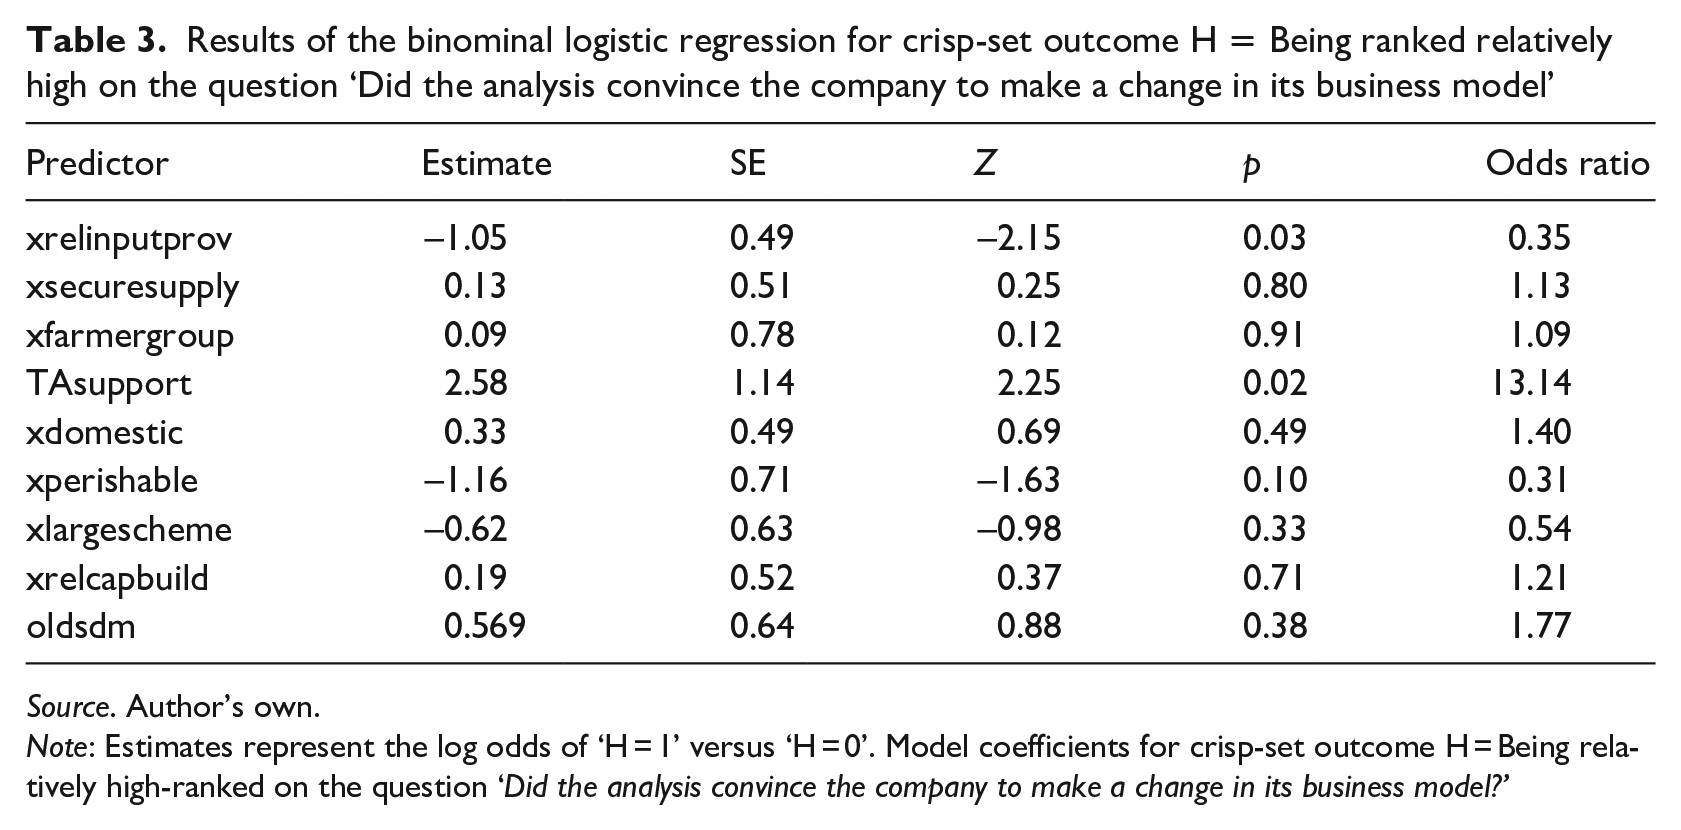
Through the logistic regressions, we aimed to find conditions that showed a strong correlation with the outcome of being relatively more successful. However, for the logistic regressions, we had two options: one was to use an ordinal logistic regression using information embedded in the fuzzy-set scores in the outcome condition (fuzzy-set outcome variable xhighrank) as ordinal values; the other was to calibrate the outcome condition as a crisp set and apply a binominal logistic regression (crisp-set outcome variable H). Both regressions yield similar results, though with slightly different coefficients, p-values and odd rates. We show the results of the binominal regression in Table 3. The odds ratio indicates how much more likely the positive outcome (being ranked relatively high) was for cases that had the condition compared with cases that did not have the condition.
Results of the binominal logistic regression for crisp-set outcome H = Being ranked relatively high on the question ‘Did the analysis convince the company to make a change in its business model’
Source. Author’s own.
Note: Estimates represent the log odds of ‘H = 1’ versus ‘H = 0’. Model coefficients for crisp-set outcome H = Being relatively high-ranked on the question ‘Did the analysis convince the company to make a change in its business model?’
The regression analysis showed that cases that had been supported more intensively with technical assistance (TAsupport) were much more likely to be ranked high on the outcome (odds = 13) – which is not entirely surprising. However, this more intensive support only concerned 11 of the 101 cases (see Table 2). Having an input supplier involved decreased the odds of success by almost three times (odds = 0.35). The condition being active in a perishable crop (xperishable) showed a similar negative association, but the statistical significance is weaker (p > 0.10). Surprisingly, considering our initial hypothesis that farmer organisations played an enabling role in contract farming arrangements, the regression results showed that working with an existing farmer group or having a capacity-building organisation involved did not significantly influence the odds for being ranked relatively high.
To refine the analysis about the relevance of farmer organisations for the programme’s effectiveness, we continued the pattern detection with the truth table analyses in QCA. To find candidate causal configurations, we searched the truth table for relatively consistent rows and reflected on the causal mechanisms that could explain these configurations. The analysis was done iteratively with different sets of conditions, all including xfarmergroup as part of the set. Most analyses did not yield a clear pattern; most rows had both successful and unsuccessful cases. But we found one model that reflects a pattern that resonated with our professional experience about contract farming.
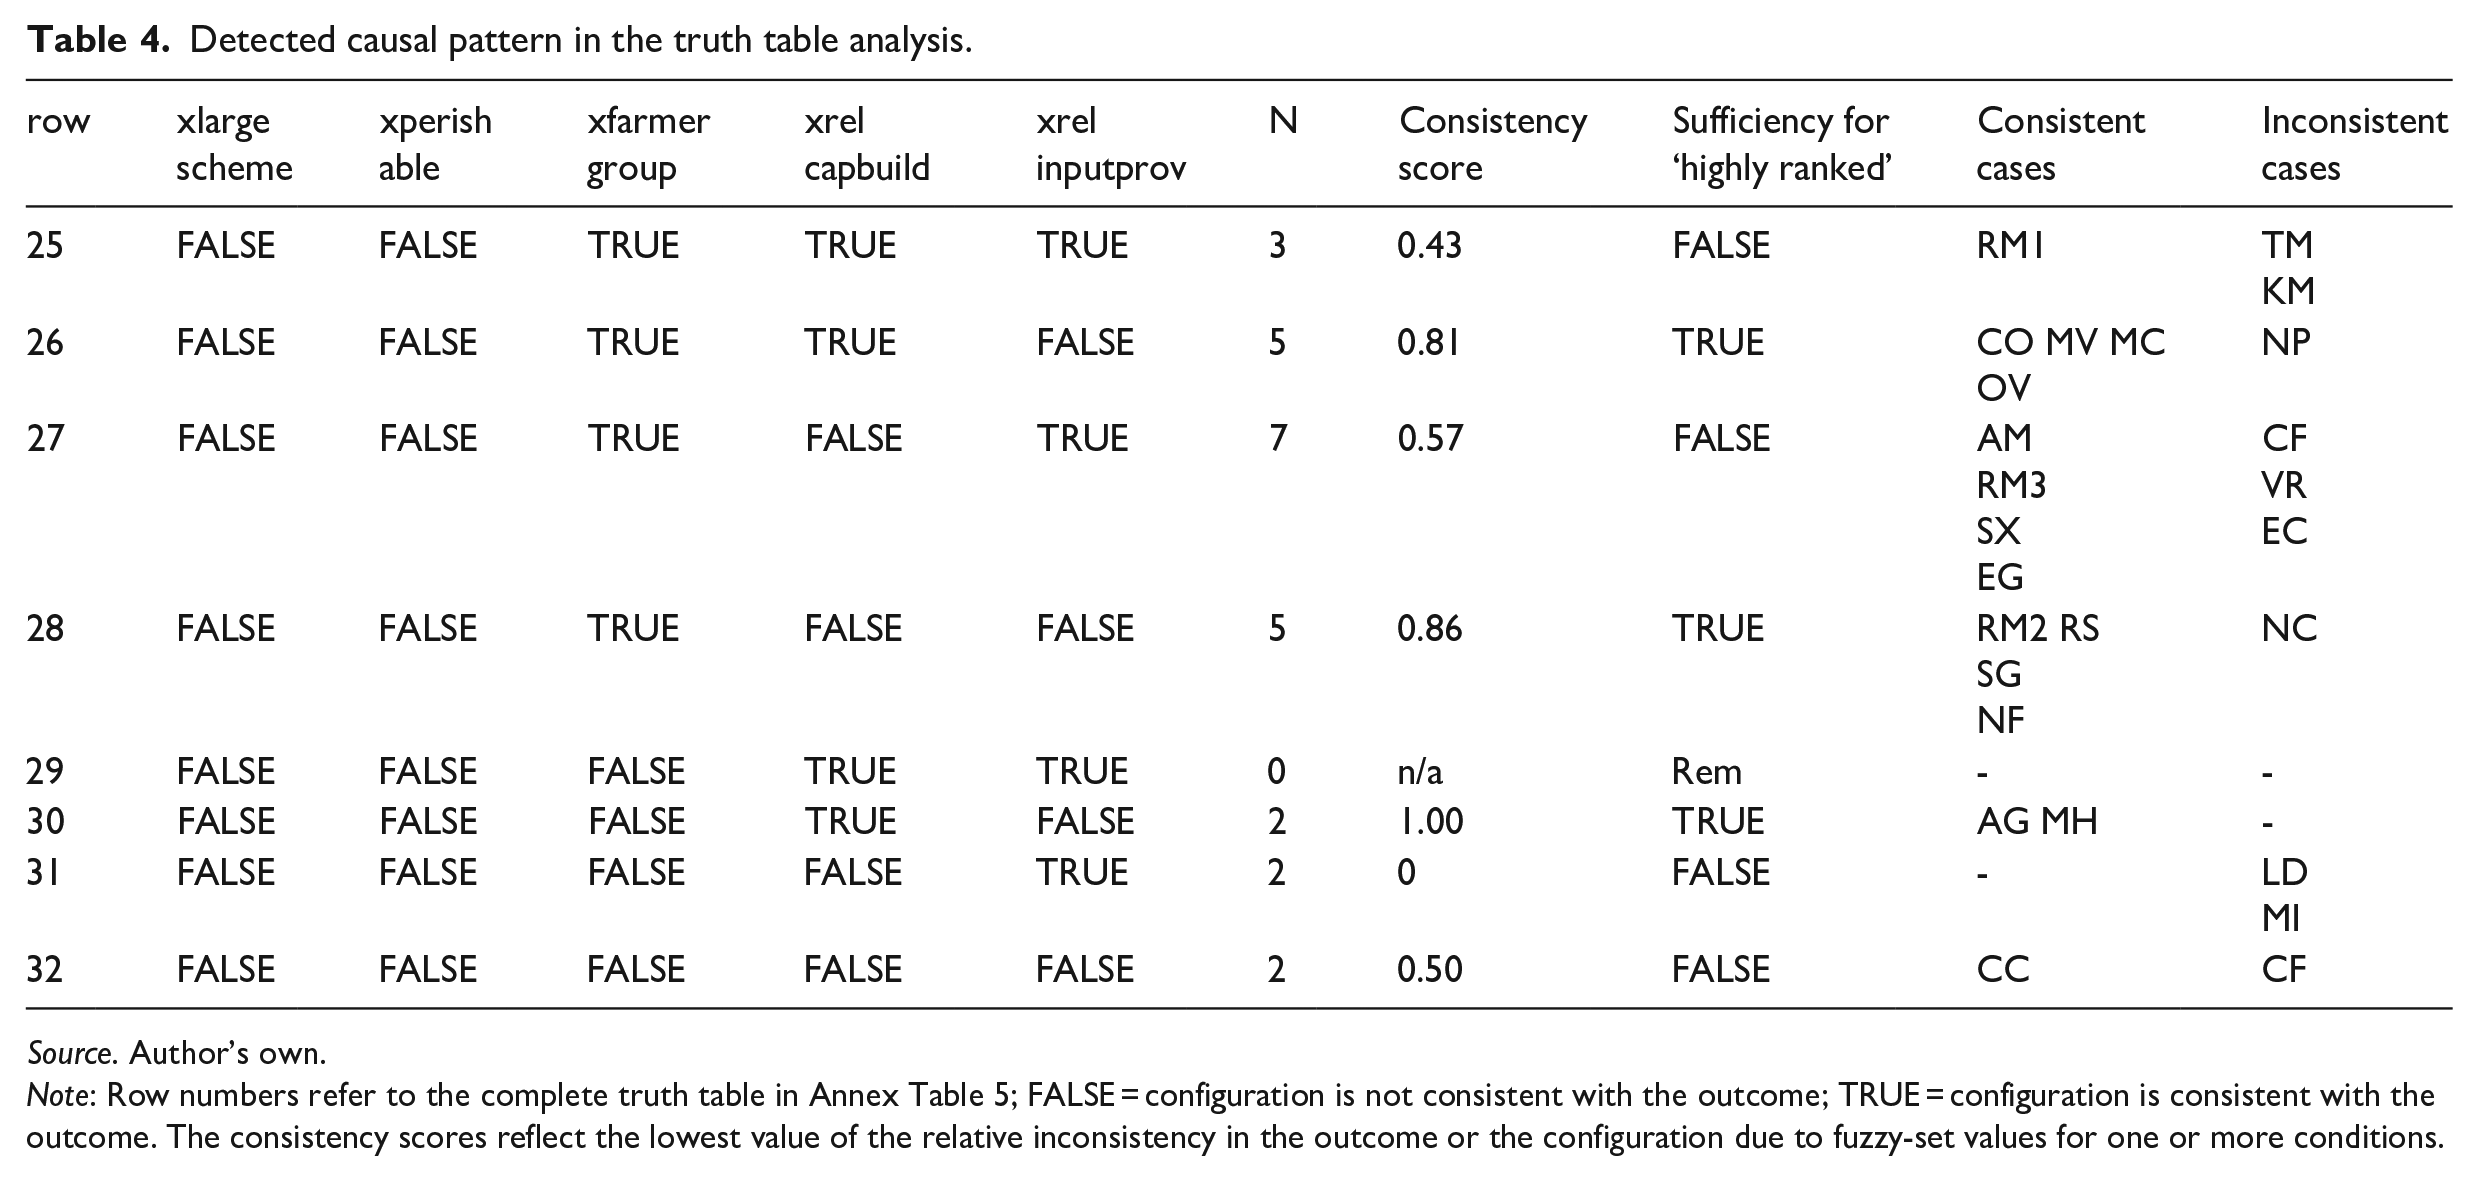
The truth table of this model (see Annexe 1, Table 5) has 5 conditions and therefore 32 rows. Twelve of these rows are without empirical cases (see Annexe 1, Table 5 for the complete truth table). Table 4 shows the five conditions and the four truth table rows that cover the smaller companies working in non-perishable products and without input providers, and that shows a high consistency score with the outcome ‘being highly ranked’. The configurations suggest that in the context of small companies working without an input provider and in non-perishable crops, to be successful these cases had to have either a farmer organisation involved or an existing relation with a capacity-building organisation. The three rows 26, 28 and 30, which are consistently related to ‘being relatively high-ranked’, are each covered by multiple cases, which gives sufficient empirical support to select them as a candidate causal explanation. Of course, it is not an iron law; there are some inconsistent cases, but they are far outnumbered by cases that are consistent with being highly ranked.
Detected causal pattern in the truth table analysis.
Source. Author’s own.
Note: Row numbers refer to the complete truth table in Annex Table 5; FALSE = configuration is not consistent with the outcome; TRUE = configuration is consistent with the outcome. The consistency scores reflect the lowest value of the relative inconsistency in the outcome or the configuration due to fuzzy-set values for one or more conditions.
More important from a realist evaluation standpoint (Pawson, 2024) is the substantiation of the causal mechanism behind this configuration: do we know/understand the mechanisms that would make all ingredients necessary for the causal recipe to work?
To understand the causal mechanisms triggered in this configuration, we use Mackie’s notion (Mackie, 1974) of INUS conditions – conditions that are
The inclusion of non-perishable crops and small companies resonated with our theoretical knowledge. Companies that are active in non-perishable products are more likely to rely on supportive social capital, such as farmer organisations, instead of governing the relation with supplying farmers directly, and farmer groups are, therefore, less common in vegetable production (Jia and Bijman, 2013). Direct coordination of production by the procuring firm through supervised contract farming appears as a preferred governance modality in perishable crops where quality and timeliness of deliveries are more important (Minot and Sawyer, 2016). With non-perishable products, the risks of side-selling are bigger than for perishable crops due to the possibility of the farmer delaying sales, at least for part of the produce, waiting for a better deal from a trader or other company, not necessarily the one that provided the resources. This inherent tension is a key characteristic of coordination and collective action in agricultural value chains (Bijman et al., 2011; Mujawamariya et al., 2013; Staatz, 1983; Sykuta and Cook, 2001).
A company that decides to supply inputs for non-perishable crops might be eager to find additional governance mechanisms to contain side-selling. The involvement of a farmer organisation or a capacity-building organisation may provide the company with the organisational social capital to do so. The absence of an input provider in the setup of the contract farming arrangement seems, thus, also a valid INUS condition. When an input provider, not the firm, provides inputs, the risk to the company in changing the business model (expanding pre-harvest service delivery) is far lower than when the firm provides them directly.
The inclusion of being smaller as an ingredient in the causal recipe is less straightforward but may point to the higher risk of side-selling due to their relatively low purchasing volumes in comparison to traders that also source from smallholders in the same geographical area. In the larger schemes, farmer organisations or capacity-building organisations are also present. However, the corresponding truth table rows (8 and 9 in Annexe, Table 5) show that their consistency with the outcome ‘being highly ranked’ is too low to consider them a meaningful causal configuration.
All in all, the revision of the conditions gave us sufficient reason to present this configuration as a plausible causal configuration. The combination of conditions could be explained by a common mechanism that explains why the companies are more eager to implement more smallholder-inclusive business models: the risk of side-selling needs to be contained.
At endline, the evaluation had resources to conduct six case studies that made it possible to illustrate and ground the insights by interviewing (remotely) representatives of some of the companies that benefitted from the business analysis and technical assistance. One of the interviews was with the manager of the company Coscharis Farms in Nigeria, which processed paddy rice; it was covered by one of the rows in Table 4 that showed the configuration of having both a farmer organisation and a capacity-building institution involved (marked as case CO). In the interview, the manager expressed the importance of local social capital for implementing the recommendations of the business analysis. It turned out that the company operates two different sourcing and service delivery models, one of which is a so-called in-grower model, whereby the company opened up its own land to smallholders and medium farmers to grow paddy rice and provided them with seeds and ploughing services. In this model, they worked with a capacity-building organisation to get the smallholders organised to become in-growers, while the medium farmers came directly to the company. The manager indicated that:
One of the recommendations on how the farm could become more efficient and effective was also to ensure that we utilise the entire farm and that was by bringing in in-growers . . . Many types of in-growers we have . . . [In-growers] pay for the services and have a supervisor within the field who looks after it on a daily basis . . . So we spoke to [the capacity-building organisation] and they encouraged the smallholder farmers to [also] come into our farm and operate as in-growers . . . We talk about 200 and something hectares that [they] supported [of a total of 1,300 that is managed by in-growers].
Instead, the out-grower model relies on cooperatives that were set up in village meetings led by religious leaders. In the words of the owner of the company:
The in-grower model works very fine because they are inside our own farm. The out-grower model is loose somehow, because of side-selling . . . The cost of maintaining these gentlemen, [to have them] pay me back, it is not very easy to do . . . because you cannot tell a farmer, ‘because I have trained you, because I have employed an extension agent in your community’ . . . You know, it is easier to give people [support] within a cooperative society than to give individuals that are on their own (Source: Interview with Chinedu Okere, owner of Coscharis Farms).
Strategy implications
The sense-making workshops with the IDH Farmfit support staff confirmed that the configuration described by the terms was recognised as contexts where they perceived their support as being more effective: being small, having local supporting partners. This led to internal discussion about whether this would be a reason to focus on these ‘easier’ cases. Somewhat surprisingly, most participants indicated that they did not consider it right to target the support exclusively to companies that have a higher likelihood of success. At endline, though, a follow-up programme by IDH (AgriGrade) was explicitly directed to the contexts where both companies and farmer organisations were involved in the value chain, with support to be provided to both, not the company only. This was influenced by many other considerations, but our portfolio analysis and sense-making workshops have plausibly played a contributory role in developing this new strategy.
Conclusion
Because of IDH Farmfit’s support modality of data-driven coaching, we had access to a relatively large amount of data on the characteristics of each case in the portfolio. IDH Farmfit uses this information to understand the performance of the business models against multiple indicators on the Farmfit Insights Hub (IDH Farmfit, 2024b). Nevertheless, for the case-based comparative analysis we had to construct a single overarching outcome to compare effectiveness. We used the tacit knowledge of implementing staff to get an outcome that reflects their perception of the relative success of those projects that they were knowledgeable about. By aggregating these rankings into a crisp-set outcome that indicates which projects are relatively more successful than others, we could extract useful insights. Using statistical and case-based comparative analyses, we could detect contexts where the support provided was more successful. These insights are generated through an iterative and abductive process of data crunching and causal explanation in a methodological bricolage: pragmatically combining elements of methods from different research paradigms (Aston and Apgar, 2022). The use of data set analytical methods in case-based comparative analysis is an accepted practice in realist social science (Brady and Collier, 2004), even when the realist’s mechanisms-oriented causal explanation typically relies more on qualitative data, where the incentives for behaviour are better described (Renmans and Pleguezuelo, 2023; Westhorp and Feeny, 2024).
With the truth table analyses, we detected one particular meaningful pattern that also nicely illustrates the difference between variable-based and case-based comparative analysis in the portfolio analysis. The role of farmer organisations seemed unimportant according to the regression results but proved a key ingredient for success in small schemes involving non-perishable crops when there was no input provider involved, as detected in the truth table analysis. Figure 3 shows this plausible causal configuration with the key capabilities and opportunities needed to trigger the motivation of the company to invest in enhanced input and service delivery to smallholder farmers.
The selected causal configuration with the realist causal explanation.
The main analytical challenge in the explorative pattern detection exercise was the ‘art to discard’: retain only those patterns that have a causal explanation. Deciding which pattern is meaningful and which can be discarded as spurious, or accidental, requires that the analyst had sufficient knowledge of the decision-making process in the supported companies; the analyst needed to understand the mechanism or mechanisms triggered in the configurations (the sets of contextual conditions) that could motivate or demotivate the company owner to decide on a more inclusive service delivery to farmers.
Especially in QCA, candidate causal configurations abound, and deep thinking about the plausibility and meaningfulness of each requires considerable analytical skills and theoretical insights. Therefore, at midterm, several of the detected patterns were discussed in workshops without necessarily having theoretical support. The example presented in this article is a pattern where the realist thinking and mechanistic causal explanation were applied most clearly. In deciding whether the pattern (a candidate causal configuration) could be considered a plausible causal configuration (a middle-range theory), we used insights from our previous academic and professional research. This process of theory adjudication and discarding spurious causal explanations based on the analyst’s experience and knowledge carries the risk of looking for confirmation of established beliefs. Therefore, we presented the results of the data pattern detection exercise in two sense-making workshops (at midterm and at endline) where the business analysts reflected on those patterns. Moreover, at endline, we could use case study interviews to gain more in-depth knowledge on the change processes and reflect with the company owners about one of the emerging insights of the evaluation: the need for the company to limit the risk of side-selling by involving farmer organisations as organisational social capital in their business model.
As well as exploring one of the causal link assumptions in IDH Farmfit’s theory of change (see Figure 1), the analysis helped to refine our insights into the role of farmer organisations in value chain development. The findings suggest that farmer organisations are especially important in projects that have a specific combination of conditions. On its own, and on average, the presence of farmer groups did not appear as causally relevant. However, under the conditions of being a small contract farming scheme, working in non-perishable crops and lacking an input provider to share the risks of pre-harvest resource-provisioning to smallholders, the presence of farmer organisations seems an important enabler of effectiveness. Practically, the portfolio analysis led to a recommendation to IDH Farmfit to look for local organisations that could be involved in the service delivery models as organisational social capital to reduce the risk of side-selling in embedded service delivery to smallholders.
Although each contract farming arrangement is complex and contextually embedded, we hope that this article provides some insights about the role of farmer organisations in sourcing and service delivery to smallholders that will help similar inclusive business programmes to design effective contract farming arrangements. Moreover, we hope that the article motivates other evaluators and social researchers to use administrative data and the perceptions of implementing staff about the relative success of projects to search for meaningful insights that help to make their support more effective, combining data analytical methods from different research paradigms with realist thinking in a methodological bricolage.
Footnotes
Annexe 1
Correlation matrix.
| xrel finance | xrel capbuild | xrel inputprov | TA support | Old sdm | xlarge scheme | xperish able | xfarmer group | xgendertransform | xsecure supply | xpremium | |
|---|---|---|---|---|---|---|---|---|---|---|---|
|
|
— | ||||||||||
|
|
0.76*** | — | |||||||||
|
|
–0.03 | –0.10 | — | ||||||||
|
|
–0.06 | 0.02 | –0.08 | — | |||||||
|
|
–0.09 | –0.05 | –0.18 | –0.09 | — | ||||||
|
|
–0.07 | –0.07 | 0.24* | 0.13 | 0.10 | — | |||||
|
|
–0.11 | –0.21* | –0.12 | 0.10 | –0.07 | –0.30** | — | ||||
|
|
0.00 | –0.14 | 0.16 | 0.04 | –0.02 | 0.24* | 0.01 | — | |||
|
|
0.08 | 0.11 | –0.15 | 0.03 | –0.41*** | 0.01 | 0.16 | 0.03 | — | ||
|
|
0.00 | 0.03 | –0.02 | 0.05 | –0.15 | –0.05 | 0.24 | –0.21* | 0.14 | — | |
|
|
–0.13 | –0.10 | 0.03 | 0.04 | –0.14 | –0.07 | 0.17 | 0.01 | –0.04 | 0.01 | — |
|
|
0.08 | 0.16 | 0.06 | –0.09 | 0.11 | –0.04 | –0.35** | 0.07 | 0.08 | 0.05 | –0.19 |
Source. Author’s own.
p < .05; **p < .01; ***p < .001, using the Spearman correlation coefficient.
Acknowledgements
The evaluation was implemented by the consultancy firm ADE (Evidence for Better Policy) based in Belgium, and IDS (Institute of Development Studies) based in the UK. The author of this article worked as a team leader with Bruna Almeida and Nastassia Leszczynska. We acknowledge the support of Martine de Zoeten in the ranking exercise at midterm and Marçal Obiols and Miquela Alomar at endline. And, of course, we acknowledge the business analysts and staff of IDH Farmfit who provided the data from their monitoring and evaluation system and mobilised their staff to make the rankings, especially Thomas Kockmeyer, Wouter van Monsjou and Mirza Čengić. Special acknowledgements are for Heidrun Kollenda, Kafui Adjogatse, Dave Boselie, Sara Coppola and Carolijn Gommans for coordinating the evaluation process in IDH.
Data availability
The data used in the analysis are available on request in anonymised form.
Declaration of conflicting interests
The author(s) declared no potential conflicts of interest with respect to the research, authorship and/or publication of this article.
Funding
The author(s) disclosed receipt of the following financial support for the research, authorship and/or publication of this article: The research was funded by the Sustainable Trade Initiative (IDH) in the Netherlands as part of the external evaluation of the Farmfit Africa programme, funded by the Bill & Melinda Gates Foundation and the UK Foreign, Commonwealth & Development Office.