
Abstract
Theory of Change diagrams are commonly used within evaluation. Due to their popularity and flexibility, Theories of Change can vary greatly, from the nuanced and nested, through to simplified and linear. We present a methodology for building genuinely holistic, complexity-appropriate, system-based Theory of Change diagrams, using Participatory Systems Mapping as a starting point. Participatory System Maps provide a general-purpose resource that can be used in many ways; however, knowing how to turn their complex view of a system into something actionable for evaluation purposes is difficult. The methodology outlined in this article gives this starting point and plots a path through from systems mapping to a Theory of Change evaluators can use. It allows evaluators to develop practical Theories of Change that take into account feedbacks, wider context and potential negative or unexpected outcomes. We use the example of the energy trilemma map presented elsewhere in this special issue to demonstrate.
Why a system-based Theory of Change?
Theory of Change (ToC) diagrams have been widely used as a framework for designing and framing the evaluation of interventions in complex settings. However, they have been criticised for being overly ‘linear’ in the way they represent the steps involved in delivering an intervention, and for not sufficiently reflecting the actual behaviour of complex systems (e.g. Ofek, 2017; Patton, 2010).
System maps generally, and Participatory Systems Mapping (Penn and Barbrook-Johnson, 2019) specifically, provide a broader and deeper understanding of the way complex systems operate. There is growing interest in using systems mapping as part of an overall evaluation strategy (Coryn et al., 2011), although as yet, the specifics of how best to do this remain under-developed. Unlike ToCs, system maps do not provide a clear framing of the way the intervention is intended to lead to impacts in a way that supports the design and implementation of an evaluation.
To explore how these two approaches can work together and complement one another, a team of complexity scholars and evaluation practitioners from the Centre for the Evaluation of Complexity Across the Nexus (CECAN) took a Participatory System Map that had already been created, and explored what was required to turn this into a useable ToC. This was a largely theoretical exercise, and we had not been asked to undertake an evaluation or produce a ToC of a policy or intervention.
Our assessment, as experienced practitioners, was that combining the two approaches could help to produce a ToC that more effectively represents the complexity, while at the same time embedding systems thinking into those involved in the evaluation from the start. The process described here is not a trivial one, and in many cases, a simple exercise moving directly to a ToC may be the most appropriate approach. However, this can, and we suggest should, be informed by the type of systems thinking introduced here.
The article first discusses the use of ToCs, then considers how systems mapping could help address criticisms, and then describes and reflects on the process we used to create a system-based ToC map using systems mapping.
Using ToC to deal with complexity
ToC was developed to help evaluators address the challenges of working on complex programmes in complex settings. It emerged from the work of a panel of evaluation experts (at the Aspen Institute Roundtable in 1995) who were seeking more appropriate methods to use in the evaluation of Comprehensive Community Initiatives (CCIs): multi-faceted, multi-level area-based programmes funded by the US government to tackle child poverty (Weiss, 1995). The panel was concerned that existing evaluation approaches were failing to generate useful or credible findings. The ToC evaluation strategy emerged as a development of earlier work on a theory-based approach to evaluation design.
The approach has proved successful and has been increasingly used both inside and outside the world of evaluation (Coryn et al., 2011; Ofek, 2017). It is recommended as the starting point (along with other forms of logic mapping) in the design of any evaluation (e.g. in the UK cross-government guidance on evaluation, HM Treasury, 2020). Drawing a participative ToC is seen as a useful way to bring together stakeholders involved in the design and delivery of an intervention to articulate its rationale and key steps in its delivery, and to surface assumptions that can be translated into hypotheses around which the evaluation can be designed.
ToC has had critics from its earliest days, when there were questions raised (Scriven, 1998) about whether evaluators needed to know why and how a programme worked, when the primary purpose was to demonstrate whether it worked. These criticisms have generally faded from view, but ToC diagrams are often still criticised as being too inflexible and linear, not fully representing the complexity of the programme or project under investigation (Ofek, 2017; Patton, 2010). ToCs have also been criticised for not giving sufficient attention to the wider context in which the intervention is taking place, and the nature of the interactions between the intervention and this wider context. For example, Valters (2014) notes a recurrent problem with ToCs that: “Organizations imply that change in a society revolves around them and their program, rather than around a range of interrelated contextual factors, of which their program is part.”
Similar criticisms are among those noted by Leew and Donaldson (2015) in their review of the use of theory (including use of ToCs) in the evaluation field. Concerns in published articles often included worry about the over-linearity of ToCs, and their failure to take into account connections with other policies and programmes or the wider institutional setting within which an intervention takes place.
Despite these criticisms, it is clear from the earliest papers (i.e. Weiss, 1995) that participants in the Aspen Institute Roundtable debates were fully aware of the complexity of the programmes they were studying, even if at that time they did not have terminology and concepts from the complexity sciences that are now beginning to be incorporated into evaluation thinking. In setting out the argument for a need for a new evaluation approach, Weiss (1995) notes the following “The attributes of CCIs that make them particularly difficult to evaluate include horizontal complexity, vertical complexity, the importance of context, the flexible and evolving nature of the interventions, the breadth of the range of outcomes being pursued, and the absence of appropriate control groups for comparison purposes.” (p. 4)
They were also acutely aware that the issues being faced within the communities in which CCIs were taking place were intimately related to other dynamics in their wider environment. However “Although most are designed with an appreciation for the need to draw upon political, financial, and technical resources that lie outside the community, there is a broader set of circumstances and events that may have a direct bearing on the success of CCIs but that CCIs have little power to affect.” (p. 4)
There have been many attempts over the years to address the limitations of an overly ‘linear’ approach to ToC diagramming (e.g. Davies, 2018; Ling, 2012; Mayne, 2015; Stroh, 2015). As Coryn et al. (2011) note in their extensive review of the use of ToC-based evaluations undertaken in 2009, “In earlier conceptualizations, numerous theorists . . . tended to favor linear models to describe program theories. In recent writings, others . . . have advocated for more contextualized, comprehensive, ecological program theory models. . . . intended to integrate systems thinking in postulating program theory, taking contextual and other factors that sometimes influence and operate on program processes and outcomes.” (p. 202)
Attempts to incorporate complexity features into ToCs can be thwarted by the context in which these are being used. Best practice guidance (e.g. in Hills, 2010; Vogel, 2012) recommends that ToC construction should be participatory, involving stakeholders who represent different perspectives and roles within the intervention: this might happen as the intervention itself is being planned, or when designing an evaluation or data collection framework.
This guidance also highlights that it is the process of drawing up the diagrams, not just the quality of the final product (the ToC itself), that is crucial to the development of an effective evaluation design. Attention, however, is often focused more on the diagram itself, which is commonly used as a communication tool for others. As Davies (2018) notes, usability requires that the ToCs are relatively simple and easy to read. Mayne (2004) also suggests that simple ToCs are often a ‘good enough’ representation of a ToC and lay the basis for a logical performance story. Or, as Mason and Barnes (2007) note, “ . . . we conclude that a ToC approach to evaluation should be understood less as an approach which tests the robustness of the ‘theory’ and its implementation, than as providing a framework within which it is possible to construct a narrative of the process of implementation and its consequences.” (p. 167)
A level of simplicity is also required because many stakeholders involved in the process of constructing the ToC, or reading about the intervention, will not have much familiarity with the language of complexity or how complex adaptive systems behave. Drawing up a ToC map can begin to introduce stakeholders to the fact that the delivery of the programme may be more complex than it initially appeared, and that overly simplistic assumptions about how it will generate change may need to be challenged. However, Alford (2017) notes that, “while the theory of change approach has done much to advance thinking beyond the kinds of linear, reductionist and rigid approaches to planning and management epitomized by the infamous logical frameworks, theory of change diagrams . . . lag behind these aspirations and end up encouraging linear, reductionist thinking.” (p. 1)
This linearity of the diagrams produced is in part due to the context in which they are produced, in which familiarity with logic models, outcome mapping and log frames, or the commissioning and management practices surrounding the intervention, as Alford (2017) notes, all encourage a highly linear approach to planning, delivering and evaluating interventions. While the idea of systems mapping is now being suggested in some evaluation guidance documents (e.g. HM Treasury, 2020; Taylors et al., 2019) for those working in complex settings or seeking to bring about system change, there is often little detail provided on how this should be done, or how this can help to support the design and conduct of the evaluation. This article hopefully provides one step towards remedying this gap.
Using Participatory Systems Mapping
Like ToC diagramming, Participatory Systems Mapping brings stakeholders together in a participatory exercise related to a specific policy or programme area. In the case of Participatory Systems Mapping, the task is to map the components of a system and how they are causally interlinked, usually over the course of one or more workshops. Many different systems mapping methodologies exist, for example, Fuzzy Cognitive Mapping (Penn et al. 2013), Dependency Modelling/Bayesian Belief Networks (Uprichard and Penn, 2016) and Causal Loop Diagrams and System Dynamics (Sterman, 2000). Here, we focus particularly on the specific method we and others have been developing and testing as part of the work of CECAN (CECAN, 2018). This approach involves the development of a causal model, or map, of a system developed by a set of stakeholders in an inclusive and participatory fashion. The difference of this method compared to the existing approaches mentioned above comes on two fronts. First in map construction, the emphasis is on individual system factors and their connections (as opposed to feedback loops in causal loop diagrams), in a way which allows cyclic maps to be generated (as opposed to Bayesian Belief Networks which are typically acyclic). Second, the approach uses a combination of network analysis and subjective information from stakeholders to underpin analysis, as opposed to quantifying the map, or turning it into a simulation model.
In practice, this involves teams of up to 12 people collaboratively constructing a causal map around a table with ‘post-its’, ‘white-board paper’ and pens. The map is made up of ‘factors’ (represented as nodes on the map) and their causal connections. Factors can represent anything as long as they are expressed as variables (i.e. they can go up and down, but they do not have to be directly measurable or already have data associated with them). Connections represent causal relationships, in a mathematical sense either: positive (i.e. an increase in one factor causes an increase in the next, or a decrease in one factor causes a decrease in the next); negative (i.e. an increase in one factor causes a decrease in the next, or a decrease in one factor causes an increase in the next); unclear (i.e. we believe there is a causal relationship, but we are unsure of its nature); or complex (i.e. the relationship depends on other factors, or is non-linear). Figure 1 shows an example, a system map of the bio-based economy in the Humber region focussed on energy production (Penn et al. 2013). This map was constructed by a range of stakeholders from industry, to local authorities, to non-governmental organisations. It demonstrates the importance for increasing bio-based energy production (the key outcome) of contextual social and political factors such as community acceptance of new industrial development and availability of skills locally, as well as vulnerability to external drivers such as fossil fuel price. Note that unlike other maps we discuss here, links in this map have been weighted by participants.
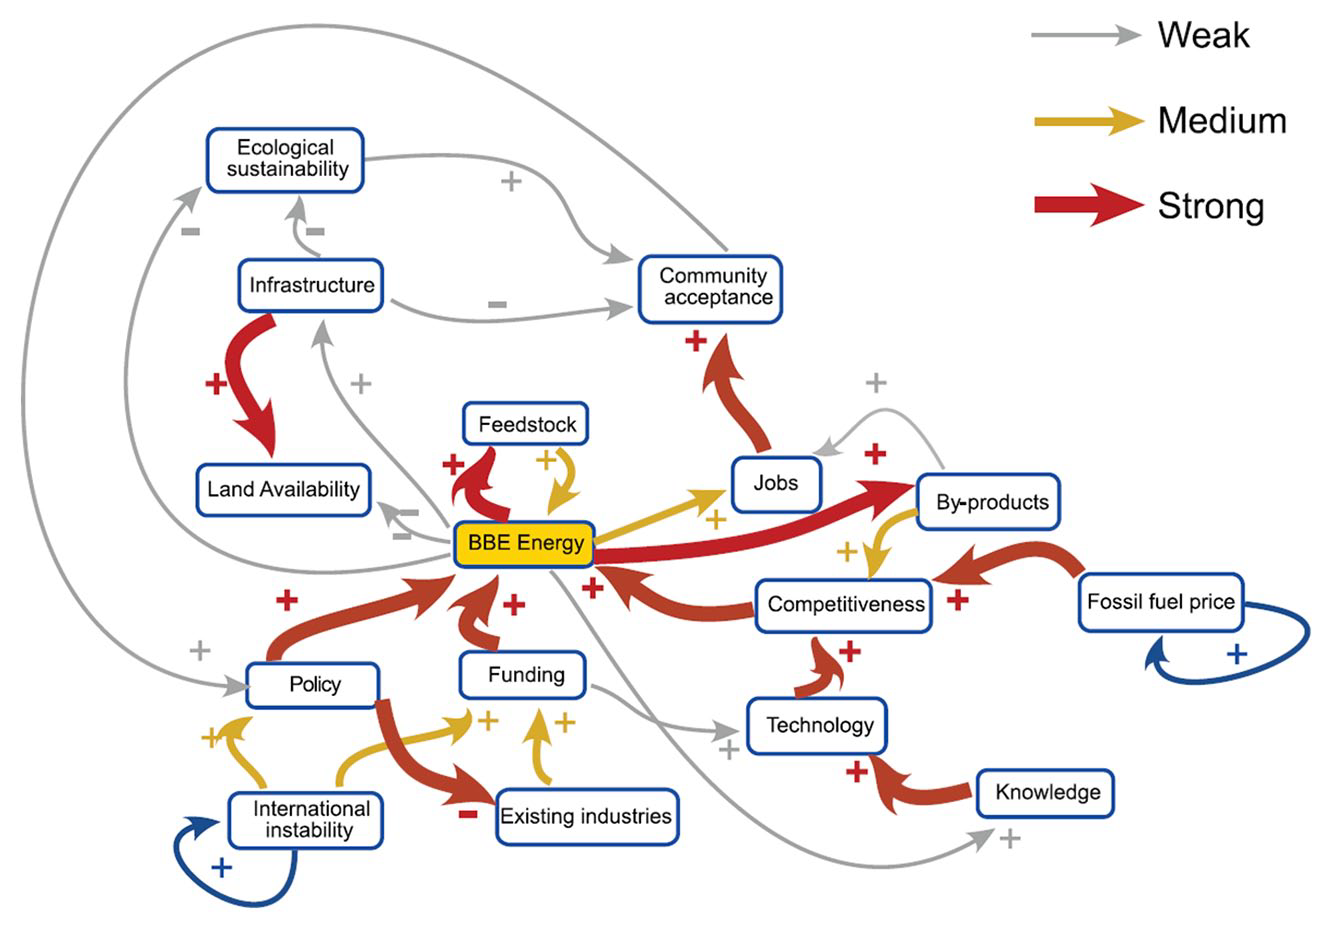
A system map focussed on energy production from bio-based economy in the Humber region (reprinted from (Penn et al. 2013).
This approach builds on and complements methods such as Fuzzy Cognitive Mapping (see Penn et al. 2013) and Dependency Modelling (Uprichard and Penn, 2016). The approach emphasises both: (1) a participatory approach and (2) a bespoke approach to analysis that uses stakeholders’ beliefs as key starting points, typically using simple visualisations (described below) to provide a means of exploring a range of questions about the system. Stakeholders’ beliefs can also be used as starting and reflection points for more formal network analysis to extract and provide actionable insights and narratives from larger, sometimes overwhelming, maps (see e.g. Penn et al. 2016).
The emphasis on stakeholder input means that the maps should always be built by as diverse a range of stakeholders as possible. The maps produced are intersubjective objects, in that they reflect the beliefs of the group of people that built them. They should not be assumed to be objective or comprehensive. A mapping process can give great value to those involved in its creation. Both the maps and their analysis are designed to capture complexity rather than simplify it away. The act of building a map can lead to important conversations that develop shared understandings and consensus. Maps are in effect interventions in a system in themselves, and can have a direct impact on peoples’ perceptions. Maps can also be analysed and presented to a wider audience.
A guide to running a mapping workshop and initial analysis is presented in Penn and Barbrook-Johnson (2019), a wider exploration of its use in evaluation is presented elsewhere in this special issue in Barbrook-Johnson and Penn (2021) and the example of the energy trilemma, which we use here, is also outlined in Barbrook-Johnson (2019) and Barbrook-Johnson and Penn (2018).
System mapping software
Systems mapping software is essential to the mapping process. Using software, the maps can be easily manipulated at each iteration, and can also be shared and worked on remotely. Available options include the following:
diagrams.net: easy to use and edit but does not allow automated analysis.
Gephi (Bastian et al., 2009): allows powerful network analysis but is less easy to use for manual map drawing.
Kumu.io: has reasonable functionality for map drawing and analysis but is not free if users want to make their maps private.
yED (https://www.yworks.com/products/yed): good functionality in both drawing and analysing maps.
NetDraw (Borgatti, 2002): free and is useful for network visualisation. NetDraw comes packaged with UCINET (Borgatti et al., 2002) which is focussed on map analysis.
Users’ choice of software should be driven by a combination of purpose, their familiarity with tools and a preference between using expert judgement (and thus preferring software with drawing ease) or layout algorithms (and thus preferring software focussed more on analysis) to drive choices and layout. Here, we used diagrams.net for its ease of use.
How can holistic system thinking help?
We propose that the explicitly whole-systems approach of Participatory Systems Mapping can do much to help overcome the critiques of ToCs discussed above. A number of authors have suggested that systems mapping (broadly defined) and ToC diagrams could be usefully integrated (e.g. Alford, 2017; Davies, 2018). They have generally discussed two possible approaches. First, integrating a ToC into an existing system map. This involves constructing a map of a given context using participants’ previous experience of the system to propose appropriate points for intervention and then tracing the path of the ToC through the map from intervention to outcome. This has the advantage of generating an intervention design and extracting a ToC from a whole-systems perspective, while allowing both the ToC and its context to be visualised in the same diagram. The second approach involves building system maps, or components thereof, to help to understand the ToC (e.g. Stroh, 2015), for example, by explicitly drawing on different types of feedback loop structures (e.g. reinforcing or stabilising) to unpick different kinds of processes of change.
We are proposing a third approach here (more closely related to the first). We start with an existing system map (or with an exercise to construct a map) that captures the wider complexity of the context, but then casts it into a more traditional ToC format. This makes it more recognisable and immediately usable to practitioners while retaining a whole-systems perspective.
Our approach, as presented here, also differs in that we are working in systems in which interventions have already been planned or begun and in which policies and policy interventions are included on, rather than drawn from, the map. Note, however, that the subjective network analysis developed for Participatory System Maps is specifically designed as a way to find system levers and hence also help in intervention design (see e.g. Penn et al. 2016).
The process of a Participatory Systems Mapping exercise is designed to focus on the whole system rather than on the programme or intervention first. The process starts with outcome factors and factors representing system functions important to different stakeholders. A brainstorming process is then used to identify any factors from any domain that are affected by or affect these focal factors. Only after a causal map has been constructed from these initial factors are the factors representing policies or interventions added in. Constructing a map this way allows us to avoid the programme-centric view that is a potential weakness of a ToC and visualise and understand interventions as acting on extant complex systems with their own rich interactions and dynamics.
By prompting participants to think freely about all factors which may affect not just outcomes, but also other important system components, we broaden the scope of what is mapped to include the external context and different interests of multiple stakeholders. This allows us to capture context which may influence or be influenced by interventions in unexpected ways and ensures that the map covers what matters to system stakeholders and what influences that.
The form of a Participatory Systems Mapping process, which does not proceed by thinking through causal paths from intervention to outcome, but proceeds in a more free-form manner, considering interactions between all factor combinations, means that the map emerging is more interconnected and less linear in structure. In particular, we ask questions during the process to ensure that direct and indirect feedbacks between factors, multicausality and other rich connection types are captured.
Although setting the system boundary for a mapping exercise is an important part of the process, we make an effort to capture potential external drivers of change. Despite the concern that external factors are not under the influence of the programme managers and stakeholders and are thus irrelevant or disheartening (Weiss, 1995), this approach helps develop an understanding of what external change may disrupt efforts and what may be needed to buffer against this. This can be enabling when trying to understand why interventions may not proceed as planned. In the system-based ToC approach described below, we attempt to balance a focus on the direct concerns and influence of the programme, with actionable insights and broader awareness provided by the Participatory Systems Mapping.
Mapping a course from systems mapping to ToC
The premise we explore in this article is that we would arrive at better ToCs, which more effectively support evaluation in complex environments, when we
Begin with systems mapping, and then
Recast the system map into the form of a traditional ToC.
We believe that starting by building a system map should result in a richer, more comprehensive ToC, which more effectively represents the characteristics of the complex adaptive system, including, for example,
Providing a fuller representation of external contextual influences that might impact (enhance or impede) the path from action to outcome.
Indicating areas in which a policy may have impacts (positive or negative) in areas not immediately related to its intended outcomes.
Highlighting feedbacks between outcomes or other factors, and other factors/steps along a pathway that can amplify or damp down outcomes and negative consequences resulting from the policy and its implementation.
Highlighting levers that can be used to enhance outcomes – and hence supporting policy design.
This approach should help embed system thinking and a more holistic view of an intervention and the context in which it is being introduced, in the awareness of everyone involved in the development, delivery and evaluation of the intervention.
Recasting the system map as a ToC then involves rearranging and enhancing the system map to reflect the typical structure of a ToC, that is,
Indicating a ‘logical’ sequence of steps from input to outcome, in a form that is familiar to many practitioners and commissioners, who are used to working with this format to help guide and express the findings of evaluations.
Including activities and inputs, interim steps on the way to outcomes and impacts, which may not be included in the system map, but are important elements to consider in an evaluation.
Articulating key assumptions and uncertainties.
Looking at the system from these two different perspectives helps ensure that the final ToC forms a sound basis for shaping an evaluation. The systems mapping process can initially appear somewhat daunting to those wishing to achieve some kind of change, as it can highlight the many different dynamics at play, many of which may affect the outcomes sought, but over which they have little influence. However, drawing up a system map can provide insights into the way different factors work together to contribute to, or impede the implementation of a specific change. The ToC, in contrast, spells out more clearly the pathway to action, that is, ‘what I (working with my partners) can do to affect change’.
Turning the complex view of a system provided by system maps into something actionable as the basis for an evaluation can be difficult. In the rest of the article, we describe the concrete steps that we took, and what we learned from the process, building on the team’s own experience in both building Participatory System Maps and developing ToCs, to develop a methodology to build a system-based ToC.
The process we followed
Overview
The team working on this exercise has expertise in complexity science, Participatory Systems Mapping and evaluation, and in the use of ToCs as the basis for guiding evaluations and capturing and communicating the results. Two of us had already worked in a participatory process with analysts from a government department to generate a system map describing the energy trilemma (described briefly below and in another article in this special issue). Starting from the map already produced and published, we began to identify, test and refine the steps required to create a ToC.
At each step,
We reflected on the difficulties we encountered and the learning about the system and the ToC the process revealed.
We challenged how we made decisions, for example, how we decided on simplifications to the system map, and whether these were sufficiently robust.
We were not seeking to perfect the ToC, since testing and refining a ToC would be the task of the evaluation itself. Our aim was to develop a methodology that would generate ToCs that were sufficiently robust to form the starting point for an evaluation, and that would capture key elements of complexity, such as important feedback loops and the wider context, as well as any trade-offs and potential negative or unexpected outcomes resulting from an intervention.
The activity was carried out across three group meetings between May and December 2019 with individuals working on various aspects of the task between meetings. Finally, we carried out a review of the process and the ToC against quality criteria for ToCs derived from Vogel (2012).
A Participatory System Map of the energy trilemma
The system map we used as a starting point was of the energy trilemma system (Figure 2), which is also presented in Barbrook-Johnson and Penn (2019, 2021). This was chosen because it was (1) a map already developed with stakeholders available in the public domain; (2) a complex policy area; and (3) a policy area we have some experience of working in.
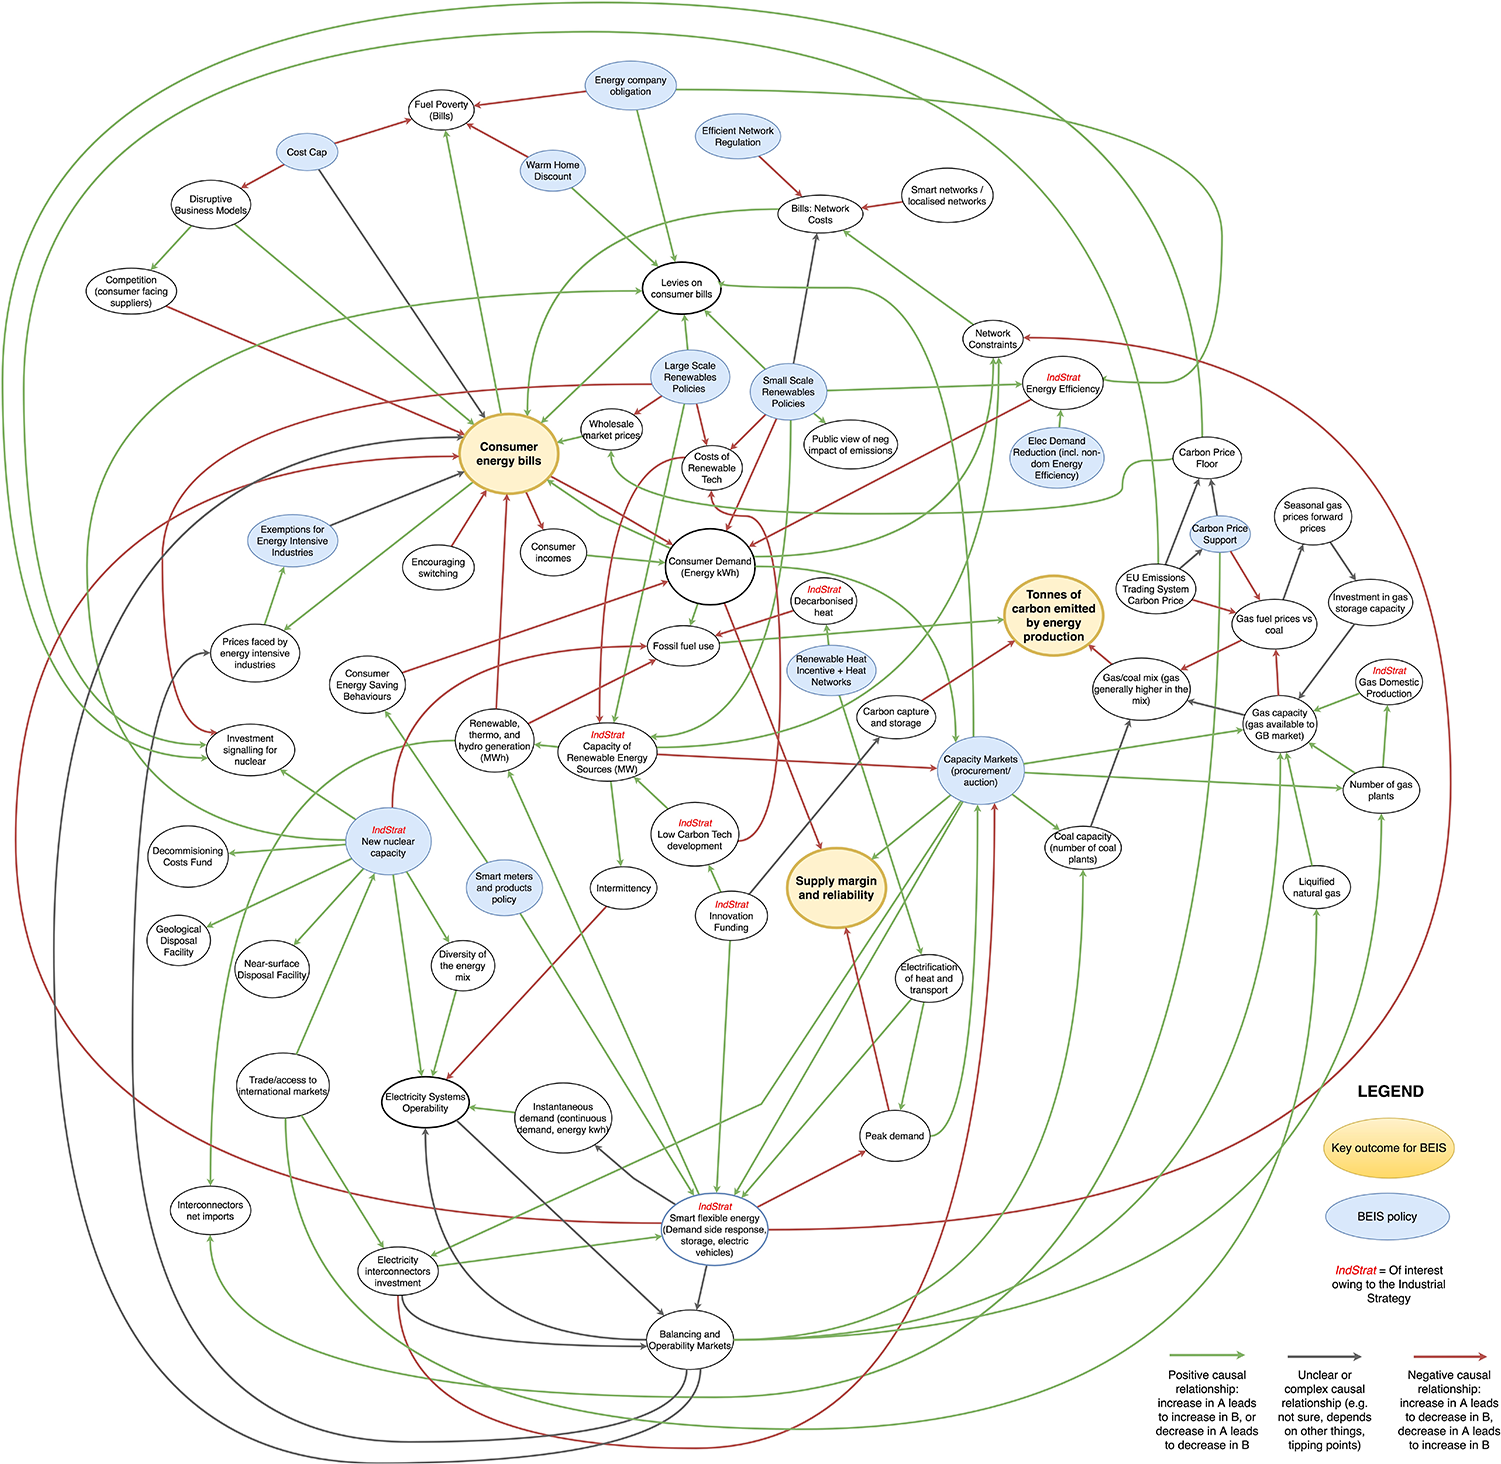
A system map of the energy trilemma.
The energy trilemma describes the interaction in the energy system between sustainability and emissions, affordability and prices and security of supply. The sheer number of programmes and policies with close interaction and overlap in this area has led to a crowded and complex policy landscape with a range of potentially complementary and conflicting aims. CECAN and the UK Department for Business, Energy and Industrial Strategy (BEIS) worked together to build a richer understanding of this complex area by developing a Participatory System Map of the energy trilemma. The map and process aimed to highlight the impact of BEIS activities on the three ‘legs’ of the trilemma (emissions, prices and security); common or contradictory aims and mechanisms among policies; and uncertainty and evidence gaps. The map is made up of the three ‘legs’ of the trilemma (highlighted in yellow), the causal influences stakeholders perceived as affecting or affected by these three factors (white nodes) and the specific BEIS policies that operate in this area (light blue). Causal connections are denoted by arrows. Factors which were of particular strategic interest because of their importance to the UK Industrial Strategy (HM Government, 2017) are marked with ‘IndStrat’.
The map was created in one large half-day workshop in November 2017, and four smaller group sessions in December 2017, with staff at BEIS from appropriate policy and analysis teams. The first workshop initially mapped the system, while the smaller group sessions were used to sense-check the map. Follow-up sessions were held with key individuals throughout 2018 to further refine the map.
The process started with stakeholders agreeing a factor for each of the three legs of the trilemma, and then building the map from there. Importantly, the context and other parts of the system were put into the map first and only then were specific BEIS policies added.
Recasting the system map to illustrate the ToC
This section describes in some detail the steps we went through in recasting the system map into a ToC and draws out some key insights that the process generated along the way. A broad overview of our conclusions and reflections on the process is provided at the end of the article.
Choosing a focus
If this exercise had been undertaken as part of the development of an actual evaluation plan, we would already have had a clear focus in terms of what action (policy, programme or project) was to be evaluated, and what impacts were being anticipated. However, as this was a theoretical exercise, the first task was to select a focus for the ToC.
Pragmatically, we selected the policies that were most directly related to the outcome of reducing the costs to consumers (i.e. as in addressing fuel poverty). This was seen as requiring less specialist domain knowledge than the other two outcomes, and one team member had experience drawing up ToCs for a policy area related to this – smart meters (Darby et al., 2015).
We therefore defined the focus of the ToC as the following:
Policy interventions aimed at reducing domestic consumer bills and addressing fuel poverty.
The next step was, through an iterative process, to identify those factors and causal links in the system map that we believed were most significant in terms of this outcome, and which should therefore be retained in the ToC. This involved the following:
Close examination of the map, with use of formatting, such as colour coding of policy nodes to indicate which outcomes these were intended to address, and highlighting key connections in bold;
Rearrangement of the factors to begin to reveal the key causal pathways leading from relevant policies to fuel bills and fuel poverty (the outcome factors) – as far as possible, we aimed to develop a structure that would be familiar to evaluators, with the policies at the left-hand side and outcomes of interest at the right.
For this exercise, the process of selecting the key causal pathways relied largely on the expert judgement of the team. We first moved those factors, and connections that were directly related to consumer costs via short causal pathways, to the centre of the map. We then examined other pathways moving those that, in the judgement of the team, would have little material impact on consumer costs to the top and bottom of the map. This left the potential paths from the interventions towards consumer cost impacts that would form the initial ToC for the evaluation more clearly visible in the centre of the map.
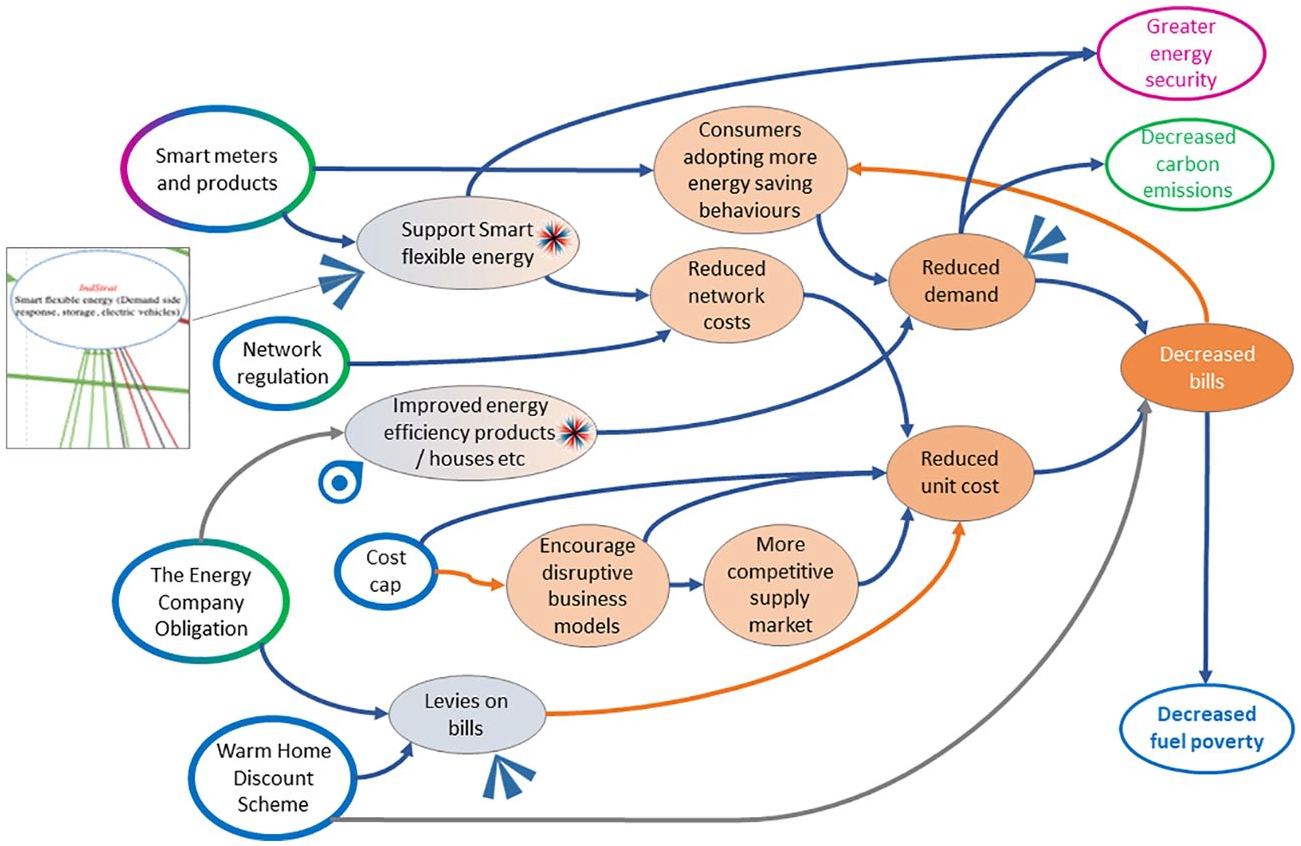
Figure 3 illustrates the results of the initial restructuring process. Figure 3(a) shows the restructured map; Figure 3(b) focuses in on the central section showing the causal pathways selected for the ToC.
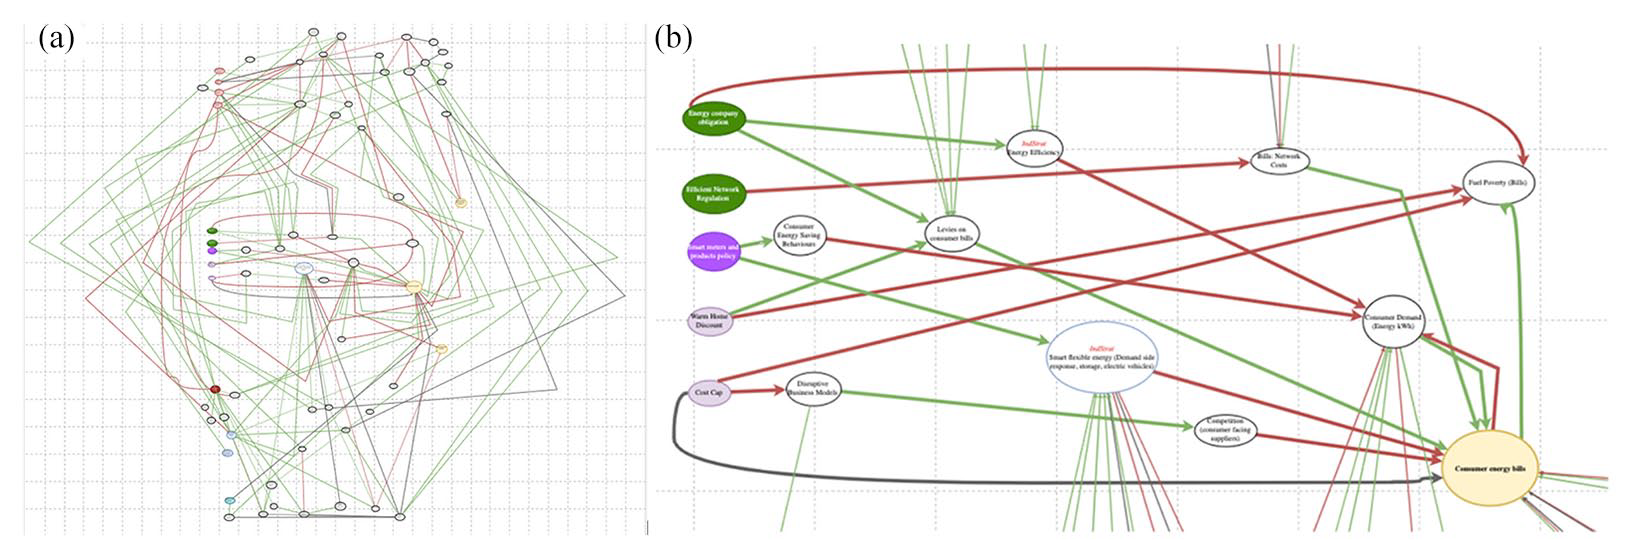
Restructuring the system map. (a) shows the restructured map and (b) focuses in on the central section showing the causal pathways selected for the ToC.
Developing the ToC
Figure 4 shows the first version of the ToC derived from the map, focusing on this central section.
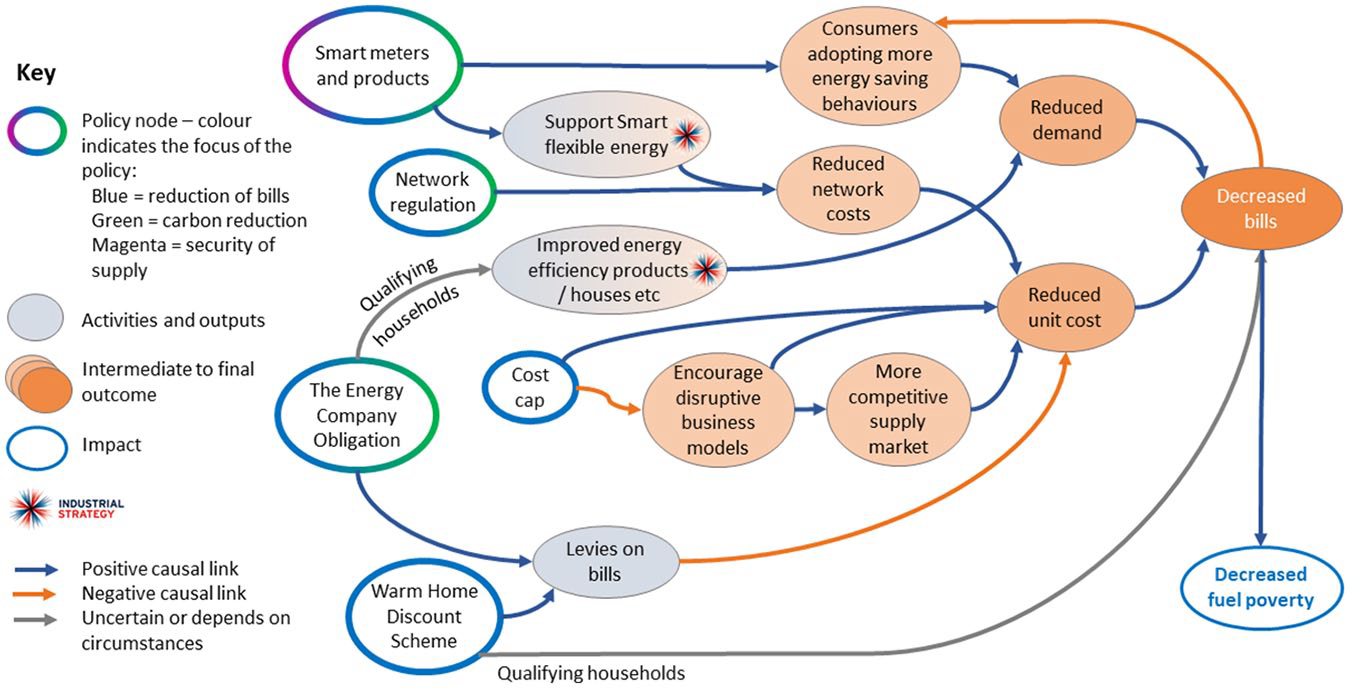
The first outline ToC.
To make the pathways to impact clearer and support scrutiny of the ToC, we
Colour coded the nodes to show more clearly policy, outputs and outcomes.
Developed node titles to make them more descriptive – in particular, to indicate how policy is intended to deliver improvements – so, for example, from the above, we can see that ‘Smart meters and products’ are expected to encourage ‘consumers to adopt more energy efficient behaviours’, and hence ‘reduce demand’.
Reviewed and changed the colour coding of the connections to show whether a positive change in a causal node (as now described) causes a positive change in the connected node (blue), or a negative change (orange), or is uncertain or may differ depending on circumstances (grey). For example, on the system map, the connection between ‘energy saving behaviours’ and ‘consumer demand’ is colour coded red – indicating that an increase in energy-saving behaviours causes a decrease in demand (a negative relationship). In the ToC, we have renamed the nodes ‘consumers adopt more energy saving behaviours’ and ‘reduced demand’. The relationship is now positive – adoption of more energy-saving behaviours leads to greater reduction in demand, and the connection is therefore colour coded blue. We have adopted a different colour coding scheme to the system map, to help avoid confusion between the two.
Through this process, we identified a number of changes, for example,
Changing the routing of the negative feedback connection between ‘decreased energy bills’ and ‘reduced energy use’, previously a direct connection, to go via ‘Consumers adopting more energy saving behaviours’,
Inserted a new node ‘reduced unit cost’ to make the two ways of reducing bills (reducing demand or reducing unit costs) clearer.
In practice, if the exercise of recasting the system map into the ToC was not carried out by the group that developed the system map (as here), then any changes should ideally be reflected back to the full group for review and revision if necessary. The ongoing process of testing theory through the evaluation also gives an opportunity for the ToC to be refined and developed. Agreed and tested changes can be reflected back into the system map.
Insights arising from the move from system to ToC
Deriving even this simple version of the ToC from the system map highlighted a set of feedbacks and trade-offs central to addressing the fuel poverty challenge, for example,
The following two mechanisms were used to address fuel poverty: Discounts to households in vulnerable circumstances (the Warm Homes Scheme), Measures to reduce (or control) household energy bills by reducing the unit cost of energy or consumer demand (e.g. the Company Obligation, which promotes the installation of energy efficiency measures in the homes of qualifying customers). There is a tension between these and the levies placed on bills used to fund the Company Obligation and Warm Home Scheme, among other things, which have the effect of generally driving up bills of those not in fuel poverty.
Reducing bills can lead to increased fuel consumption – for example, because consumers can now afford to heat their homes to more comfortable levels or because they spend income freed up through reduction in bills on other energy-intensive products – this ‘rebound’ effect (Khazzoom, 1980) is one of the feedbacks at the centre of the energy trilemma.
The trade-off implicit in cost caps – these are designed to ensure bills do not rise too far but can provide a barrier to new entrants entering the market.
Relating the simple outline ToC back to the broader system map revealed additional insights as shown in Figure 5:
The potential influence of the policies on other outcomes, and broadly the mechanisms through which this happens, was made clearer. Smart flexible energy and reducing demand contribute to energy security objectives, and measures that reduce demand also contribute to reducing carbon emissions. Both these outcomes are adversely affected by the negative feedback loop whereby decreasing bills lead to increasing demand. This emphasises the importance of focusing on mechanisms, other than price-based mechanisms, for changing behaviours and reducing demand.
The context in which the policy interventions are implemented was made clearly visible, for example, A key driver of demand reduction is improved use of energy efficiency products in homes, insulation and so on. This is recognised in the Industrial Strategy (HM Government, 2017) – the system map shows very few active policies relating to this output (indicated by the target symbol). The development of smart flexible energy is a key mechanism for reducing network costs and securing energy supplies – this node is strongly connected (influenced by or influencing), many other nodes in the system map (as indicated by the three-pronged fan symbols).
Relating the outline ToC back to the system map.
Further ToC development
Further work on the ToC would continue this process of re-examining links out to the broader map to identify key external influences, feedbacks and trade-offs, marking these on the ToC where they were judged by the group as potentially material to the evaluation. Ideally this would continue as a participatory process with stakeholders. Factors that are closely connected to the ToC pathways and flagged as particularly influential or influenced could be considered additions to the ToC.
At this stage, care would be needed to avoid the ToC becoming too complicated and losing clarity. Allocating weights to links and simple visualisations (we have described some of these below) can be helpful in prioritising factors for inclusion on the ToC. The full system map remains as a resource that the evaluators can revisit throughout the evaluation, and also serves as an additional tool for identifying indicators to inform the monitoring plan – for example, to enable early identification of undesired effects rippling through other parts of the system, that should then be drawn explicitly into the ToC.
Uncovering assumptions
A key element in ToC development is to identify assumptions implied in the connections. Annotating the map with information or assumptions regarding relative timescales, especially where feedbacks are present, will also be useful. Figure 6 shows some key connections in the outline ToC where assumptions about the mechanisms of causation, barriers and enablers are implied.
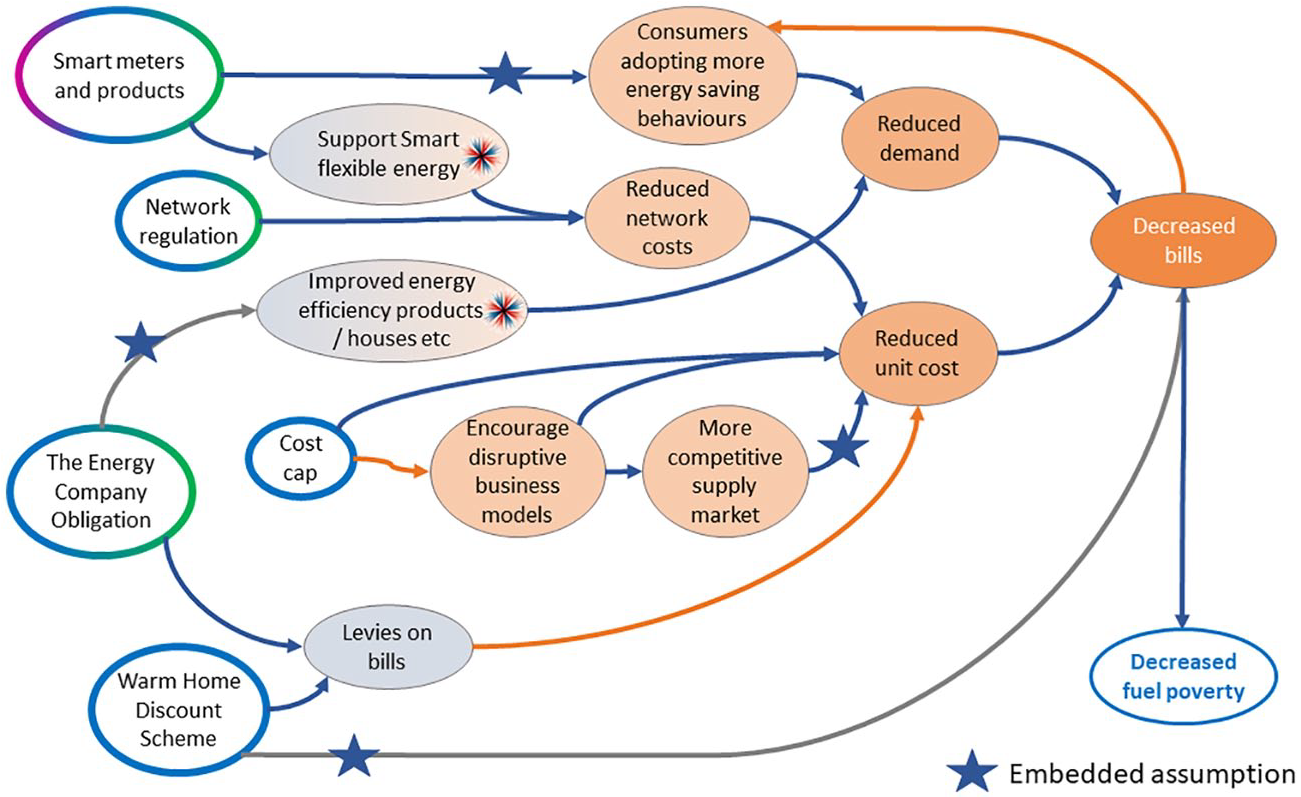
Identifying where assumptions are embedded in the ToC.
To complete the ToC, a process of uncovering these assumptions and making them explicit on the ToC is required. Figure 7 shows what this might look like for one pathway through the ToC.
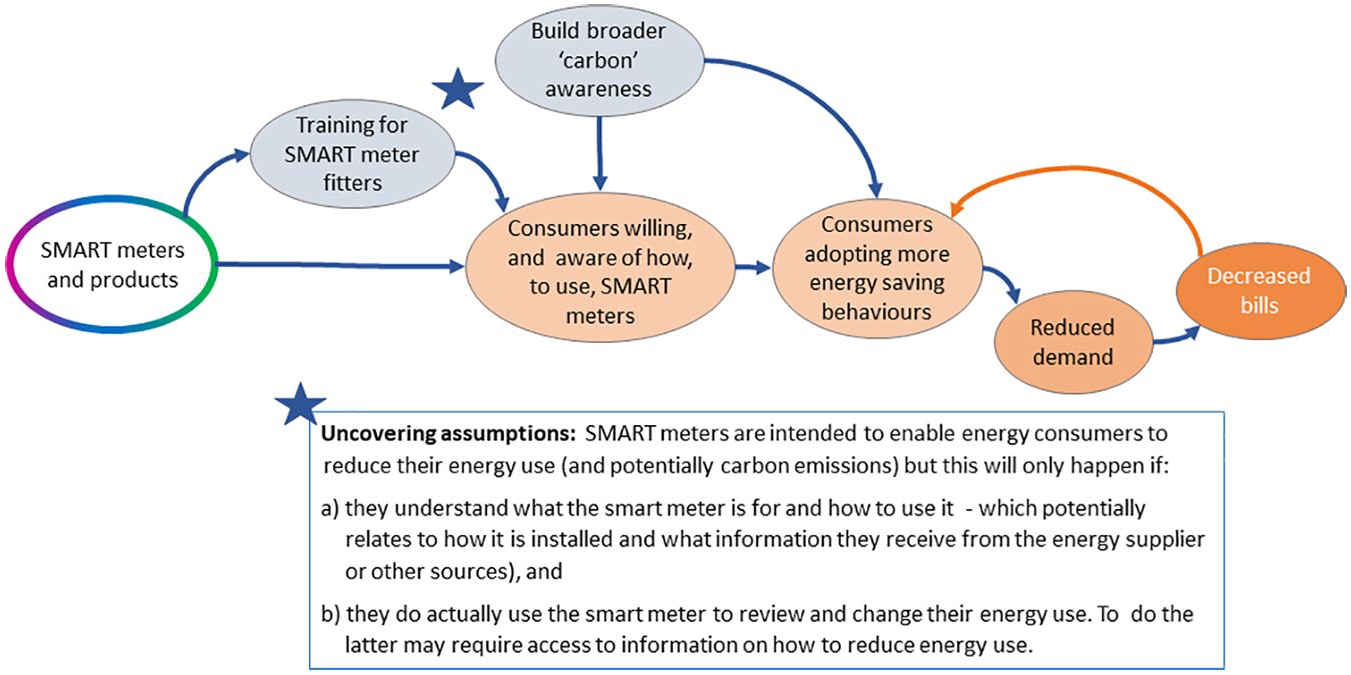
Uncovering assumptions.
Conclusion and next steps
We concluded the following from this exercise:
The process of moving from system map to a ToC map leads to a richer ToC that more effectively reflects the complexity in the system, while retaining clarity on the pathways to change.
The system map ensured we started from a broad consideration of the factors that might affect outcomes and enabled us to identify how the policies might impact other outcomes. It helped us to ground the ToC firmly in an understanding of the wider context.
It helped us identify and capture key features of complex systems such as feedbacks and trade-offs in the ToC. These can have a profound effect on impact, but are often missing in traditional ToCs. A striking example in this ToC was that the consequence of reducing consumer bills, a key BEIS objective, could undermine efforts to reduce demand, with consequential knock-on effects for carbon reduction and energy security.
The fact that the system map had been constructed for a different purpose was both an advantage and a disadvantage: a. On the plus side, it meant that the system map and subsequent ToC was not constrained by too narrow a focus on the policies that were the focus of our hypothetical evaluation. b. However, construction of the system map had involved only BEIS officials, in addition to the facilitators, and focused only on BEIS’ sphere of influence – other factors that might impact on fuel poverty were not included in the map.
This highlights the importance of involving (or otherwise accounting for) as wide a range of knowledge and perspectives as possible. For example, the influence of building regulations on the energy efficiency of homes and wider influences on consumer behaviour were not captured in the system map. These would be important components of the final ToC, encompassing alternate theories that should be tested alongside the intervention ToC.
While the process of recasting the system map into the ToC was complicated by the breadth of the map, this is likely to be a common feature of the process, especially where an existing system map is used as the starting point. The strategy we used to focus attention on relevant components of the map was effective and relatively straightforward to apply. Weighting, simple visualisations and more formal network analysis, combined with stakeholder views, could also be used to support this process.
The process of recasting the map into the ToC format provided a useful cross-check of the system map’s structure and completeness. It also provided a stronger focus on the mechanisms of causality and of uncovering and capturing the beliefs and assumptions that lie behind the connections.
The world of complexity and systems thinking can be discouraging and disempowering, sometimes leading to a ‘blame the system and authorities’ mind-set which undermines the sense that it is possible to make any difference. However, our experience of coupling the systems mapping and ToC construction processes is that this provides a powerful way of ‘cutting through’ the complexity. It does this by tracking the process from intervention to the desired outcome and presenting this in a format that is likely to be more familiar to evaluators and commissioners and easier to understand.
As a result of this exercise, we feel confident that we can now spell out the steps involved in working with stakeholders to generate a system-based ToC map to form the basis of an evaluation. Based on our experiences, we recommend the process described below.
The approach involves organising a series of stakeholder workshops, and the process described here may be beyond the reach of many organisations in terms of cost and the expertise needed. In many cases, a simple exercise moving directly to a ToC may be the most appropriate approach, but informed by systems thinking around:
The potential influence of external contextual factors and how these might enhance or impede the path from action to outcome;
Potential impacts (positive or negative) in areas not immediately related to the intended outcomes;
The potential for feedbacks between outcomes and other steps along a pathway that can amplify or damp down outcomes.
However, where the policy being evaluated is designed to intervene in a complex system, and where the risks of failure are considered significant, we would recommend that the full methodology is applied at an early stage during policy design.
Our recommended methodology
Here we describe our recommended methodology. The steps should be carried out with as wide a range of stakeholders as possible. If, for practical purposes, some steps are carried out by sub-groups (perhaps because they have specialist knowledge), mechanisms should be put in place to reflect the findings back to the full group for verification.
Step 1: Build the system map
If there is no suitable existing map, use Participatory Systems Mapping to build the map – see above and guidance in Penn and Barbrook-Johnson (2019).
Decide on a (flexible) system definition to help define and bound the process. This should focus on the system within which the programme will act rather than the programme itself.
Gather input from the stakeholders on the important functions and policy outcomes of the system for them.
Perform map construction in phases. Build the map of the system itself based on important functions and desired outcomes and what they influence and are influenced by. Ensure that the effects of outcomes on other factors are added rather than considering outcomes as end points. If you build the system map as part of policy design, complete mapping of the extant system before considering and adding proposed interventions.
Begin capturing detail on the mechanisms behind causal links represented in the map.
Specialist system mapping software is especially useful to support this step and the early stages of the ToC construction step – we have described some options above.
Step 2: Develop the ToC
Rearrange the system map in a series of iterative cycles: Use formatting, such as colour coding of policy nodes, to indicate which outcomes these were intended to address. Move the policy or intervention nodes of relevance to the evaluation to one edge of the map (usually left or top) and outcomes towards the opposing edge (usually right or bottom). Use bold to highlight (weight) key connections considered most relevant to the policies that are the focus of the evaluation and to outcomes. Begin to rearrange the factors and connections moving those that are identified as key to the centre of the map, and those that, in the judgement of the team, would have little material impact on outcomes, to the edge of the map. Consider using simple visualisations (see below) to help this process of identifying key links to include in the ToC.
Once the key paths from interventions towards outcomes and impacts are clearly delineated at the centre of the map, draw up a first outline ToC, based on this central section. Use colour coding of nodes and connectors, and develop node descriptions, to ensure that key concepts and meaning can be grasped by others. At this point, it is possible to use products such as PowerPoint to draw up the ToC, which can make it more accessible.
Review this initial outline ToC and examine the links between the ToC and the broader map. Identify key external influences, feedbacks, levers and trade-offs, marking these on the ToC where they are judged by the group as sufficiently material to the evaluation. Use simple visualisations (below), or formal network analysis, in combination with stakeholders’ views, to support this process.
The final critical step is to identify, and expand on, uncertainties and assumptions implied in the connections about the mechanisms of causation, barriers and enablers. Risk assessment methods may be useful here to strengthen the consideration of risks of unintended outcomes, barriers, opportunities and enablers. Consider also timescales over which processes operate. This may be best carried out with small groups working in parallel, focusing on areas where they have particular expertise and experience.
Be careful not to allow the ToC to get too large or too detailed. If it becomes difficult to keep the ToC to one page of A3 paper, consider prioritising elements of the ToC, or restructuring as a nested or interlocking set of ToCs (see e.g. Douthwaite et al., 2003). The facilitator should keep mindful of the likely presence of systematic bias in the construction process and steer construction to ensure that the scale and level of detail are roughly consistent across the ToC. We recommend that versions of the evolving ToC are saved at intervals to provide an audit trail of the process, and a resource that can be revisited. We suggest using the outline of software options presented above to guide choice of software for actually drawing and visualising the map(s).
Simple network visualisations to aid analysis of maps
Simple visualisations can be powerful aids to help analyse the system and build the ToC. They can provide a useful supplement to the principal ToC diagram when presented separately rather than integrated with the ToC.
As a first step, we recommend highlighting those factors, on the system map, that lie on causal pathways between policies and outcomes, and have high in-degree (large numbers of incoming connections), out-degree (outgoing connections) or degree (total number of connections). Once highlighted, different visualisations of the factors and their connections can be used to help probe different questions. For example,
Upstream analysis –what influences this factor? Visualise all factors and links feeding into a factor up to a certain number of steps away (we recommend starting with two or three) to explore whether factors have the following: Incoming connections from factors labelled as vulnerable to change or controlled by others – how can vulnerabilities be mitigated? Multiple incoming connections which support or suppress them and are they likely to change – can effects be maintained, mitigated or buffered? Multiple contradictory influences (including from different policies) pushing them in different directions – which of these are stronger? Which can be supported or reduced?
Downstream analysis – what does this factor influence? Visualise all factors and links flowing out of a factor up to two or three steps away to explore whether these factors Influence other important system functions or outcomes? Are these influences beneficial or detrimental? Are there potential trade-offs between different outcomes or factors important to stakeholders?
Ego network analysis – how is this factor connected? Visualise all factors and connections flowing directly into or out of a target factor plus the connections between them. We can then ask all the above questions.
The answers to any of these questions may then suggest additional system factors or connections that should be fed into evaluation and ToC design.
Caveats and next steps
The exercise described here was largely a theoretical one. Although we started from an actual system map, developed through a participatory exercise with those directly involved in policy design and delivery, the resulting ToC was produced by a small team of experts, without stakeholder input. While it has generated useful insights and a process of moving from system to ToC mapping, the next step is to test these out in an actual setting. Members of the CECAN team are currently exploring opportunities for doing this in a number of sectors and settings.
Footnotes
Acknowledgements
The authors gratefully acknowledge the contributions of the wider Centre for the Evaluation of Complexity Across the Nexus (CECAN) team, and the team involved in mapping the energy trilemma, for their contributions to the ideas presented in this article.
Declaration of conflicting interests
The authors declared no potential conflicts of interest with respect to the research, authorship and/or publication of this article.
Funding
The authors disclosed receipt of the following financial support for the research, authorship and/or publication of this article: This work was supported by the Economic and Social Research Council (grant numbers ES/N012550/1 and ES/S000402/1).