
Abstract
Objectives
To assess whether mortality alerts, triggered by sustained higher than expected hospital mortality, are associated with other potential indicators of hospital quality relating to factors of hospital structure, clinical process and patient outcomes.
Methods
Cross-sectional study of National Health Service hospital trusts in England (2011–2013) using publicly available hospital measures reflecting organizational structure (mean acute bed occupancy, nurse/bed ratio, training satisfaction and proportion of trusts with low National Health Service Litigation Authority risk assessment or in financial deficit); process (mean proportion of eligible patients who receive percutaneous coronary intervention within 90 minutes) and outcomes (mean patient satisfaction scores, summary measures of hospital mortality and proportion of patients harmed). Mortality alerts were based on hospital administrative data.
Results
Mortality alerts were associated with structural indicators and outcome indicators of quality. There was insufficient data to detect an association between mortality alerts and the process indicator.
Conclusions
Mortality alerts appear to reflect aspects of quality within an English hospital setting, suggesting that there may be value in a mortality alerting system in highlighting poor hospital quality.
Introduction
Monitoring mortality is an integral part of health care 1 and countries such as the UK and the USA have been publishing routinely collected hospital mortality data for some time.2,3
Since 2007, the Imperial College Mortality Surveillance and Alerting System in England (Imperial alerting system) has generated monthly mortality alerts based on statistical process control charts that use routinely collected hospital administrative data on 122 diagnoses and procedures for all English acute National Health Service (NHS) hospital trusts. Alerts are triggered when there is a sustained higher than expected monthly mortality in one of the 122 diagnosis or procedure groups above and beyond a given threshold.
It was this alerting system that highlighted problems at Mid Staffordshire hospital in England in 2007. The hospital at the centre of the scandal had received a series of six mortality alerts for a range of conditions and procedures during 2007 and 2008. This helped trigger an inspection of emergency care, at the hospital, which found ‘appalling’ failures of care, and resulted in several inquiries, culminating a public inquiry led by Sir Robert Francis. 4 That inquiry recognized the role the Imperial alerting system had played in identifying Mid Staffordshire as an outlier. Among the key recommendations of the report was that all health care provider organizations should develop and maintain systems which give effective real-time information on the performance of each of their services, specialist teams and individual specialists in relation to mortality, patient safety and minimum quality standards.
There is controversy around the use of hospital mortality derived from administrative data as an indicator of quality.5,6 A 2007 systematic review 7 of processes of care found a correlation between better quality of care and reduced risk-adjusted mortality in 51% of the quality indicators investigated in individual studies, but many of the reviewed studies were too small to detect statistically significant associations. Other concerns focus on summary measures of hospital mortality such as the Hospital Standardized Mortality Ratio (HSMR) and the Summary Hospital-level Mortality Indicator (SHMI) that are used to monitor mortality at hospital trust level in the English NHS.8,9 The Imperial alerting system is based on specific diagnosis and procedure groupings, where the relationship between hospital mortality and quality is regarded as more valid. 10
The central question is whether changes in mortality do reflect wider problems in an organization. Institutional factors such as funding pressures, shortage of beds, pressures on staff or lack of trained staff can put an organization under strain, potentially impacting on the quality of care they provide. This may be reflected by lower adherence to core clinical processes and guidelines, which in turn may affect mortality in the sickest patients. A decline in quality of care may also influence or be reflected in other patient outcomes such as patient satisfaction. Pressures on staffing would also be expected to impact on basic nursing care and potentially be reflected in the incidence of pressure ulcers, falls and infections. Internationally, there is considerable interest in the early detection of quality of care issues using the monitoring of routinely collected administrative data.11–13 Establishing a relationship between a mortality monitoring system and other indicators of quality of care would help validate this approach to monitoring. With this broad model in mind, we examined publically available quality indicators to identify hospital structural, clinical process and patient outcome factors which may reflect the general standard of care.14,15 Our underlying hypothesis was that mortality alerts are associated with indicators of quality of care measured as organizational structure, clinical process and patient outcomes.
Methods
We used a cross-sectional study design, set within all acute NHS hospital trusts in England, between January 2011 and December 2013. We examined the relationship between alerting and non-alerting trusts with hospital structural, clinical process and patient outcome measures.
We assembled a database of English acute hospital trusts over the study period from data supplied by the Care Quality Commission (CQC), the independent regulator of health care services in England. 16 A hospital trust is an organization within the NHS that operates a single or group of hospitals that provide secondary care services to a geographic population.
Mortality alerts
Alerts are generated from risk-adjusted log-likelihood cumulative sum charts using routinely collected hospital administrative data on 122 diagnoses and procedures for all English acute NHS hospital trusts. 17 Diagnoses are determined by the primary diagnosis (reason for the admission), which are recorded using International Classification of Disease version 10 codes; and procedures from the primary procedure recorded during the admission using Office of Population Censuses and Surveys Classification of Surgical Operations and Procedures (4th revision) codes. The alerts are triggered when a sustained higher than expected monthly (in-hospital) mortality, for a given diagnoses/procedure, exceeds a threshold. This threshold is set to minimize the false alarm rate (estimated at <0.1% over a 12-month period of monitoring). 18 The methodology and process for generating these alerts are more fully described elsewhere. 19 The Imperial College unit holds records of all monthly mortality alerts generated since 2007. We extracted information on alerts between January 2011 and December 2013. We flagged alerts for acute myocardial infarction (AMI) and sepsis.
Indicators of hospital care quality
A priori, we chose a range of measures that could be seen as indicators of hospital care quality and that were publically available. The choice of indicators was informed by the Donabedian framework of structure, process and outcome for examining the quality of health services. 15 Included measures were reviewed by a panel of independent referees on behalf of the National Institute of Health Research in England. 20 The measures and rationale for their inclusion are described in Table 1 (see also online Supplement 1). In brief, measures relating to organizational structure were: the provision of acute beds; staffing levels; financial pressures; staff training and risk assessment practices. There are few publicly available clinical process measures at hospital level, and we only investigated the ‘proportion of patients who received percutaneous coronary interventions (PCI) within 90 minutes of arrival’ at a heart attack centre, in line with international clinical guidelines for the emergency treatment of patients with AMI.24,25 We hypothesized that mortality alerts for AMI were negatively associated with this measure. Measures relating to patient outcomes included: patient satisfaction, patient harms and death. While patient satisfaction, and to a certain extent, harms are not likely to be directly related to patient mortality, we hypothesized that they may indicate failings in care, which, in turn, are likely to be linked to patient mortality. All our measures were available to the public at a hospital trust level. Data coverage and frequency of data (aggregation period) differed across the indicators of quality of care (Table 2). We merged our database of indicators with mortality alerts data. We took the time period of the indicator to coincide with the date of the alert to examine whether a trust had alerted at the time of the indicator.
Rationale for selecting structure, clinical process and outcome measures which potentially relate to hospital quality.
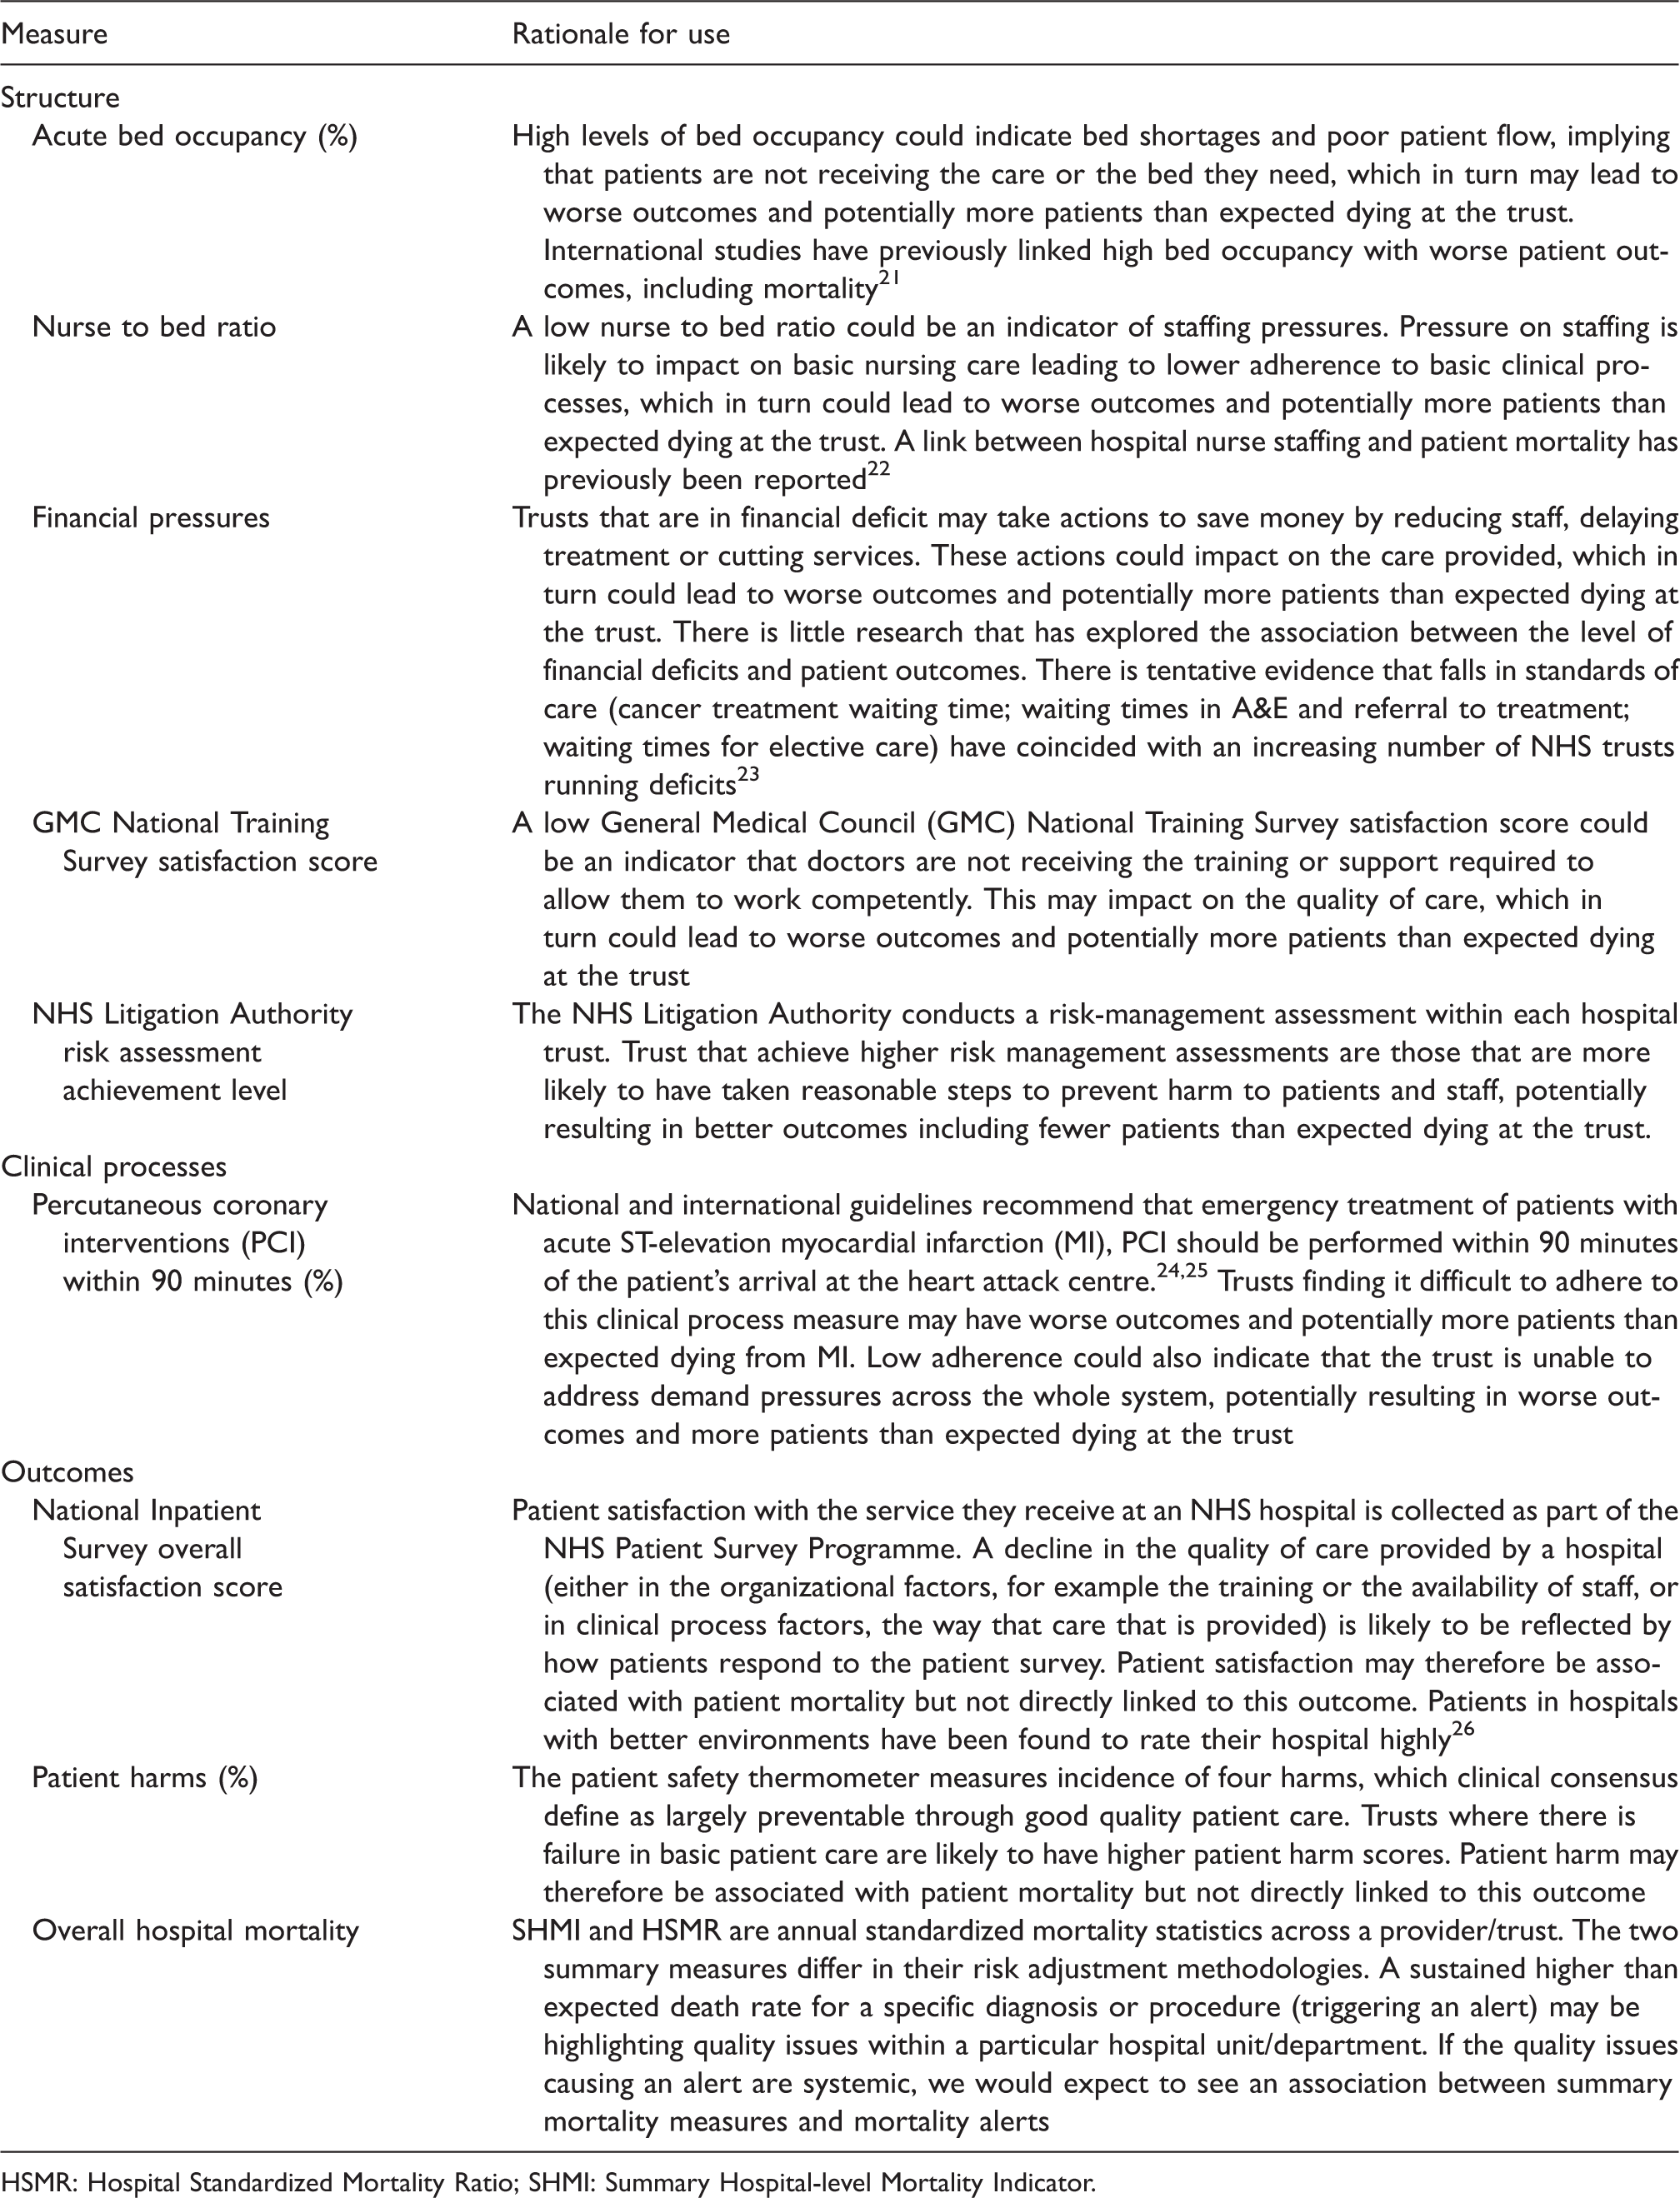
HSMR: Hospital Standardized Mortality Ratio; SHMI: Summary Hospital-level Mortality Indicator.
External indicators of hospital quality datasets.
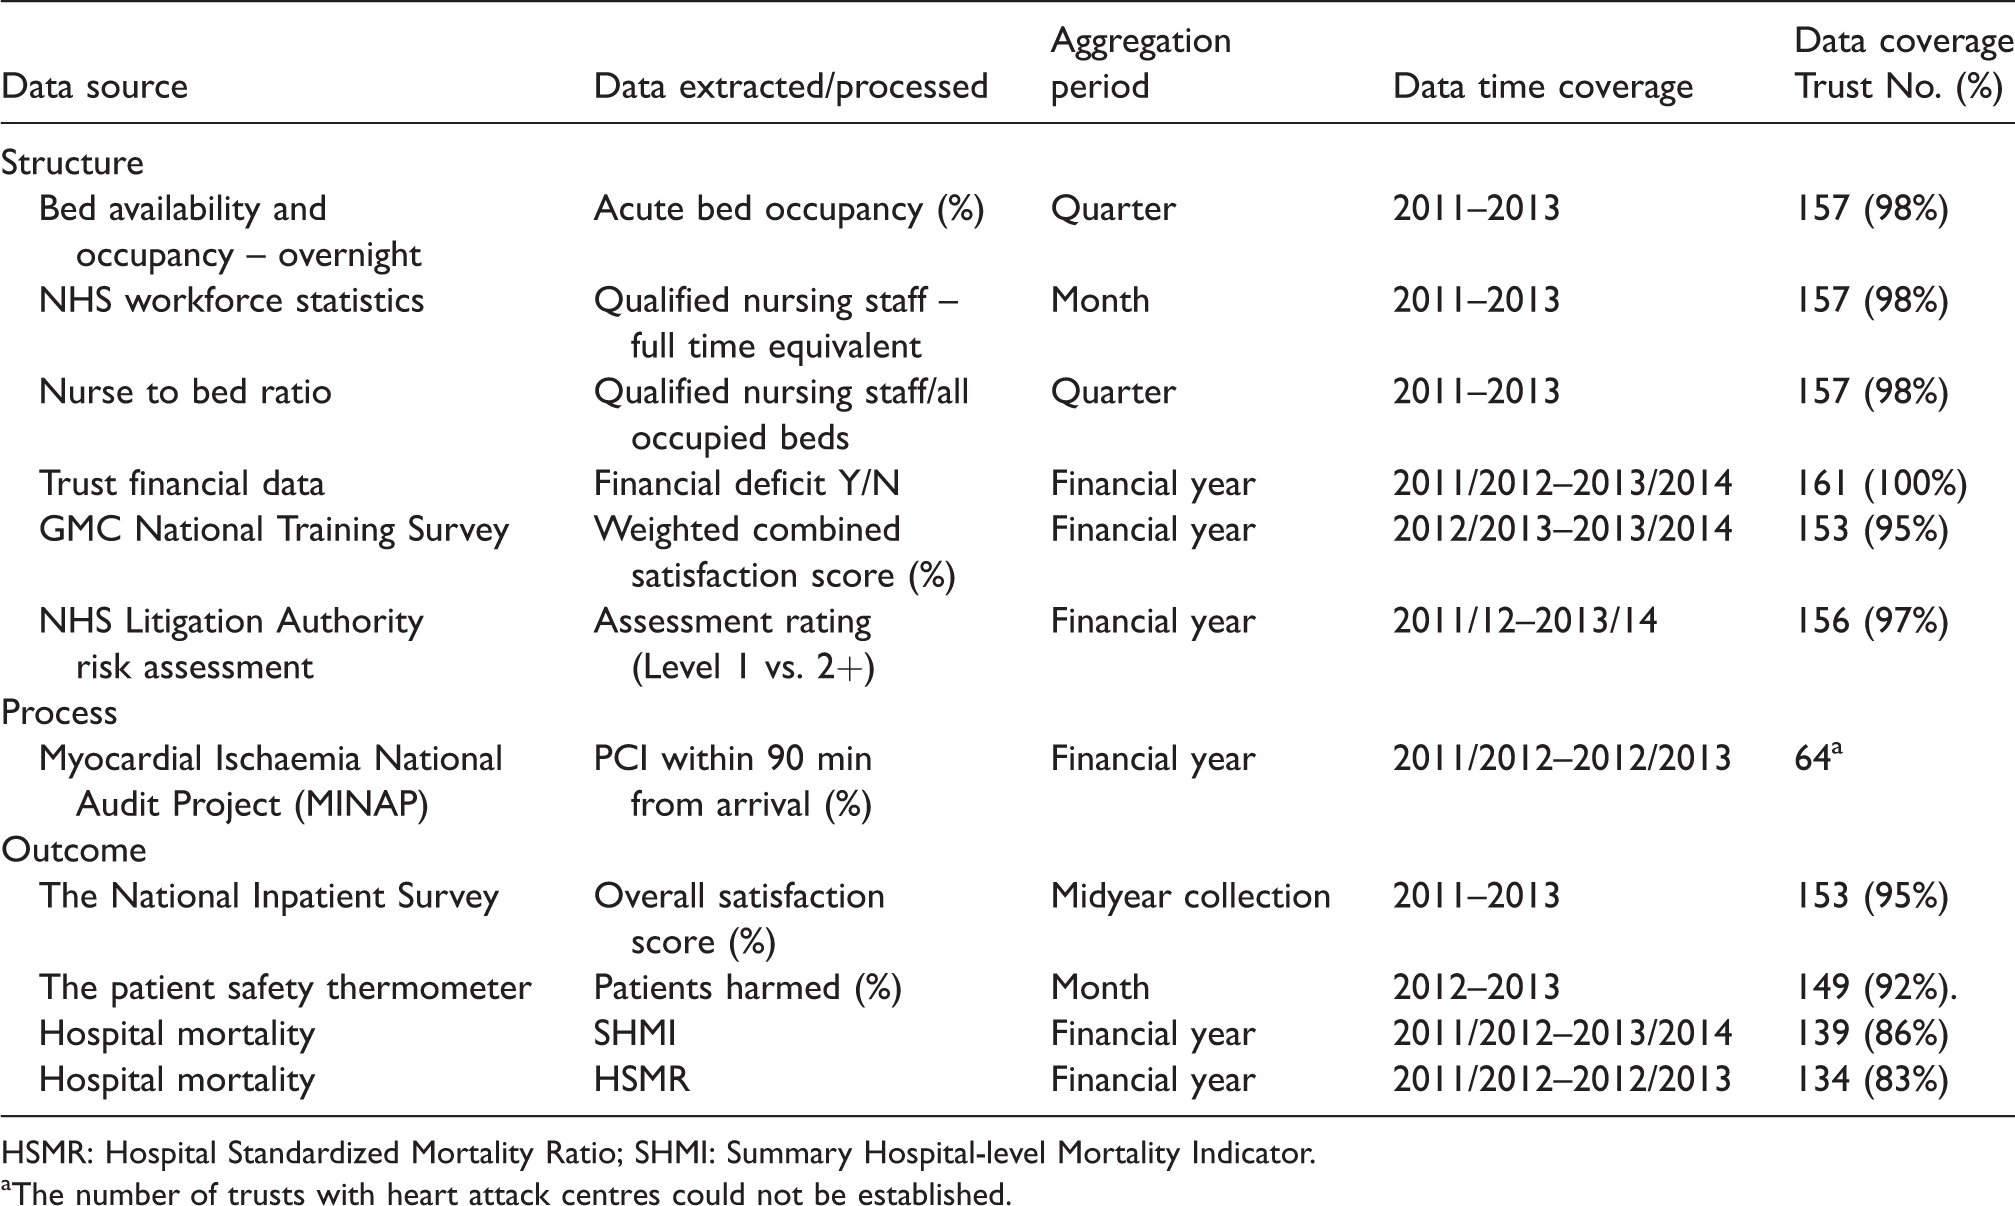
HSMR: Hospital Standardized Mortality Ratio; SHMI: Summary Hospital-level Mortality Indicator.
The number of trusts with heart attack centres could not be established.
Statistical analysis
For the continuous quality indicators, we used ordinary least squares (OLS) regression, which estimates the mean in the baseline (no alert) with a parameter measuring the difference in mean in trusts with an alert. We also adjusted for year. We used White–Huber robust standard errors to compensate for the clustering effect of repeated observations from the same NHS trust (ignoring clustering can over-estimate an association between two variables). The robust estimator also does not impose any assumptions on the consistency of variance in the outcome between alerting and non-alerting trusts. 27 We checked the distribution of model residuals for normality and outliers; we carried out sensitivity analyses on transformed data, where transformation normalizes the distribution of the outcome and after the removal of outliers.
NHS Litigation Authority assessment level achievement and Trust financial data were binary outcomes and we used logistic regression with robust standard errors to measure the association between mortality alerts and these outcomes. We adjusted for year. Logistic regression estimates log odds ratios as well as the log odds at baseline (in a non-alerting trust). We converted odds ratios into risk ratios.
We set the threshold value for p, the significance level of our hypothesis tests, at 0.05 (5%). The null hypothesis here was defined as no significant difference in the outcome in the alerting trusts compared with the non-alerting trusts, so that any observed difference would be due to random error.
Controlling for false discovery rate
Our investigation of mortality alerts with other indicators of quality involved a total of 30 analyses (10 outcomes across all conditions, AMI and sepsis). Multiple significance testing increases the probability of false positive findings due to random chance alone. This is the false discovery rate (FDR). We controlled for FDR using methodology described by Benjamini and Hochberg. 28
Patient and public involvement
This study was part of a larger project evaluating a national surveillance system for mortality alerts. There were two patient representative members of the Scientific Advisory Group who contributed to the development of the research question and outcomes of this study. There was a consultation with members of the public through peopleinresearch.org and five participants attended a focus group, which discussed mortality alerts and the justification for using personal data to generate them.
Results
We examined data for 161 acute NHS trusts in England over the study period. There were 160 acute trusts in 2011, 161 in 2012 and 158 in 2013. The median number of beds across the trusts was 591 (interquartile range, 393 to 817), while the median number of stays was 513 (345 to 719). Between January 2011 and December 2013, there were 189 mortality alerts sent to 92 acute NHS trusts in England.
There was variation in the completeness of indicators of quality of care data. Some measures (SHMI and HSMR) did not include data from specialist NHS trusts, while the number of trusts with heart attack centres could not be determined (Table 2). We assumed that our process data for ‘PCI within 90 min’ were complete.
Structural indicators of hospital care quality
Between 2011 and 2013, acute bed occupancy was high (median: 88 (83 to 92) in non-alerting trusts) (Table 3). In the same quarter as the alert occurred, trust level acute bed occupancy rates were on average 2.2 percentage points higher in alerting compared with non-alerting trusts (p = 0.001). For an AMI alert, acute bed occupancy rates were on average 7.7 percentage points higher (p < 0.001). There was no strong evidence that trusts alerting for sepsis differed from non-alerting trusts (p = 0.063).
Descriptive and test statistics of indicators of quality comparing all, acute myocardial infarction (AMI), sepsis and frequently alerting with non-alerting trusts.
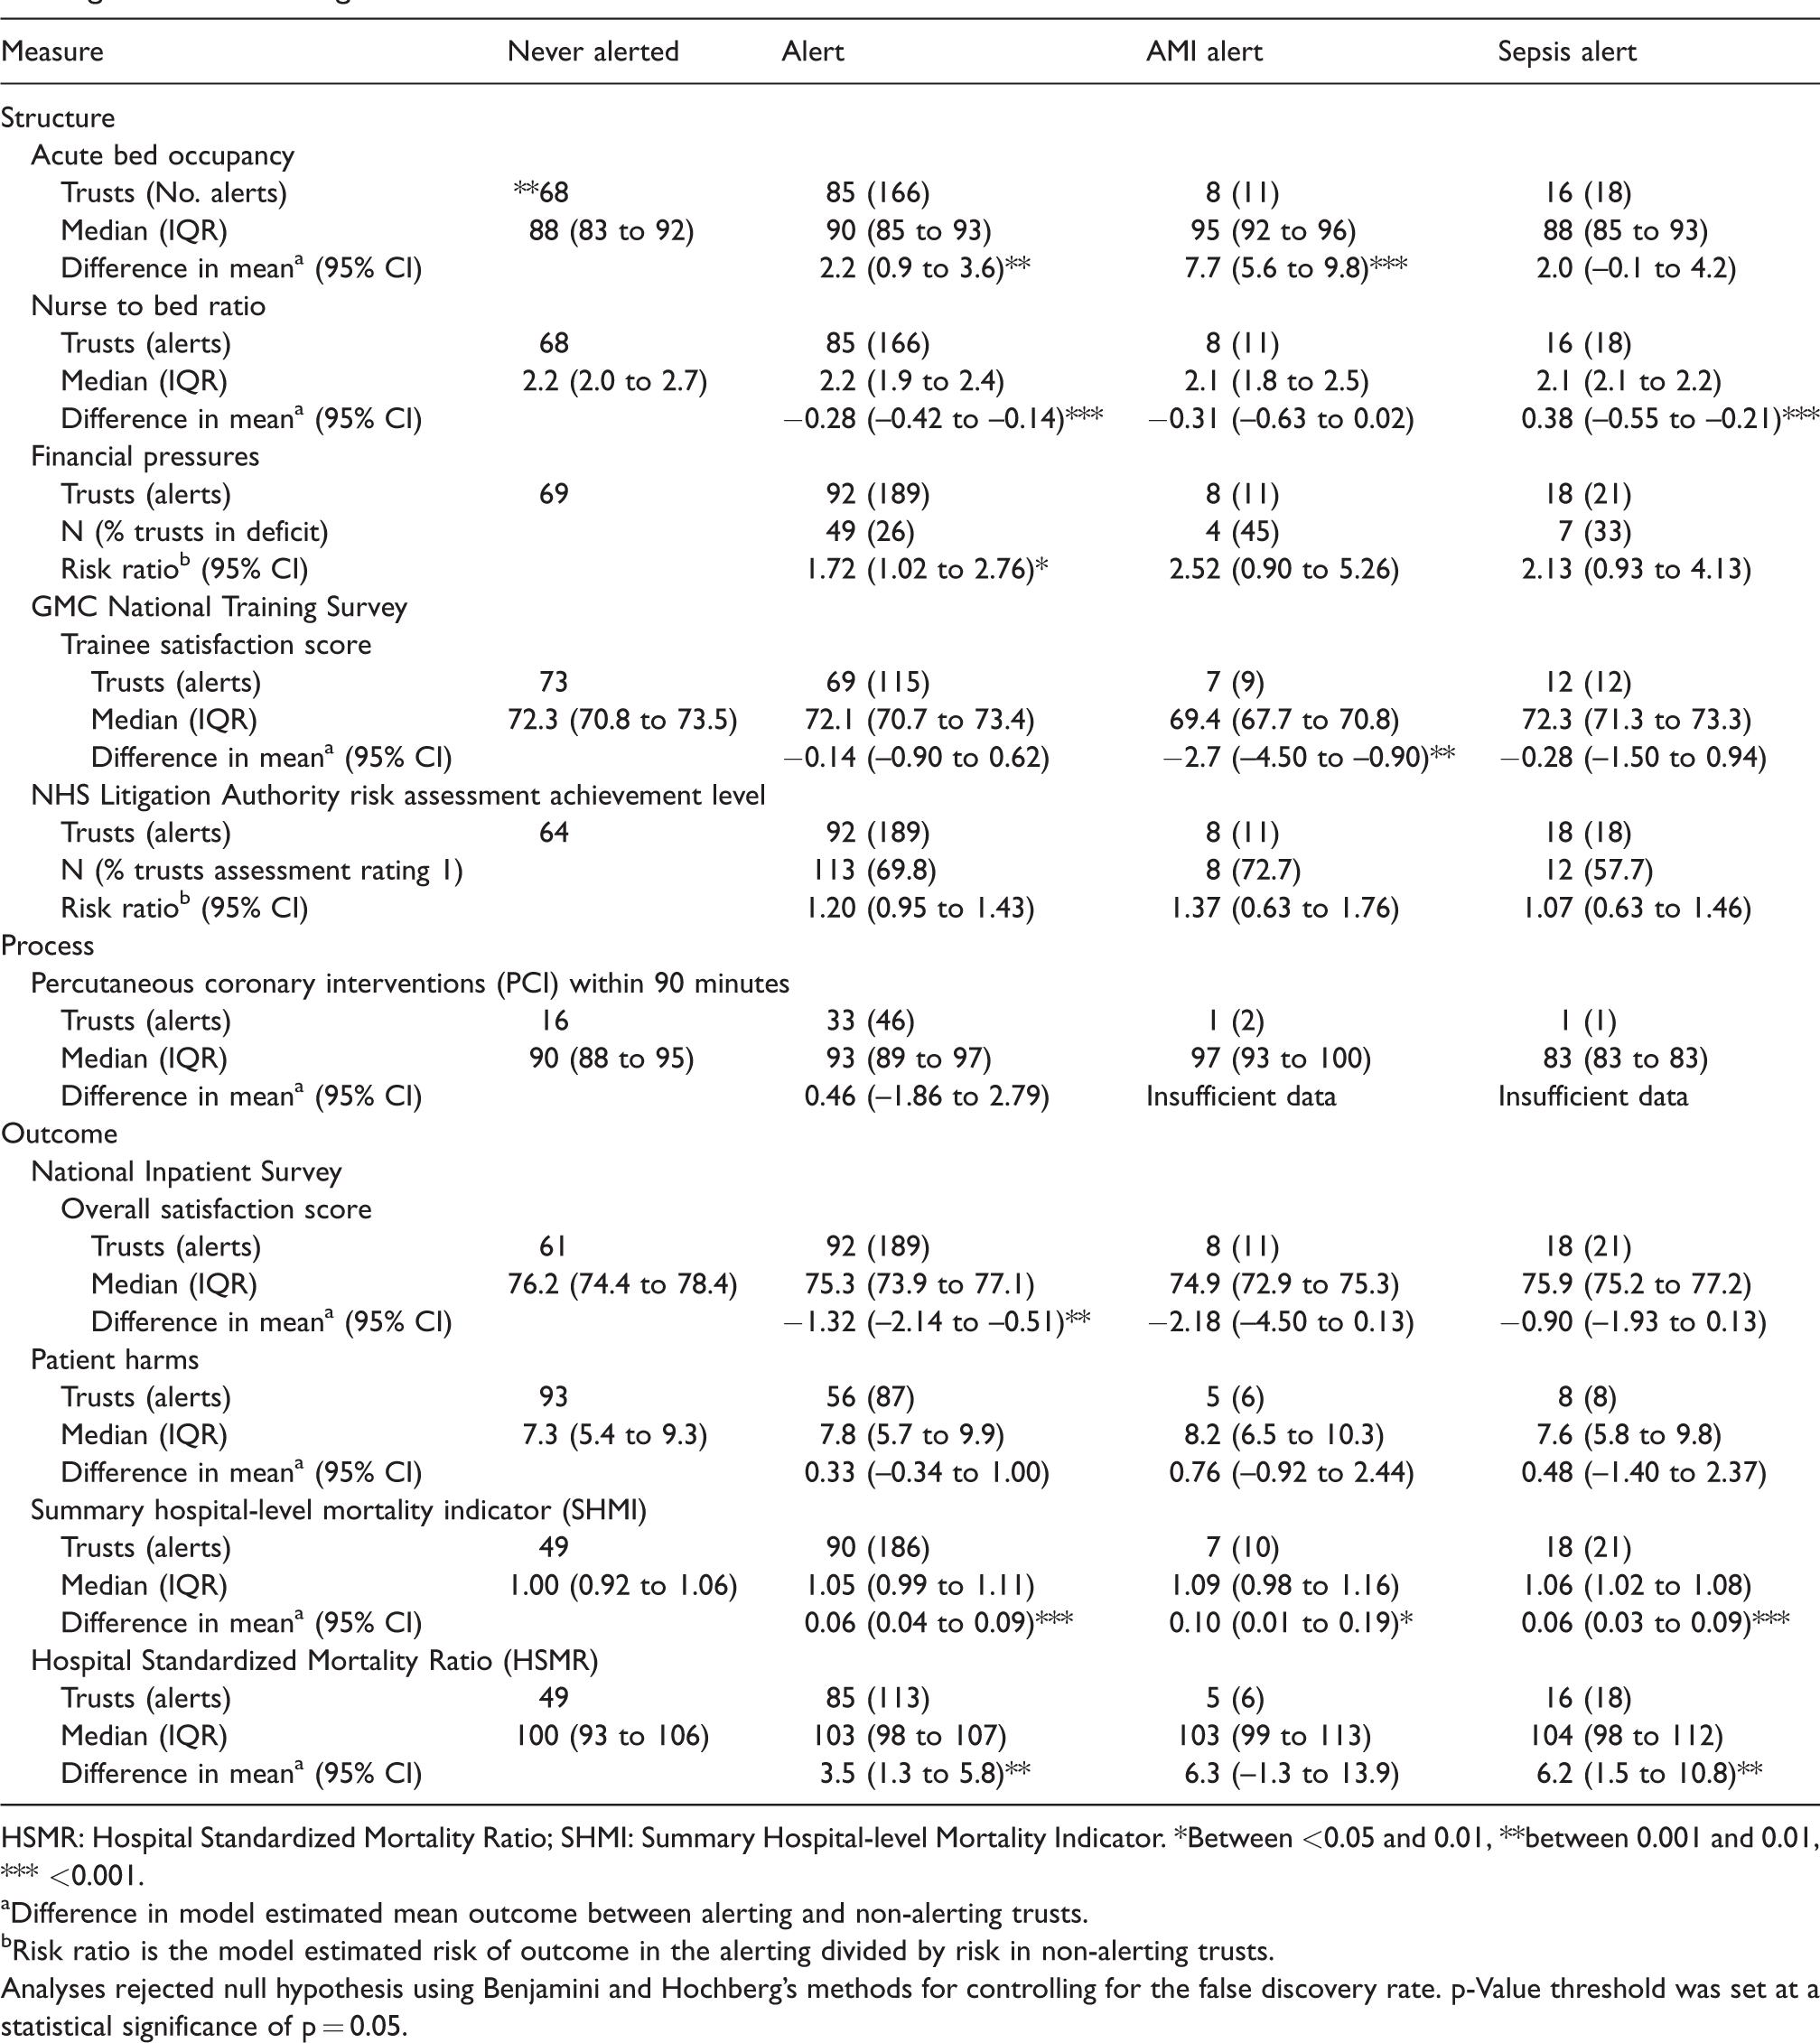
HSMR: Hospital Standardized Mortality Ratio; SHMI: Summary Hospital-level Mortality Indicator. *Between <0.05 and 0.01, **between 0.001 and 0.01, *** <0.001.
Difference in model estimated mean outcome between alerting and non-alerting trusts.
Risk ratio is the model estimated risk of outcome in the alerting divided by risk in non-alerting trusts.
Analyses rejected null hypothesis using Benjamini and Hochberg’s methods for controlling for the false discovery rate. p-Value threshold was set at a statistical significance of p = 0.05.
In the same quarter as an alert, the nurse to bed ratio were on average 0.28 points lower in alerting compared with non-alerting trusts (p < 0.001) and 0.38 points lower in trusts alerting for sepsis (p < 0.001).
The number of trusts that were in deficit (by the end of the financial year) increased over the study period from 14.4% (23/160) in 2011/2012 to 34.2% (54/158) by 2013/2014. There was borderline evidence that in the year of an alert a trust was in deficit, with 26% of trusts that had alerted over the study period being in deficit. Only 13% of trusts that had never had an alert were in deficit. The risk ratio of being in deficit if the trust had ever alerted compared with those trusts that had not alerted was 2.33 (1.24 to 4.12) (p = 0.009).
Trust level trainee satisfaction scores were on average lower in alerting compared with non-alerting trust; however, variability was too high to establish a statistically significant difference. Sensitivity analysis using unweighted scores but ignoring missing data found similar results. There was a negative association between trusts that alerted for MI and non-alerting trusts: −2.7 (−4.50 to –0.90).
There was no statistically significant evidence that risk assessment achievement differed between alerting and non-alerting trusts.
Clinical process indicators of hospital care quality
The proportion of patients who received PCI within 90 minutes ranged from 78% to 100% between NHS trusts with heart attack centres; however, there were only two AMI alerts in those trusts, and we could not assess the relation between AMI alerts and the proportion of patients receiving PCI within 90 min.
Outcome indicators of hospital care quality
Trust level patient satisfaction scores ranged from 67.4% to 88.2%. In the year of an alert, trust level patient satisfaction scores were on average 1.3 percentage points lower in alerting compared with non-alerting trusts (p = 0.002). There was no evidence of an association between year of an AMI or sepsis alert and patient satisfaction scores (p = 0.065 and p = 0.085, respectively).
The proportion of patients harmed per month ranged from 0% to 54%, but there was no evidence of a difference in the proportion of patients harmed in an alerting compared with non-alerting trusts.
Annual trust level SHMIs were on average 0.05 points higher in alerting and 0.06 points higher in sepsis alerting trusts compared with non-alerting trusts (both p < 0.001). Annual trust level SHMIs were on average 0.1 points higher (p = 0.022) in AMI alerting trusts; however, after adjusting for FDR there ceased to be a statistically significant difference.
Annual trust level HSMRs were on average 3.5 points higher in alerting compared with non-alerting trusts (p = 0.003). There was no evidence of an association between year of an AMI alert and HSMR; however, trust level HSMRs were on average 6.2 points higher in alerting compared with non-alerting trusts in the year of a sepsis alert (p = 0.009).
Transformation to normalize the outcome distribution found similar estimated differences and model coefficients were unchanged when sensitivity analyses were carried out after removing outlier data.
Discussion
Mortality alerts were associated with hospital structure indicators and patient outcome measures. Acute bed occupancy and all hospital mortality were higher in hospitals which had a mortality alert, while nurse to bed ratio, patient and trainee satisfaction were lower. Alerting trusts were more likely to be in deficit than non-alerting trusts. All associations were in the direction expected.
A link between hospital nurse staffing and patient mortality has previously been reported. 22 Our study found a particularly strong association between nurse to bed ratio and sepsis mortality alerts, and it has been noted that the higher the nurse bed ratio, the more time a nurse has to assess their patients for early identification and treatment of sepsis. The association between bed occupancy and mortality has also been previously reported. Studies investigating the relationship between patient satisfaction and mortality are mixed. Fenton et al. found higher mortality rate among more satisfied patients 33 but that study was set in the USA and results are difficult to generalize to the UK. We found that mortality alerts for AMI were not associated with the proportion of patients who received PCI within 90 minutes. Other studies have also found little evidence of an association between quality process measures and mortality outcomes.29,30
Limitations
As an observational study, we cannot establish causality but are able to investigate associations, using robust methodology. We hypothesized that mortality alerts were associated with a range of indicators of quality and found associations for some of these. AMI and sepsis analyses were under-powered due to the small number of alerts. We matched different time points (annual, monthly or quarterly) which may have affected the sensitivity of the analysis, as the analysis will have low power (there are fewer data points to assess the association) and changing trends could be masked by pooling data or ignored when a single annual measurement is taken. Missing data was difficult to determine. In the absence of a consistent authoritative list of trusts in each year of analysis, we compiled our own comprehensive list of acute hospital trusts from a range of sources. Quality measures were not always complete, for example measures of hospital mortality did not include specialist NHS trusts. We assumed that data from the Myocardial Ischaemia National Audit Project, which provided the clinical process measures, were complete, but we do not have a comprehensive list of NHS trusts that have heart attack centres providing PCI treatment. Most of the included quality indicators are objective which limits bias; however, NHS thermometer data on harms is self-reported. This could introduce bias as trusts with poor care may also have poor reporting. We took a pragmatic approach to choosing indicators that were publically available, but given the availability of hundreds of published quality indicators in the UK, we make no claims as to how representative they are of other indicators.
Mortality alerts may be triggered by poor data quality, coding problems or insufficient adjustment for case mix (for example if a trust is more likely to receive patients with severe disease), which would dilute an association between an alert and other indicators of quality of care. Our statistical approach to investigate the association between mortality alerts and other quality measure outcomes used OLS regression with White–Huber robust standard errors to predict an unbiased estimator. Other authors 30 have used Poisson regression (with a simulation extrapolation method applied to correct for measurement error) to assess the association between health care processes indicators and HSMRs but both approaches are appropriate.
The strength of the Imperial alerting system is its coverage of all acute English NHS public hospitals at diagnosis and procedure group level for patients admitted for any reason. The alerts are triggered from cumulative monthly mortality measures and sustained increases (above the expected) can be more quickly recognized. As a result, the alerts may highlight possible failings that can be more easily isolated and investigated by hospital trusts and that may be timelier compared with summary measures of mortality. This may explain why mortality alerts are not more strongly associated with HSMRs.
Our findings of associations between mortality alerts and other quality measures is supported by further work.31,32 This study is part of a larger project, which also investigated findings by the English health care regulator into alerting trusts. This found that the majority of alerting trusts carried out audits to explore the higher than expected mortality and that quality of care problems were found in 69% of alerts investigated by the regulator. 19
Conclusions
There has been some debate about the validity and reliability of mortality monitoring as an indicator of failings in care quality. Our study suggests that mortality alerts may be highlighting quality of care issues brought on by financial pressures or internal difficulties of overcrowding and nurse staffing levels. If mortality alerts represent a true indicator of hospital quality, it is important that hospital trusts react to notification of an alert by investigating the possible causes and putting necessary changes in place. Further research is needed to assess individual trust’s response to notification of an alert especially as the health regulator, the CQC, is also notified of these alerts and who may subsequently follow up with the alerting trusts.
Supplemental Material
HSR847689 Supplemental Material - Supplemental material for What is the relationship between mortality alerts and other indicators of quality of care? A national cross-sectional study
Supplemental material, HSR847689 Supplemental Material for What is the relationship between mortality alerts and other indicators of quality of care? A national cross-sectional study by Elizabeth Cecil, Alex Bottle, Aneez Esmail, Charles Vincent and Paul Aylin in Journal of Health Services Research & Policy
Footnotes
Acknowledegments
The Dr Foster Unit is an academic unit in the Department of Primary Care and Public Health, within the School of Public Health, Imperial College London. The unit receives research funding from the National Institute of Health Research and Dr Foster Intelligence, an independent health service research organization (a wholly owned subsidiary of Telstra). The Dr Foster Unit at Imperial is affiliated with the National Institute of Health Research (NIHR) Imperial Patient Safety Translational Research Centre. The NIHR Imperial Patient Safety Translational Centre is a partnership between the Imperial College Healthcare NHS Trust and Imperial College London. The Department of Primary Care & Public Health at Imperial College London is grateful for support from the NW London NIHR Collaboration for Leadership in Applied Health Research & Care (CLAHRC) and the Imperial NIHR Biomedical Research Centre.
Declaration of conflicting interests
The author(s) declared the following potential conflicts of interest with respect to the research, authorship, and/or publication of this article: PA and AB declare that they are partially funded by grants from Dr Foster Intelligence, an independent healthcare information company. CV reports funding from the Health Foundation for Research and Haelo (a commercial innovation and improvement science organization) for consultancy work. EC and AE declare no support from any organization for the submitted work; no financial relationships with any organizations that might have an interest in the submitted work in the previous 3 years; and no other relationships or activities that could appear to have influenced the submitted work.
Funding
The author(s) disclosed receipt of the following financial support for the research, authorship, and/or publication of this article: This study was funded by the National Institute for Health Research, Health Services and Delivery Research Programme (HS&DR – 12/178/22).
References
Supplementary Material
Please find the following supplemental material available below.
For Open Access articles published under a Creative Commons License, all supplemental material carries the same license as the article it is associated with.
For non-Open Access articles published, all supplemental material carries a non-exclusive license, and permission requests for re-use of supplemental material or any part of supplemental material shall be sent directly to the copyright owner as specified in the copyright notice associated with the article.