
Abstract
Taking breaks from digital connectivity has become a common practice but we still have limited knowledge of which approaches are used and who uses them. This article explores how technological measures are used to take temporary breaks from smartphones and digital media. Technological measures include silent and airplane mode, turning off notifications, deleting and setting time limits on apps, downloading disconnection apps, and using a simpler phone. Based on two representative surveys from Norway (2018, N = 1046; 2023, N = 1142), the study shows a preference for simple measures – silencing, removing, and deleting – over complex tools like disconnection apps. Regarding socio-demographic differences, the article shows that younger, highly educated, and left-leaning people ‘use tech to beat tech’ to a higher degree. Furthermore, the study explores how the use of technological measures corresponds with how respondents assess their smartphone (over)use. The article adds to the body of nationally representative surveys in digital disconnection research and contributes to understanding how technological measures for disconnection have evolved and their popularity and use.
Keywords
Introduction
Parallel to the development of digital technologies, increased attention is given to why and how people disconnect from smartphones and digital media (Albris et al., 2024; Chia et al., 2021; Jansson and Adams, 2021; Kuntsman and Miyake, 2022; Syvertsen, 2020). This article investigates the use of technological measures and apps to restrict smartphone use. Using such measures is often deemed paradoxical, as the aim is to combat technological problems with technological solutions (You, 2024). However, in a digital, or rather ‘post-digital’ age where the digital is taken for granted, not only media use, but also non-use may be technologically embedded (Albris et al., 2024).
In this article, technological measures refer to functionalities allowing users to take temporary breaks from the internet, social media, apps, platforms, or devices like smartphones. Technological measures have emerged to serve different purposes. Features like mute and airplane mode are early examples of measures to restrict mobile phone use in specific settings (Franks et al., 2022; Gomes et al., 2020). Several measures were (re)designed to serve self-regulatory purposes in the late 2000s and early 2010s, from third-party apps to built-in features and hardware that are commodified to a great extent. Representative examples are Forest app (2014), Light Phone (2015), and Google Digital Wellbeing (2018). This article explores the use of measures for restricting phone use in Norway and includes muting, turning off notifications, using airplane mode, deleting and setting time limits on apps, downloading apps that reward disconnection, and using a phone with fewer features; all measures discussed in recent research (Beattie, 2020; Cao and Fang, 2022; Chia and Beattie, 2021; Franks et al., 2022; Ganito and Ferreira, 2020; Ghita and Thorén, 2021; Jorge et al., 2022; Liu et al., 2022; Mannell, 2019; Nassen et al., 2023; You, 2025).
Drawing upon data from two nationally representative surveys (2018 and 2023), this study explores people’s self-restrictive practices in the highly digitised country of Norway (EU, 2022). The surveys are based on different samples, making comparisons possible on the societal, not the individual level. This article aims to shed light on to what degree technological measures are used for temporary disconnection from their smartphone among the population and different socio-demographic groups, how the use of app-related measures has evolved, and how the different measures are linked with self-assessments of smartphone use.
The article contributes in three ways. First, the study adds data from Norway to the growing body of nationally representative surveys. Most studies of the use of technology-related measures have small samples; many focus on deletion or abstention from social media platforms (see, e.g. Baumer et al., 2013; Light and Cassidy, 2014; Portwood-Stacer, 2013) or are limited to specific groups such as the young (Aagaard, 2021; Gomes et al., 2020) or old (Gallistl et al., 2021; Nguyen et al., 2021). Quantitative studies of technology-related actions for disconnection have emerged (see, e.g. Fu and Li, 2020; Matthes et al., 2022), but only recently studies based on nationally representative samples (Beattie et al., 2024; Fast et al., 2021; Nguyen et al., 2022; Vanden Abeele and Nguyen, 2023; Willekens et al., 2022).
Second, the study contributes knowledge on how different groups approach digital disconnection. A primary concern in the field is whether the ability to disconnect is socially skewed: ‘Full participation in the technology-driven culture of disconnection remains only available to a select few people’, argues Beattie (2020, p. 205). While many studies investigate socio-demographic differences, our study also includes respondents’ voting preferences, linking the use of disconnective measures to the broader cultural and political debate on online and smartphone overuse in society (Albris et al., 2024; Enli, 2025).
Third, this study contributes by taking a closer look at app-related disconnection measures, which becomes an increasingly relevant area in disconnection studies, as apps become more deeply embedded in everyday social life than previous forms of media and communication (Goggin, 2021). This study focuses specifically on how individuals engage with apps not only reactively (e.g. deleting distracting apps), but also proactively through apps or features designed to help regulate phone use. Such practices have gained traction with the expansion of the app economy and the influence of technology industries and techno-cultural norms (Beattie, 2020). This focus reveals the multifunctionality of apps in the disconnection landscape, illustrating how users employ technology to manage their technology use, or in other words, how they seek to ‘beat tech with tech’.
While existing studies have examined the psychological, sociocultural, and ethical implications of such apps or tools (Jorge et al., 2022; Lyngs et al., 2019; Schmuck, 2020; You and Karlsen, 2024), less is known about their actual uptake: how widespread are these practices, and who adopts them? This study addresses that gap by presenting survey data on two proactive app-based measures (setting time limits on apps and downloading disconnection apps) collected at two points in time (2018 and 2023) in Norway. By comparing prevalence across socio-demographic groups and over time, the study provides insight into both the societal relevance and temporal dynamics.
The article begins with a review of studies, followed by the analysis, discussion, and conclusion.
Literature review
We begin the literature review by exploring the evolvement of technological measures for disconnection, before turning to studies of user patterns and variants explaining use.
The evolvement of technological measures for disconnection
The use of technological measures for disconnection is dependent on what measures are available. Three phases can be discerned based on studies of how technological measures have evolved.
The first phase predates the smartphone era, when features like silent and airplane modes were developed. The silent mode was available from the late 1990s; Motorola StarTAC in 1996 incorporated such modes as part of basic functionalities. As phones became more sophisticated, the silent mode became a standard functionality. Turning off notifications does not have a standalone historical record as it is linked with silent mode; the capability to turn off notifications through settings arrived with smartphone operating systems like iOS and Android (Goode, 2019). Initially, users had to manually turn off mobile phones during flights; however, as concerns about safety increased, a dedicated airplane mode became common in digital gadgets (Cohen, 2023).
The second phase covers the development of apps, especially third-party apps. Initially, pre-installed apps could not be removed, but with the advent of the App Store and Google Play in the mid-2010s, users could choose apps, and the process of (un)installing became more user-friendly (Goggin, 2021). Studies of how users delete or remove intrusive apps, particularly social media apps with Facebook as the typical case, have become a dominant strand in the disconnection field (Bagger, 2024; Kuntsman and Miyake, 2022). However, studies also cover practices requiring more active management, such as setting time limits on apps (see wellbeing tools below) and downloading so-called disconnection apps (Beattie, 2020). The earliest disconnection apps, such as Freedom (2011) and Cold Turkey (2011), enabled users to block apps and customise schedules and notifications. In 2014 the Forest app adopted gamification techniques to reward disconnection and entertain users (You, 2024), while in Norway, the Hold app rewarded offline time with treats or coupons (Syvertsen, 2020).
The third phase saw the emergence of integrated operating systems and platform tools. Digital Wellbeing by Google and Screen Time by Apple were integrated into phones and other devices in 2018 as a response to the ‘digital backlash’, that is, criticism of the platforms for exploitative algorithms, addictive design, and harvesting private data (Albris et al., 2024). These measures can track usage, set app time limits, and customise modes for different contexts. Following Apple’s iOS Screen Time and Google’s Digital Wellbeing in 2018, social media platforms have incorporated similar features into their platforms, like Facebook’s Your Time (Jorge et al., 2022). Chia and Beattie (2021) show how Google’s Digital Wellbeing tools were developed to encourage users to moderate their use while continuing to use smartphones.
The simple phone has a more complex history, as it can be both old and new. Users can keep an old device or avoid upgrading, but there are also new ‘statement’ items such as ‘The Light Phone’ which is designed to be used as little as possible (Chia and Beattie, 2021). These deliberately designed and marketed devices convey ‘a statement of deliberate technological slowdown and measured resistance’ (Chia and Beattie, 2021; Thorén et al., 2019). Regardless of whether they are older models or newly developed products, such phones typically offer limited functionality and minimal Wi-Fi access, serving as both a symbolic and functional response to the pressures of hyperconnectivity.
Many studies discuss more than one feature or explore cross-cutting aspects. For example, Mannell (2019) creates a typology of mobile disconnective affordances such as jamming (e.g. putting the phone on airplane mode) and modulation (e.g. using the blocking feature). She points out that while measures are available, they do not necessarily encourage disconnection: ‘engaging with disconnective affordances often requires navigating a complex array of functionalities that pull both toward and against the possibility of disconnection’ (p. 89). This criticism is echoed in other studies. Natale and Treré (2020) argue that technological measures are not instruments of resistance but an integral part of the attention economy. Even if settings or user patterns are modified, the culture of connectedness is reinforced (see also Ghita and Thorén, 2021; Jorge et al., 2022). These critical perspectives suggest that disconnective technologies may reproduce, rather than resist, the logic of constant availability, offering users the illusion of control while maintaining the broader infrastructures and expectations of connectivity.
Use patterns and socio-demographic differences
In recent years, studies examining how various populations use disconnective measures have expanded (see Nassen et al., 2023; Radtke et al., 2021). In this review, we focus on quantitative studies but include general arguments and observations from qualitative studies.
Several studies examine the prevalence of different measures in national populations and explore socio-demographic and other differences. However, it should be noted that different studies may have different focuses and framings, such as examining people’s disconnection from the ‘Internet’ (Beattie et al., 2024) or ‘smartphone’ (this paper) in particular, or ‘digital media’ (Nguyen et al., 2022; Vanden Abeele and Nguyen, 2023) in general. Based on a representative sample of New Zealanders, Beattie et al. (2024) show that measures for disconnection were widely used and only around one-fifth of the population never disconnected from the internet. The study mapped a range of background variables but found that gender was the only significant factor explaining the prevalence of use, as men reported less disconnection than women.
Based on a national sample of Swiss Internet users in 2020, Nguyen et al. (2022) explored motivations and strategies for disconnection. They included the use of technological features such as the do-not-disturb mode, unavailable status, muting and turning off notifications, unfollowing or blocking, and using detox apps or programmes. They showed that removing and silencing were more prevalent than measures requiring active management. Furthermore, they found that older people used tech-based strategies less, with no significance concerning gender or education.
Vanden Abeele and Nguyen (2023) drew on a representative sample of Belgian adults to examine links between wellbeing and disconnection, including behavioural and technological strategies to limit connection. They also show that simple measures were the most used. They investigated five tech-based strategies relevant to our study and found high use of measures such as muting (73%), removing time-consuming apps (54%) and disabling notifications (45%). Fewer people used apps to monitor screen time (20%) and younger people use such apps more than older.
The above studies provide much-needed data on user patterns, but no consistent pattern emerges concerning socio-economic differences. This is interesting considering observations from investigations drawing on a Bordieuan framework, which find that the tendency to disconnect is associated with a higher level of cultural capital, related to education and cultural consumption (e.g. whether attending museum, theatre, music or dance performance; number of books at home) (Fast et al., 2021; Willekens et al., 2022). In this view, disconnection is not just a matter of individual preference, but a practice that draws on specific forms of knowledge, resources, and social positioning. The argument that disconnection is socio-economically skewed is also found in qualitative studies conceptualising digital disconnection as a form of work increasing the burdens on individuals (Beattie, 2020; Kuntsman and Miyake, 2022). Fast (2021) argues that balancing digital use is turning into a moral obligation and that the workload is socially skewed.
In addition to socio-economic features, several studies include how individuals assess the problems and benefits of online and smartphone use as part of the explanations for disconnective behaviour. For example, the same concern about overuse can be framed similarly but used differently. ‘I think I spent too much time online’ was identified as an indicator of one’s agency and digital wellbeing, contributing to characterising different user groups in the study of Vanden Abeele and Nguyen (2023). A similar statement, ‘I spend too much time on digital media’, was used as one of the social motivations for disconnection in the study of Nguyen et al. (2022). Yet, another statement about overuse – ‘I feel addicted to my phone or device’ was included in the study of Beattie et al. (2024) as one of the items to describe the ‘barriers’ to disconnecting, to discuss the broader social and societal costs of disconnection. Analysing people’s responses to these assessments alongside socio-demographic variables can provide a more nuanced understanding of one’s digital disconnection and patterns of digital media use. For example, Vanden Abeele and Nguyen (2023) found that ‘ambivalent users’ who were relatively younger and often employed as knowledge workers, experienced significant functional benefits from digital media but simultaneously reported the least agency over their screen time and significantly higher self-reported phone use compared to other groups. This highlights the importance of integrating both socio-demographics and self-assessments in exploring the use of disconnective measures.
Moreover, the perception of smartphone problems and use of disconnective measures may also be related to broader outlooks. In Norway, as in many other countries, the growing debate about the attention economy and digital overuse is partly framed by political and cultural divides (Albris et al., 2024; Enli, 2025; Enli and Fast, 2023). For example, these divides influence how responsibility for digital disconnection is framed, whether it is seen as an individual duty, a matter of parental discipline, a public concern, or a consequence of platform capitalism requiring regulation (Albris et al., 2024; Enli, 2025). While the role of political orientation in shaping these attitudes remains underexplored, it may be a factor in how people respond to digital technologies. Thus, this study considers people’s voting preferences as one of the predictors of use of technology-related measures for disconnection (see RQ1).
Research questions
Based on the review of literature and themes detected, our analysis will be in three parts, guided by three research questions.
Methods and materials
Research context and sample
Norway is a good case for exploring the use of technology-related measures, as it is among the most digitised countries in Europe. Broadband connectivity, internet use, and use of digital services in business and public services are high, as are digital skills (EU, 2022). At the same time, there is much emphasis on work-life balance, ideals of being present in everyday life and nature, and living what is perceived as an authentic life (Albris et al., 2024; Syvertsen, 2022; Syvertsen and Karlsen, 2024).
Since the aim of the study is to explore user patterns in the population, survey was chosen as the method. The two web surveys were carried out by Kantar TNS and covered the population from 18 years upwards. The 2018 survey was part of the regular Gallup interbuss Q4, December 2018 (N = 1046); however, the Digitox research project (2019–2024), founded by The Norwegian Research Council, offered design advice and was granted access to the data. The 2023 survey is commissioned by the [anonymised research project] and carried out 13.-21. February 2023, with a sample drawn from the GallupPanel (N = 1142). The results for both surveys were weighted based on gender, age, and county data from Statistics Norway (SSB). In both years, the weighted sample includes 50.4% men and 49.6% women. Approximately 20% of respondents are aged 18 to 29, 26% are 30 to 44, another 26% are 45 to 59, and between 28% and 29% are 60 to 89. The regional distribution was similar in both years: Oslo and surroundings (24% in 2018, 25% in 2023), the rest of the East (26%), the South and West (31%), and Trøndelag and the North (18%). The samples in both years, however, are skewed towards people with higher education, as more than half of the respondents hold a university or college degree (58% in 2018 and 64% in 2023). The 2023 survey is more extensive and is used to answer RQ1 and RQ3, while both surveys are used to answer RQ2 about change in the use of app-related measures (see also Enli, 2025; Kratel, 2025).
Measures
Socio-demographics
We measured respondents’ gender, age, and education in both surveys. We added the main sources of livelihood and voting preferences in the 2023 survey to capture a more comprehensive profile (see details in Appendix Table A1). They all were treated as categorical data in the statistical analysis.
Individual disconnection strategies
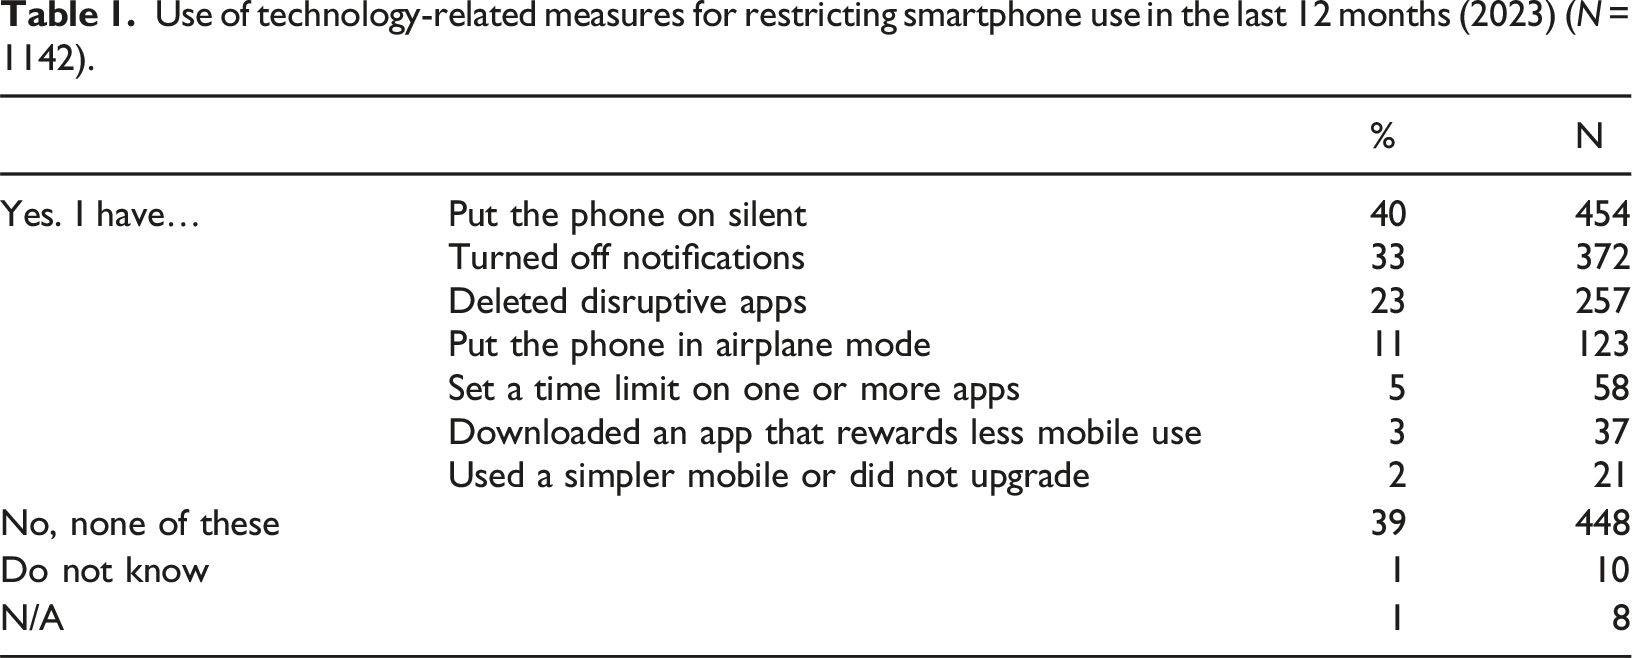
Use of technology-related measures for restricting smartphone use in the last 12 months (2023) (N = 1142).
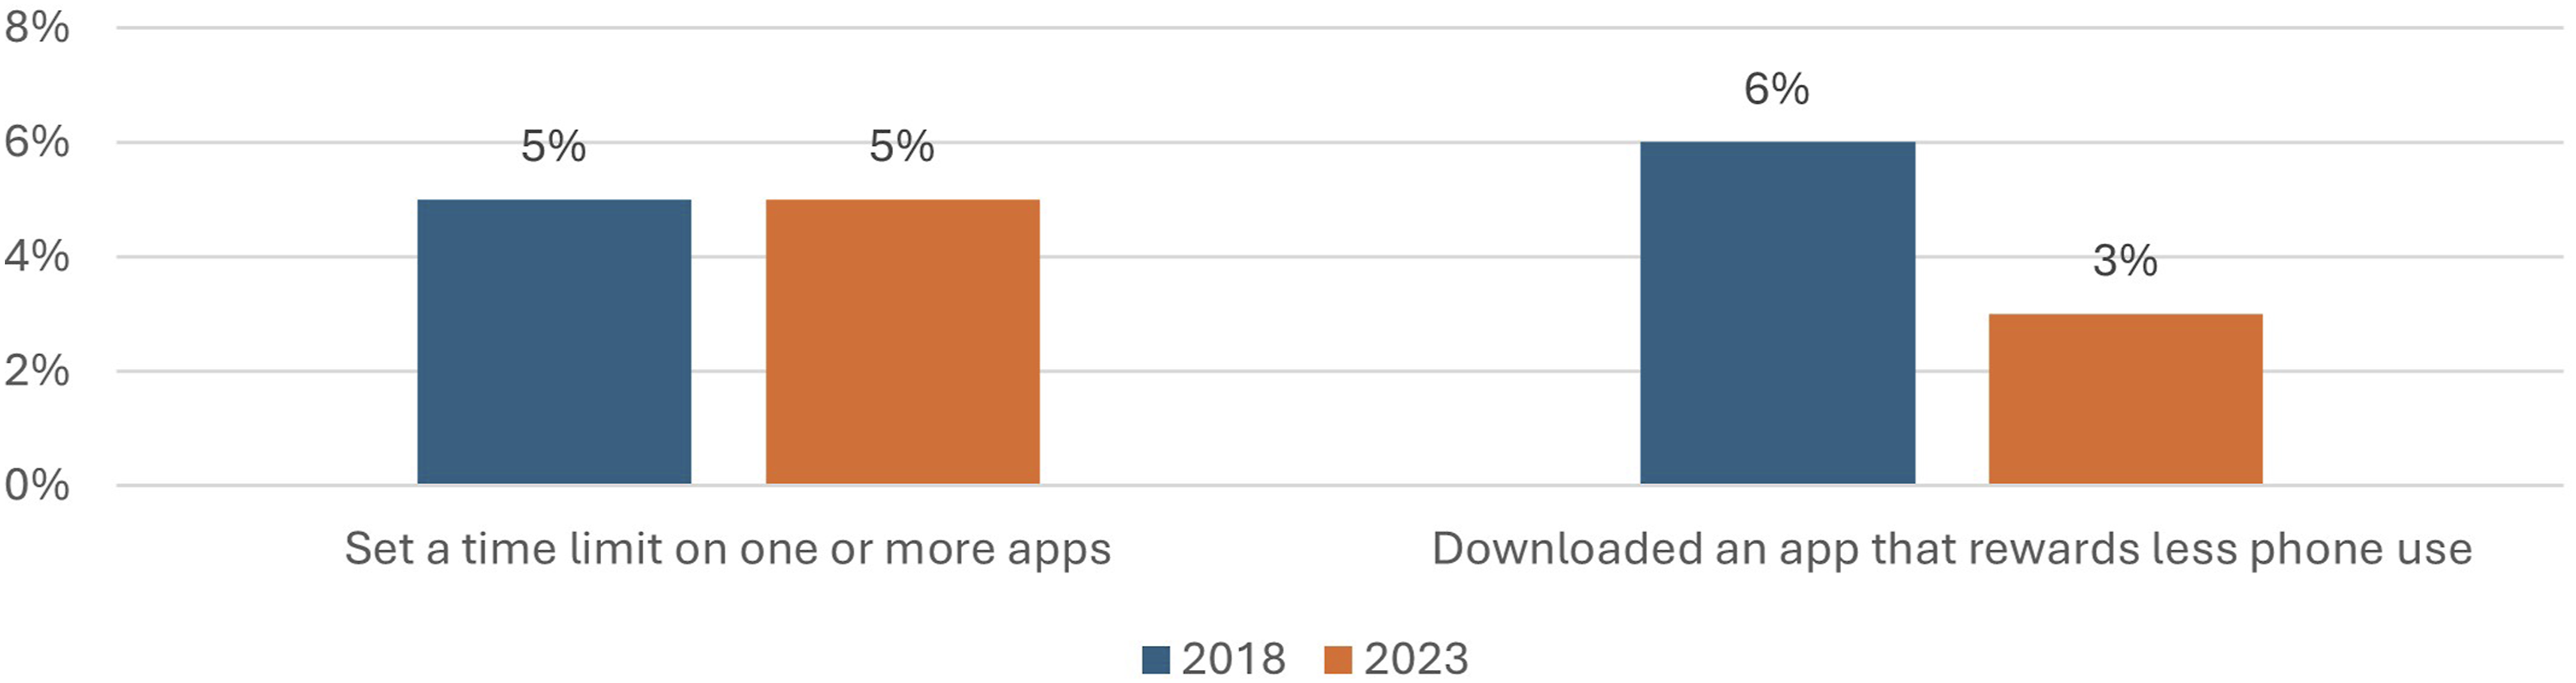
Use of two app-related measures in 2018 (N = 1046) and 2023 (N = 1142).
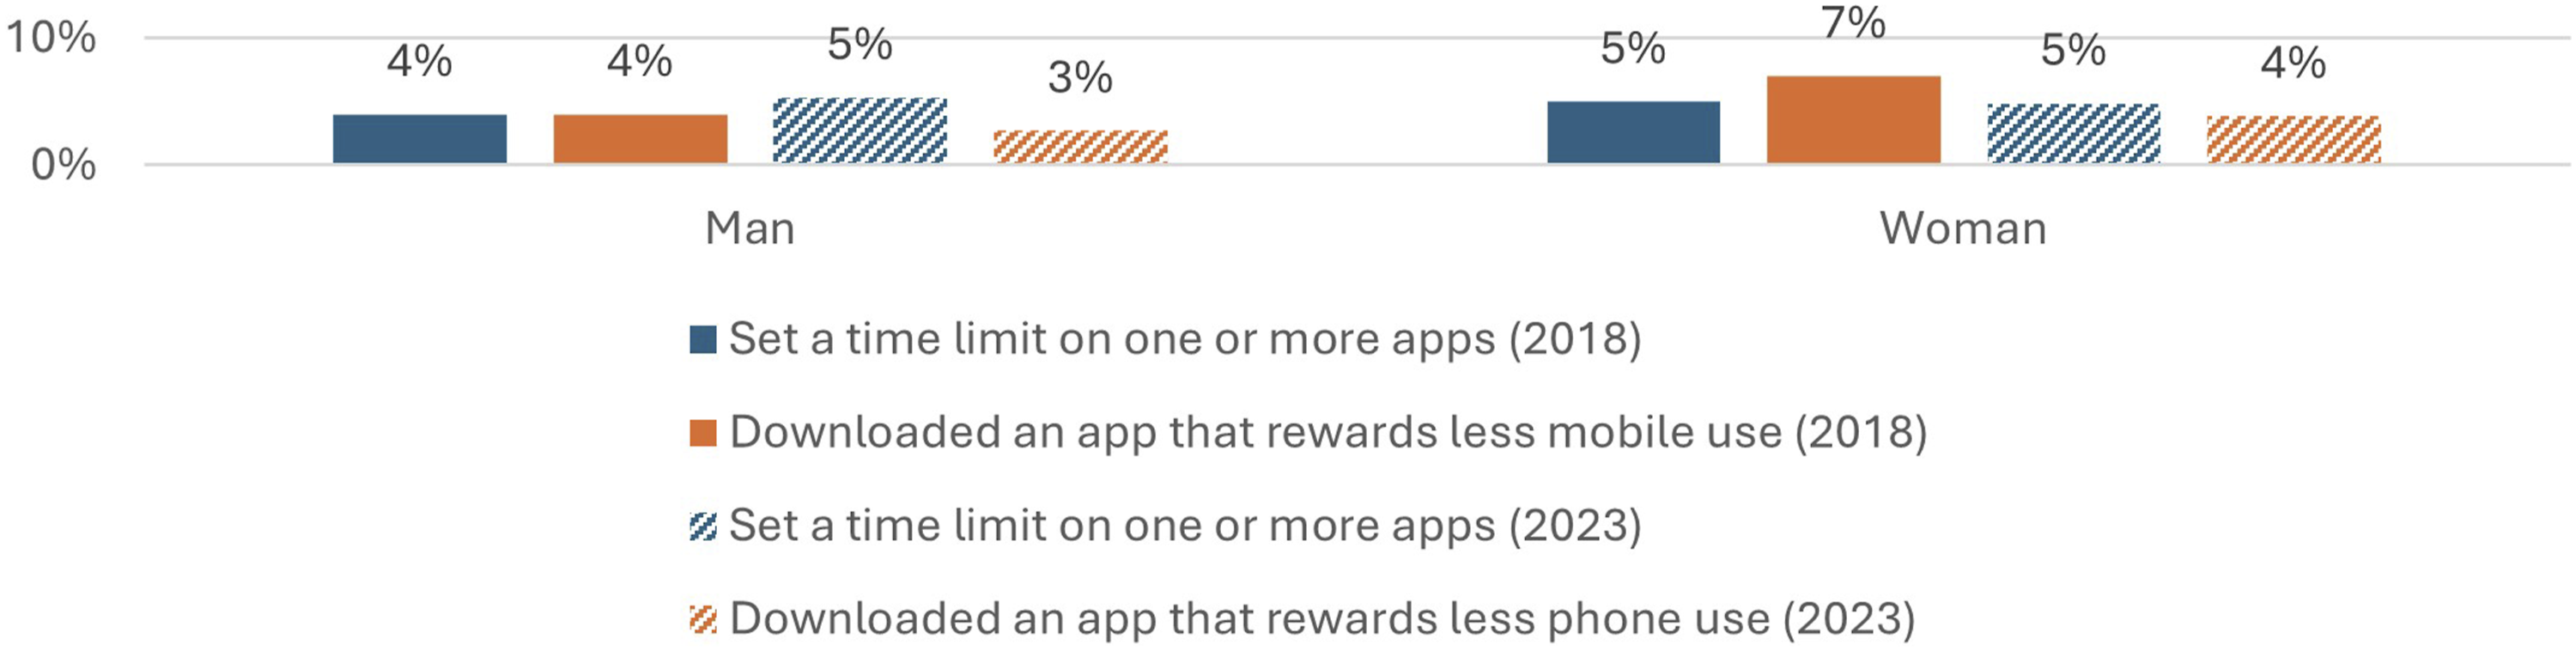
Use of two app-related measures among different gender groups 2018 (N = 1046) and 2023 (N = 1142).
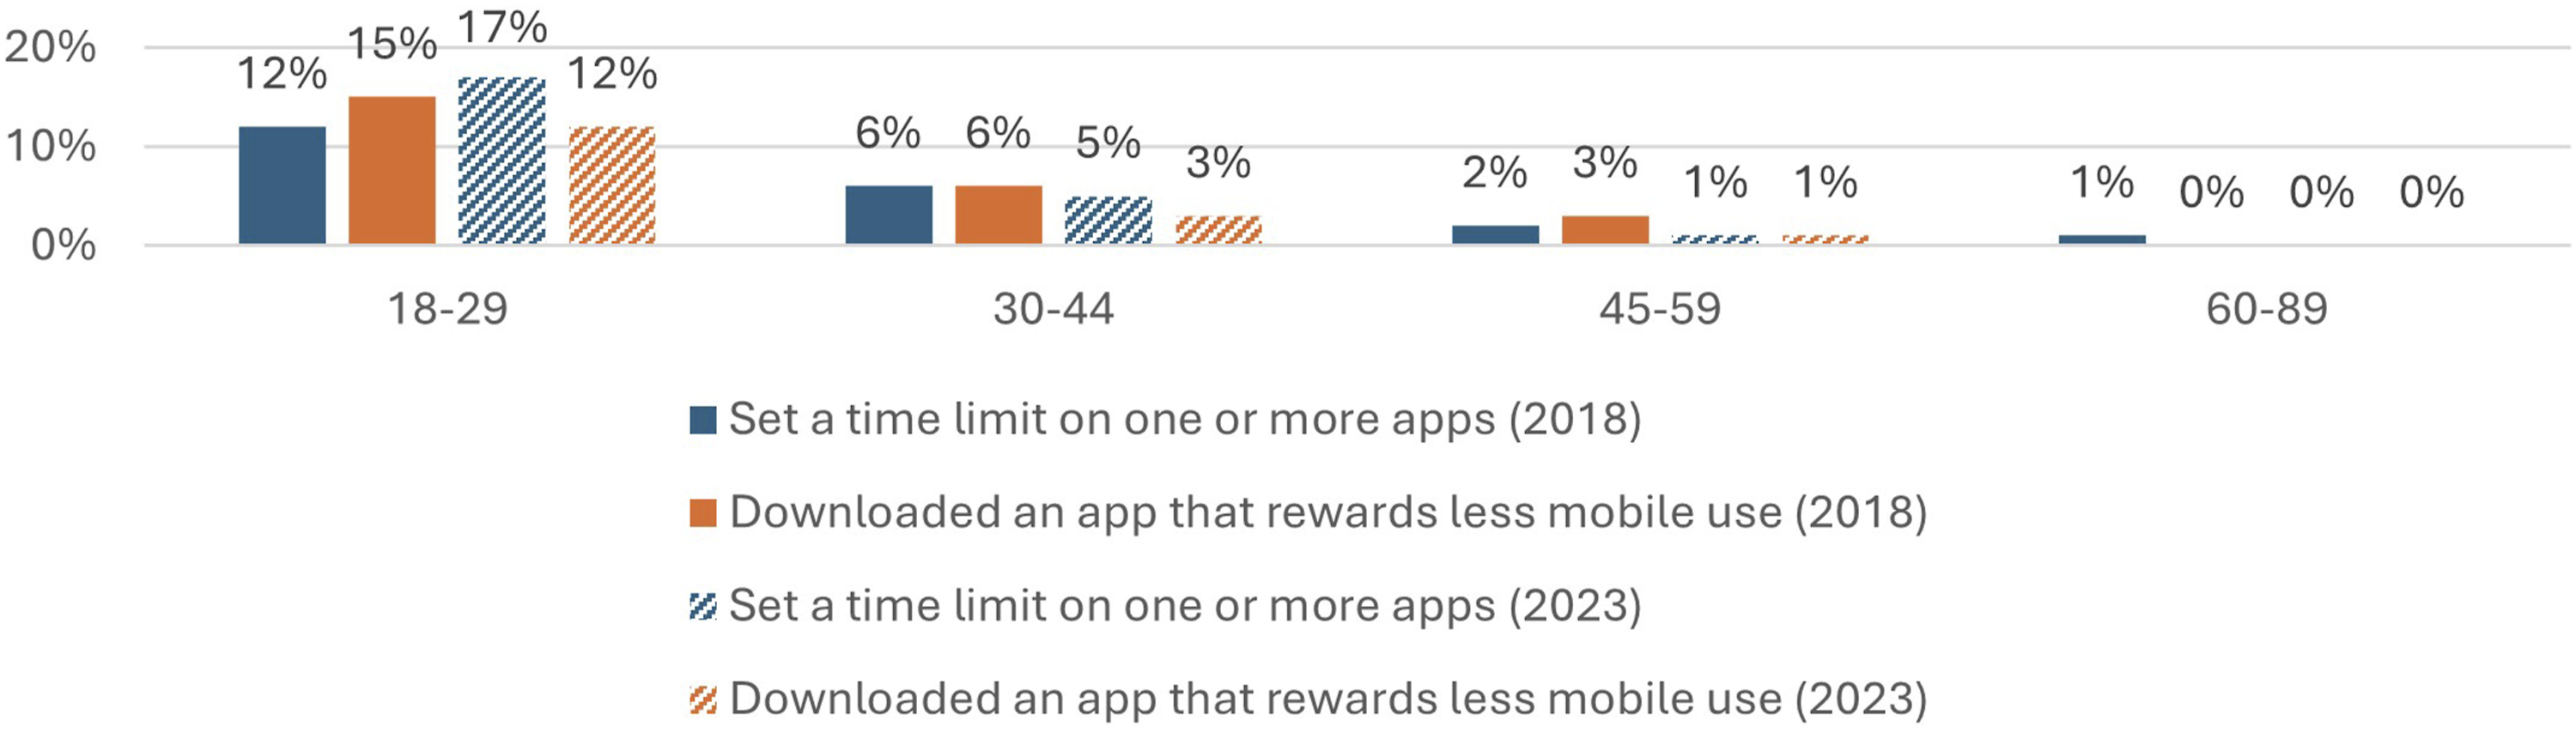
Use of two app-related measures among different age groups 2018 (N = 1046) and 2023 (N = 1142).
Use of two app-related measures among different education groups 2018 (N = 1046) and 2023 (N = 1142).
To address RQ1 and RQ3, we constructed binary outcome variables that capture overall adoption of disconnection strategies. For RQ1 and RQ3, a general technological disconnection variable was used (0 = no measures used; 1 = at least one of seven technology-related measures). For RQ3, a separate app-related disconnection variable was constructed (0 = none used; 1 = at least one of three app-related strategies: ‘deleting disruptive apps’, ‘setting time limits on apps’, and ‘downloading an app that rewards less phone use’). This approach allowed for analysis of who adopted disconnection measures and how this relates to predictors of socio-demographic variants and self-assessments on smartphone use.
Self-assessments on smartphone use
In the 2023 survey, respondents were asked about perceived overuse of online media: ‘Do you think you spend too much time online, and if so, on which media?’ (0 = No, 1 = Yes). Respondents could choose from ‘smartphone’, ‘tablet’, ‘PC/MAC’, or specify other media, or select ‘No, I don’t spend too much time online’ or ‘Do not know’. In total, 57% reported they spend too much time on smartphones (see full results in Appendix Table A2). We thus constructed a variable for perceived smartphone overuse [1 = yes, spend too much time on smartphones; 0 = no; excluding ‘Do not know’ (2%)].
Respondents were also asked to rate their agreement with eight self-constructed items reflecting their smartphone use in everyday life, including both beneficial and problematic aspects. They were rated on a scale from 1 (totally disagree) to 5 (totally agree). The items included positive (e.g. ‘I have knowledge of how various mobile apps can be helpful in daily life’) and negative statements (e.g. ‘I waste time in front of the phone screen’). These eight items (continuous) and the variable ‘I spend too much time on smartphones’ (binary) served as predictors in the logistic regression analysis for answering RQ3.
Statistical analysis
Significance of socio-demographic variants for the use of technology-related measures to restrict smartphone use (2023), based on the descriptives and logistic regression (N = 1119).
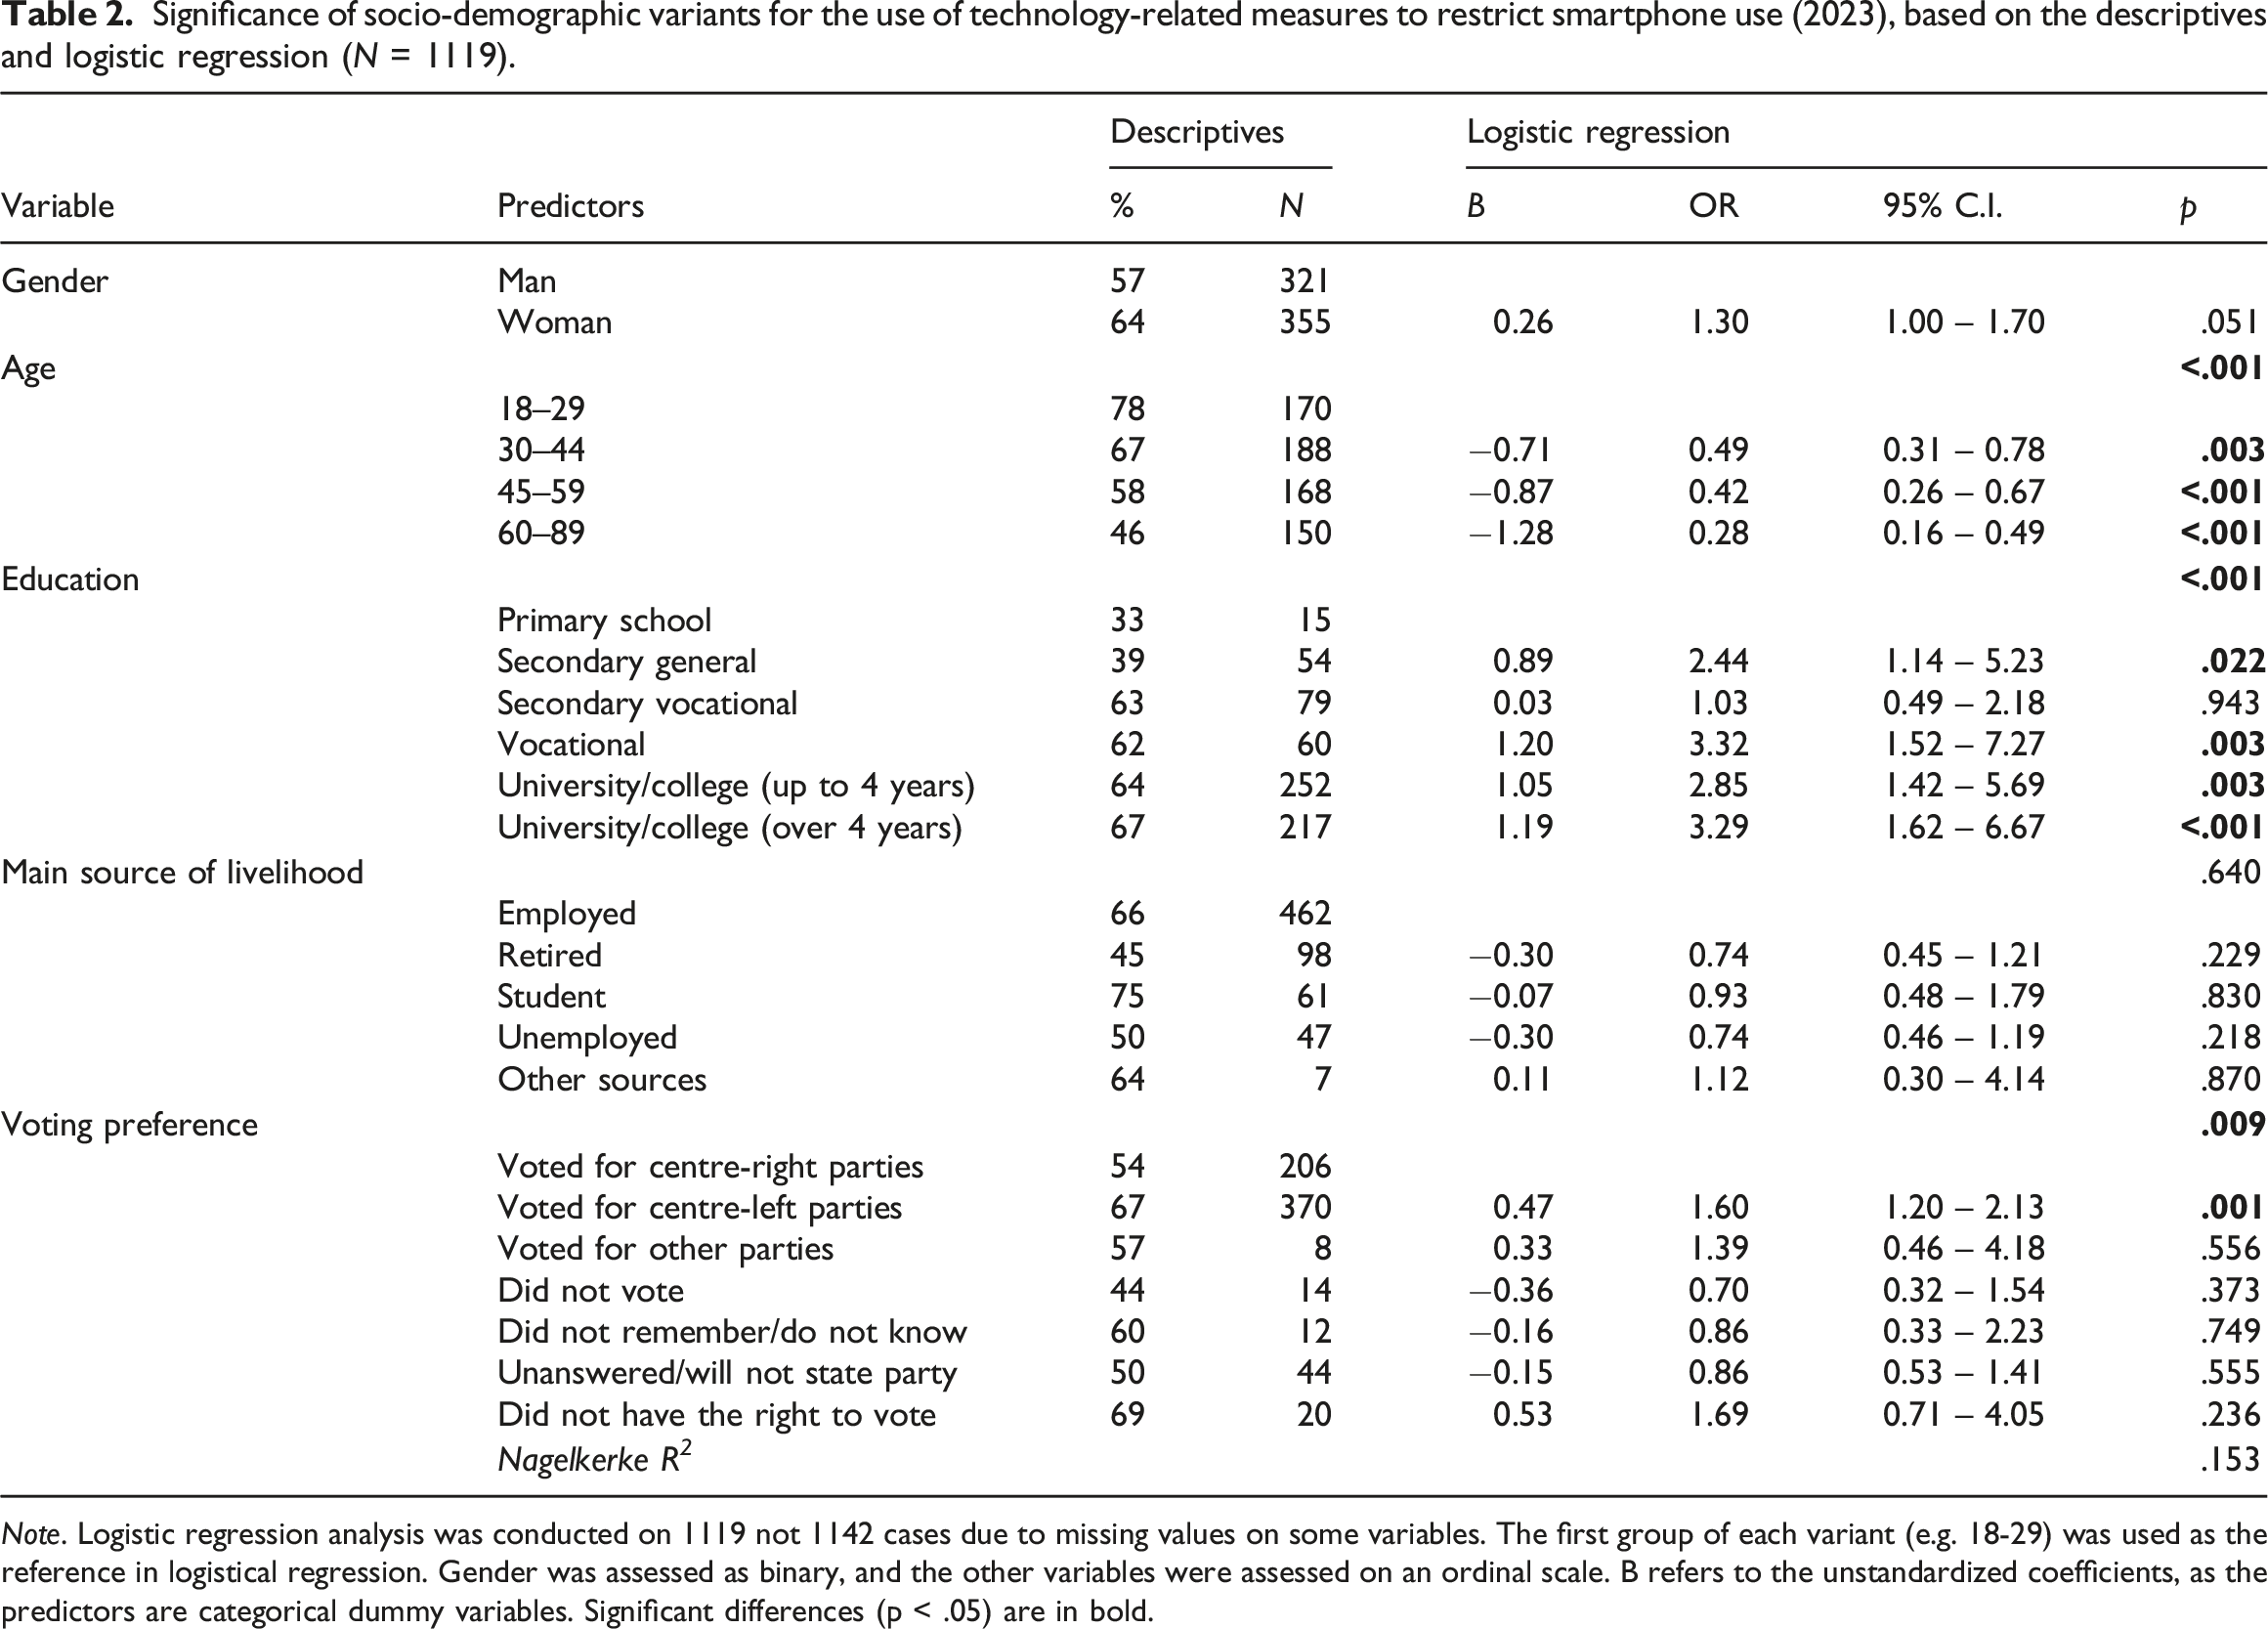
Note. Logistic regression analysis was conducted on 1119 not 1142 cases due to missing values on some variables. The first group of each variant (e.g. 18-29) was used as the reference in logistical regression. Gender was assessed as binary, and the other variables were assessed on an ordinal scale. B refers to the unstandardized coefficients, as the predictors are categorical dummy variables. Significant differences (p < .05) are in bold.
Significance of self-assessments of smartphone use for the use of technology-related measures and app-related measures to restrict smartphone use (2023), based on descriptives and logistic regression (N = 994 to 1142).
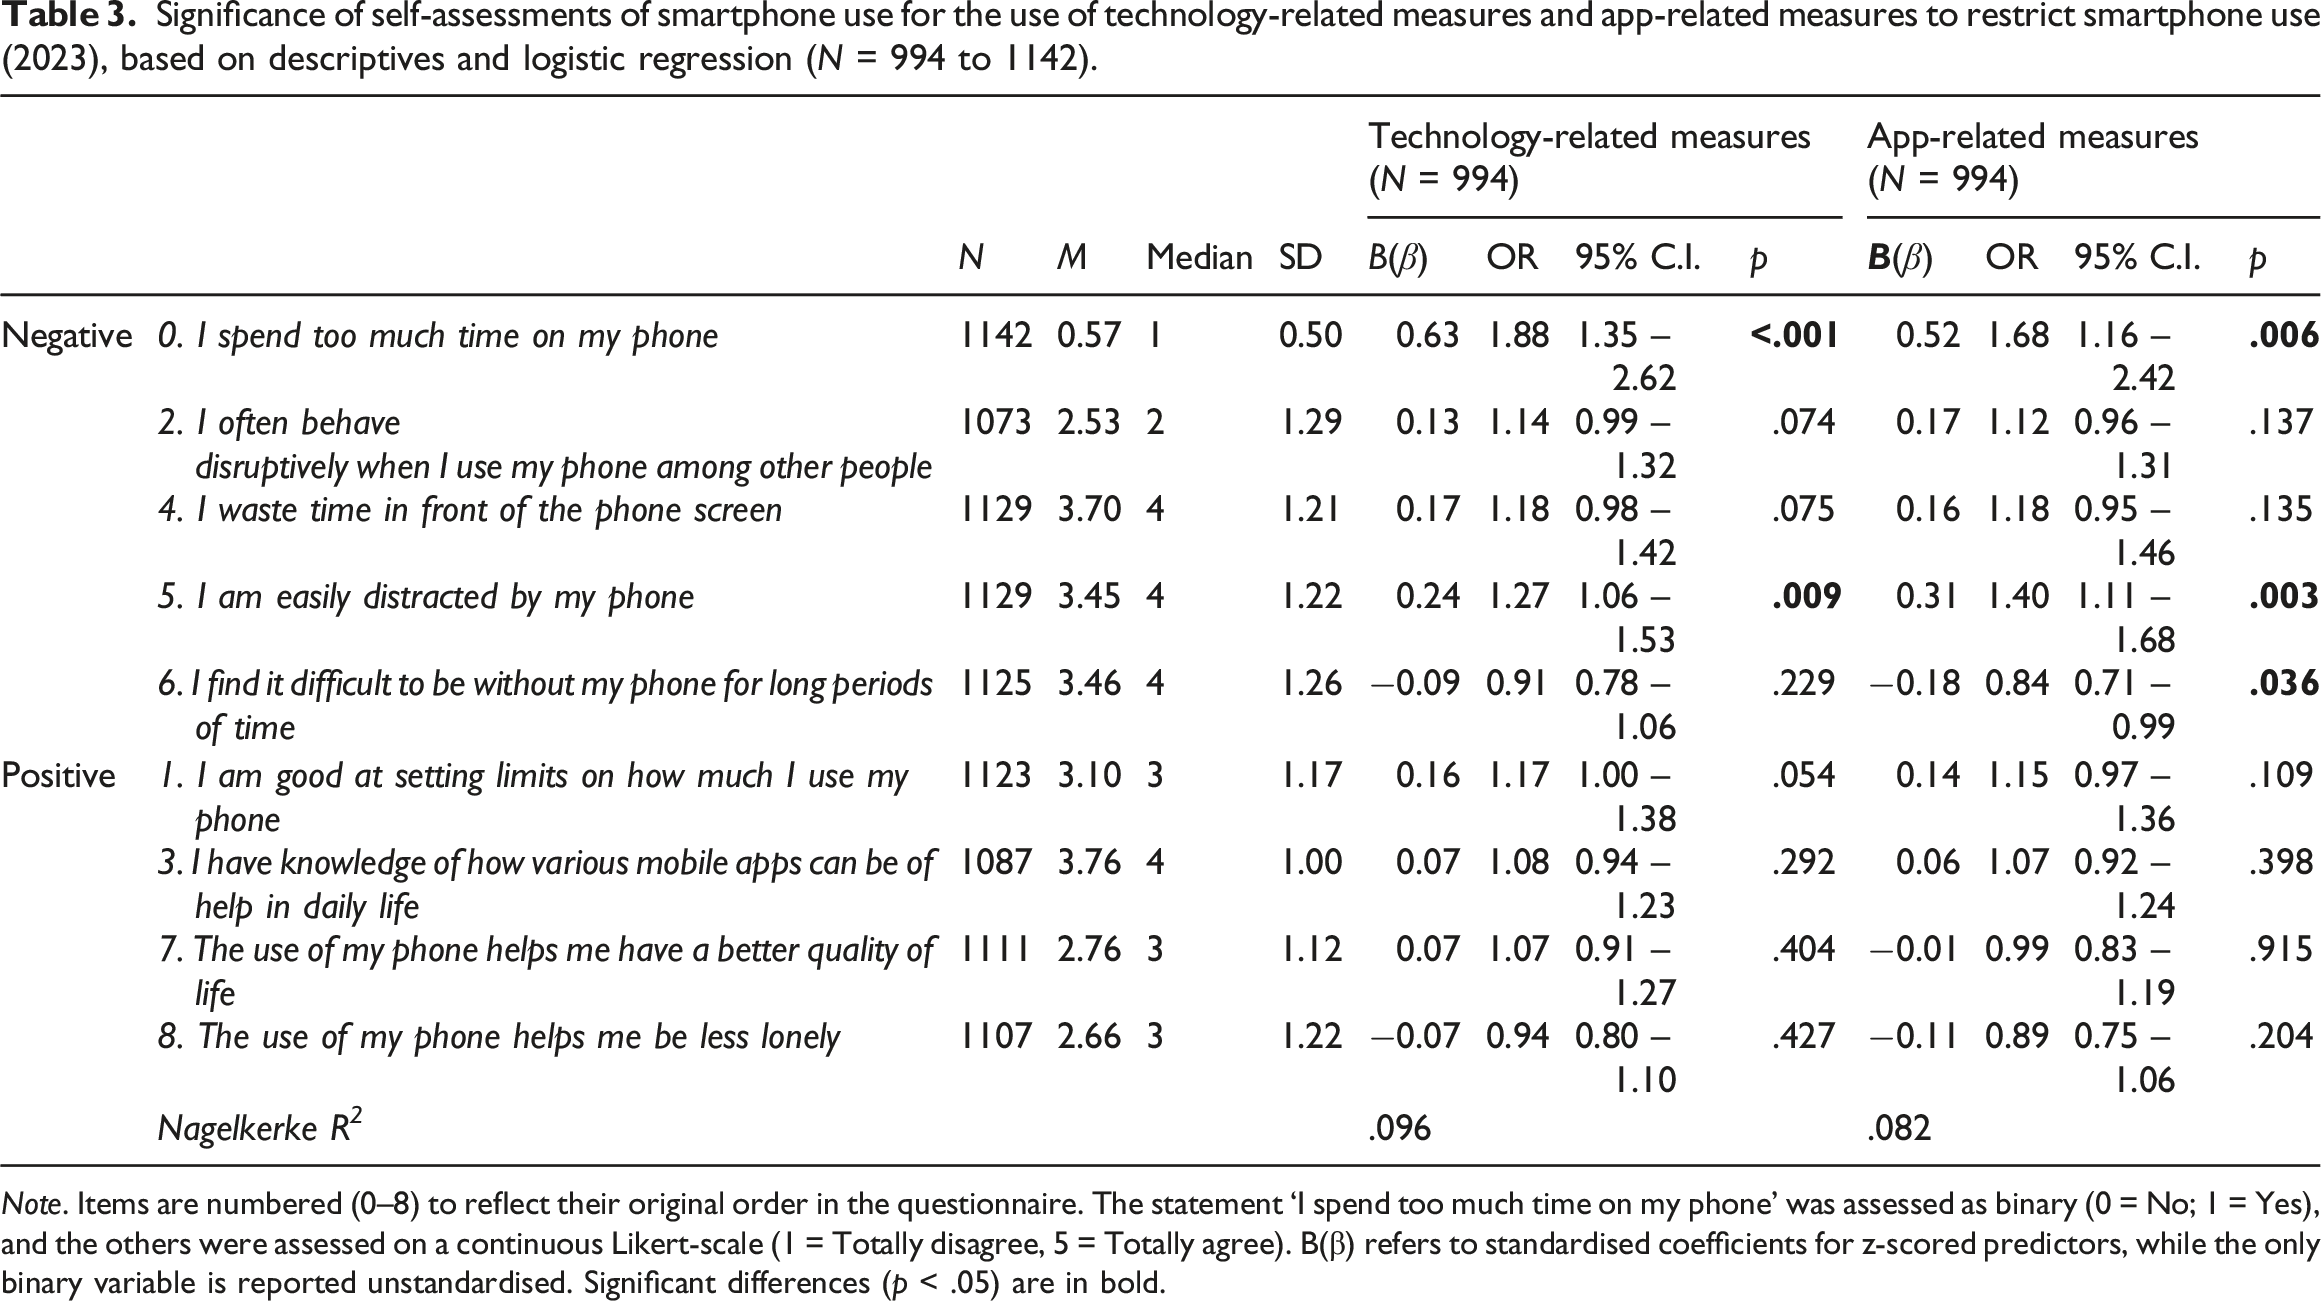
Note. Items are numbered (0–8) to reflect their original order in the questionnaire. The statement ‘I spend too much time on my phone’ was assessed as binary (0 = No; 1 = Yes), and the others were assessed on a continuous Likert-scale (1 = Totally disagree, 5 = Totally agree). B(β) refers to standardised coefficients for z-scored predictors, while the only binary variable is reported unstandardised. Significant differences (p < .05) are in bold.
Findings: Technology-related measures for restricting smartphone use
Use of technology-related measures and socio-demographics
In this section, we first present the general use of the seven technological solutions for restricting smartphone use among the Norwegian population in 2023, and then zoom in on different socio-demographic groups. The first finding is that there is great variation in the technological measures used, as seen in Table 1. Out of ten respondents, six have used at least one technology-related measure.
Regarding the specific method used, our study shows that more respondents used general measures at the device level – turning off or deleting – rather than measures involving management of apps and services. This is concurrent with the representative study on the Swiss population, showing that removing and silencing were more prevalent than measures requiring management (Vanden Abeele and Nguyen, 2023). Nguyen et al. (2022) similarly, show that simple, physical strategies were the most frequent in their study of the Belgian population.
Based on the results of the descriptives and logistic regression (Table 2), our study highlights three socio-demographic predictors of tech-related measure use. The logistic regression analysis (Nagelkerke R 2 = .153) shows the significance of three variants in predicting the adoption of tech-related measures, that are, age (p < .001), education (p < .001), and voting preferences (p = .009). The effects of gender (p = .051) are only marginally significant, and the impact of the main source of livelihood (p = .640) is not significant.
In general, younger individuals, those with higher levels of education, and voters of centre-left political parties are more likely to adopt tech-based measures for disconnection. First, younger people are significantly more likely to use tech-related measures. Compared to individuals aged 18–29 (78%), older age groups were significantly less likely to adopt technological disconnection measures, with those aged 60–89 (46%) showing the lowest odds (OR = 0.28, p < .001). Second, higher education levels are closely associated with the use of tech-related measures. For instance, compared to those with only primary education (33%), individuals with more than 4 years of university or college education (67%) were over three times as likely to adopt such measures (OR = 3.29, p < .001). Third, voting preferences influence the use of tech-related measures. Voters of centre-left parties (67%) use tech-related measures more than those voting for centre-right parties (54%). The centre-left voters are 1.6 times more likely to adopt these measures (OR = 1.60, p = .001).
The descriptives show students (75%) and the employed (65%) use tech measures more than the unemployed (50%) or the retired (45%), while women (64%) use tech-related measures more than men (57%). In the logistic regression model, however, the main source of livelihood is not a significant predictor (p = .640). Gender is close to statistical significance, with women being 1.30 times more likely to use tech measures than men, but the effect is marginal (p = .051).
Use of app-management measures and socio-demographics
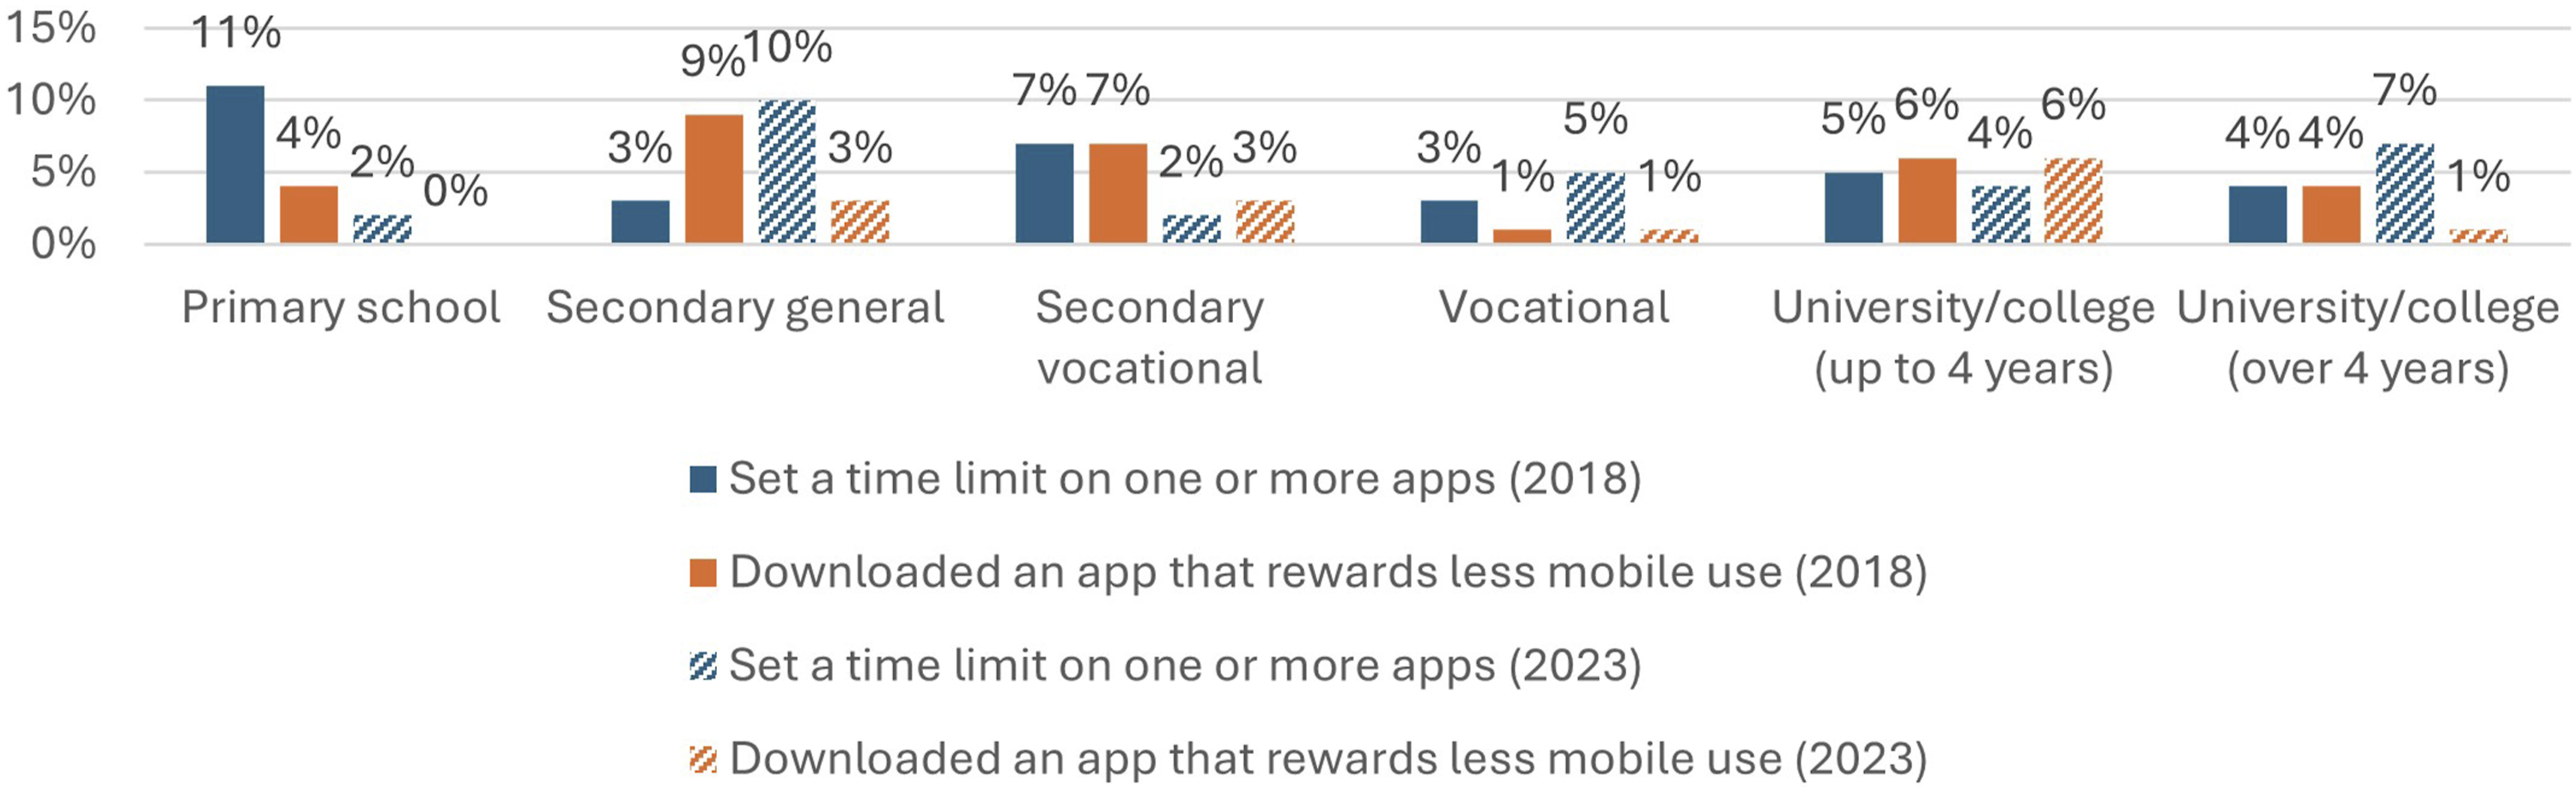
In this part, we delve deeper into the two app measures requiring more user management: setting time limits on apps and downloading an app that rewards less phone use. Unlike simpler measures such as silent mode and deleting distracting apps, these newer strategies are more proactive and reflect an emerging trend toward app-based digital wellbeing, despite their low adoption rates. Drawing on data from 2018 and 2023 we detect user trends at the societal level. Due to the small number of samples, we only use descriptives to illustrate the prevalence of the two app measures across different groups in 2018 and 2023 (Figure 1). Despite small changes in the app downloading, the two app measures have only been used by a small number of people among the Norwegian population in both 2018 and 2023.
Figures 2–4 illustrate the use of two app-management disconnection measures (setting time limits and downloading rewarding disconnection apps) across three socio-demographic variables (gender, age, and education) in 2018 and 2023. As shown in Figure 2, men and women reported similar overall rates of use for both app-management measures. The proportion of women who reported using reward-based disconnection apps decreased slightly, from 7% in 2018 to 4% in 2023. Figure 3 demonstrates a clear age gradient in the adoption of these measures: usage was highest among younger respondents and declined with age, consistent with the predictive role of age observed in the regression models (see Table 2). Young people under 30 reported highest use of both measures (12% to 17%) in both years, while respondents over 60 reported minimal use of either measure in both years (0 to 1%).
With respect to education (Figure 4), overall use of app-related measures was low across all groups and both time points. Respondents with university/college education (up to 4 years) were among the most consistent users, reporting 4–6% adoption of both measures in both years. Primary-educated respondents reported the highest use of time limits in 2018 (11%), but this dropped to 2% in 2023. By contrast, secondary general and university/college graduates (over 4 years) showed slightly higher uptake in 2023 (around 7–10%). Use of apps that rewards less phone use declined across most groups between 2018 and 2023, with the exception of vocationally educated and university/college graduates (up to 4 years), where rates remained stable (1% and 6%).
Use of technology-related measures and self-assessments of smartphone use
This section presents the results of the descriptives and logistic regression (Table 3), highlighting the self-assessments of smartphone use predictors of the tech-related measure use (including use of any of the seven measures listed) and three app-related measure use (use of any of the three app-related measures).
The distribution of responses suggests that respondents were, on the whole, more critical than positive toward their smartphone use. As shown in Table 3, perceptions of overuse, wasting time, and distraction were widely shared, with more than half of respondents partly or totally agreeing with these statements (see detailed percentages in Appendix Table A3). Evaluations of one’s ability to set limits, as well as the benefits of phone use for quality of life and reducing loneliness, were neutral or leaned toward the negative. The only areas where respondents expressed greater confidence were in their knowledge of helpful apps and in not behaving disruptively when using their phones around others.
Both logistic regression models highlighted a shared pattern: respondents who perceived that they spent too much time on their phones and felt easily distracted by them were more likely to adopt disconnection strategies, whether technology-related (p < .001; p = .009) or app-related (p = .006; p = .003). Differently, the technology-related model showed a marginal effect for respondents who considered themselves good at setting limits (p = .054), suggesting that a sense of self-control may play some role in the general adoption of technological disconnection measures. By contrast, in the app-related model, those who reported finding it difficult to be without their phones were significantly less likely to adopt app-based measures (p = .036), indicating that heavier phone dependence may hinder engagement with app-related measures for disconnection.
Discussion
This article has mapped the evolvement of technological measures for disconnection and added insight from another national context to the survey studies that have emerged in recent years (Beattie et al., 2024; Fast et al., 2021; Nguyen et al., 2022; Vanden Abeele and Nguyen, 2023; Willekens et al., 2022). We found that 59% in Norway used at least one of the seven listed technological measures to disconnect from their smartphones in 2023. In this part, we discuss our findings considering recent literature under three subheadings: how important it is that different measures for disconnection are available, how important the socio-demographic differences are, and how important it is to analyse how respondents assess their smartphone use.
Regarding the importance of different measures, we have shown how many simpler measures used for disconnection predate the smartphone era. There is no indication that the more complex measures developed on the commercial market to aid users’ self-regulation in recent years are more popular among users than the older and simpler measures. Our study showed that simpler technological methods for disconnection, such as silencing, removing, and deleting, are more used than measures requiring management of apps and settings, a finding that is consistent with other studies (Nguyen et al., 2022; Vanden Abeele and Nguyen, 2023). Over the last 5 years, more complex measures such as downloading disconnection apps and setting time limits on apps have not become widely adopted among the Norwegian population (3% to 6%). If apps and wellness tools were efficient and easy to use, one could have expected their use to spread to older age groups.
Since disconnection is work, users reduce their workload by sticking to less laborious measures (Fast, 2021). Setting time limits on an Android phone, for example, requires users to learn how to use the wellbeing settings, identify disruptive apps, and set daily time limits beforehand (Google, 2018). Nevertheless, the fact that very few say that they use a simpler phone or avoid upgrading may indicate that few make a statement of ‘deliberate technological slowdown and measured resistance’ (Thorén et al., 2019: p. 330).
Regarding the importance of socio-demographic differences, our study found that using technologies to disconnect is very much a generation-based, sociocultural capital-relevant choice. Our extended use of background variables enables us to provide a more comprehensive picture of users’ characteristics than other studies. Not only age and education, but also voting preferences are strong predictors in our study. People who support the centre-left in Norway, are more likely to use technological measures than supporters of the centre-right. A left-leaning voting preference and higher education may indicate cultural capital associated with moral concerns about over-connection (Enli, 2025; Fast et al., 2021; Willekens et al., 2022). Hence, our study supports the arguments and investigations within the media-critical tradition that the use of disconnective measures reflects certain forms of (cultural) capital (Beattie, 2020; Fast, 2021; Kuntsman and Miyake, 2022).
Our results are concurrent with observations and results from other nationally representative studies, but there are also diverging results. The age differences in our study regarding technological measures echo the representative study on the Swiss population (Nguyen et al., 2021). Young people use the measures more probably due to a combination of higher dependence on and competence with digital media among the young (Nguyen et al., 2021, 2022). However, as shown by Beattie et al. (2024), young people also find it more difficult to disconnect for these same reasons. However, when it comes to gender and education, our findings diverge from the study of the Swiss population (Nguyen et al., 2022). Also, in the New Zealand study, gender was the only significant factor explaining disconnection frequency, as women had higher odds of frequent disconnection (though not specifically through technological measures) than men (Beattie et al., 2024). Although gender makes a marginally significant difference in our study, it is not as decisive as age, education, and even voting preference, in shaping people’s use of technological measures for disconnection.
Regarding the importance of self-assessments, our study showed that individuals’ perceptions of their smartphone use predicted their likelihood of adopting technological disconnection strategies in general. Respondents who perceived that they spent too much time on their phones and felt easily distracted by them were more likely to use both technology-related and app-based disconnection measures, while nuances emerged between the two. The study underscores observations from other studies discussing the complexity of using technological or app/platform-based measures (Franks et al., 2022; Mannell, 2019). Since our survey did not inquire about motivations for, and outcomes of, using disconnection measures, we cannot conclude on the efficiency of such measures. Two interpretations nevertheless stand out: concerns about overuse may motivate adoption, while the very use of tech-based disconnection measures may also heighten awareness of problematic patterns. This dynamic exemplifies the paradox of ‘beating tech with tech’, where technological solutions may both alleviate and reinforce the sense of entanglement. In either case, our data shows that those who have tried such measures for disconnection are above-average concerned about their phone use.
There are limitations of the study. The survey measured the use of seven measures for regulating smartphone use based on qualitative studies and literature when the survey was designed. Other studies chose some of the same and some different features, with similar or different framings of specific problems or solutions. As the number of studies expands, future studies may include more of the same measures, making it easier to compare results across national borders (see Nassen et al., 2023). There are also specific challenges with our measures that impact interpretation. The time scale of 12 months is quite long, and difficulty remembering or assessing situations can lead to both under- and over reporting. Respondents may also tend to confirm the importance of disconnection due to the social desirability bias.
Finally, the explanatory power of our regression models was modest (Nagelkerke R 2 < .2), indicating that while some socio-demographic variants and self-assessments of phone use are significant predictors, other factors influence the adoption of technology- or app-related disconnection measures. Contextual conditions such as work, family responsibilities, institutional expectations, or broader cultural attitudes toward apps or technology may play important roles. As more practical and social functions are integrated into smartphones, there is a parallel push for expanding innovative measures for self-regulation into those same devices. Further research may continue to delve into the issue of whether the ‘disconnective media’ (Bozan and Treré, 2024) helps solve problems associated with all-pervasive connectivity.
Footnotes
Acknowledgements
We thank the members of the Digitox research project and the anonymous reviewers for their valubale feedback to the eariler drafts.
Funding
The authors disclosed receipt of the following financial support for the research, authorship, and/or publication of this article: The research was supported by Norges Forskningsråd, Grant No. 287563 (2019-24). Project title: Intrusive Media, Ambivalent Users and Digital Detox (Digitox).
Declaration of conflicting interests
The authors declared no potential conflicts of interest with respect to the research, authorship, and/or publication of this article.
Appendix
Characteristics of the samples in 2018 and 2023 surveys. Note. The categories were used by Kantar, but the last two variants (main source of livelihood and voting preferences) were regrouped by researchers to reduce the number of categories and keep them focused. The voting preference was mainly clustered into two groups: people who voted for the centre-right government coalition that was previously in power (2013 – 2021) and those who voted for parties backing the current centre-left government.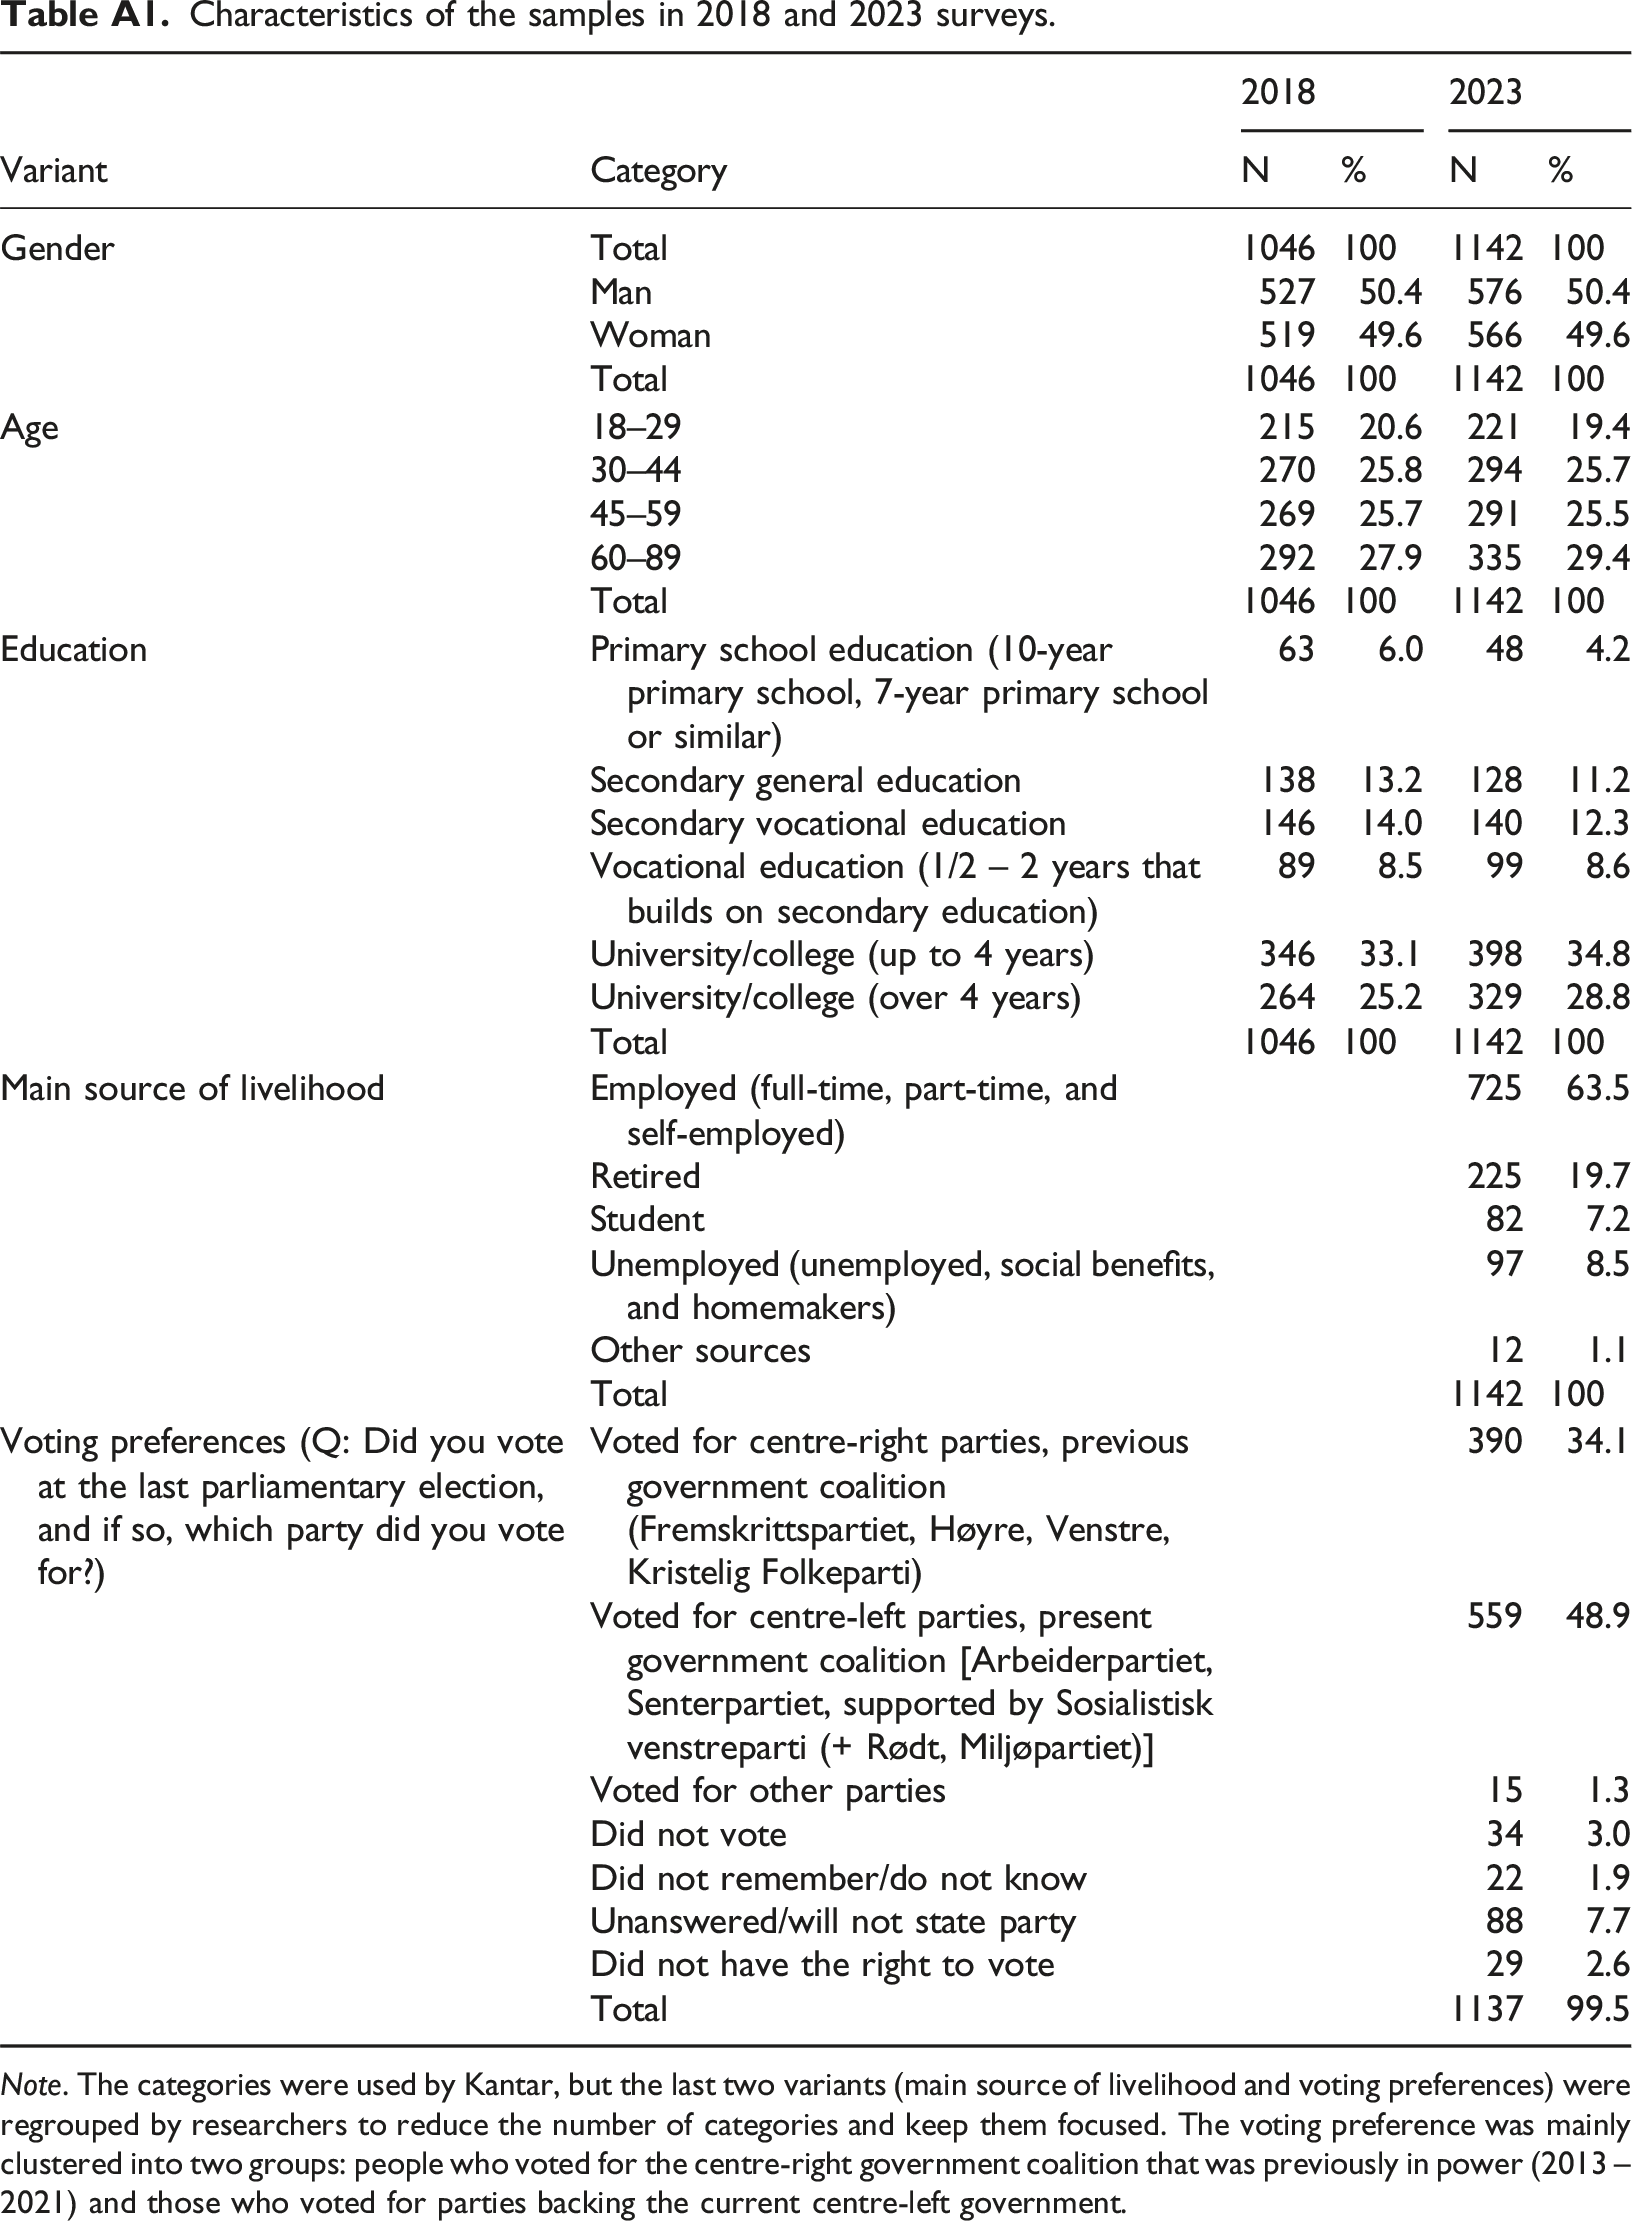
Variant
Category
2018
2023
N
%
N
%
Gender
Total
1046
100
1142
100
Man
527
50.4
576
50.4
Woman
519
49.6
566
49.6
Total
1046
100
1142
100
Age
18–29
215
20.6
221
19.4
30–44
270
25.8
294
25.7
45–59
269
25.7
291
25.5
60–89
292
27.9
335
29.4
Total
1046
100
1142
100
Education
Primary school education (10-year primary school, 7-year primary school or similar)
63
6.0
48
4.2
Secondary general education
138
13.2
128
11.2
Secondary vocational education
146
14.0
140
12.3
Vocational education (1/2 – 2 years that builds on secondary education)
89
8.5
99
8.6
University/college (up to 4 years)
346
33.1
398
34.8
University/college (over 4 years)
264
25.2
329
28.8
Total
1046
100
1142
100
Main source of livelihood
Employed (full-time, part-time, and self-employed)
725
63.5
Retired
225
19.7
Student
82
7.2
Unemployed (unemployed, social benefits, and homemakers)
97
8.5
Other sources
12
1.1
Total
1142
100
Voting preferences (Q: Did you vote at the last parliamentary election, and if so, which party did you vote for?)
Voted for centre-right parties, previous government coalition (Fremskrittspartiet, Høyre, Venstre, Kristelig Folkeparti)
390
34.1
Voted for centre-left parties, present government coalition [Arbeiderpartiet, Senterpartiet, supported by Sosialistisk venstreparti (+ Rødt, Miljøpartiet)]
559
48.9
Voted for other parties
15
1.3
Did not vote
34
3.0
Did not remember/do not know
22
1.9
Unanswered/will not state party
88
7.7
Did not have the right to vote
29
2.6
Total
1137
99.5
Self-reported online overuse in 2023 (N = 1142).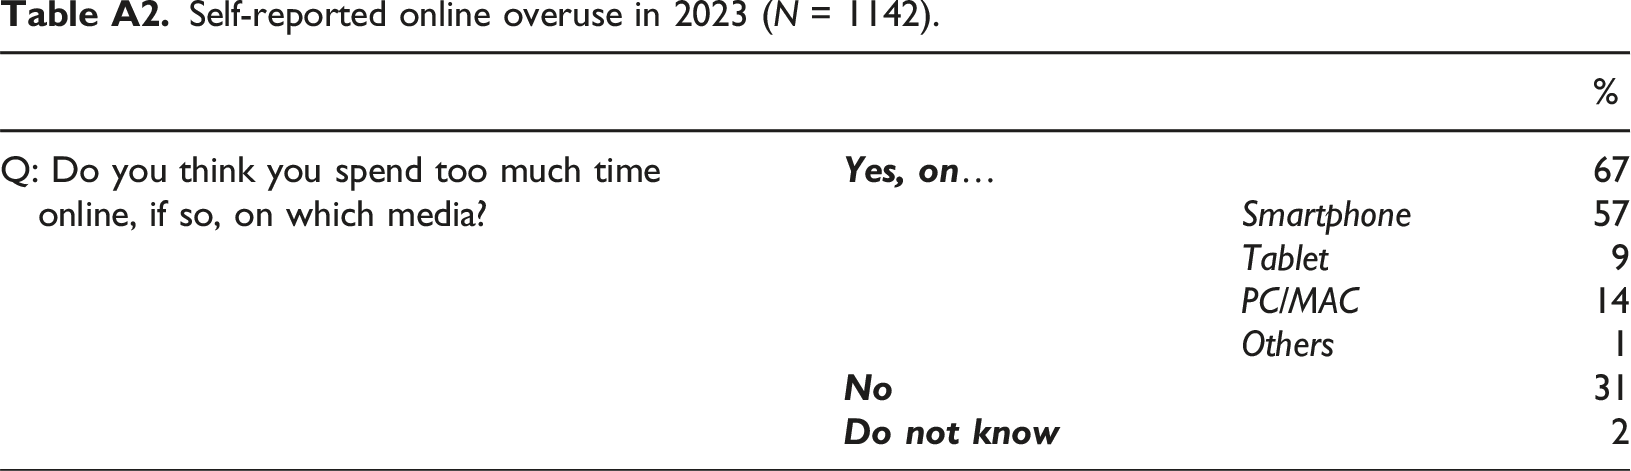
%
Q: Do you think you spend too much time online, if so, on which media?
67
Smartphone
57
Tablet
9
PC/MAC
14
Others
1
31
2
Self-reported smartphone use in 2023 (N = 1073 to 1142). Note. Items are numbered (0–8) to reflect their original order in the questionnaire. The statement ‘I spend too much time on my phone’ was assessed as binary (0 = No; 1 = Yes), and the others were assessed on a continuous Likert-scale (1 = Totally disagree, 5 = Totally agree). ‘N/A’ and ‘Do not know’ (0-6%) are excluded.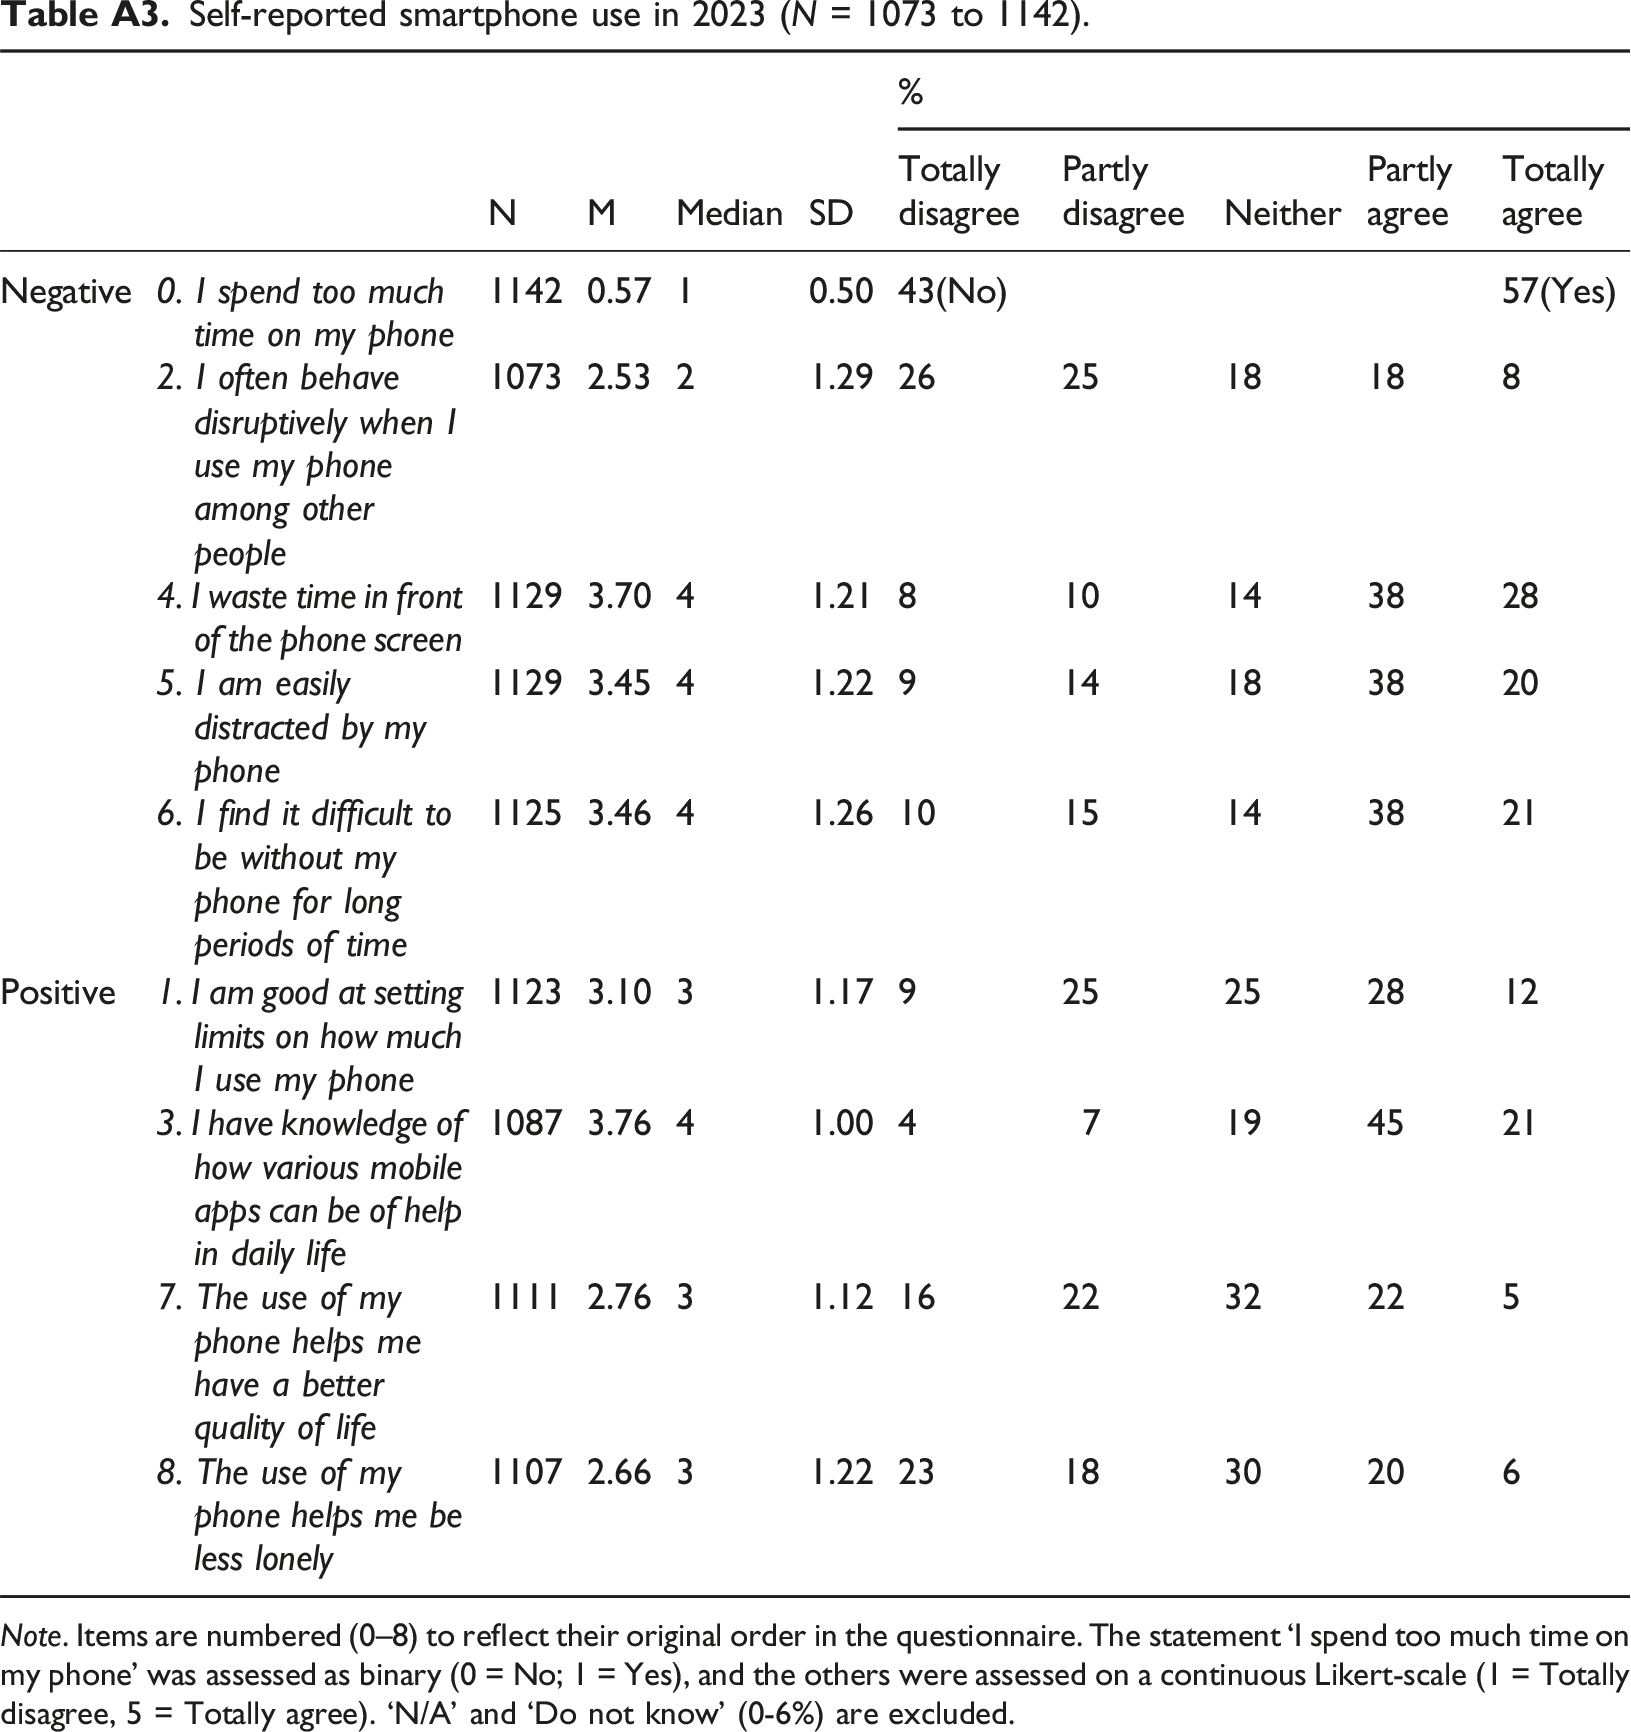
%
N
M
Median
SD
Totally disagree
Partly disagree
Neither
Partly agree
Totally agree
Negative
0. I spend too much time on my phone
1142
0.57
1
0.50
43(No)
57(Yes)
2. I often behave disruptively when I use my phone among other people
1073
2.53
2
1.29
26
25
18
18
8
4. I waste time in front of the phone screen
1129
3.70
4
1.21
8
10
14
38
28
5. I am easily distracted by my phone
1129
3.45
4
1.22
9
14
18
38
20
6. I find it difficult to be without my phone for long periods of time
1125
3.46
4
1.26
10
15
14
38
21
Positive
1. I am good at setting limits on how much I use my phone
1123
3.10
3
1.17
9
25
25
28
12
3. I have knowledge of how various mobile apps can be of help in daily life
1087
3.76
4
1.00
4
7
19
45
21
7. The use of my phone helps me have a better quality of life
1111
2.76
3
1.12
16
22
32
22
5
8. The use of my phone helps me be less lonely
1107
2.66
3
1.22
23
18
30
20
6