
Abstract
The proliferating platformization and digital transformation require designing and deploying suitable research methods and approaches to address the hybrid nature of actors, relations, practices, and the growing importance of the context. This paper explores the design of such a tailored methodology for investigating the value-driven development of online public service media platforms in Germany. While qualitative methodologies are time- and resource-consuming and digital methods leave out less context to the field, this mixed methodology emphasizes the context and invests in collecting thick data. It encompasses multiple stages of recording and mapping that employ qualitative and quantitative approaches to bring together various vignettes, unveiling complementary context and contradictory accounts with the help of visualization. In each mapping and visualization stage, the paper investigates actors and relationships heuristically and emphasizes the work-in-progress nature of mapping regarding platforms.
Keywords
Introduction
ARD Mediathek and Audiothek are two online media library platforms and content recommender systems of the Association of Public Broadcasting Corporations in the Federal Republic of Germany (ARD). They have been negotiating and claiming their place within the Public Service Media (PSM) infrastructure since 2013. They moderate and negotiate ARD’s digital transformation as flagship digital products. Central to these platforms’ development and design are ARD public values: participation, regionality, added value, independence, quality, innovation, responsibility, and diversity (ARD, 2021). These values are connected to various value systems, such as normative social or professional journalistic values, and are supposed to reflect what society desires as a collective (Van Eimeren, 2019). The embodiment of these values in the design and development process and the product is not imperative.
Two perspectives address public values’ entanglement in the design and development of ARD Online media libraries. The first perspective, mostly practiced and emphasized by media law scholars and requirements engineers, finds public values as inputs and outputs. They are requirements and checkboxes before development starts and regulatory frameworks with which the final product should comply (Kosenkov et al., 2021; Rhein et al., 2021). The second perspective goes beyond the input/output framework and sees public values as fluid in development. Seminal empirical and conceptual works on Value in Design (VID) and Value Sensitive Design (VSD) study the information infrastructure and the embodied values by taking in the devices and tools, their functionality and condition of use, designers, engineers, managers, users, their expectations and the political, social, and technical context by rendering qualitative research methodologies (Friedman et al., 2001; Nissenbaum, 2001). In this line of research, values are being discussed and practiced implicitly and explicitly as emerging limitations and constraints in a developer’s everyday life (Nissenbaum, 2010; Shilton, 2018).
In this paper, with an eye on the second perspective, I look at the embodiment of public values within the ARD media libraries development process as a case study of mapping the context. To do so, I design and deploy a mixed quali-quantitative methodology to shed light on the situated frails behind embedding values in a public service platform. On the one hand, qualitative methods are valuable tools for examining the field. They ‘allow us to appreciate the richness of social situations and how they create contained but fully fledged social worlds’ (Venturini, 2024). Digital methods are essential for navigating the increasingly online landscape (Rogers, 2015). They serve as both research tools and subjects, repurposing digital life elements like search engines and APIs to explore traditional sociological topics (Venturini, 2024). These methods enable quick and detailed data collection, helping to identify controversies, trends, and patterns the quick and detailed data collection of digital methods.
Critiques of digital methods raise concerns about the lack of context, which is fundamental in qualitative research for situating social phenomena within their relational, cultural, and temporal environments. Context is dynamically constructed through interaction (Dourish, 2004) and captures nuances often missed in quantitative data. Maintaining context integrity is essential for nuanced and authentic analysis (Strathern et al., 1987). Critics rightfully consider how user interactions and technological frameworks shape digital contexts. However, interaction and dynamics in digital media are central to digital methods and how researchers repurpose these new methods for study. Additionally, critiques caution that results may reflect more about the algorithm than the actual material-semiotics of the field (Kanngieser et al., 2014). Nevertheless, it should not be assumed that researchers using digital methodologies are unaware of the deficits in digital data records compared to the ‘thickness and sophistication of classic ethnographic observations and the careful curation of classic statistical datasets’ (Venturini, 2024). Instead, digital methods require the researcher to be reflexive about the data collection and analysis.
In considering the context and affordances of digital methods, I aim for a tailored quali-quantitative methodology considering various knowledge production spaces of value embodiment. The approach should allow the researcher to navigate between these spaces while acknowledging their gaps and commonplaces and equipping the researcher with appropriate data collection and analysis tools. It also emphasizes the case-in-progress and allows for bringing new accounts and narratives to the corpus, helping the researcher to maintain Janus’s face.
In what follows, I briefly discuss the methods for studying emerging digital infrastructures and platforms, mainly among STS scholars. I delve into my methodological discussion and explore my mapping approach as a case study. The conflicts and tensions behind the development of the platforms emerge among numerous documents and accounts generated at various times and places. Therefore, in describing people, practices, and products, their entanglements, and relationships – in general, bringing context to the eyes – I am moving between various insights gathered from discourse analysis and conducting semi-structured expert interviews, as well as incorporating pseudo-computational approaches and methods of comprehending the discourse. I will emphasize the importance of contextualizing and investing in thick data instead of just big data.
I expect several ‘work-in-progress’ maps, which are complementary and each focus on a particular account. Each map and methodology is uniquely chosen based on the context. They follow the mundane and take the infrastructure as relational and ecological (Star, 1999), dig into its different compartments, and look at the discussion around embedding values as a conflict. Mixed methodology details the relationships and practices between and of different actors, locations, and temporalities. I will conclude my discussion by highlighting the interdependence between qualitative and quantitative in studying complex digital infrastructure.
Literature review
Social scientists invent and devise methodologies as research’ technologies’, tools to approach and connect to certain social groups and traverse webs of meaning – what Geertz (1973) calls culture – created and developed by them. The instrumentalist view on methods looks at them as techniques to understand the social world, what fills the gap between the ‘social’ and the ‘the social scientist’, and provides an ‘objective’ analysis. Scholars like Geertz contest this objectivity in reproducing an act and its perception and interpretation among ethnographers. For them, ethnography is not fact collection – or, in his words, ‘to bring a body of uninterpreted data’ – but a series of clarifications and verifications from the ethnographer ‘that bring us into touch with the lives of strangers’.
With the advent of computer systems and the Internet, an unprecedented amount of data has been amassed and analyzed, calling for developing new methodologies to effectively comprehend and analyze these changes (Back, 2010; Lash, 2002; Savage and Burrows, 2007). Addressing a live and attentive sociological apparatus reinforces methods as more than ‘matters of technique’ (Law, 2010) since they are constituted by and constituting the social world (Law et al., 2011). Digital methods, as Venturini (2024) highlights, further complicate this relationship, blending the construction and interpretation of social phenomena with computational techniques to navigate the vast and interconnected nature of digital data.
Complex and hard-to-navigate social theory is now revisited with more ease by deploying digital data sets (Latour et al., 2012). Capitalizing on the capability of quali-quantitative analysis contributes to scaling up the level of theory, navigates multidimensional structures, and enhances the capacity to scale up theoretical insights (Fonseca et al., 2019; Toubol and Larsen, 2017).
Moreover, numerous scholars have been critically examining the intersection of traditional social science methodology with computational methods, emphasizing its role in bridging traditional and computational analyses (Blok and Pedersen, 2014; Carlsen and Ralund, 2022; Doja et al., 2021; Venturini et al., 2014; ), Big Data (Bornakke and Due 2018; Halford and Savage, 2017; Tinati et al., 2014), Artificial Intelligence (AI) (Munk et al., 2022), and development of digital ethnography and the integration of ‘thick data’ to capture cultural nuance (Hsu, 2014; Isfeldt et al., 2022; Robinson and Schulz, 2009). Meanwhile, Isfeldt et al. (2022) demonstrate the value of combining (n)ethnographic observation with computational techniques to analyze the socio-temporal dynamics of hybrid online/offline phenomena.
Developing new ‘social research technologies’ to capture and analyze the essence of sociality in digital social life has also been soaring, especially in STS. These methods are integral to and critical of the medium, simultaneously empowered by the digital culture and constitute it (Rogers, 2015). They capture and reveal the logic of the ‘digital’ in its own terms. For instance, they devise Internet protocols, URLs, websites, search engines, hashtags, APIs, and codes to build and invent new digital data collection and analysis technologies.
Accordingly, digital methods are ‘quali-quantitative’ as they ‘let us go through a social phenomenon via a process of construction, deconstruction, and reconstruction that constitute them’ (Venturini and Latour, 2010). Perceiving digital methods as quali-quantitative is a crucial step in emphasizing the digital sociologist’s effort to achieve a native interpretation of the associations and relationships behind digital logic. It also acknowledges that qualitative and quantitative methodologies unfold in their methodological premises, provide insights in their own terms, and offer complementary analysis (Munk, 2019); being ‘mutually exclusive’ as they are ‘mutually necessary’ (Block and Pedersen, 2014).
Furthermore, over-reliance on digital methods – which may decontextualize social phenomena – has intertwined with a discourse that requires reflexivity and engagement from the researcher. Rogers (2018) and Niederer (2019) point out that digital methods – when limited to, for instance, hyperlink analysis and not the actual user’s organic behavior – often treat data as neutral, overlooking the sociotechnical processes and power dynamics embedded in their production and dissemination. Following this line, Venturini et al. (2015) remind us that the data we get from the platforms does not accurately represent the social phenomena, as they have been primarily collected for marketing and surveillance. Moreover, Moats and Borra (2018) criticize the static nature of many digital methods, which focus on structural networks without accounting for temporal and contextual variations in data.
While concerns about how digital methods shadow the context and show the algorithmic dynamics warn about the body of uninterpreted data that it brings, digital methods shall be developed and conducted reflexively and always in concert with the context. Digital methods can connect to context and employ it as a plural form that ‘acknowledges the multiplicity of frameworks that can inform the interpretation of any given subject’ (Burke, 2022). Thus emphasizing the never demising role of the researcher to connect and relate to the lives of strangers beyond the quantitative data and algorithms.
Visualization
In connecting to the lives of strangers, visualization and mapping are indispensable to digital methods, particularly for unraveling controversies, issues, and the dynamics of the digital mundane. Studies like Yasseri et al.’s (2012) analysis of Wikipedia editorial conflicts, Marres and Moats’ (2015) mapping of ‘privacy’ and ‘surveillance’ on Twitter after the NSA leaks, and Waller and Gugganig’s (2021) investigation of urban food issues across digital and physical spaces showcase the power of visualization to dissect complex topics. These approaches examine embedded features like hashtags, likes, and comments to understand community dynamics, actor positions, issue evolution, and the underlying politics and power structures (Marres, 2015). Visualization bridges qualitative and quantitative methods, enabling a nuanced understanding of granular interactions and broader societal trends and navigating the intricacies of large digital datasets while respecting the depth of qualitative inquiry.
Furthermore, researchers examining the digital mundane utilize innovative approaches that diverge from traditional web scraping and crawling methods and examine resistance to infrastructure, data breakdowns, and minor conflicts to uncover overlooked dynamics. For instance, Ogden et al. (2023) used ethnography, experimental black box techniques, and digital methods to explore the internal procedures of ‘Save Page Now’. Van Rossem and Pelizza’s (2022) ‘Ontology Explorer’ uncovers varying expectations regarding migrants within European authorities’ data models, while Bates et al.’s (2016) ‘data journey approach’ follows data lifecycles across different geographical and temporal scales.
Visualization and mapping enrich the methodological repertoire for understanding digital life, emphasizing the need for nuanced, context-specific data collection and analyses while addressing the challenges and biases associated with digital environments. Ultimately, visualization is not merely a tool for representation; it is an essential methodological cornerstone for interpreting and integrating the complexities of digital social phenomena. Visualization is interpretative and exploratory. This dual capacity makes visualization essential for quali-quantitative methods, fostering a comprehensive understanding of social phenomena in the digital age. In the next section, I describe my field and discuss how it constituted my approach and choice of methods.
Methods
I began my field research with the rise of COVID-19 in mid-2020 when only a few practices and engagements of ARD and its online media libraries development were happening in the office. As everyone worked from home and digital communication settings prevailed, approaching value-driven development in practice – as a space of manipulation (Livingstone, 2003) – became impossible. Thus, I had to limit my data collection to three approaches: content analysis of the website, in-depth expert interviews, and document analysis. As I approached my field – the website, the internal and external-purpose documents, and the involved stakeholders at home – I could see how the content, decisions, documents, products, and processes are selectively communicated to the user, curious citizen, or the researcher.
While this selectivity could leave me with no context, I approached it as a condition of data categorization that needs appropriate methods. First, the information and data on the website were pure ‘Public Relations’ and were curated and designed to show a pristine situation. Second, these texts sometimes lead to other online documents – that is, a meeting protocol. A protocol does not necessarily record and report all the discussions and concerns of the participants. Instead, it moves forward with the issue and solution manifestation. Moreover, who takes the protocol and verifies it and selects the recorded details and published information? Thus, my document elicitation from the website had two major categories: documents produced for external purposes and those only published as a mandate and served an internal documentation purpose.
Third, the stakeholders with whom I also conducted the interviews (un)consciously selected the information within their answers. I conducted and analyzed 15 expert interviews between May and December 2021. I chose a snowball method to access my interview partners. Sometimes, I approached stakeholders whose names or roles were mentioned in the interview. Nonetheless, I always asked my interviewees to suggest a potential interviewee at the end of the interview. The interviews were all conducted online, and no interview partner was participating from the office.
The interview partners were of different ages, genders, and roles – innovation manager, software engineer, department head, journalist, content manager, product manager, channel manager, and data engineer. They were either directly working with the ARD Audiothek and ARD Mediathek or were previously engaged in its development – only in 3 cases. I focused on the mundane as much as possible to redeem this selective approach. In my questions, I focused on the mundane as much as possible to redeem this selective approach. I assumed that asking about the ordinary could bring back the sociality and context of my collected data (Forsythe, 2001; Star, 1991). However, it put them in a position to respond, ‘I do not know if my answer will be helpful to you’. It is a moment when the method constitutes the field. The field bounced back to the method and showed a reflexive situation. Furthermore, I incorporated my analysis from the documents into the questions to enrich the discussion.
The following sections constitute my account of how public values are embedded in ARD online media libraries. In this account, public values are many things, and still one thing. They are nicely drafted, published in HTML and PDF files, and engaged in regulatory frameworks and society-in-the-loop decision-making processes (Rahwan, 2018). They perform content evaluations and financial estimations, which are present in annual report documents and monthly broadcasting council discussion topics. They are also learning materials for the newbies of the PSM through what they experience limitations and abundance. They are numbers in the hands of media researchers and codes on the developers’ screens. They are software requirement checklists and moderating human-curated and machine-curated content. They configure the PSM infrastructure, and the PSM infrastructure configures them.
Nonetheless, how do I map these various multiplicities? Here is where the context becomes important in the mapping approach. Through the following mapping descriptions, my main argument is that mapping and incorporating the context with the issue, actors, situations, and controversies will help navigate various seas of information. I think of these work-in-progress mappings as enriching the map that goes back to the desire to have an ‘optical consistency’ (Latour, 1986), to have a seamless ‘perspective’, to zoom in and to zoom out, to scroll, and to be capable of offering a critical perspective. The optical consistency should not be mistaken with a single cosmic map that may block insightful traverse. Tracing actors and their relationships brings us to different sites of knowledge production, from the website to the development practices, from one visualization to another, making a connection between different worlds.
A sketch of representation
My first step to capture public values embedded in ARD’s online media libraries’ development was to look for the places where public values are discussed. Who is part of the discussion and representation? What are the technological and societal issues that are entangled with them? The first data collection and analysis practice was traversing, recording, and categorizing the data I got from the ARD, its members, and related broadcasters’ websites. As it seems like a document collection, the characteristics of the websites make a difference. As a researcher, I was in pre-defined document structures connected by links. However, I had to regenerate the document taxonomy myself.
Primarily, I approached the website in search of the explicit values the broadcaster represents. The explicitness had several layers: some broadcasters, like the Bavarian Broadcaster (BR), had a published document on a unique web page called ‘Public Values’, which linked to other related web pages. The next layer only shared their public values on their websites, and the third one only related to ARD public value guidelines in certain aspects – like transparency or minor protection – without phrasing it in a public value framework.
This manifestation also encouraged further attempts for implicit discussions throughout the website. In collecting this level of data, I considered investigating the mundane and routine pages like ‘About us’ and ‘Organization’. Then, I moved towards innovation or R&D departments’ pages and their iOS and Android products. For instance, all the regional broadcasters have at least an application available in Apple Store or Google Play where they explicitly talk about user data collection. This simple statement has multiple design and development significance that separate it from other platforms. It highlights the value-driven logic behind public service media platform design and development and questions how and for whom it works (Bucher, 2016; Galloway, 2004).
The data collection was followed by an open coding practice (Strauss and Corbin, 1990) as a first step in analyzing my qualitative data. In my collected data, I marked regional platforms with specific connections to the modes of distribution: radio, TV, or on-demand digital content. The connection between platforms would also go further, whether integrated into the online media libraries or representing the regional broadcaster’s authority in developing and distributing what it needed. The data also showed the politics behind authority: which regional broadcaster could afford and sustain its software development department, and how it would intercept with the division of labor engraved in ARD structure. Would it initiate an alliance or a resistance? How would the values be embedded in the development of the online media libraries and order the infrastructure? I ended up with three main categories: organizations, values, and technologies.
My first attempt at visualization has to make it easier to get the first big picture of which organization owns which technological artifact, represents which value, and looks for possible relationships (Figure 1). Values, platforms, R & D departments, and broadcasters. Organizations are in square shapes, Technologies (or platforms) are oval, and values are in cloud-like bubbles. However, software development and innovation departments are also oval (and in green). The main reason behind this choice of representation is the close relationship between the broadcasters’ platforms, departments, and channels, which usually manage the platform, and the software department as a developer of these platforms and a product of the broadcaster itself.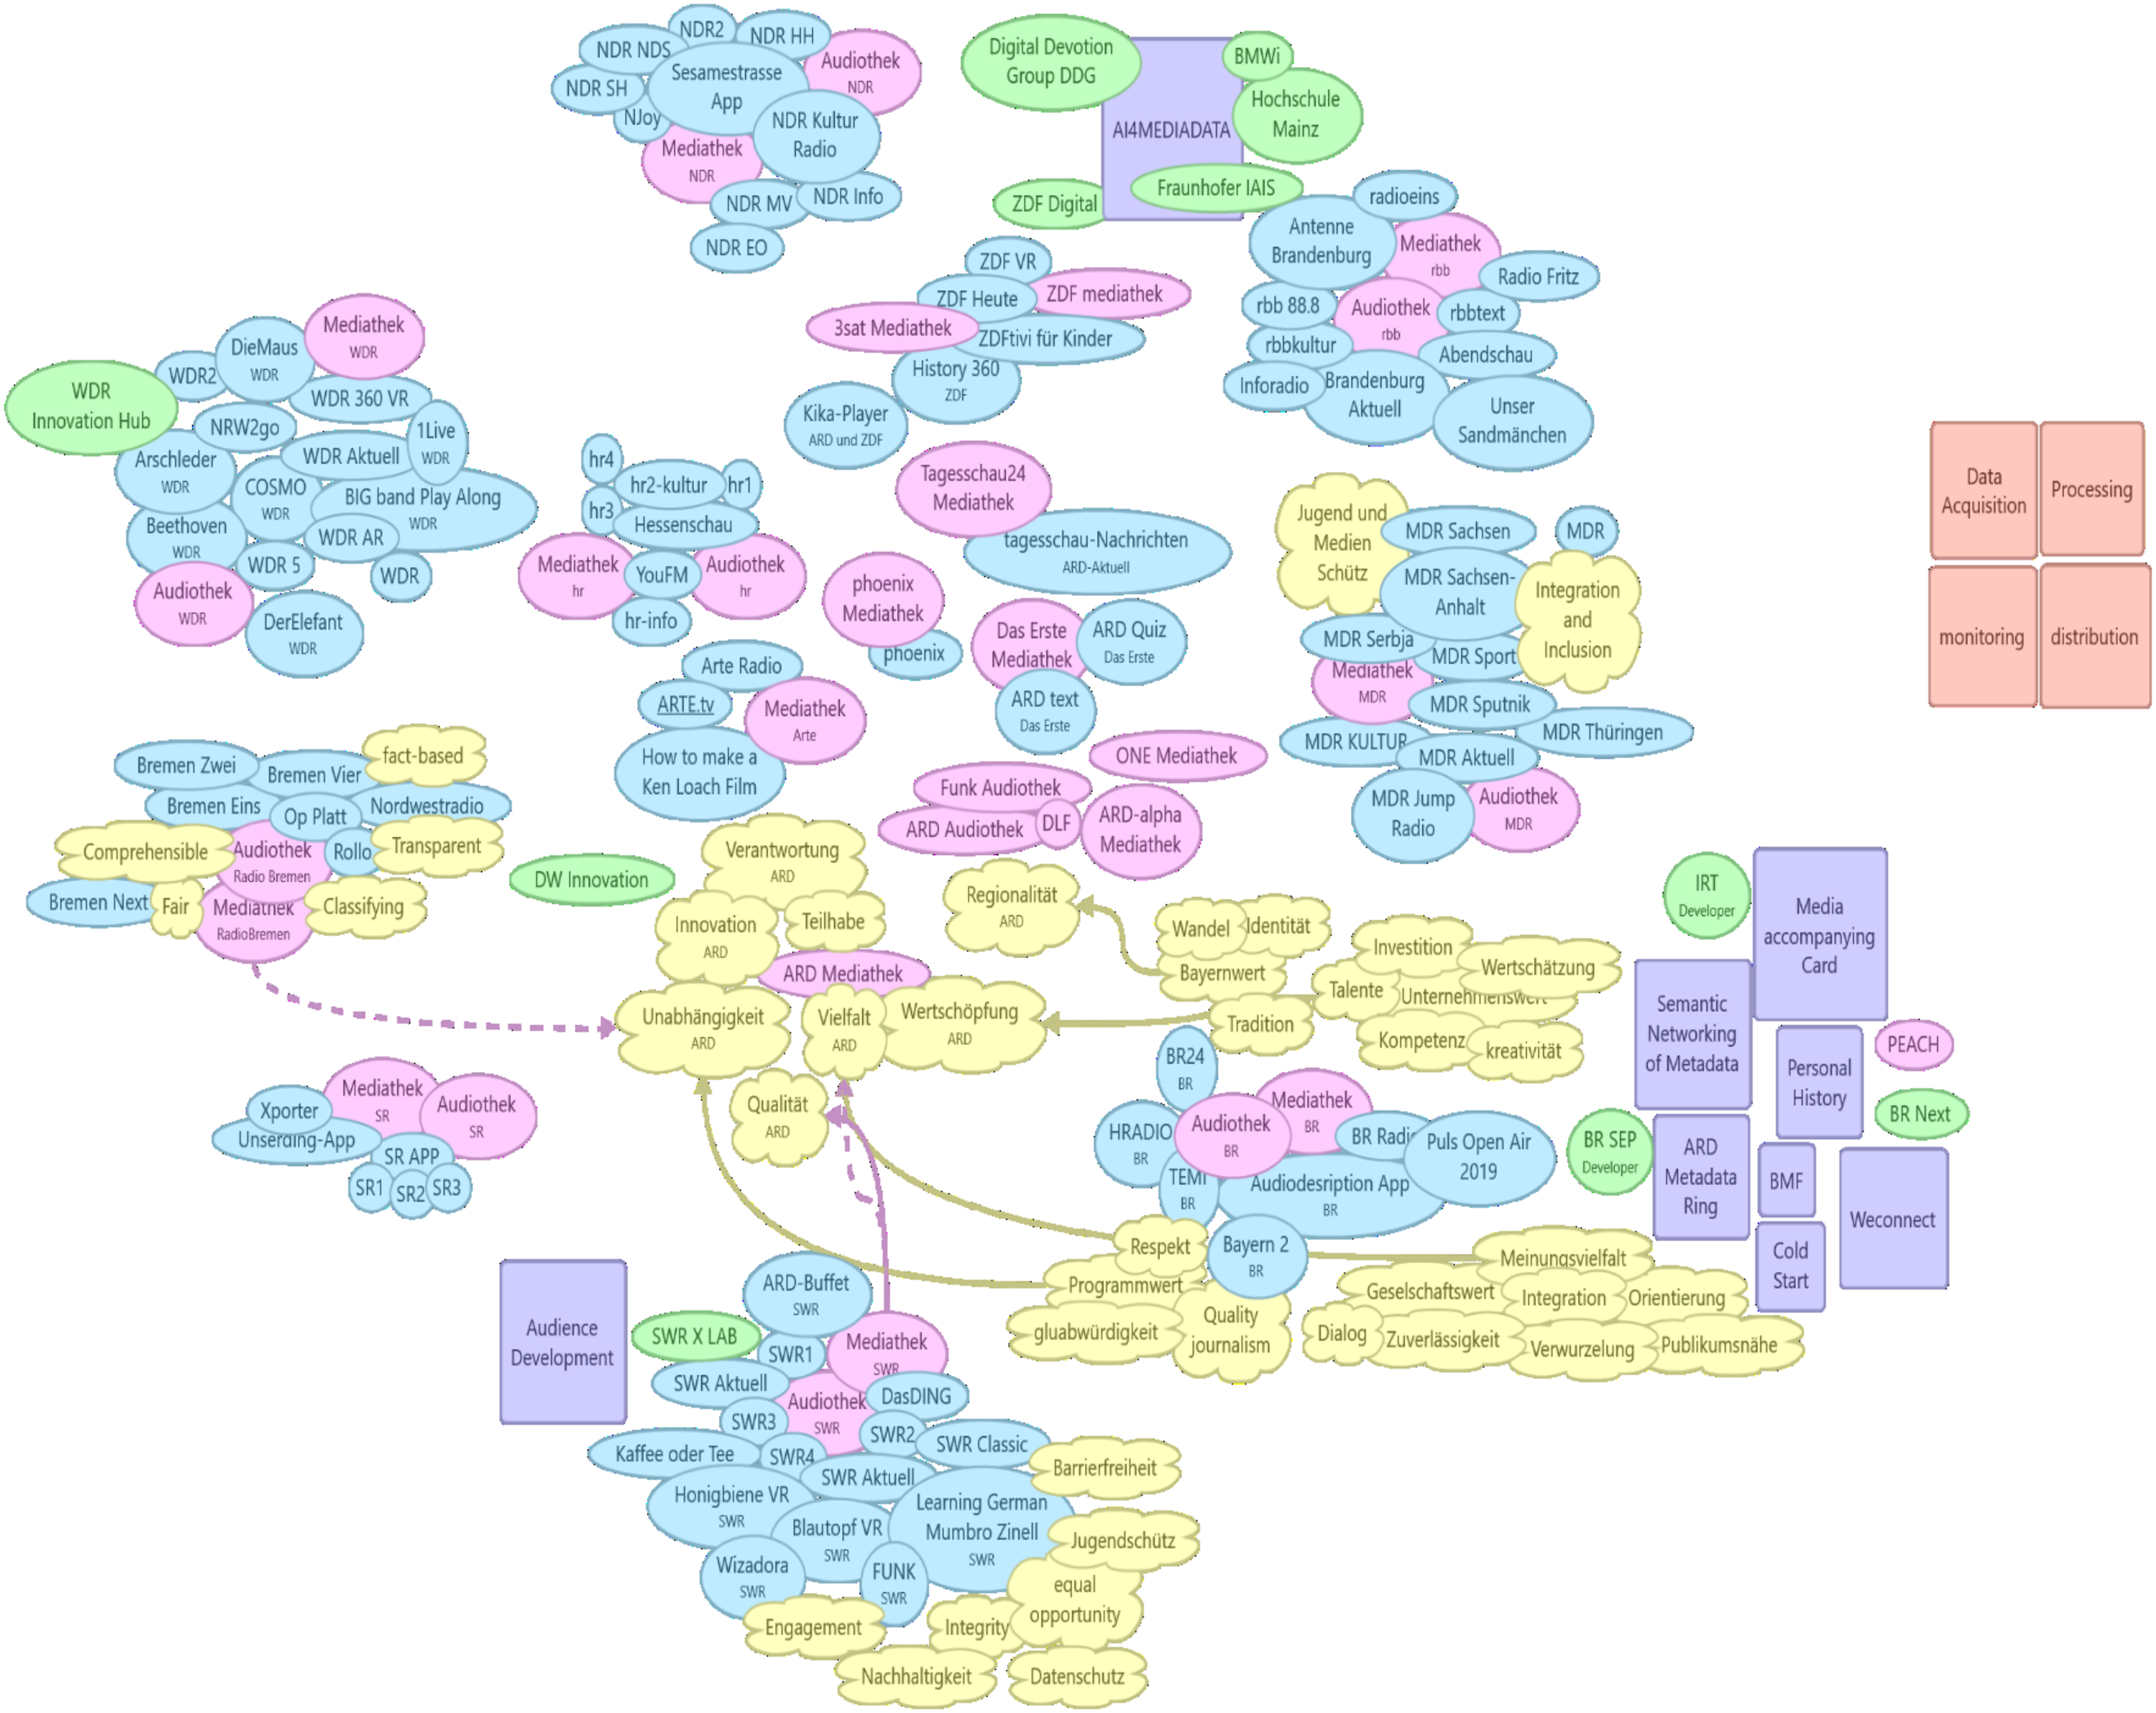
Here, visualization has one primary role: bringing all these multiple accounts, information, and codes together, making them sustainable during the research and bolding the differences. It offers a preliminary glimpse of various places where the discussion on value and technology entanglement occurs. This collective illustration of technologies, values, and organizations pushes to expand the vision from specific temporal and location to different places, levels, and moments of technological design (Monteiro et al., 2012).
One observes that only some broadcasters explicitly talk about values or are engaged in developing new technological artifacts. Regional broadcasters like BR, Southwestern Broadcasting System (SWR), and West-German Broadcasting System (WDR) all have their hands on technology development. It also guided my future data collection practice where to look for stakeholders. Additionally, one can observe the gap among these organizations in representing certain values. On the one hand, BR explicitly represents Bayernwert (Bavarian value), Identität (Identity), and Wandel (Change) as values that can relate to an ARD value like Regionality.
On the other hand, SWR represents Nachhaltigkeit (Sustainability), a value that redefines regional platform development and seeks centrality for content and technology production. It also relates to SWR’s historical role and mandate in developing broadcasting technology for ARD. A curious eye would see BR’s extensive plan for the design and development of its platforms (seen in its proximity to IRT, having its R&D department and various applications) and ask how they can come together.
These values are not mutually exclusive; ARD values cover and address them both. Nonetheless, they are intertwined with specific design and organizational approaches and practices. As Star (1999) asserts, ‘In an information infrastructure, every conceivable form of variation in practice, culture, and norm is inscribed at the deepest levels of design’.
Therefore, examining these values in various contexts is crucial. How does the broadcasting council, as a form of citizen participation in running the public service, discuss these values concerning platforms? Who is involved in there? How are these values explicitly and implicitly practiced and discussed in ARD online media libraries? I address these questions in the following paragraphs by moving between qualitative and pseudo-computational methods.
Broadcasting councils
Studying the websites, I noticed that the broadcasting council, consisting of representatives of various societal groups (see Figure 2), is a central acting body in each ARD member’s decision-making process. The members neither work for the broadcaster or any other broadcaster nor hold any economic interest that puts the council’s independence in danger. Besides, the council advises the directors of the general program (Suedwestrundfunk, n.d.), monitors the fulfillment of the program mandate (Bayerischer Rundfunk, 2019), and protects the unique role of broadcasting as a cultural asset (Westdeutscher Rundfunk WDR, 2020). The decision-making is usually portrayed as a collective act, as voting is a central practice of the council. However, the public never knows individual member’s vote regarding a decision. Representatives of various citizen associations and communities constitute each council’s participants: Media and Journalism (Thill), Religious groups (catholic church: dark purple, Protestant church Neon Pink, Jewish associations (light blue), Minority groups (Magenta), Women, Family Affairs and Disabled Citizens (Gold), Education, Culture and Art (Orange), Labor Associations (Lime), Industry Associations (Steal Green), and Political parties (CDU/CSU Blue, AFD Neon Blue, Die Linke Dark Red, SPD Red, Green Party: Green, FDP Yellow).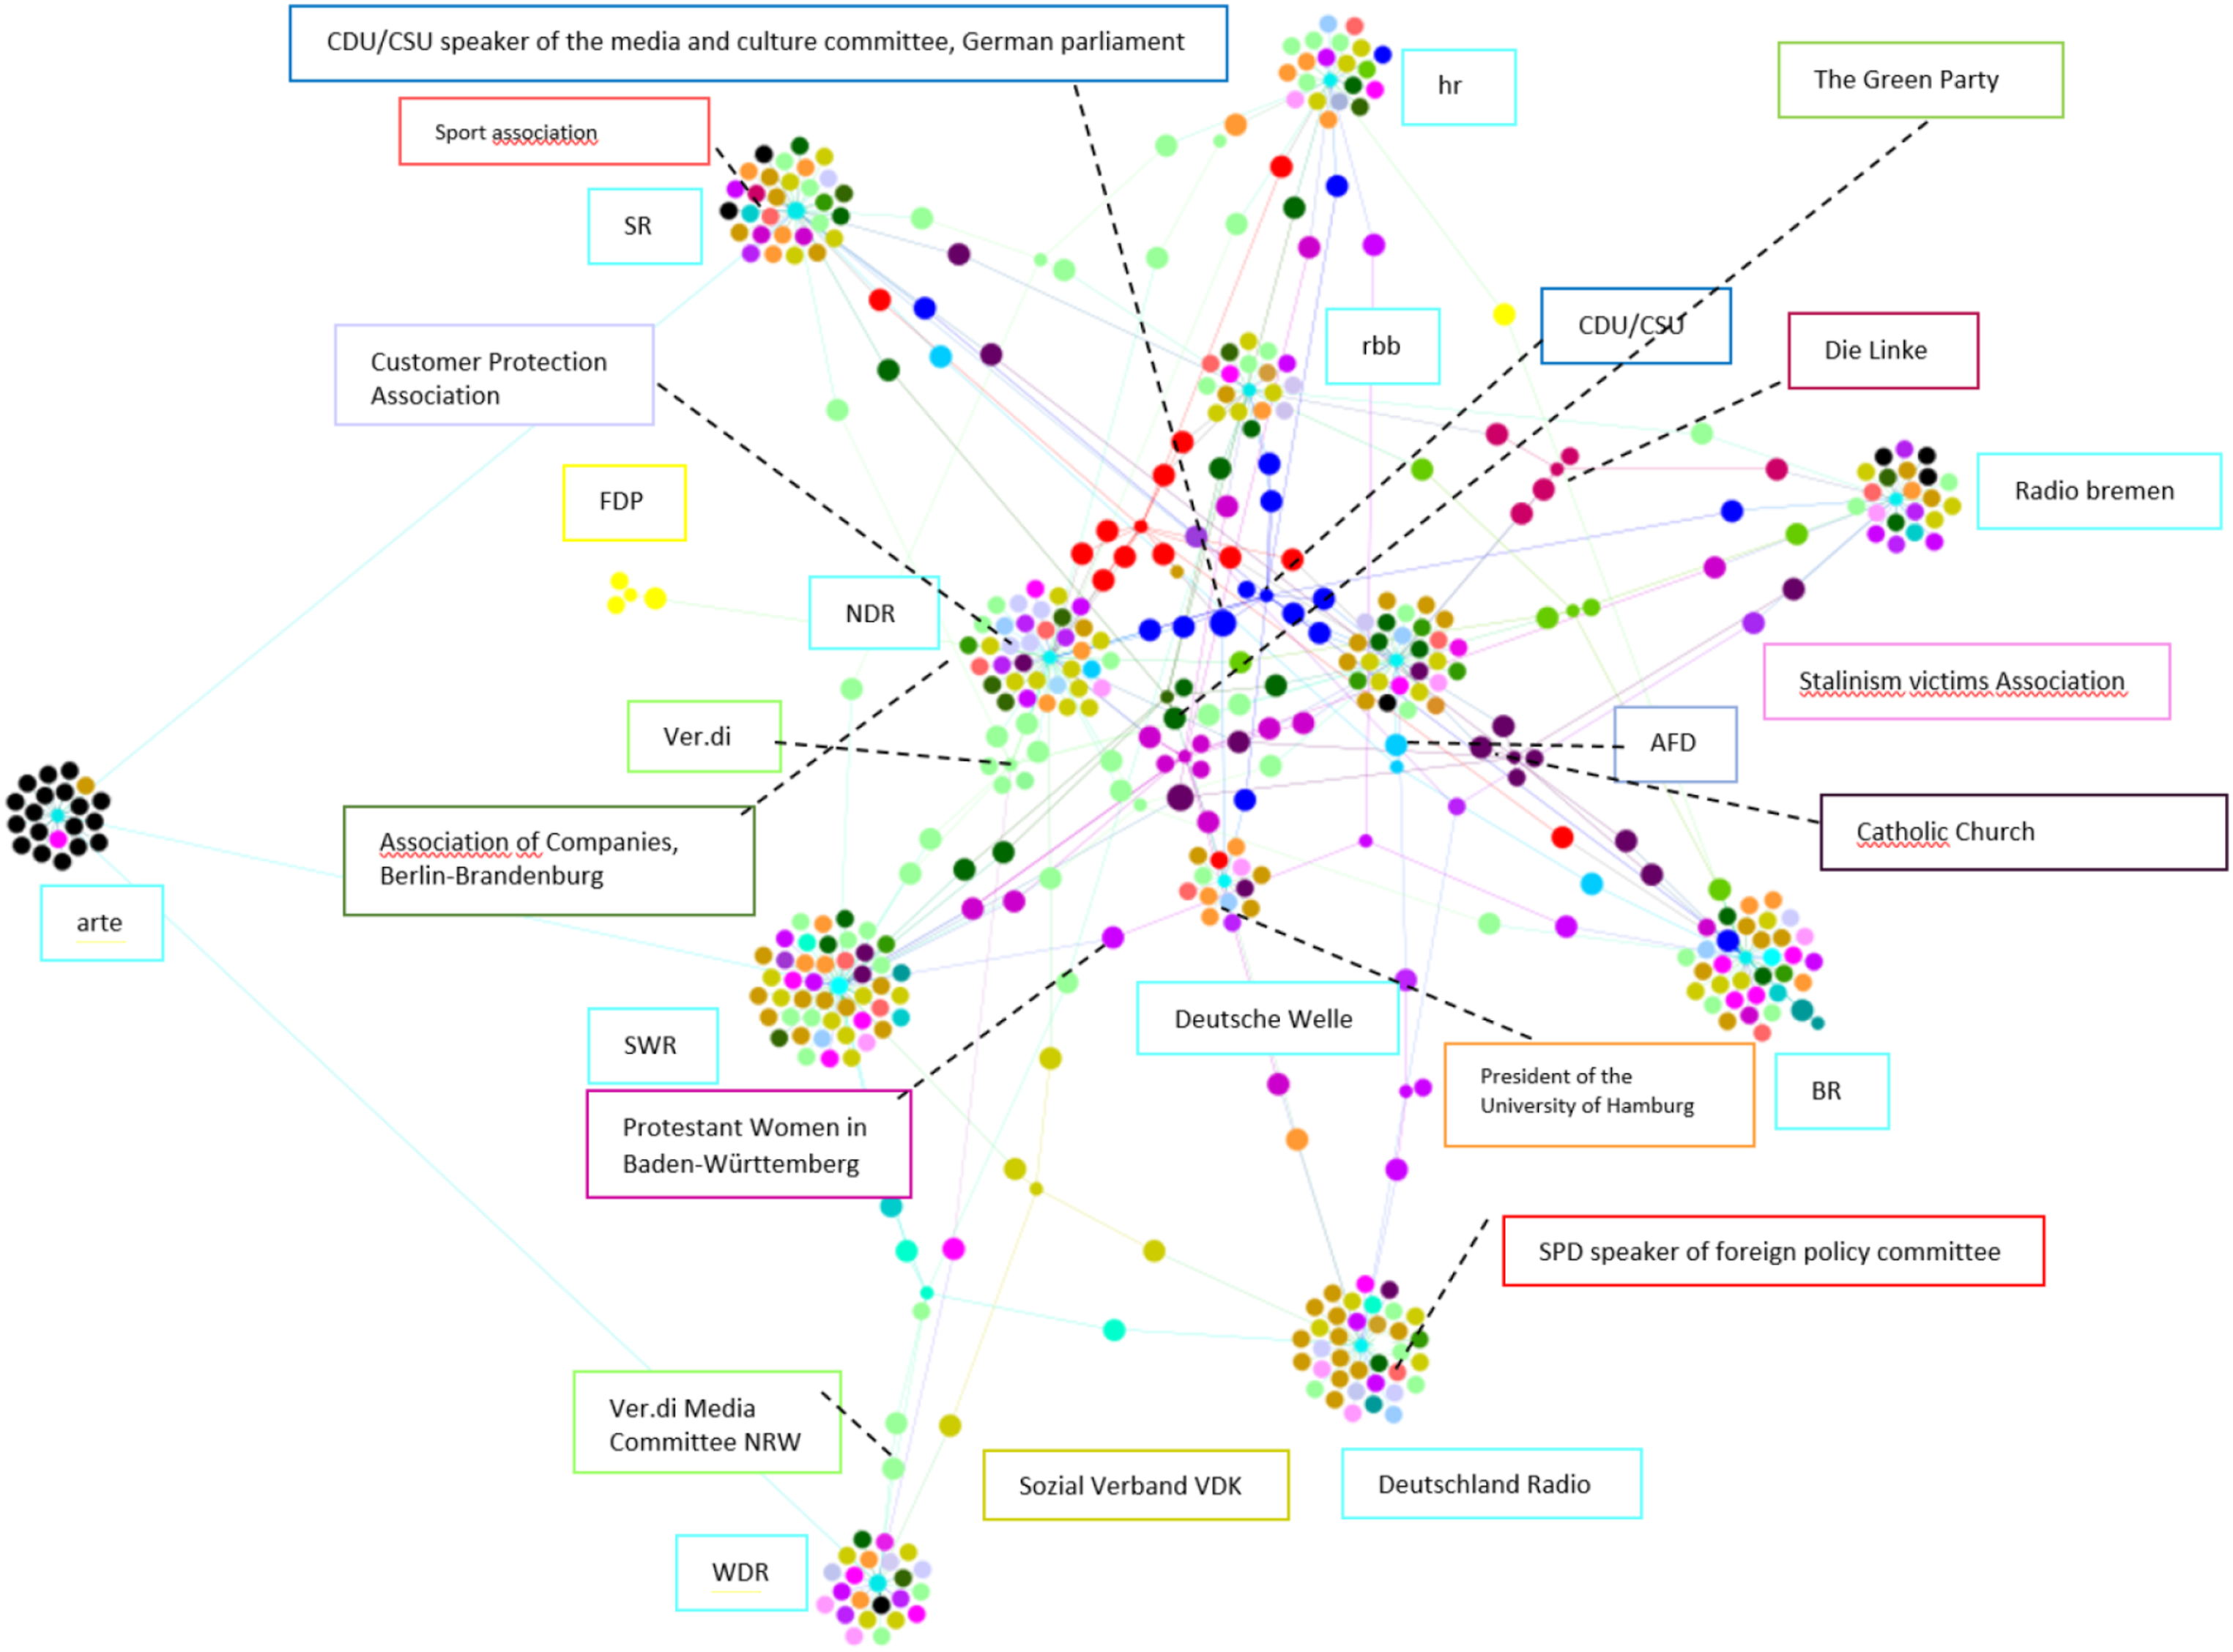
Council members participate in different council committees (media policy and legality, program, finances, and three-step test), providing reports, validating or questioning existing ones, and then sending them to the broadcaster to act upon. In their monthly meetings, they discuss public feedback towards content or technology and decide about department directors and new plans or technologies. Each meeting has a published protocol to document these discussions and decisions. I collected documents and protocols of three regional broadcasters’ councils, which are either actively involved in developing the media libraries or have recognized R&D or innovation departments: BR, SWR, and WDR.
The corpus, which dates back to 2013, consists of more than 100 documents with internal and external functionality. Internally, it documents the decisions and secures them for future discussions. Externally, it serves values like transparency and responsibility.
Examining the produced and published documents and knowledge makes it possible to construct a picture of the evolving discussion and issues and the participating actors. Unlike annual reports, which are like spikes, protocols and instructions carry on with continuity. The history of the discussions, following up on the unresolved issues, and their mundane monthly online publishing orders structures of continuity. On the one hand, the continuity resides in the nature of protocols and reports. It offers continuous comparison approaches by devising charts, performance numbers, and survey tables. These approaches make them more suitable to follow changes. On the other hand, it happens in the form of a written document, a textual representation of an event, an oral discussion, or the intangibles – that is, software and platform. As it documents, it blesses them with eternal life.
In what comes forward, I aim to address these documents’ roles, the gravity they enforce on the field, and the relationships they inscribe.
Pseudo-computational methodology
Co-word analysis is an analytical method with a background in co-citation (Small, 1973) and work of translation (Callon, 1984; Latour, 1993; Law, 1992) that explores a research topic based on the co-occurrence of words (Feng et al., 2017). It allows the researcher to identify and visualize specific problems and their relationships. In addition, it contributes to observing terminology evolution in noting word co-occurrence or a missing relationship. With the development of natural language processing and the prevalence of more automated data collection and visualization softwares, discussions around this method were also hyped. Scholars focused on bits and pieces of a text that can shape a more concrete overview of trends and development patterns. For instance, Monarch (2013) introduced the strength of the relationships as a critical factor for a better field development analysis. Others have worked on word weights (Yan-rong and Yang, 2011) and word similarity (Leydesdorff and Vaughan, 2006; Sasson et al., 2015).
A qualitative researcher reconfigures continuity by reviewing each document, restructuring it, reassembling it into codes and categories, and reciting the narrative. In contrast, a computational method like Latent Dirichlet Allocation (LDA) separates the text from context. The method creates ‘statistical models (topics) to represent common occurrences of words’ (Horstmann, 2018). It provides an insight into how a specific topic has frequently appeared among different documents. One can take topics as alliances of terms and approach the result of the LDA as to how these alliances are positioning themselves within the discourse, although it can be deceitful. Its focus on term frequency excludes a term with a lower number. Apart from the significance that the term can carry, as an STS scholar, one could have questioned the place and role of the term in the context and its inscription. LDA’s mapping of the corpus is abstract in how it includes a term and how it decides to show a term. However, it does not mean incorporating computational approaches would be futile.
I notice a more engaged relationship between the researcher and the field in co-word analysis (Callon et al., 1983), which has influenced network analysis in Science and Technology Studies (STS), especially in crawling and scraping webpages. This method is a powerful tool for conducting qualitative and quantitative research with digital approaches. Additionally, Latent Dirichlet Allocation (LDA) is a useful computational method for navigating documents. My concept of ‘pseudo-computational methods’ suggests that, like computational techniques, I envision an approach that incorporates computational aspects to connect various elements of the field and context within my document corpus. While not entirely innovative, I’ve tailored this approach to my case.
In designing this approach, I was inspired by a common statistical method in natural language processing and informational retrieval called Term Frequency-Inverse Document Frequency (TF-IDF). The TF-IDF score quantifies the significance of a term within a document concerning a collection of documents (corpus). It highlights a word’s importance to a specific document when considering the entire corpus. I was also inspired by the ‘Lippmanian device’ the digital methods initiative provided (Digital Methods Initiative, n.d). The online tool would traverse the provided web pages for certain queries and designed term co-occurrences. It is a strong tool for scraping the web, particularly for issue mapping and controversy analysis. But, the co-occurrence can happen randomly on a webpage.
However, I do not want to understand the significance of a term or co-occurrences alone. Terms and co-occurrences are important to me because of the specificity of the discussion they configure. In addition, I also want to understand the relationships it makes with other terms and the network configured around the term. I am repurposing the general idea behind TF-IDF for my research to make the computation go beyond the quantification and datafication of my corpus and relate it to my qualitative data collection and analysis. Hence comes the prefix pseudo: the method here depends on the researchers’ understanding of the data. It is in no way automatic. I will explain this method in the following section, highlighting the relationships and terms. I call it Relational Term Frequency (RTF).
Relational Term Frequency (RTF)
Documents are hybrid collectives, where more-than-human actors – values, guidelines, directors, council members, and technicalities – come together. Then, the relationship between each term is weighted. Respectively, my approach weighs relationships and consists of three main steps: (1) detect and extract the terminologies, couple them when possible, weigh the relationships, and repeat them when possible; (2) build up clusters and categories; and finally, (3) visualize.
To begin with open coding as terminology extraction, I find my way through data segmentation, describing, naming, and classifying the phenomenon under consideration, breaking data into meaningful expressions, and generally describing its words. They depict the issues, aspects, intensity, purposes, strategies, and time. On the one hand, the codes can occur explicitly. While coding based on the already elicited data seems manageable, the crucial task is to extract meaning from a term, a sentence, or a paragraph. The meaning assignment requires a broad understanding of the context and reflects the methodological capability of the qualitative methods in dealing with the text. It also highlights the machine’s deficit in doing so.
When analyzing a document, I identify a key term essential to the conversation and search for other terms that provide context, and couple them with the already identified terms. This consists of a process in which I, as a researcher, have to justify and verify the relationship between two terms, analyzing their interplay and dispersion. I create a comprehensive list outlining the inner text’s relationships. The proximity of the terms determines the strength of each relationship, whether they occur in the same sentence, paragraph, or section of the document. The weight assigned to each relationship is subjective and is based on the proximity of the terms. Relationships within a sentence are given a weight of four, those within a paragraph are given three, and those within a section are given two. However, if one side of a relationship has an assigned meaning, it is given a weight of five. If a relationship is repeated multiple times within the same sentence, paragraph, or section, its weight will increase by one. The weight is determined by the relationship to the text and the frequency of occurrence. An example of terms/codes, their weighted relationships, and connections with the document in which they appeared is shown in Figure 3. A sample of recorded terms, their relationship with each other, the weight of the relation, and their relation to the document.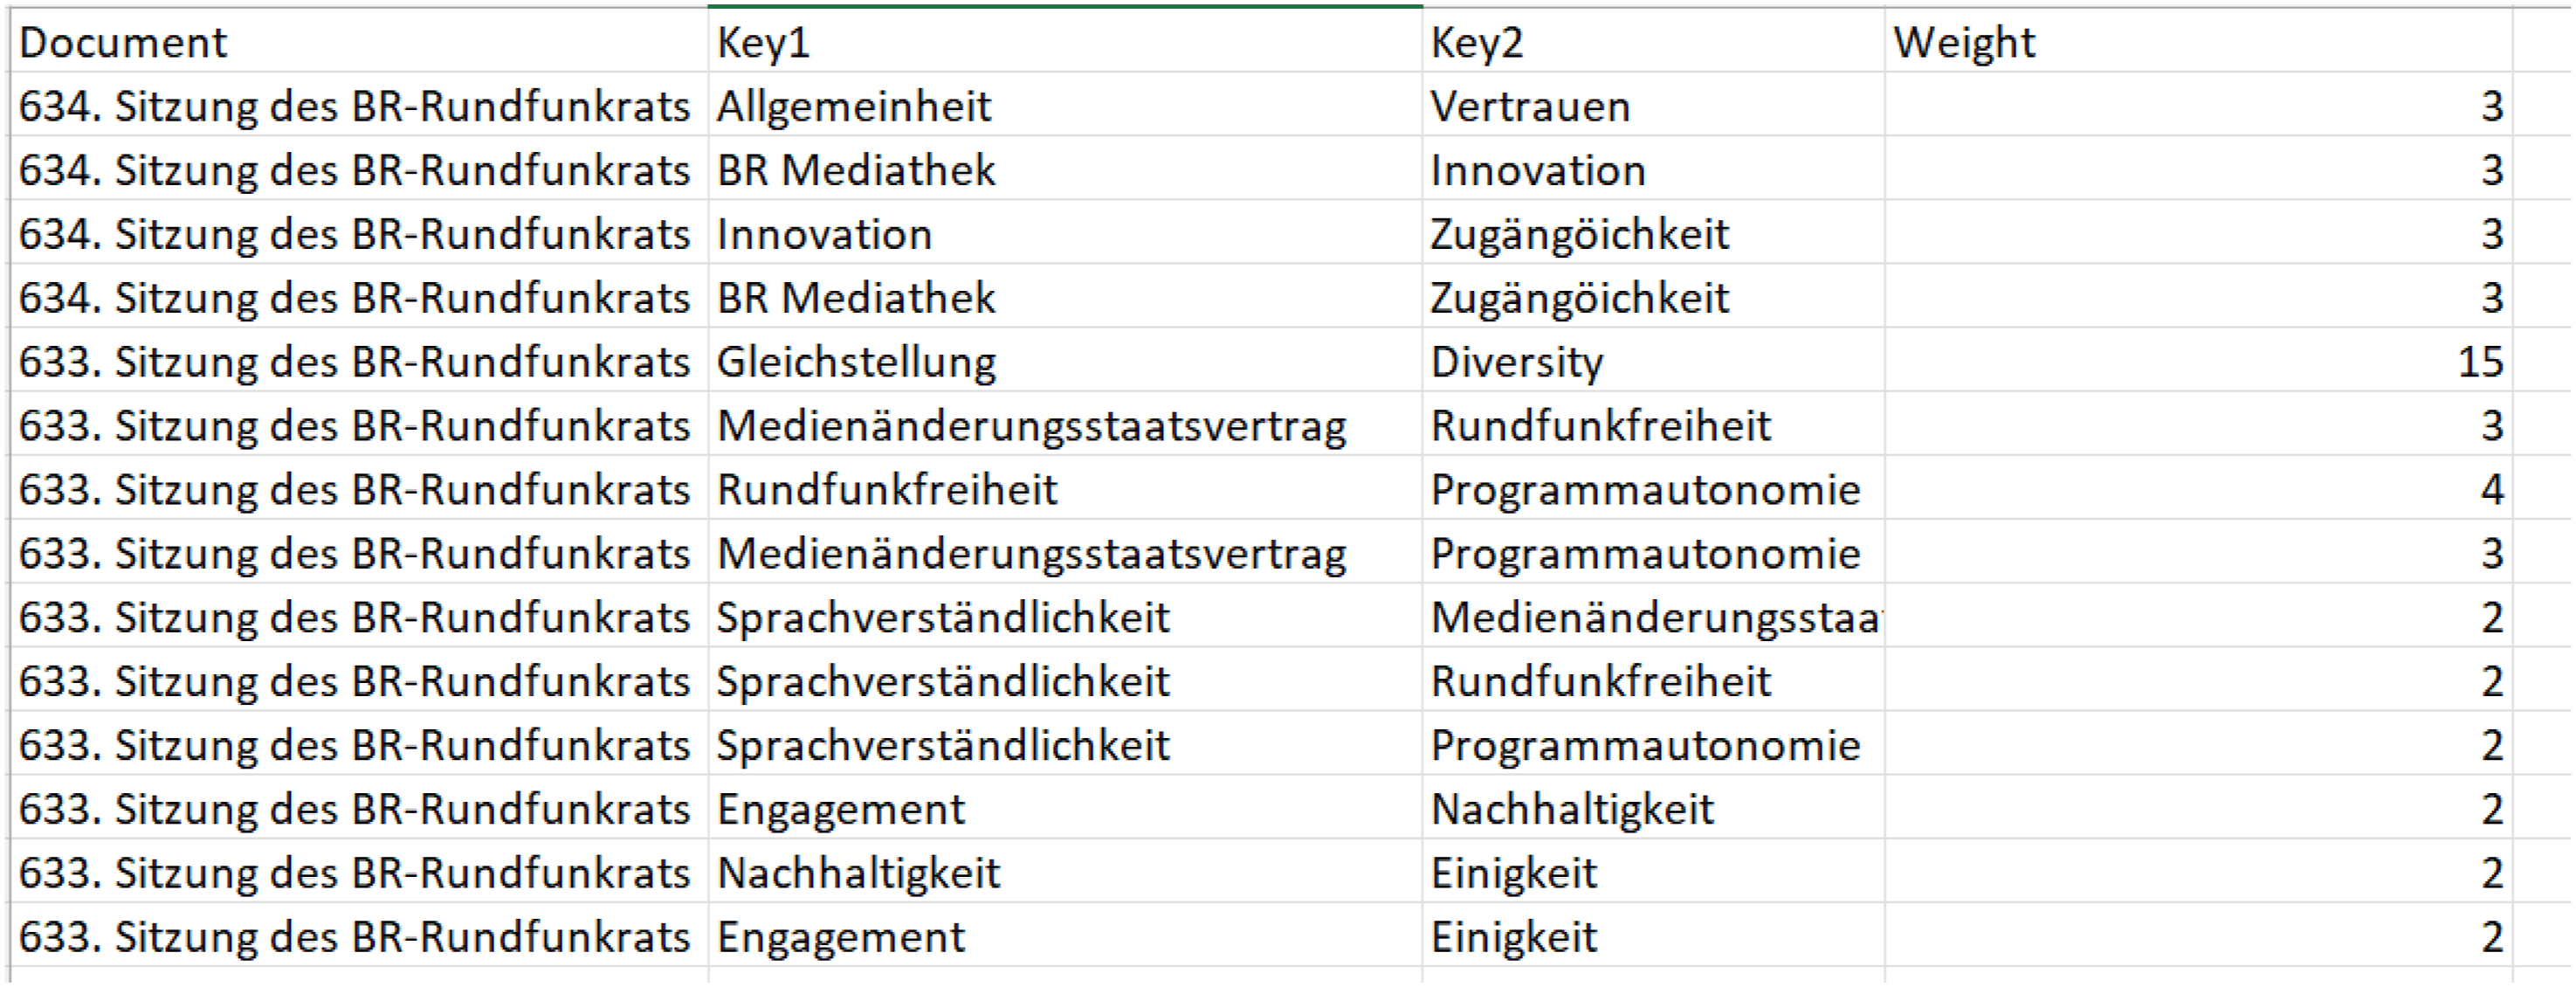
Then, I put terms and relationships in clusters. An extensive class would consist of different ways of relating to the same term or different attributes, functionality, and related entities. Respectively, from 632 unique coded terms out of the 100+ documents, I built 45 hybrid clusters. These clusters contain phenomena, causal conditions, consequences, and contextual relationships. The final categorization consolidates them into four main categories: technical, value, legal, and user. Attempts of categorization give the researcher a view of how terms sit together, which term, cluster, and category are more inclusive and more prominent, or how different interests would contribute to the discussion.
Value spatialization
Exploration and representation always come together (Venturini, 2010) as I navigate how various interests around online media libraries and values unfold and how certain couplings occupy the space. Hence, spatialization layouts on Gephi, like multi-gravitational Force Atlas, would be helpful. Visualization and spatialization take place not as separate tasks but as incremental and evolutionary tasks involving the documents’ exploration and analysis. It helps to navigate the documents and gain an enriched perception of the context of the documents. It is important to note that the mapping does not give the scene equally to every actor but makes their differences regarding concerns and interests visible. Figure 4 shows how various actors and categories occupy the space. A sneak peek at the RTF map. Light blue represents a broadcaster, purple represents values, red represents technologies, yellow represents legal and finances, and green represents user-related.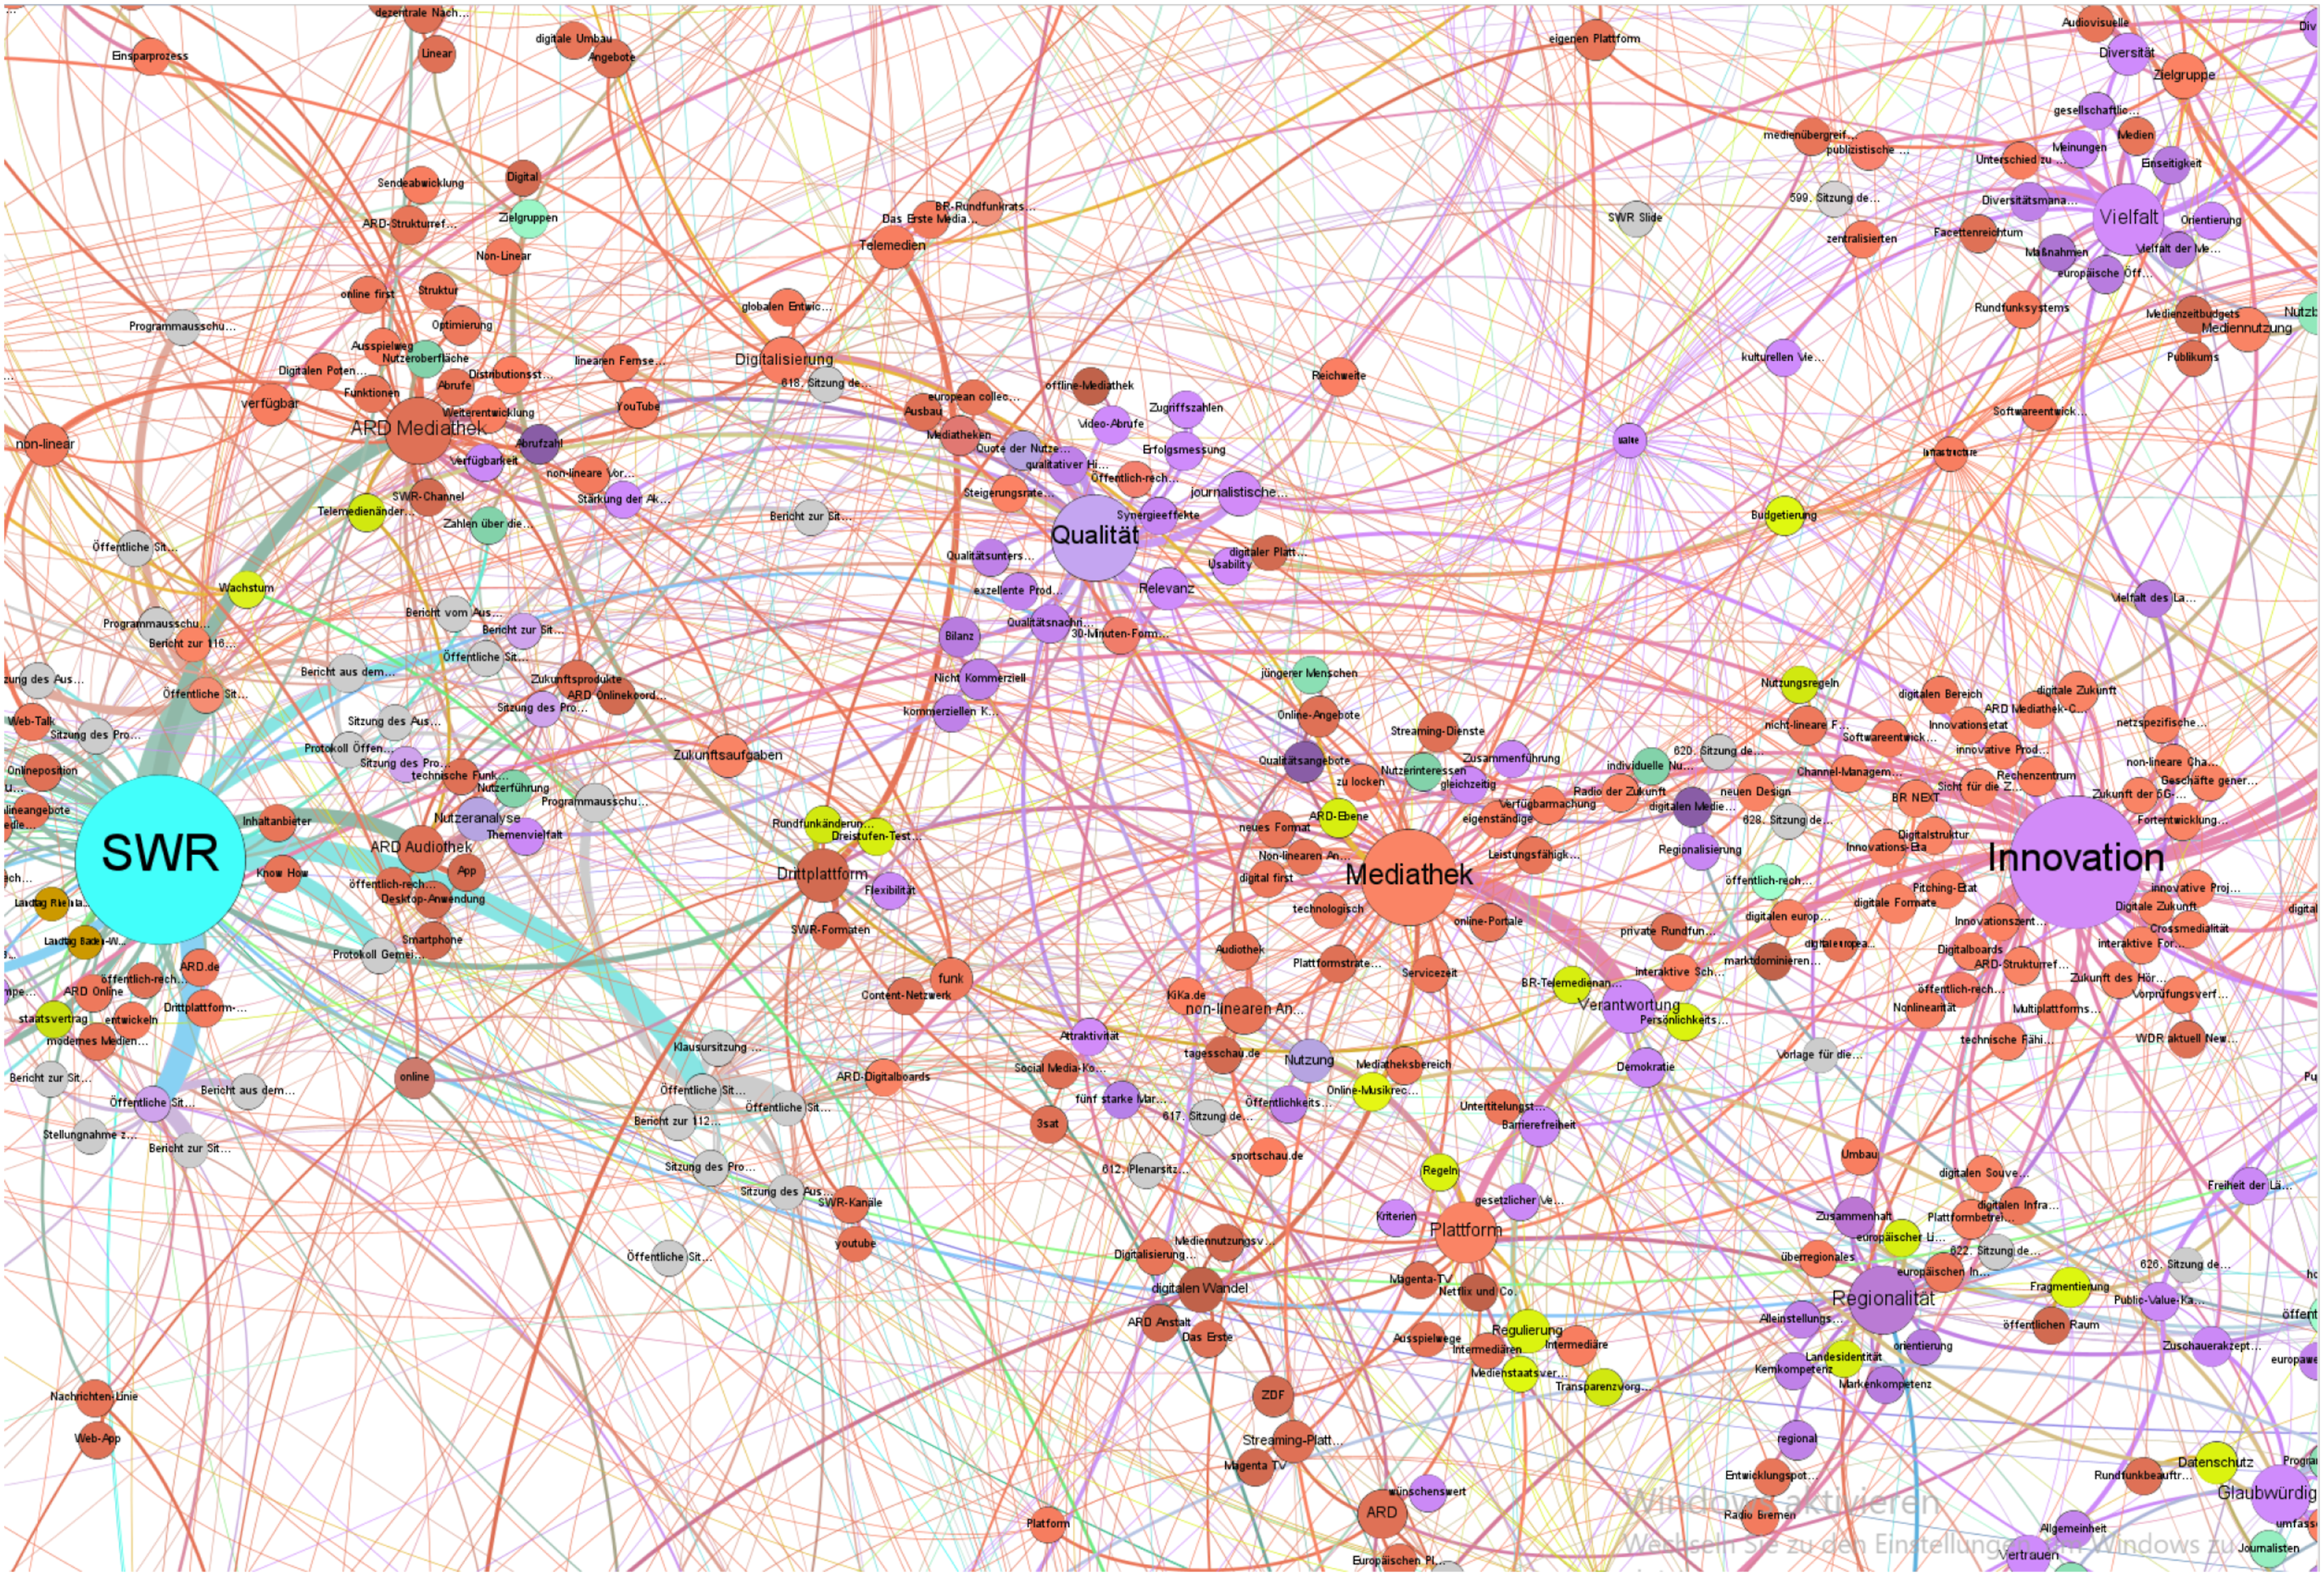
The multi-gravitational force Atlas layout in Gephi for visualization enhances visualizations with numerous centers and offers gravitational forces around them. Moreover, nodes with higher degrees would experience more repulsion. This will allow the layout to spatialize the nodes better and avoid dense clusters. Node size represents how impactful a term is in shaping alliances with others. Edges between the nodes represent existing relationships and their strength within the corpus. Thus, the weights I assigned in the last step would now accumulate and are visualized as the strength of the edge weight.
The documents offer detailed context to sustainability and regionality as values standing up for SWR and BR. To begin with, as political parties and parliamentary representatives are members of each council (see Figure 2), these values also relate to the concerns of council members with political backgrounds. While the Green Party has a strong position in Baden-Wuetemberg (SWR region), it is no surprise that sustainability is a rising concern in SWR. Sustainability is being contextualized in content production and technology development. It includes engaging a so-called ‘external green consultant’ who should have a lead on the CO2 reduction pre/within/post-production (Arbeitkreis ‘Green Shooting’, 2021). Furthermore, it contains guidelines about recording CO2 emissions and deploying and generating eco-electricity, especially for lighting, travel and transportation, and conscious consumption of other resources.
Additionally, sustainability is discussed as technological centralization and integration through ARD online media libraries development. Traditionally, a ‘division of labor’ rules the relationships between ARD and its members. While one is responsible for technological development, the other creates content for children. In this division, SWR is responsible for content distribution technology development. Therefore, a new institution like ARD Online works in tandem and has a close relationship with SWR to design and develop online media libraries and processes and relationships that are unified and integrated among all the members. While it centralizes the platform development, it also gives the user centralized access to all the contents produced and distributed by ARD simultaneously. However, this centralization seems to be positioned against regionality, at least on the surface.
Regionality, too, brings various actors and concerns together and opens the eyes to how platformization is fostered in a regional broadcaster like BR. The Free State of Bavaria has been ruled for more than half a century by the Christian Social Union (CSU) party with a growing sense of exceptionalism and thriving towards being exemplary in Germany (Pfotenhauer et al., 2023). Therefore, regionality engages with practices of innovation, which promote Bavarian values and identity that maintain exceptionalism. Thus, one can understand the development of BR Mediathek in this framework. The Bavarian broadcaster has pioneered the development of its own Mediathek and still wants to maintain its authority over online media libraries. It led to an innovation disruption from broadcasting and online streaming to platformization, widening the technological gap.
However, unlike what Pfotenhauer et al. (2023) describe as a ‘conservative innovation culture’ in Bavaria in several sectors, this exceptionalism was not constantly applauded in ARD, as it resulted in a platform functional disparity between BR and other ARD members. ARD discourages technological disparity among members and values technological integration and the same service quality for every household in Germany.
Therefore, while regionality also emerges in context regarding content and regional diversity, social inclusiveness, and cohesion, it mobilizes actors and relationships when it comes to various levels of identity and power: European platforms versus American Platforms, European infrastructure and possible scenarios of contribution, BR Mediathek as Bavarian platform and its relationship to integration and centralization happening through ARD Online, and its focus on federalism and digital sovereignty. Following this conflict, ARD Online emerges as an actor that invokes and resolves tensions. But how? In the next mapping experience, I will address the conflictual existence of emerging multiplicities by drawing on interview analysis.
Absence
Protocols have a lot to say about the general position of the broadcasting council towards technology and values. Meanwhile, their selective nature keeps the researcher away from some contextual data. Therefore, conducting expert interviews offers glimpses into the development and production, which are difficult to gain from document analysis. The interview questions were oriented towards the stakeholder’s relationship to the platforms and their development process, specific rules and regulations in force, certain value guidelines and requirements, intersectional relationships, the daily workflow in their department, and how things have been discussed within groups and meetings. The interviews with the developers and product managers include stories of development and infrastructural interoperability challenges and, in several accounts, their challenges and relationships with the journalists. Interviews with journalists and editors complement these accounts by giving a new perspective on the events, insisting that no matter the digital transformation and efforts of machine curation, the editor, the human, is making the final decision. The discussion with the managers revolved around their mid-level account of dealing with high-level management expectations, planning, and concerting the relationship between developers and editors.
The tone was slightly different for the interview partners who were previously involved. The mundane I was asking for was always happening in the past tense. It was marked by more significant events or memories sedimented in how they remembered it: a success, a fight, or a failure, and then details would emerge out of a broader context. These contexts were more personal, sometimes even more in a monologue format. These monologues were usually broken by the interviewee consciously asking me if the description was too long! Many of these events were also repeated in interviews with other more seasoned interviewees, who were also present at the time of the event. Some newly involved interviewees also heard of these events. However, the ones still involved consciously refrained from giving their comments and views on them and tried to pass the event quickly. They tried to act as an objective viewer. In being objective, they practiced selectivity.
Nonetheless, the interviews shed light on the issues that were less discussed or excluded in the documents. Therefore, the last mapping practice considers terms’ presence – explicitly and implicitly – and absence – counter-explicit. Therefore, the last mapping practice considers the presence and absence of these issues. My primary purpose in visualizing my mapping is to highlight the discussed values and where they are discussed. It demonstrates how certain communities, practices, and institutional hierarchies relate. Figure 5 is an abstract mapping of the extracted data from the interviews. Mapping the interviews. Actors are distinguished by their shape. People are circles, teams and organizations are rhombus, squares are products, values are in cloud shapes, and hexagons are processes. Colors don’t refer to a certain relationship in this map.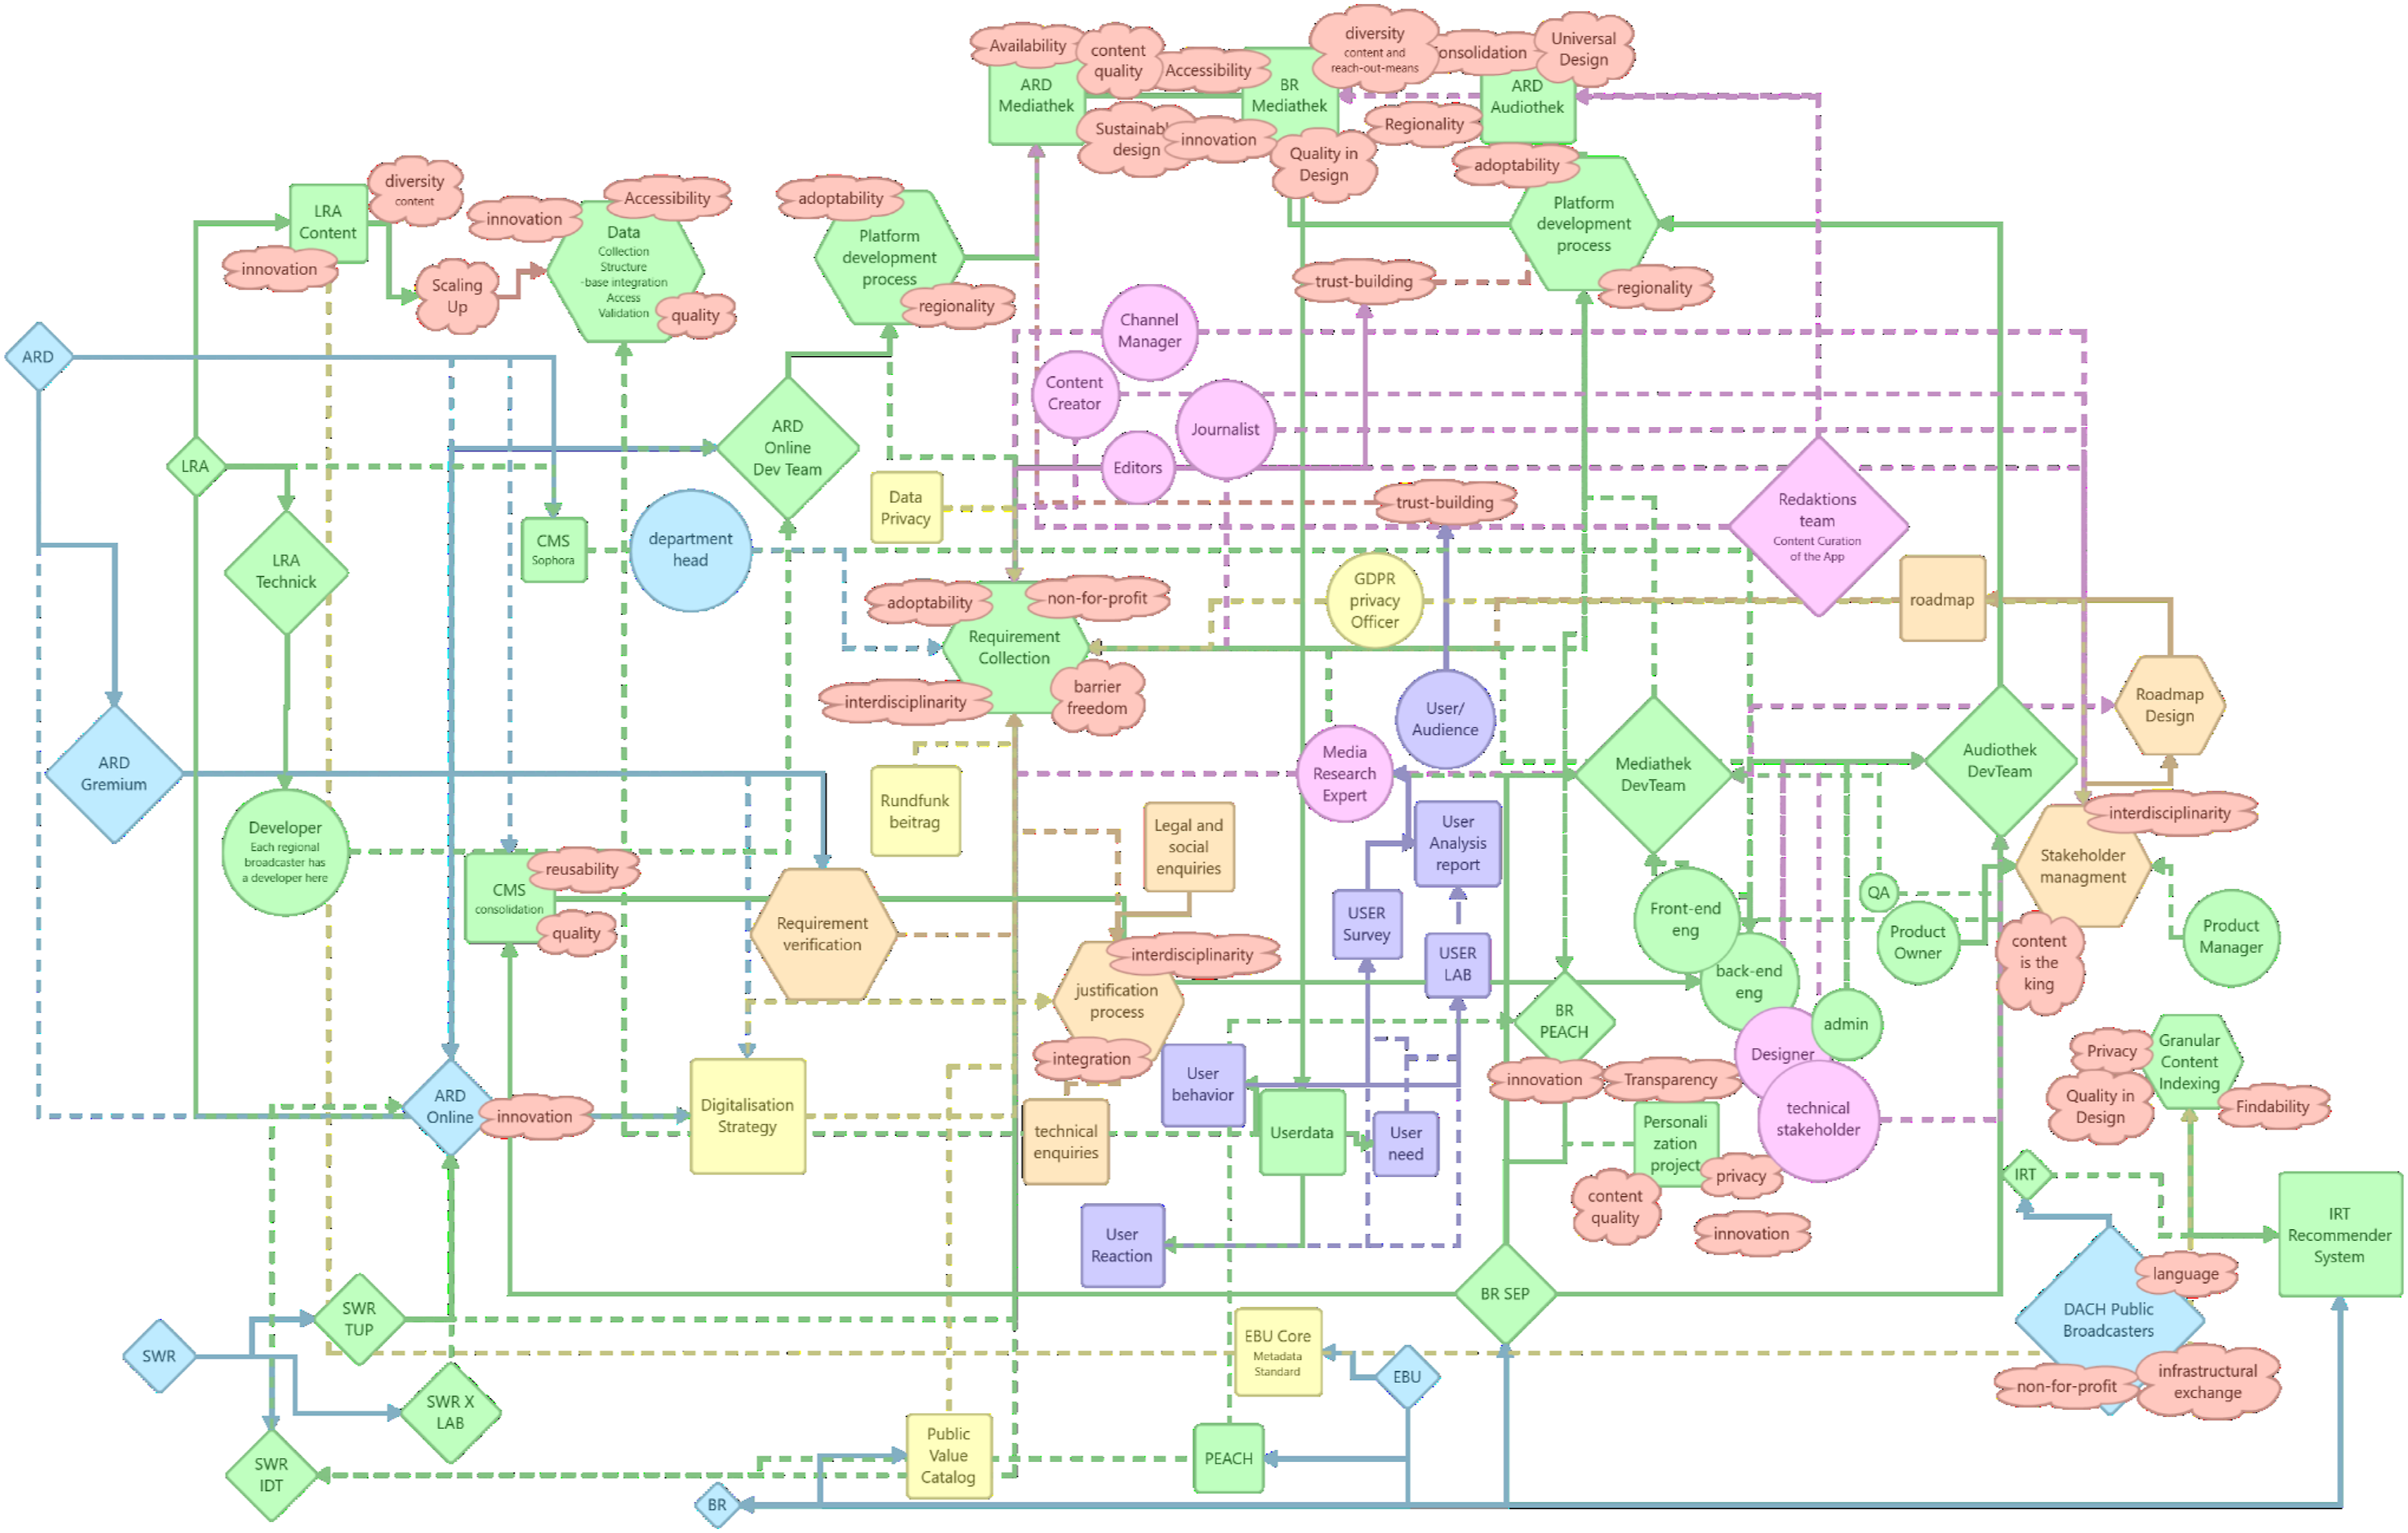
Although it cannot show every detail of the discussions, it uncovers different layers of it. For instance, when I asked an interviewee about other regional platform projects, the answer suddenly shifted to high-level political decisions, technological adaptability, and regional technological superiority. These decisions invoke uncertainties in the materialities of the infrastructure and again underline regionality and sustainability as implicit and explicit values. ‘Yeah. It [mdr Mediathek] does not exist anymore. It is also[going to be the case for]the BR Mediathek. It is not completely clear. As far as I know, it is a political decision. But there was the residency in the ARD [the director general], who said there should be one central Mediathek. And, yes, at the moment, the BR is still [there]. I think, maybe, [it is] still the only LRA [regional broadcaster] that has its own Mediathek. And the reason is the feature that we have [compared to] central ARD Mediathek, but I think that this time is over more or less’. (Informant #4, Back-end developer at BR, 2021, Personal Communication)
Platforms, development regions, and their affordances become a matter of inter-regional collaboration, interoperability, centralization (organizationally and technologically), alliance, and resistance. BR’s technological resistance to centralization is mobilized through additional features on its platforms. Regionality reveals new meanings and connects to the materialities of the infrastructure, from the development and algorithm to features, editors and contents, the relationship between content and technology, and user engagement.
A central Mediathek is only possible if the regional technological disparities fade away and a new entity ensures the technological power balance. Thus, ARD Online emerges as a collaborative actor and reconfigures the network. Every regional broadcaster must send at least a developer and an editor to ARD Online to collaborate in the design and development of online media libraries. This centralizes development and design and ensures the same quality access across Germany. Additionally, platform development, content creation, and documentation know-how are federated.
While ARD Online offers a path to sustainable platform development by cutting regional fractions and failures and centralizing resources, implicit values emerge within the discussion, which were hard to detect or absent in previous steps. For instance, addressing adaptability entangles with infrastructural conflicts connected to scalability and maintenance, which grow simultaneously. These two issues are central to sustainable platform development. ‘So it is a bit of a trade-off between the two [scalability of the platform and recommendation preciseness]. And to maintain something like that is, I mean, the process of creating something, [like the] algorithm, the least big deal. It is not an effort, but the real question is to maintain it, tune it, and adapt to different situations’. (Informant #9, Innovation Manager at arte, 2021, Personal Communication)
Scalability requires fading technological and power imbalances and regional system capabilities to connect. It faces various technological resistances – especially in data handling practices – across the infrastructure. It enforces a unified data structure and database, algorithms, and a maintenance routine that goes beyond technicalities and embraces documentation. The platforms’ quality and functionality depend on how well-maintained and scalable the platforms would be. Furthermore, concerning user experience, adaptability sheds light on the various screens, devices, and the content they receive via recommendation.
As the materiality of the hardware, software, and runtime is changing in digital transformation, as Passoth (2019) suggests, it ‘is the effect of a number of strategies and policies of its materialization, of ontological politics of installation, maintenance and dismantling of digital infrastructures of hardware, software and practice’. While adaptability stretches and is associated with regionality and sustainability, it offers a chance to observe the platforms within digital transformation. Through the lens of these values and the conflicts, as well as the expressions and statements of the interviewees, one can observe more than a platform once again. It is a centralized database and software development process, federated PSM, the audience as the user, where the regulation is practiced, and through which the content is created and distributed, bringing various communities and requirements to the table. It is more than one and less than many (Latour et al., 2012).
Conclusion
‘In social cartography, observation and description always occur together’ (Venturini, 2010). In mapping my mapping approach, I achieved a second-order observation and description by taking note of the absence, presence, and necessity to think of ways to engage more context in my mapping practices. Considering the critics and strengths of qualitative and digital methods, I constantly asked myself during my data collection and analysis about how to bring these methods together in a quali-quantitative approach to show different levels of patterns and details of an allegedly value-driven development of online media libraries. My tailored methods do not share the exact purpose and association with the same metrics and components as digital methods, although they inspire them. However, I see this as an inevitable condition that resulted in repurposing and the ‘devices of online platforms and digital marketing into instruments for social research’ (Venturini, 2024).
An approach to engaging with this inevitability and considering it as an opportunity is to commit to a construction, deconstruction, and reconstruction process that Venturini and Latour (2010) described as the unique ability of digital methods to bridge qualitative and quantitative methods.
In construction, I focused on data collection from various websites and digital sources, tailoring a pseudo-computational method to quantify a group of my documents to navigate the related discussion and representation of this data easily through visualization and spatialization tools like Gephi. Focusing on contextual data shows systematic technical deficits, non-interoperabilities, ping-pong-like journalist-technical discussions, developmental disparities, different prominent values, and regulatory limitations. Resistances evolve as conflicts unfold, negotiations happen, associations break, and new alliances shape. Therefore, to capture the context, one should navigate in multiple accounts. The methods should be compatible with the design and development level under study and the nature of debates and issues. A practice of deconstruction happens as it is constructed.
However, I tried to stay critical of the process of constructing my various datasets and spatialization and visualization. As a digital method, the pseudo-computational method was tailored to highlight the description of observations with contextualized relationships, shaping positions and accounts guided by the characteristics of the field, in which the text or transcription is not merely a group of words waiting to be analyzed. The terms, segments, and documents possess a gravitational force within the field, shaping particular positions and accounts and influencing the social dynamics. Because of its less automated nature, it allows one to scrutinize and formulate insights while meticulously observing the field and making notes. However, it lacks a sense of temporality: discussions over values, platforms, and organizations happen over time, and time is an important factor in realizing decisions and emerging technologies.
Nonetheless, deconstruction is not limited to this pseudo-computational method. The selectivity inherent to webpages, protocols, and interviews was itself an observed phenomenon in the data capable of rendering biases. If it were not for the researcher to deconstruct the data and be critical of it, despite the qualitative nature of the data, it would led to interpretations less representative of the actual context behind the value-driven development of the online media libraries. Moreover, the deconstruction was not a linear process. Being critical of the collected data and one work-in-progress map could change lanes and rethink the construction and deconstruction of another dataset and visualization. What are the overlooked relationships? What sort of disparities am I observing? What was excluded or missed, and how can it be scrutinized and brought to the surface? How would being critical about my methods enrich the analysis and insights?
Footnotes
Declaration of conflicting interests
The author(s) declared no potential conflicts of interest with respect to the research, authorship, and/or publication of this article.
Funding
The author(s) disclosed receipt of the following financial support for the research, authorship, and/or publication of this article: This work was supported by the Bayerisches Forschungsinstitut für Digitale Transformation.