
Abstract
This paper explores how non-experts reflect on and come to understand ‘data uses’, a phrase we used to refer to data collection, analysis and sharing. In recent years, research into what people think and feel about data uses has proliferated, whereas this paper focuses on how they do their thinking and feeling. We argue that imagining – that is, building or creating a mental image of something that is not present – is an important aspect of reflecting on data uses. We challenge the proposition that imagining takes place when there is a gap in knowledge or a lack of information, arguing instead that imagining plays an agentic role in reflection, enabling critical questioning of data uses. We draw on qualitative research carried out in the UK, in which we provided information about specific public sector data uses and asked participants how they felt about them. We found that imaginings, or ‘what ifs’, exist in a complex entanglement with different knowledges, including experiential knowledge.
Keywords
Introduction
This paper explores imagining as a practice which takes place when people reflect on data uses, a shorthand phrase we use to refer to data collection, analysis and sharing. In recent years, research into what people think and feel about data uses has proliferated (see Kennedy et al., 2020 for a summary), because understanding public views of data uses is considered to be essential for ensuring that data works ‘for people and society’ (the mission of the Ada Lovelace Institute in the UK). However, such uses are complex and explanations can be long, hard to follow, or not available at all. This makes understanding how people reflect on and arrive at thoughts and feelings about data uses important. It is therefore crucial to take a step back from what people think and feel about data uses, to consider how they do their thinking and feeling, yet this rarely happens.
Reflectivity is understood as the way individuals deliberate ‘on particular issues as a means of sorting complex and ill structured thoughts, perceptions and ideas’ (Malthouse et al., 2014:599). As such, it enables enquiry into thoughts, feelings and beliefs (Bolton and Delderfield, 2018:13). In this paper, we explore how people who do not identify as data experts (hereafter referred to as non-experts for expediency) reflect on data uses when they are asked what they think and how they feel about them. We draw on interviews and focus groups with diverse members of the UK public (n = 112) in which we explored their perceptions of specific public sector data uses, a phrase we used to refer to data collection, analysis and sharing. We focused on data uses rather than just data, because uses of data matter. It is now well-established that the purposes for which data are used have effects, benefitting some and disadvantaging others, in contexts ranging from targeted advertising (Turow, 2012) to child welfare (Heikkilã, 2022) and criminal justice (Angwin et al., 2016). Furthermore, what people think and feel about data depends on whose data is collected, how and where it is collected, for what purposes and with what consequences (Kennedy et al., 2015). In other words, uses of data and the contexts in which they take place shape people’s reflections. We therefore explored reflections on data uses in their infrastructural contexts.
In the paper, we argue that imagining is one way in which reflection on data uses happens. We use imagining to mean building or creating a mental image of something that is not present in the moment of imagining. We found that participants imagined by asking themselves ‘what if’. What if, in the future, data is used for a different purpose or by different people than originally stated or intended? What if the socio-political context changes and this has consequences for data uses? What if people from more disadvantaged or minority groups are excluded from some data uses? Although highlighting the role of imagining in relation to technology and data is not new, much existing scholarship is about ‘imaginaries’ not ‘imagining’ (see Jasanoff and Kim, 2009; Taylor, 2002; ). Like literature on attitudes to data uses, work on imaginaries tends to focus on what is being imagined. Adopting the terminology of ‘imagining’ rather than ‘imaginaries’, this paper focuses instead on ‘the technologies of imagination’ (Sneath et al., 2009), or how imaginings are generated and the ways in which they work in practice at the level of the individual.
In literature that explores imagining in relation to data uses, imagining is often positioned as something people do to fill a gap in knowledge, information or understanding (see Bucher, 2017; Markham 2021; Oman 2021, 2022). We challenge this argument, demonstrating that imagining is a reflective practice that takes place when these three things are present. As we describe below, in our research we provided participants with information, in the form of visualisations, about specific public sector data uses, thus enabling them to know something about these data uses when discussing their thoughts and feelings about them. And yet, participants still imagined and asked themselves ‘what if’. We therefore argue that imagining is not a substitute for knowledge, information, understanding. Rather, it is entangled with them.
Overall, this paper contributes empirical insights into how reflectivity takes place when non-experts talk about what they think and how they feel about data uses. We argue that imagining as a reflective practice unfolds through (1) imagined scenarios and (2) locating the self and others, and that it shapes participants’ thoughts and feelings about public sector data uses. Below, we map out the debates in which we situate our research. We then outline our methods, and proceed to elaborate our argument about imagining as a reflective practice.
Understanding reflectivity and imagining
According to Malthouse et al., reflectivity refers to individuals ‘deliberating on particular issues as a means of sorting complex and ill structured thoughts, perceptions and ideas’ (2014: 599). Reflectivity ‘can enable inquiry into what you think, feel, believe, value’ and work to ‘make things more comprehensible’, according to Bolton and Delderfield (2018: 13). We build on these definitions of reflectivity in this paper, linking them to our understanding of imagining as the practice of building or creating a mental image of something that is not present in the moment of imagining. Drawing on Kant’s proposition that ‘the imagination is pervasive in all human apprehension’ (see Sneath et al., 2009: 6), we approach imagining as something that is also connected to the process of ‘making things more comprehensible’, or of coming-to-understand. We see reflectivity and imagining as connected but neither the same nor interchangeable. Imagining, or the building of a mental image, is one way in which people reflect – that is deliberate, think through and consider – on issues. Imagining is therefore a practice which forms part of reflective processes.
In literature that explores imagining in relation to data uses, imagining is often positioned as something people do when there is a gap in knowledge or when they do not know something. Markham, for example, defines an imaginary as ‘what emerges as a person speculates about something they do not know’ (2021: 385). Similarly, Bucher (2017), argues that participants in her study of Facebook users’ perceptions of the platform’s algorithm filled an explicitly stated gap in their knowledge about how the algorithm works with their ‘algorithmic imaginary’, defined as ‘elaborate theories about what the algorithm is and ought to be’ (2017: 40). Although algorithms are not data, they inform how data is used and the infrastructural context in which uses take place. A final example is research by Oman (2021 and 2022), who found that, in order to make sense of data-in-context, people imagine when they do not necessarily know all that they need or want to know.
In this paper, we challenge the idea that imagining replaces knowledge. We provided our participants with information on the public sector data uses we talk to them about in the form of visualisations detailing how data is collected, how it is analysed and how it is shared. Unlike in Bucher’s work (2017), our participants were given the opportunity to know something about the data uses we discussed with them. We show how and in what ways imagining presents itself when information about data uses is made available.
Connecting (reflective) imagining with data literacy and agency
With data uses being difficult for non-experts to define and understand, data literacy, that is the ability to know, understand and have skills in data use and management, is of increasing importance (Pangrazio and Selwyn, 2019). Data literacy has been approached in numerous ways with emphasis often placed on technical skills and ability (see Calzada-Prado and Marzal, 2013; Carlson et al., 2011). Communication scholars, though, have tended to follow the ‘new literacy studies approach’ (Gee, 2000; Street 1994) expanding what counts as literacy to include the process of developing critical understanding. This has led scholars such as Pangrazio and Selwyn (2019) to develop specific frameworks for approaching literacy in the context of data, something they name ‘personal data literacies’. This type of literacy is not just about technical skill, it’s about building an awareness of ‘social, political, economic and cultural implications of data’ and the creation of a space to ‘reflect critically on these processes’ (Pangrazio and Selwyn, 2019:426). In fact, personal data literacy ‘requires critical reflexivity regarding the implications of data’ (emphasis added, ibid) with Pangrazio and Selwyn naming data reflexivity as one of five domains of personal data literacy. In this way, reflectivity (or reflexivity as it is referred to in their work) is framed as an integral part of the process of coming to know and understand data.
Our paper builds on work on personal data literacies by exploring how non-experts engage in the process of ‘data reflexivity’ when they talk about data uses. Specifically, we argue that imagining plays an important role in this reflective process. We also work to connect our findings to debates on data agency. Greater data literacy has been linked to individuals having greater agency (Kennedy and Moss, 2015). This is not agency in the sense of ‘brute force’ but instead the kind of agency proposed by Couldry (2014 and applied by others e.g. Kennedy and Moss, 2015) of an ‘an elongated process of action and reflection on the sociocultural context of a practice or text’ (Pangrazio and Selwyn, 2019:427) allowing individuals to ‘give an account of what one has done, even more basically, making sense of the world so as to act within in’ (Couldry, 2014: 891). We argue that imagining plays an agentic role in that it facilitates reflectivity, which in turn facilitates data literacy, paving a path for individual agency.
Unlike Pangrazio and Selwyn (2019), we choose to use the term reflectivity rather than reflexivity. Following other scholars, we see reflectivity as a practice in which individuals consider events or situations, look at scenarios from different angles and work through what they think and feel (Bolton and Delderfield, 2018). According to commentators, reflexivity entails an individual positioning ‘himself or herself within the broader social and organisational causes of particular problems’ (Malthouse et al., 2014: 599) to consider the effects of their own actions on social structures (Bolton and Delderfield, 2018). The term reflectivity more appropriately captures what we found in our empirical data, where participants focused on the real and imagined effects of the data uses rather than the effects of their own actions.
Distinguishing imaginaries from imaginings
Imagining in relation to technologies of all kinds, including data uses, is often discussed through the concept of ‘imaginaries’ (see Jasanoff and Kim, 2009; Taylor, 2002; ). In this literature, two dominant understandings are mobilised: the first focuses on social imaginaries, the second on socio-technical imaginaries. The social imaginary is described by Taylor as ‘a kind of common understanding which enables us to carry out the collective practices that make up our social life’ (2002: 106). For Taylor, social imaginaries are both ‘factual and normative’. That is, we have a sense of how things usually go, but this is interwoven with an idea of how they ought to go (2002: 106). The social imaginary is ‘about the way ordinary people imagine their social surroundings, which is often not expressed in theoretical terms but is, instead, carried in images, stories, legends, and so on’ (Taylor, 2002: 119).
Socio-technical imaginaries are described by Jasanoff and Kim as analytical devices that capture the ‘collectively imagined forms of social life and social order reflected in the design and fulfilment of nation-specific scientific and/or technological projects’ (2009: 120). Socio-technical imaginaries scholarship tends to focus on how powerful actors such as nation states, governmental actors and public institutions envision and enact technoscientific developments (Jasanoff and Kim, 2009), although the range of actors whose socio-technical imaginaries are studied in this field has expanded more recently to include corporate actors, civil society, research communities and other organised groups (Mager and Katzenbach, 2021). Socio-technical imaginaries are often seen to imagine desirable technological futures. As such, they are ‘at once descriptive of attainable futures and prescriptive of the kinds of futures that ought to be attained’ (Jasanoff et al., 2007: 2). They are future-oriented both in their prescriptiveness and because they are seen to be performative, bringing into being that which they prescribe.
Social and socio-technical imaginaries are both seen as ‘a kind of common understanding’ (Taylor, 2002: 106) and as ‘collective’ in nature (Jasanoff and Kim, 2009). Social and socio-technical imaginaries literature tends to focus on what these shared imaginaries are. As such, imaginaries are outcomes, rather than practices or processes, and they are collective, rather than individual. Sneath et al. (2009) are critical of understandings of imaginaries as collective, arguing that they enlarge the concept such that it becomes used in similar ways to notions such as ideology and culture (see Strauss, 2006). They argue that this leaves little room for understanding how imagining enables meaning to take shape. To address this problem, Sneath et al. (2009) argue for a focus on the ‘technologies of the imagination’, a term they use to refer to the means by which imaginings are generated. Following Sneath et al., we focus on how the practice of imagining unfolds as part of a reflective process when people talk about data uses. Rather than focussing on the ‘prescriptive’ outcomes (like work on socio-technical imaginaries does) we argue that it is important to focus on the ‘technologies of the imagination’ due to the prescriptive, or determining, role they play in how people ultimately perceive reality (Sneath et al., 2009). We understand imagining as ‘insinuated into perception itself’ (Crapanzano, 2004: 19). Understood in this way, imagining has the potential to shape how people think and come to have feelings about data uses. Shifting the focus from collective imaginaries to individual imaginings, we use the term imagining rather than imaginaries in the remainder of this paper.
Although we focus on individual imaginings, we are not arguing that such practices take place in a social or political void. We understand imaginings as socially constructed and acknowledge that, like imaginaries, they are shaped by their particular socio-political contexts (see Jasanoff and Kim, 2009). As Markham (2021) puts it, they ‘borrow from what is already known or supposed about the world’ (pg. 385) and as such they ‘reproduce current ideological trends’ (pg. 384). We also recognise that collective imaginaries about data and the social world more broadly inform reflective imaginings. We acknowledge the socially constructed character of imaginings by exploring how different forms of everyday knowledge, experience and identity shape talk about data uses and what people imagine about the ways in which data are used.
Methods
We carried out empirical research in the UK via interviews and focus groups with 112 participants and a survey (n = 2000). This paper focuses on the data collected via interviews and focus groups where we saw imaginings play a role in participants’ reflections on data uses (see Taylor et al., 2023for details on the quantitative element of this research). As our research took place during the COVID-19 pandemic, our qualitative research was conducted either online (via video call) or over the phone. Because we were interested in the role that inequality plays in perceptions of data uses, we recruited 112 demographically diverse participants. 85% were from one and 46% were from two or more disadvantaged groups. Often this meant participants were from minority groups in the UK (e.g. LGBTQ + participants, racially minoritized participants), but not always (e.g. female participants). We reflect on how our participants’ demographics and their perceptions of data uses in an alternative paper (Kennedy et al., 2024). We received ethical approval from our university prior to carrying out our research.
We researched perceptions of data uses in public sector organisations in the UK, focussing on people’s views of specific data uses in specific domains. We did this because previous research had asked questions about data uses in abstract and general terms (Big Brother Watch, 2015; The Direct Marketing Association, 2018), which limits understanding of public perceptions of actual data uses. Aware that much of the previous research into public attitudes to data uses had focused on attitudes to high-profile data practices (e.g. Dencik and Cable 2017), we also felt that it was important to understand people’s views of less high-profile and more everyday data uses like those that take place in the public sector, because of the role that they play in shaping everyday lives. It’s worth noting, that because of their less high-profile nature, participants were less likely to have prior knowledge of the data uses shown to them. We focused on six data uses in the government Department for Work and Pensions (DWP), the British Broadcasting Corporation (BBC) and the National Health Service (NHS), because these organisations will be familiar to many UK residents and they cover core aspects of everyday life: welfare, media and health. We partnered with the DWP and BBC to identify data in the first two domains. This meant that our contacts in these organisations selected the data uses on which our research focused. For the latter, health, we drew on publicly available information and prior research. The two DWP data-based systems focused on ways of making it possible to verify identity online, BBC data uses focused on personal control over data and NHS data uses focused on data sharing and re-use.
We wanted to ensure that participants were informed about the data uses we discussed with them, because we think that people need to know what a data use involves in order to develop thoughts and feelings about it. And yet, research on public perceptions of data uses often does not seek to establish what people know or understand prior to asking them their views, or it does not enable such understanding before asking about thoughts and feelings (e.g. Humphreys, 2011; Young and Quan-Haase, 2013). We addressed this issue in our research by using elicitation and engagement techniques to show and explain data uses to our participants. We drew on ‘data journeys’ approaches (Bates et al., 2016), developing detailed knowledge of each data use via interviews within the organisations responsible for them and analysis of available public documentation. We produced written accounts of the data uses, of which a professional data visualiser then produced visualisations of them. As critical scholars of data uses, we acknowledge that it is not possible to produce objective accounts of data uses, because interpretation takes place in the act of describing, illustrating and choosing what to highlight (Ditchfield et al., 2022). We know that methods shape findings, that ‘they have effects; they make differences; they enact realities’ (Law and Urry 2004, p. g. 392-3).
In interviews and focus groups, we presented these visualisations to participants (see examples of visualisations in Figures 1–3 in the analysis) and asked them what they thought and felt about the way data was being used. Whilst knowing it was important to provide information on data uses before asking participant’s opinions, we are aware that providing information to our participants about data uses may have encouraged them to think about them in ways that they would not have otherwise. We aimed to find a balance between informing our participants of data uses and their potential effects and not leading them to conclusions. We sought to do this by describing and visualising data uses in ways which were clear, accurate and balanced – for example, we sourced information from experts other than our partners, such as civil society data advocacy groups. We began the interviews and focus groups by asking participants about their awareness of the ways in which personal data is used, their perceptions of benefits and concerns and whether they had acted on any concerns they had. We then showed them visualisations of two or three of our public sector data uses, asked them to describe what they saw, and added details as needed. We asked broad, open questions such as ‘What do you think of this data use?’ to create space for participant-led discussion (see Ditchfield et al., 2022 for extended reflection on these methodological challenges). Through this approach, participants knew something about how our selected data uses work and yet, as we demonstrate below, they still imagined ‘what ifs’. Our methods thus enabled us to advance understanding of the relationship between imagining, knowledge and information in people’s perceptions of data uses. BBC Own It, a free app designed to support children when they use their phones, without adult supervision. DWP Dynamic Trust Hub, a project exploring ways to enhance identity verification. DWP Confirm Your Identity, an identity verification process for welfare payments which makes it possible to confirm identity online.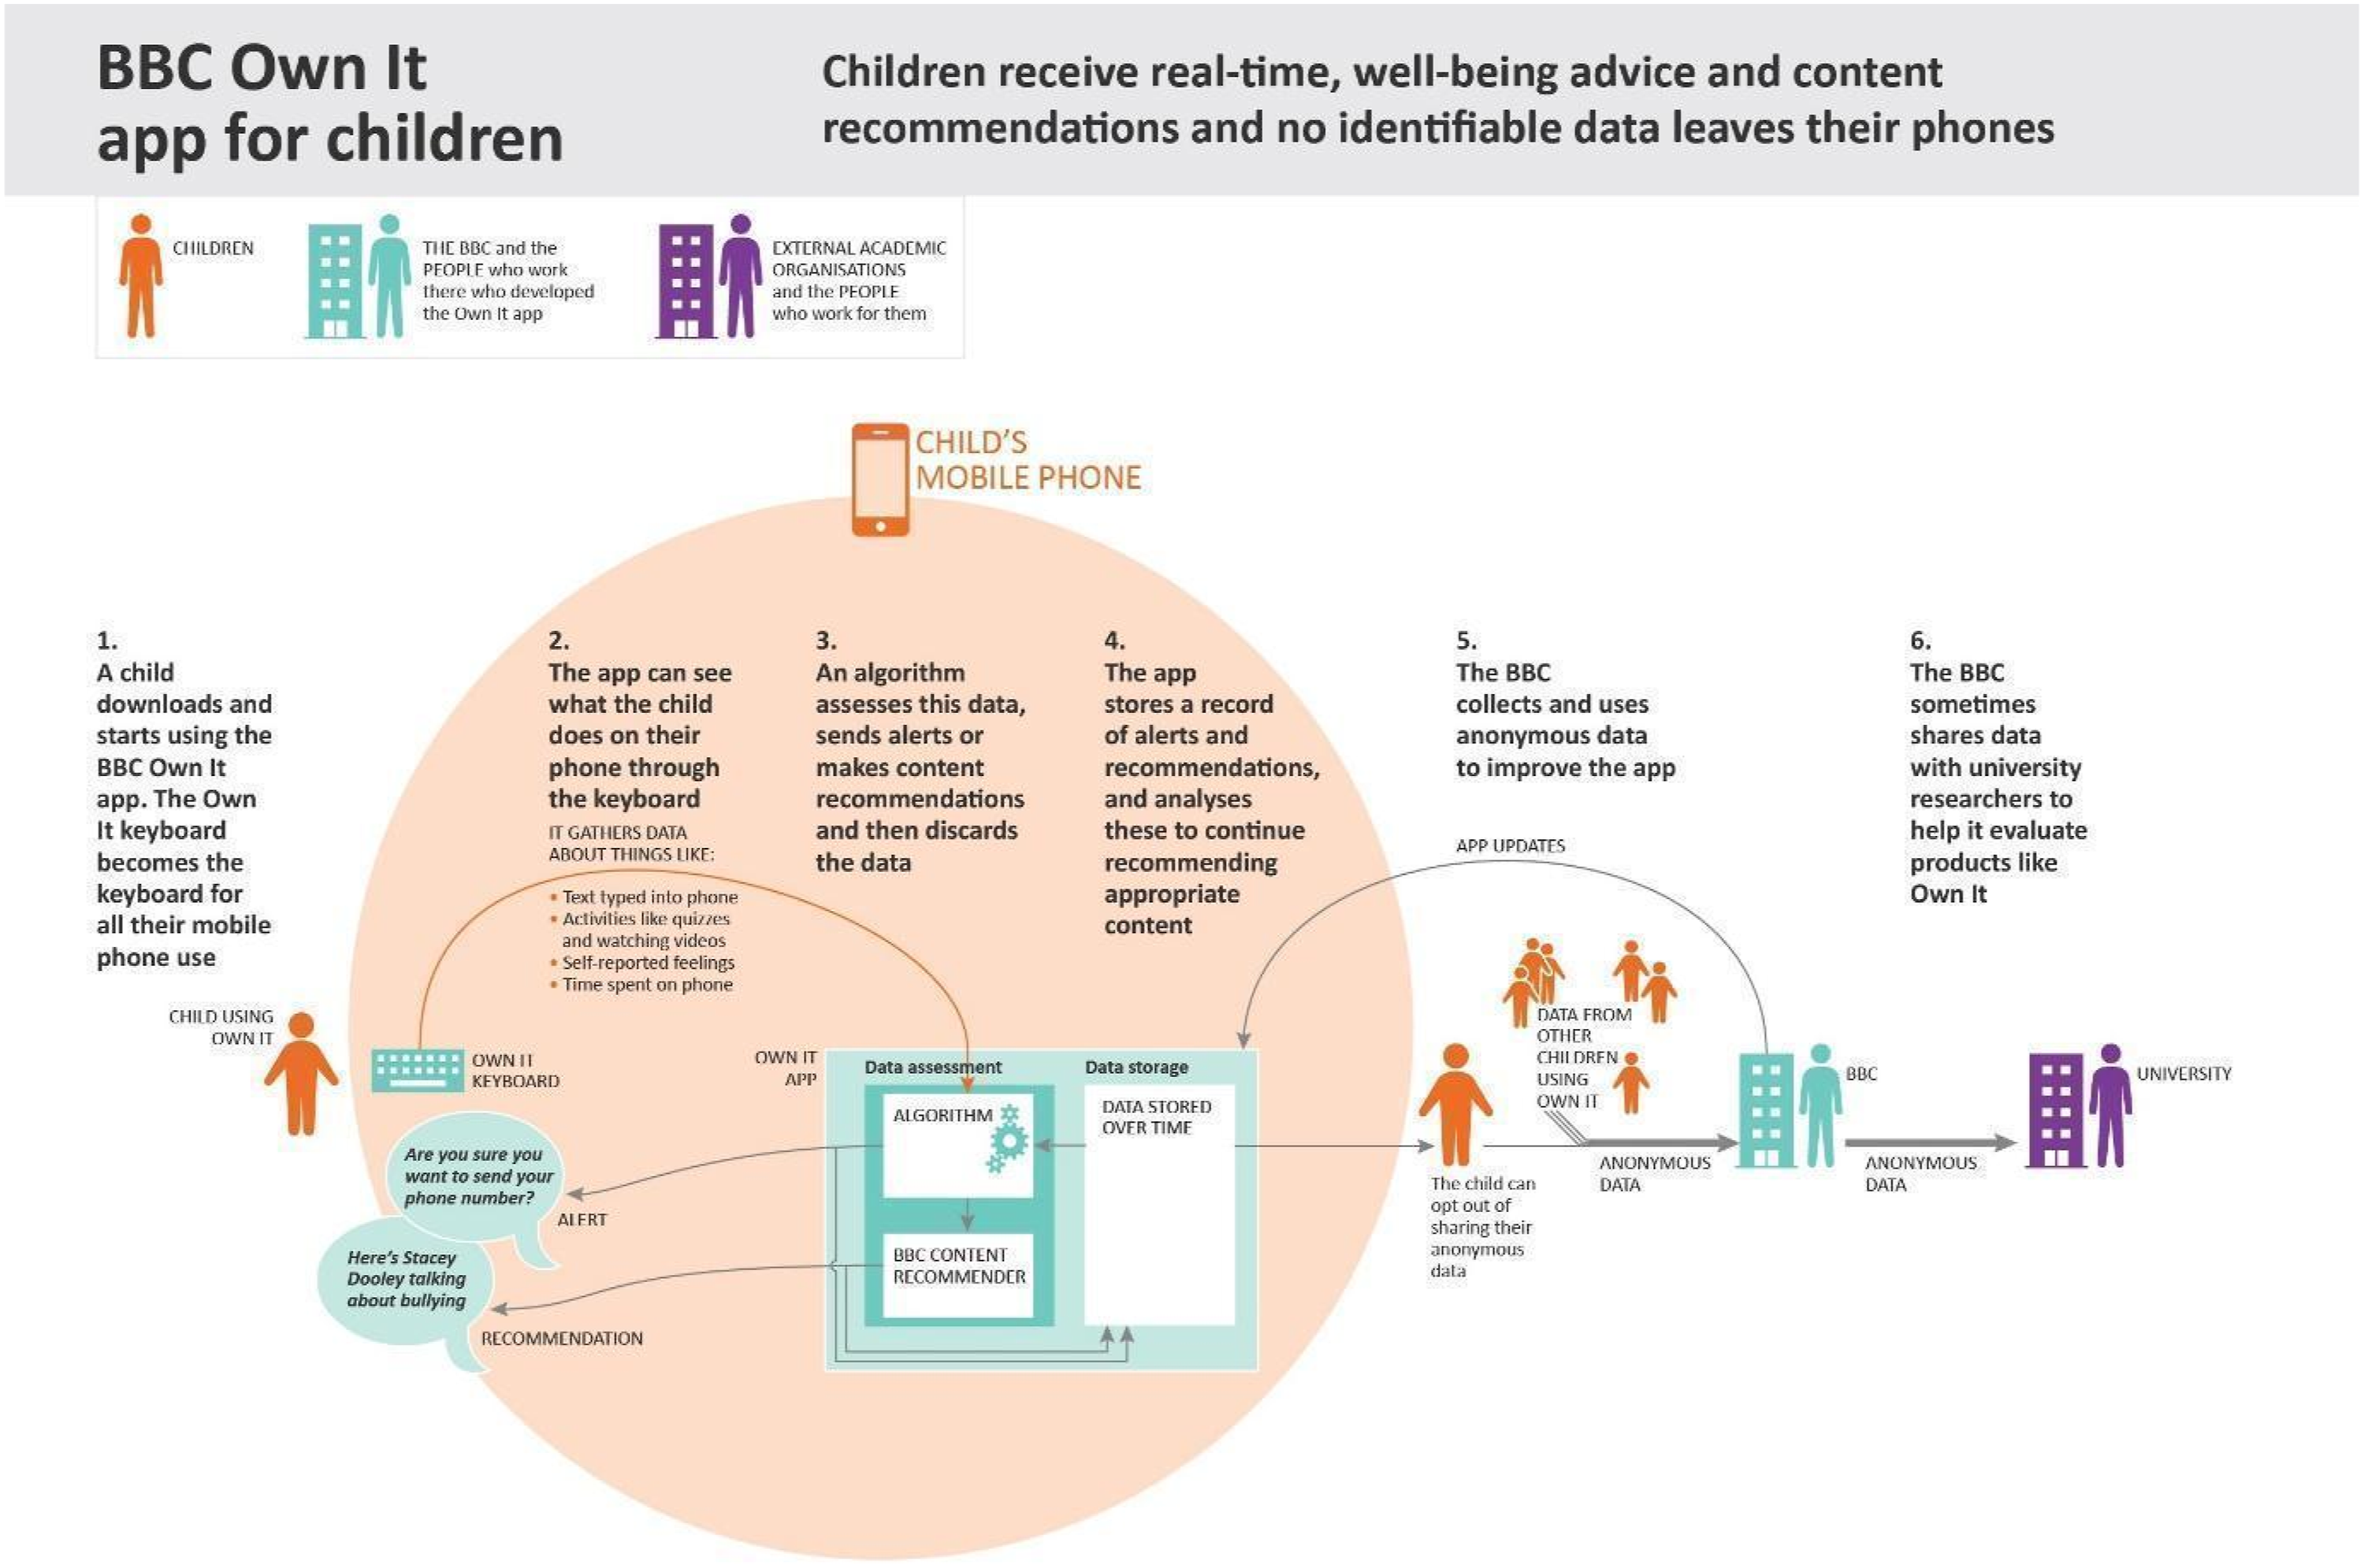
We carried out thematic analysis of the qualitative data, grouping codes into themes deductively, based on our research questions, and inductively, based on what emerged from the data. Multiple coders discussed the same transcripts to ensure codes were being used in as standardised a way as is possible with qualitative research data (Silverman, 2011). Although the empirical focus of our research was on what people thought about these public sector data uses, the semi-structured character of our interviews and focus groups allowed us to access the reflective practices that our participants engaged in when attempting to make sense of the data uses presented to them. One such reflective practice was imagining. In our analysis, we discuss two ways in which imagining unfolded: through imagined scenarios and locating the self and others.
Imagining as a reflective practice
Imagining through scenarios
One way that our participants reflected on the data uses we discussed with them was by imagining scenarios – that is, alternative future uses of data to those that we presented to them. Participants went beyond the information we shared with them about a data use, imagining the ways that the data might be used in the future, not foreseen at the time that our chosen data uses were planned or implemented. One example relates to BBC Own It, a free app designed to support, help and advise children when they use their phones to chat and explore the online world (shown in Figure 1). Participants were informed that Own It communicates directly with the child, without the involvement of their carers, gathering data on what children using Own It type into their phones, how they self-report their feelings and their responses to quizzes and questionnaires set by the app. An algorithm then assesses this data, sending alerts or making recommendations to children based on what they are doing online. Because Own It produces anonymous, aggregated data which is not linked to individual users, the BBC would not be able to connect Own It data to individual users of the app. We told respondents that this anonymous data are collected and used by the BBC to improve the app – given this intended use, the organisation may share Own It data with university researchers to help it evaluate and develop its product.
During our discussions, one group of participants talked about the role of the algorithm in assessing the data collected through the app. Jill, a white, British, heterosexual woman, aged 45-54, who has an annual household income of £50,000-£69,000, was concerned that Own It might erroneously send alerts to children suggesting they had been involved in bullying, when they had not. She said: it’s not human controlled and it could make mistakes. And you could have a child who’s perfectly happy who suddenly gets an alert about bullying, and then freaks out and thinks that something’s wrong and they’ve done something wrong. So, it could be unfair depending how good that algorithm is and how well it’s managed. (Jill)
Jill imagined a scenario in which a child receives an alert from the Own It application that highlights potential bullying behaviour. In her scenario, she is imagining that the algorithm makes a mistake, and that the child hasn’t done anything wrong yet receives an alert indicating that they have leading to the negative consequence of the child ‘freaking out’. Imagining this scenario is an important part of Jill’s reflection and sense making on the Own it app as after articulating such a scenario she makes a judgement of the application, saying that the application could potential be ‘unfair depending on how good that algorithm is’.
When asked how she felt about Own It data being shared with university researchers, Louisa, a white, heterosexual woman who was born in the UK, aged 35-44, who works for a charity, has an annual household income £40,000-£49,000 and no long-term conditions, said: What if the research done though, produced by the university, by lovely people like [our researcher], was used by people for the very opposite of what it was originally designed for, to target specific children? (...) Because they’ll have data, won’t they, like, ‘These children, nine year old girls, are interested in horses and watch really annoying American thingmajigs’. It will make all of the links. Even though my daughter would be anonymised, it still makes all the links and will specify those groups, and can pick out trends or stuff. I don’t know. I’m only playing devil’s advocate, but the research, which is there, is made to – I don’t know, could then be used for the very opposite of what it’s being produced for. (Louisa)
Louisa imagines a possible future in which the Own It data is not used by researchers to ‘evaluate products like Own It’ as our visualisation stated, but is instead used ‘for the very opposite of what it was originally designed for’. She imagines the type of data that an app like Own It might collect, such as the likes and preferences of certain groups. She notes that even though such data would not be linked to particular children because it is anonymised, it might highlight trends and as such, it could ‘be used for the very opposite of what it’s being produced for’. Louisa’s imagining is informed by her personal life and identity as a mother, as she references her daughter to imagine the kind of information Own It might collect. Louisa comments on her own imagining, describing it as playing ‘devil’s advocate’, the practice of purposely exploring the opposite side of debates and issues. Bolton and Delderfield (2018) argue that looking at scenarios from different angles is a key feature of reflective practice. Louisa purposely and knowingly uses imagining as a way of exploring alternative scenarios, as she reflects on how she feels about a particular data use. In so doing, she highlights the reflective role that imagining plays when making sense of data uses.
Louisa imagined a scenario in which data was used for a different (and more sinister) reason than originally stated. In our third example, Ellis imagined a scenario in which the broader socio-political context in which data uses take place changes, and reflected on the consequences of such imagined changes. Ellis, who is white, British, nonbinary and bisexual, aged 25-34, a data analyst with an annual household income of £30,000-39,000 and no long-term conditions, reflected on the Own It application using data about what a child does on their mobile phone to send alerts to the child when it detects potentially risky behaviour. Ellis noted that what is considered risky behaviour is based on interpretation, which is in turn informed by the broader socio-political context. They imagined a scenario in which a child is interested in climate change and searches for environmental campaigning organisation Greenpeace. The child might be seen as interested in terrorism, because at the time of Ellis’s interview, Greenpeace had been included on a counter-terror list, alongside neo-Nazi and other extremist groups (The Guardian, 2020). Ellis also imagined future possibilities with regard to the social acceptance of LGBTQ+ identities, stating: I’d be concerned of what the BBC are going to be flagging up as a problem, and that depends on what society is. I guess what the BBC sees as a problem could change depending on political pressure and things. You get it in some countries where obviously like LGBT content is not allowed. That is probably a while off from happening in the UK, but if a child was looking at certain types of political stuff, would that just be flagged […] I’d just be a bit concerned about who’s making the decisions of what’s okay and what’s not. (Ellis)
First Ellis imagined a child interested in climate change, and then combine this with knowledge of current affairs, specifically that Greenpeace was on the UK’s counter-terror list. This leads Ellis to note that socio-political contexts play a role in shaping what could be ‘flagged up as a problem’ by Own It. Ellis then imagined the implications of phenomenon for the LGBTQ+ community to which they belong, drawing on experiential knowledge. These different forms of knowledge and imagining combine to lead Ellis to feel ‘concerned’ about Own It, particularly about ‘what the BBC are going to be flagging as a problem’ and ‘who’s making the decisions of what’s okay and what’s not’.
Lewis, a white, heterosexual man who was born in the UK, aged 55-64, in work, with an annual household income of £50,000-£60,000 and no long-term conditions, imagined the possible scenario of the Own It data being ‘hijacked’: You know, you could imagine if there was a way for somebody to hijack it then it would be an absolute nightmare in terms of, you know, it’s now capturing all of the keystrokes from somebody, and in this case it’s a kid so it’s unlikely to be, you know, military secrets or whatever, but it’s still that kid’s kind of personal life that they are capturing in some way. So yeah, so I think – so this one on the face of it sounds great, but you’d really want to know a little bit – well, quite a bit more actually about that. (Lewis)
Lewis describes the imaginary scenario of Own It data being hjiacked as ‘an absolute nightmare’ due to the intimate and personal nature of the data that is collected by the app. Lewis links his imagining to his perception of the data use by saying that ‘on the face of it, it sounds great’. This indicates that from the information we provided about the data use, Lewis’ perception is positive. However, his imagining of the potential scenario of hijack complicates this and leads him to want to know more to make his decision on how he actually feels.
Through these examples we see how the practice of imagining plays a role in the reflective process of forming views on data uses. Imagining these possible scenarios led some of our participants to express feelings or judgements about data uses, with Jill noting that Own It may be unfair, Ellis being concerned about the use of Own It and Lewis’ feelings complicated by the imagined scenario of a hijack. Experiential knowledge is also relevant, as seen in the examples from Louisa and Ellis. We elaborate on this point below.
Imagining through locating the self and others
A second way in which imagining took place was through locating the self and others in relation to data uses. By this, we mean that participants imagined the potential experiences of people from disadvantaged or minority groups to which they did not belong and how they might experience public sector data uses. Sometimes, participants compared these imaginings with their own experiences and identities. This type of imagining most commonly occurred in relation to the two DWP data uses, most likely because the DWP provides essential welfare services to those disadvantaged by structural inequalities. The DWP data uses involve individuals inputting data about who they are into systems in order to verify their identities. We understand this to be a form of data collection and therefore part of the overall DWP data use. In this section of analysis, we include quotes where participants imagine how others may experience and navigate the interfaces in which data collection takes place, for example, Government Gateway. As contexts such as how and where data collection, sharing and analysis take place matter in terms of what people think and feel about data (Kennedy et al., 2015) we argue that it’s important to include these reflections on interface in our definition and analysis of data uses.
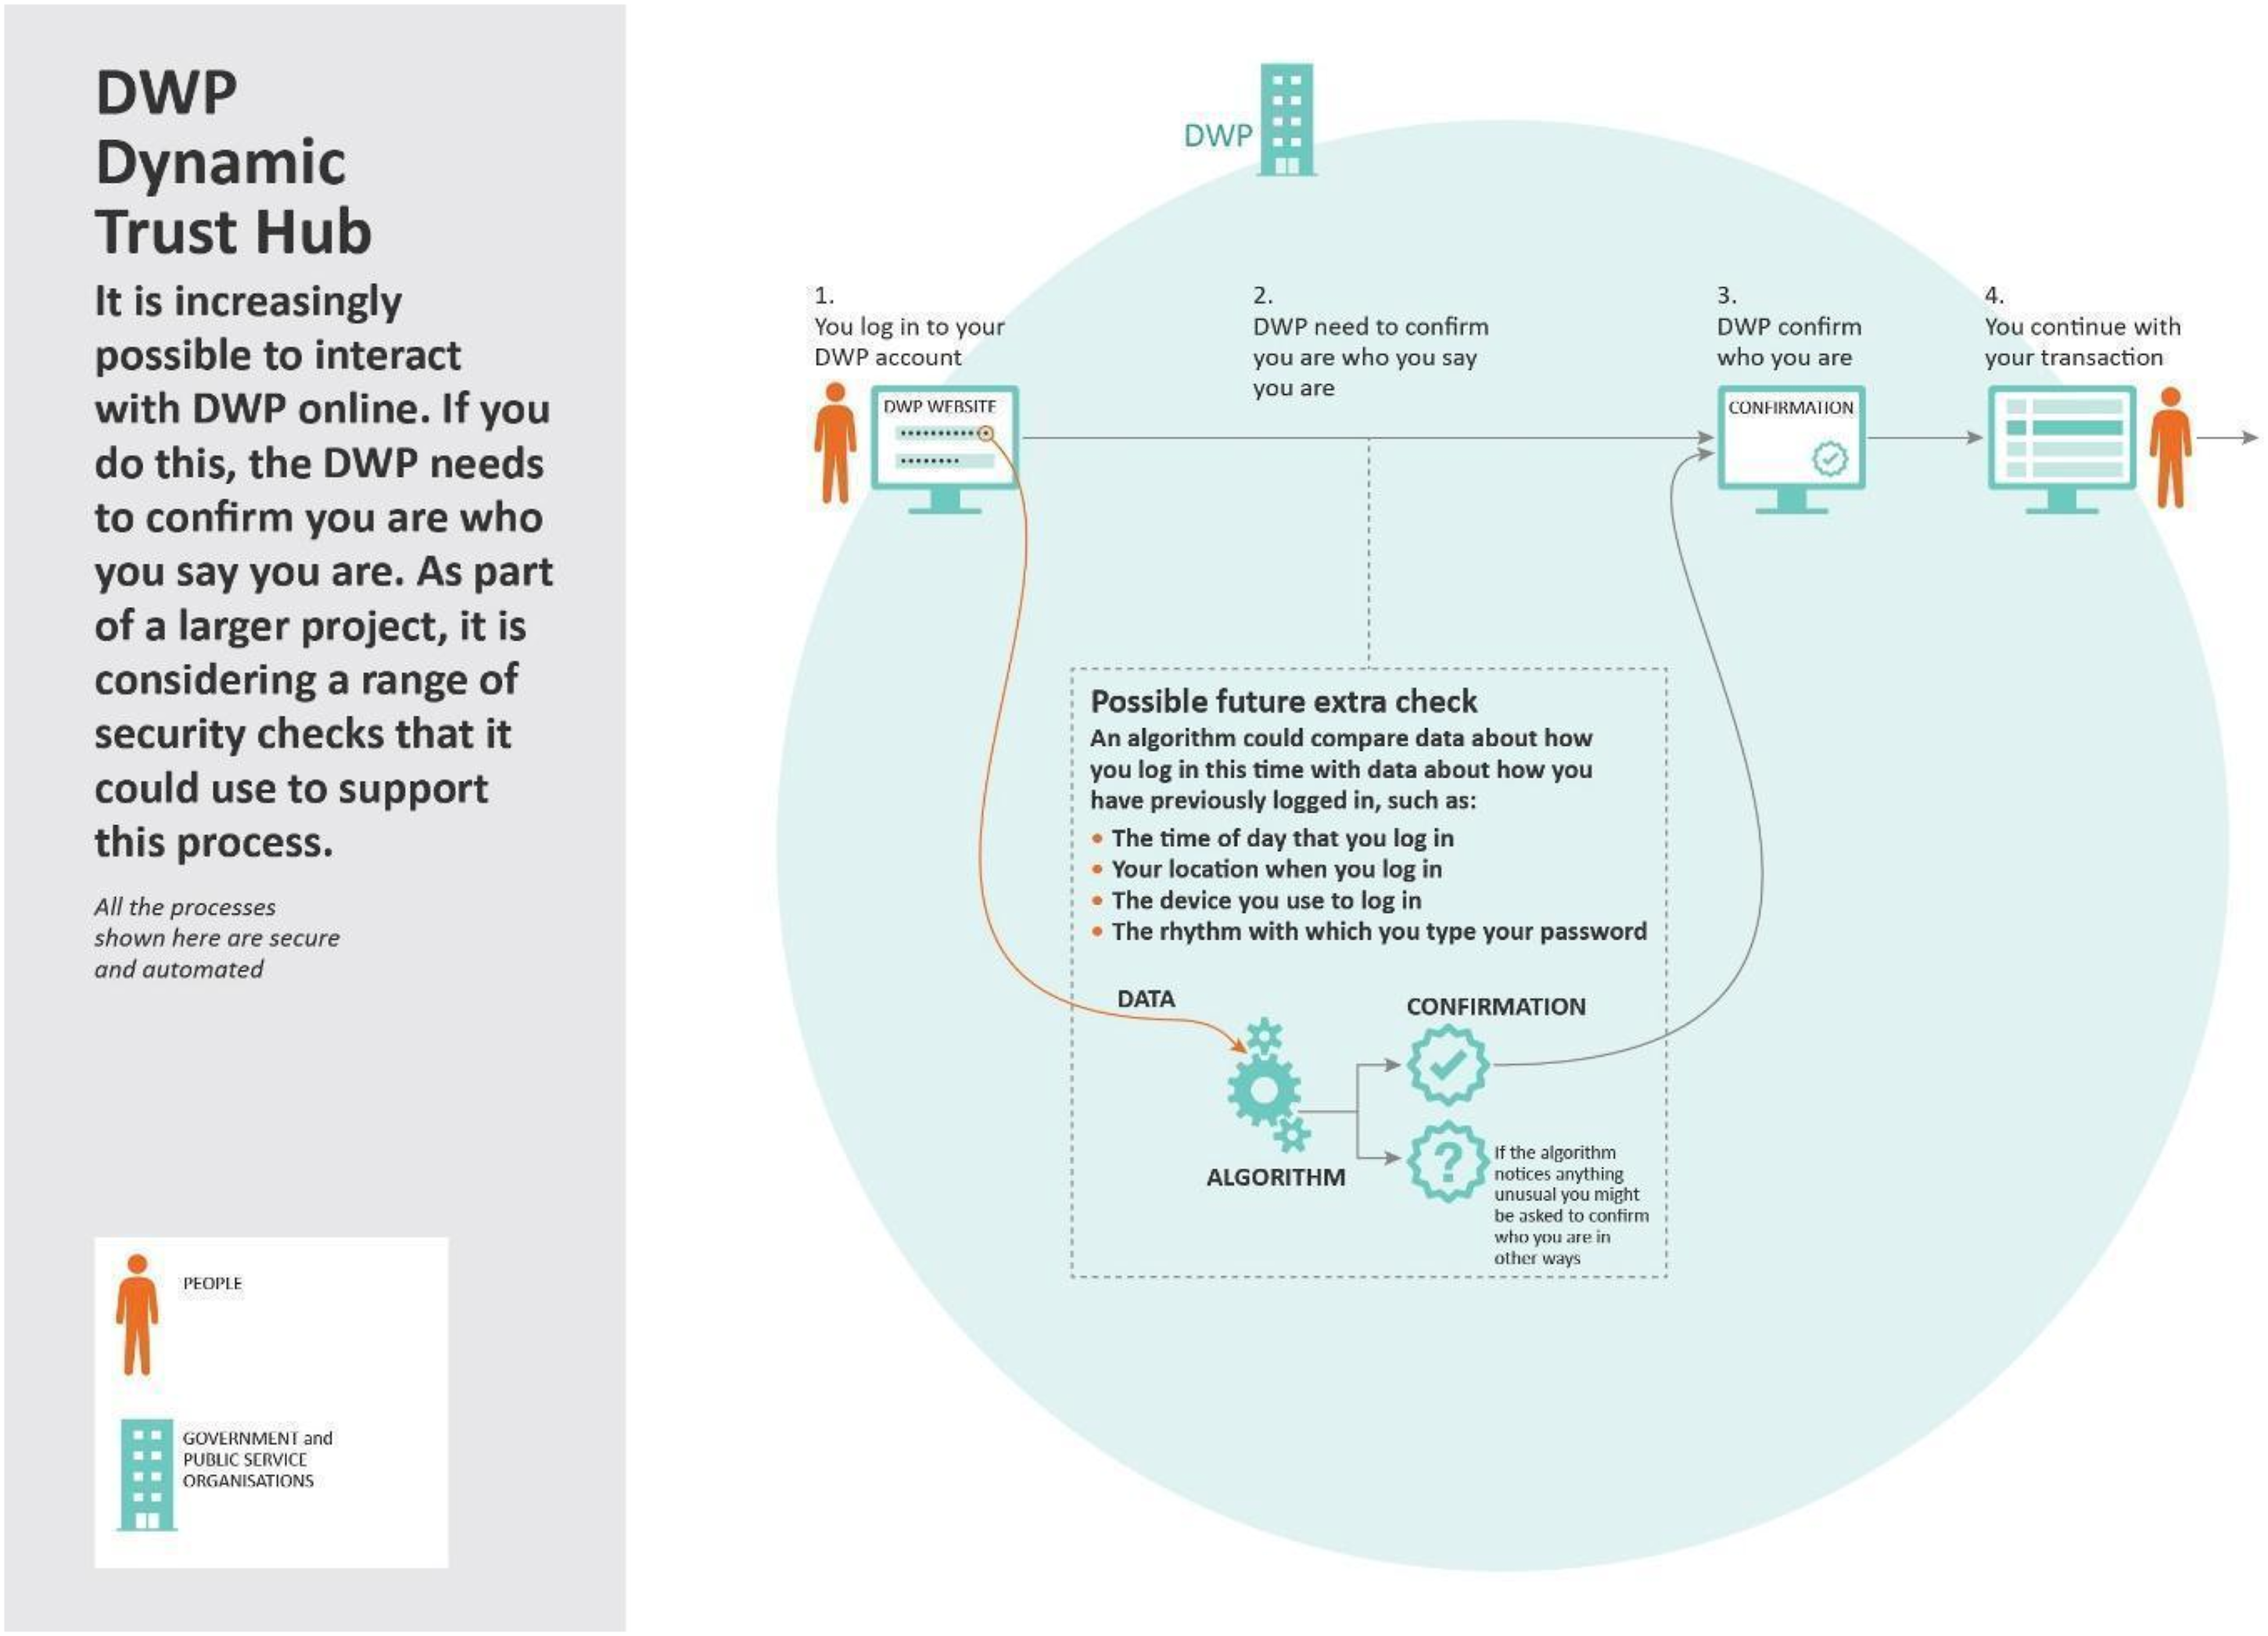
Tahira, a heterosexual, Pakistani woman, aged 45-54, a charity worker with an annual household income of £50,000-£69,000 and no long-term health conditions, imagined how others might experience the DWP’s Dynamic Trust Hub, shown in Figure 2. Dynamic Trust Hub explored different ways to enable DWP to verify service users’ identity, including doing extra checks behind the scenes when someone enters their password to access their DWP online account. These additional security checks included time of log in, the rhythm with which people type their passwords, swiping patterns and devices used to log in. When asked what she thought about this data use, Tahira said: Five percent of me says, yeah, I get why there is a need for extra security. But then 95% of me thinks it’s bureaucracy and it’s actually making the process more bureaucratic and more exclusive. People struggle anyway with online stuff. And also, you know, if someone’s working three jobs – I’m just using that as an example, I know so many people that do that now, unfortunately, men and women. And so, yeah, they might do it in between shifts or might be on rotas or whatever. So yeah, to be managed or observed, because that’s what this is, on the time of day that you might log on or the location. And then if it doesn’t always match up, you’re going to have to go through another layer of security. I know that’s one example, but I could give you so many about how this would be so stressful for people. (Tahira)
Tahira imagines that someone who has multiple jobs and who might have to log into the DWP system between shifts might be penalised because they cannot always log on at the same time of day. Tahira earns an annual household income of £50,000-£69,000, so she is not in this position herself, yet she draws on her knowledge of other people’s lives to imagine that being in this situation could make identity verification checks difficult. This knowledge could come from her experience as a charity worker, a job that exposes Tahira to people in more marginalised and vulnerable positions to herself, as well as her personal networks. This knowledge is alluded to in what Tahira tells us, such as ‘I know so many people that do that [work three jobs] now’ and her comment that she could give ‘so many’ more examples. Tahira combines her experiential knowledge with the information we have provided about the DWP Trust Hub to imagine how data uses may be experienced by others. Imagining what it is like to use the DWP system whilst ‘working three jobs’ plays an important role in Tahira making sense of this data use, leading her to her conclusion that this system is ‘actually making the process (…) more exclusive’.
Huso was another of our participants whose imagining of the data uses shown to them involved considering the social position of other people within society. Huso, a black, British African, heterosexual woman, aged 25-34, a teacher with no long-term conditions, noted how people who lived in her community often accessed the Internet at the library, because that was ‘the only place’ they could ‘actually use a computer’: A lot of people in our community also really rely on the local libraries for internet access. Who wants to be filling out security checks in a public library, where they can see what you’re doing on the computer, because the computers are placed so that everyone can see what you’re doing on the computer? You don’t want everyone seeing all that information about you. But if that’s the only place you have to actually use a computer, […] that’s really bad. I think, yeah, that’s probably the worst one of the three. (Huso).
In this quote, Huso is imagining how someone who does not have access to the Internet at home may experience using the DWP Dynamic Trust Hub system. Her concern is with the lack of privacy afforded to people when using the Internet in this way (‘who wants to be filling out security checks (…) where they can see what you are doing on the computer’). Imagining such an experience contributes to her evaluation of the data uses we showed her as she goes on from her imagining to state that this is ‘really bad’ and that this is ‘the worse one of the three’, comparing it BBC Box and BBC Own It.
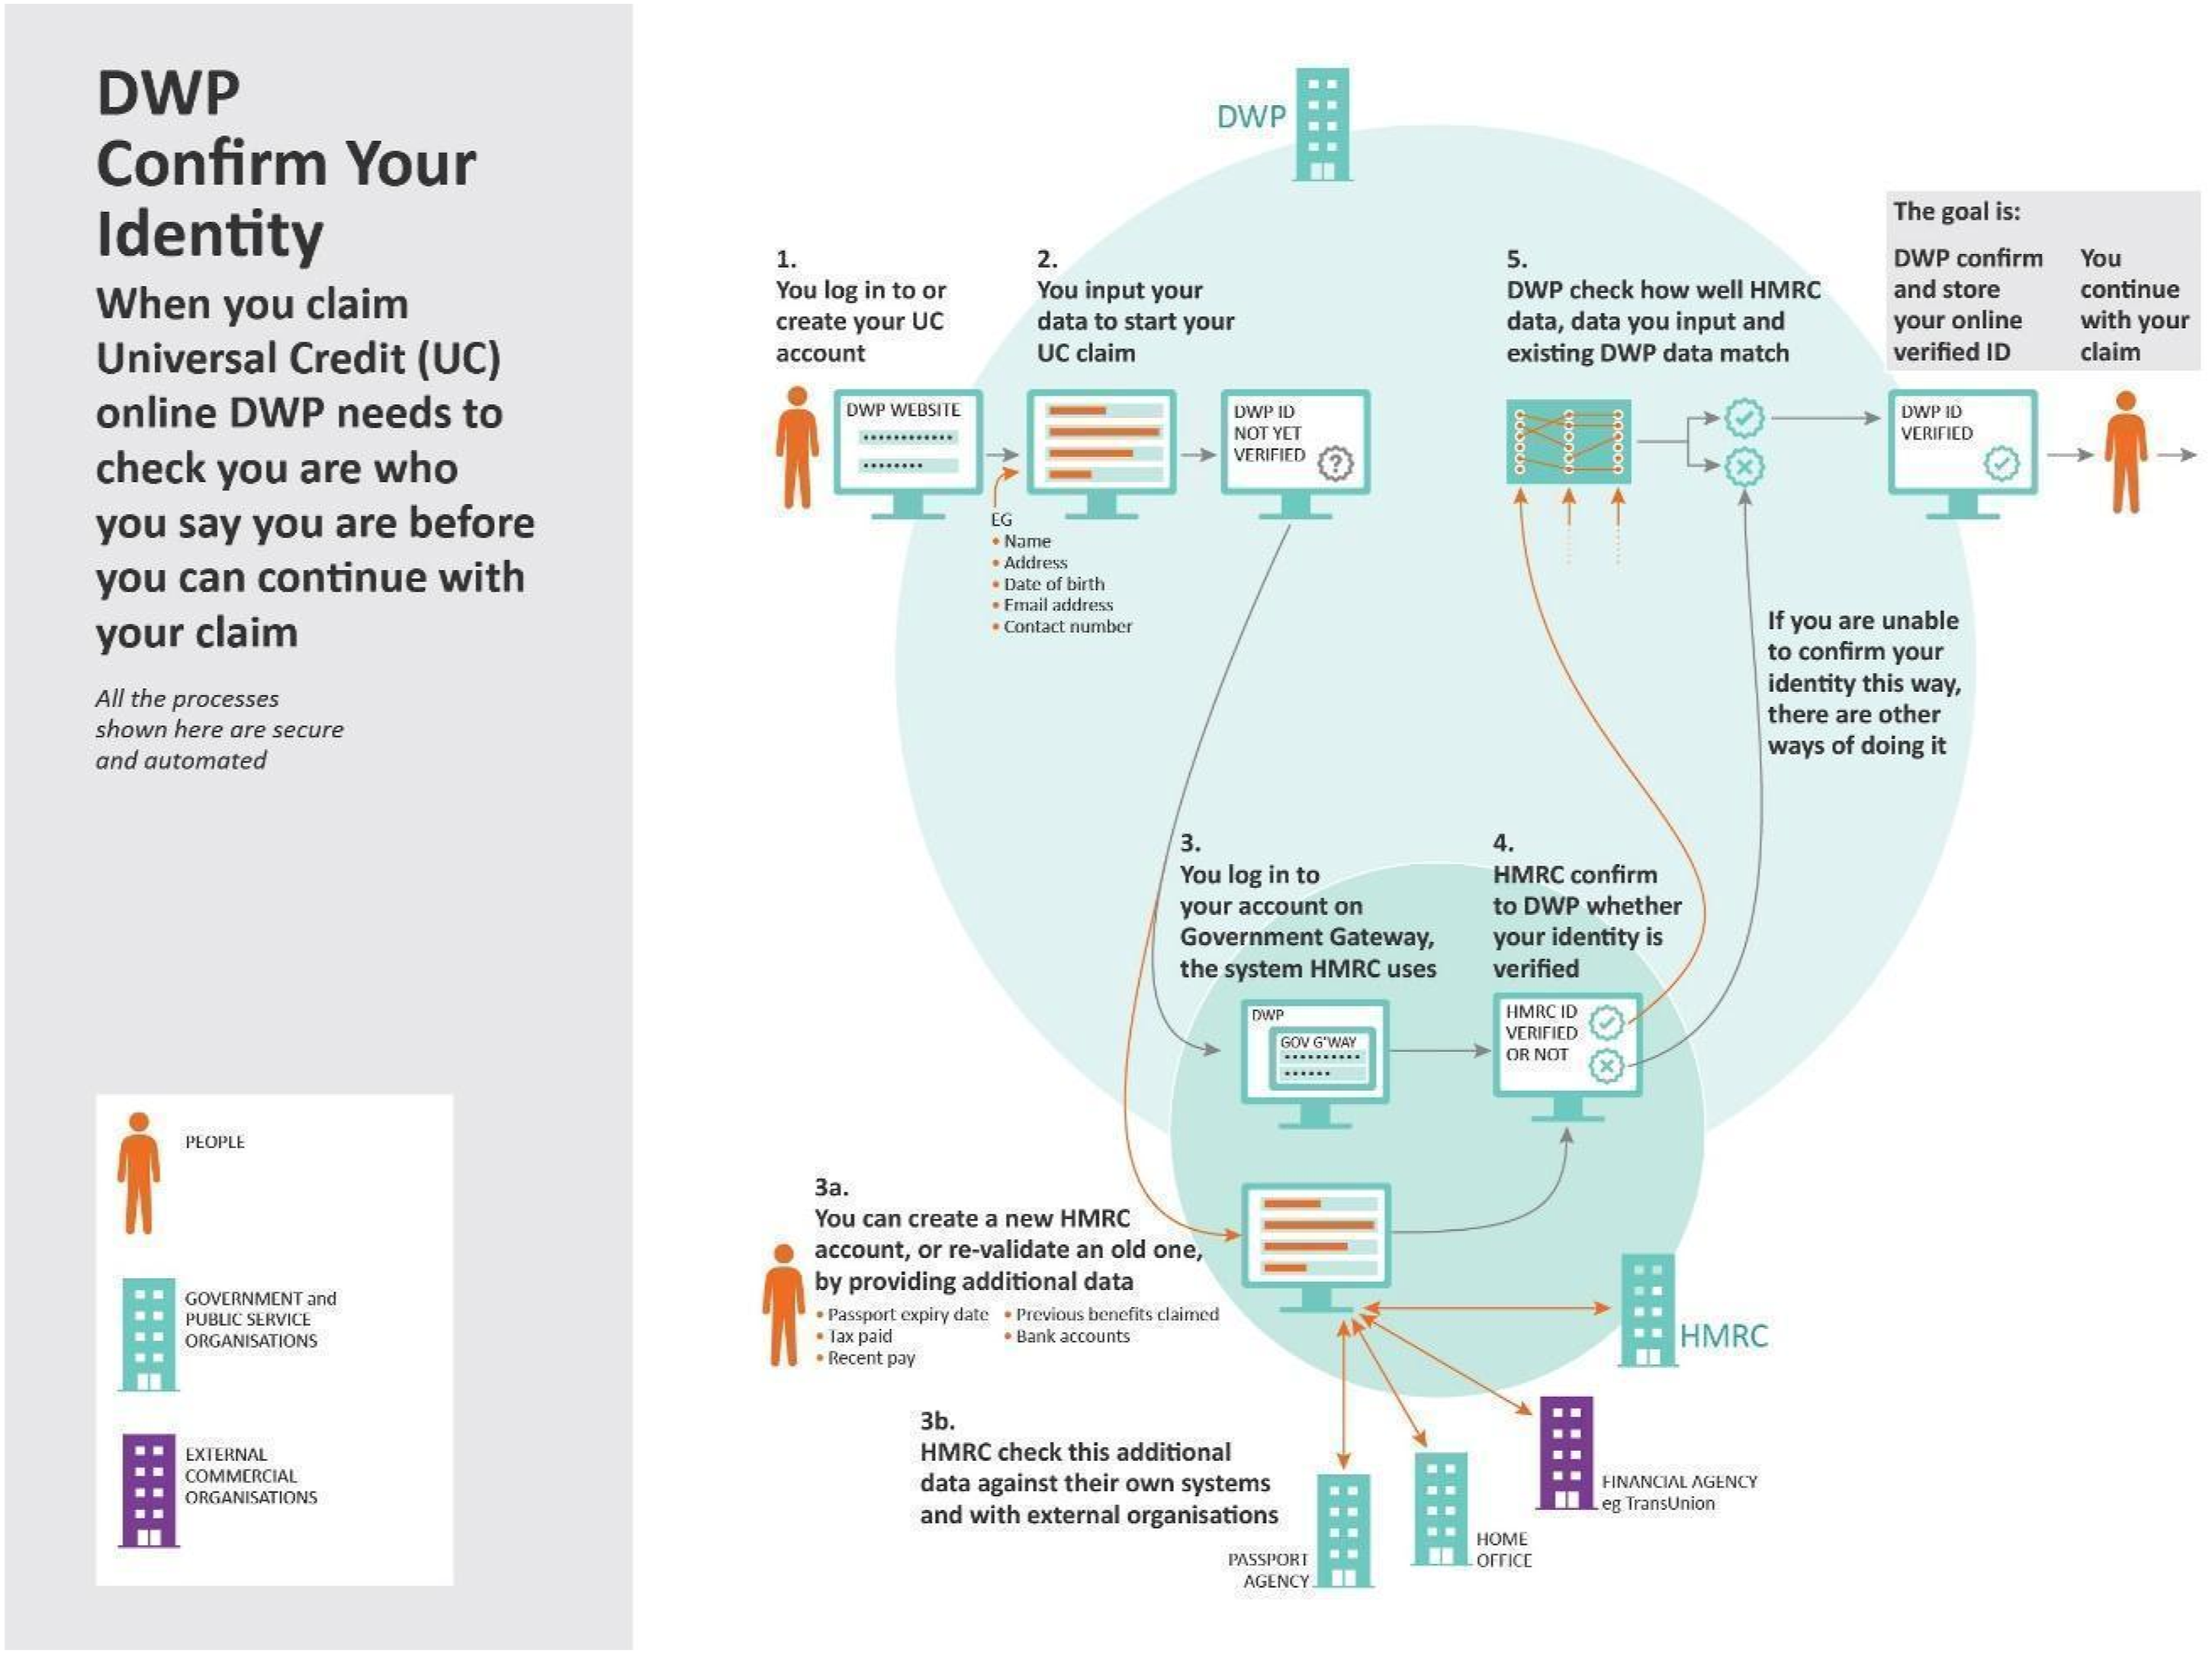
We observed similar patterns when participants talked about our second DWP data use, ‘Confirm Your Identity’. This is an identity verification process, focused on enabling welfare claimants to confirm identity online. As can be seen in the visualisation in Figure 3, this complex identity verification process involves a number of bodies, including: HM Revenue and Customs (HMRC), the UK Government department responsible for collecting taxes and issuing national insurance numbers, amongst other things; Government Gateway, an IT system for registering for online services provided by the UK Government; and financial agencies such as TransUnion, which hold records for most people.
Like Tahira and Huso discussed above, when asked what they thought about Confirm Your Identity, some participants imagined how someone in a more disadvantaged societal position to themselves may experience the data use. Often, participants imagined these positions alongside acknowledging their own positional privilege. For example, Rosie a white British heterosexual woman, aged 35-44, a physiotherapist with an annual household income of £30,000-£39,000 and no long-term conditions, said: It took us forever and we’ve both got degrees and have been through university and English is our first language. I dread to think for somebody who isn’t, you know, who hasn’t got English as a first language. It’d just be horrendous. (Rosie)
Here, Rosie draws on her own experience of using online government systems to imagine that someone for whom English is not a first language might struggle with this process. Rosie imagines the experience of others here by reflecting on how someone who ‘hasn’t got English as a first language’ may experience the data use. However, Rosie also considers her own position in society here, noting how her and her husband have ‘both got degrees and have been through university’. Considering her own educational privilege informs her imagining of someone in a different societal position. This process of imagining the experience of others then leads her to conclude that ‘it’d just be horrendous’.
Also talking about Government Gateway, Kerry, a white, queer, British woman who was born in the UK, aged 35-44, a public sector consultant with an annual household income of £70,000-£99,000 and no long-term conditions, said of herself and her partner: between us, we’ve got about seven degrees, but we spent one evening tearing our hair out, trying to navigate the Government Gateway. If I was a single mum, stressed out of my head trying to get money to feed my kids and I was faced with that, trying to verify myself on the Post Office app and then remember what you did last Tuesday. Was it a full moon? […] [laughs] – it really brings up rage in me, and the fact that we’ve been using this for some of the most vulnerable people. I hate it. (Kerry)
Like Rosie, Kerry draws on personal experience and struggles with online DWP systems noting how they ‘spent one evening tearing their hair out’. This time, Kerry imagines the experience of a ‘single mum’ who she perceives to be ‘stressed out of [their] head trying to get money to feed [their] kids’. This perception of single mothers as stressed and in need of income, while not necessarily representative of all single mothers, can be seen as a social imaginary, an idea ‘shared by large groups of people, if not the whole society’ (Taylor, 2002: 106). This macro social imaginary informed Kerry’s more micro process of using imagining as a tool to reflect on, and come to understand, the Confirm your Identity data use. Similar to Rosie, Kerry’s own position within society is also made relevant in their reflections, again relating to educational privilege (‘we’ve got about seven degrees’). Imagining the self in relation to others plays a determining role in Kerry making sense of their feelings on this data use. Kerry’s single mum imagining leads her to conclude that it ‘brings up rage’ in her and that she ultimately ‘hates’ the way this data use is used for the vulnerable people in which she imagines.
In the examples above, some participants imagined that specific data uses might be difficult for people from some disadvantaged or vulnerable groups to use. This imagining plays a role in reflection, in that individuals consider situations and scenarios from different angles, which in turn enables them to form views about data uses (Bolton and Delderfield, 2018). Kerry’s imagining, for instance, leads to feelings of ‘rage’, Rosie feels that using the DWP system under her imagined circumstances would be ‘horrendous’ and Huso describes the data use as ‘really bad’. Elements of reflexivity are also present in these imaginings, if reflexivity is understood as positioning yourself ‘within the broader social and organisational causes of particular problems’ (Malthouse et al., 2014: 599). Both Rosie and Kerry do this when they acknowledge their educational or language privileges in order to imagine how other people may experience a data system. However, in their imaginings, they focus on the potential effects of data uses, not the potential effects of their own actions, which Bolton and Delderfield (2018) propose is a characteristic of reflexivity. As a result, we suggest that these participants engaged primarily in reflective, rather than reflexive, imagining.
Discussion and conclusion
Our analysis shows that the practice of imagining forms part of the reflective process that takes place when non-experts talk about data uses. We argue that imagining is a reflective practice that aids individuals in deliberation and the sorting of thoughts and as such, it enables access to what people think and feel about data uses. Our work contributes to literature on imagining and imaginaries by advancing understanding of how imagining happens at an individual level. Rather than showing the ‘prescriptive’ role imaginings can play in ‘co-produce(ing) the very future they envision’ (Mager and Katzenbach, 2021: 224), we have shown the determining role that imagining can play in shaping how people perceive public sector data uses (Sneath et al., 2009).
Imagining in relation to data uses is often perceived as something people do when there is a gap in knowledge (see Bucher, 2017; Markham, 2021; Oman, 2021, 2022). However, we provided participants with information about specific data uses and spent time in interviews and focus groups discussing and explaining them. Yet, our participants still imagined ‘what ifs’. They asked themselves: what if the data is used in a different way, the context changes, you belong to a group which is disadvantaged by a data use? In our research, imaginings happened in the presence of knowledge, not in its absence. Our participants used the information we gave them as a springboard to imagine which helped participants think through and come to understand data uses.
Our research therefore advances understanding of the complicated relationship between knowledge and imagining. Imagining can be centred on things that are unknown, but it also exists in a complex entanglement with what is known. In our fieldwork, knowledge fed into and was entangled with our participants’ reflective process of imagining, for example, when Ellis drew on their current affairs knowledge that Greenpeace was on the UK government’s counter terrorism list, to inform his imagining of how BBC’s Own It may be used in different socio-political contexts. Participants’ imaginings were entangled with experiential knowledge, such as Tahira’s experience of charity work and of connection to marginalised communities. Knowledge also derived from experiences of engaging with similar data systems to those we showed our participants, such as Rosie and Kerry’s experiences of using the UK Government Gateway system. Experiential knowledge deriving from participants’ identities also fed into their reflective process of imagining. Lousia’s imagining of the possible future uses of Own it data was informed through her identity as a mother. Rosie and Kerry highlighted their identities as well-educated people, when imagining the experiences of other users less well-educated than they were. Ellis imagined possible consequences of Own It data use for the LGBTQ+ community, to which they belonged.
Whilst many forms of knowledge on which participants drew in their imaginings about data uses were experiential and everyday, other forms of knowledge also played a role. We saw that broader imaginaries of social life informed our participants’ imagined scenarios, for example, when Kerry imagined a ‘single mum’ engaging with DWP systems. We also acknowledge that ideological trends and discourses may shape the imaginings that people have (Markham, 2021). High-profile data misuses and scandals (such as Cambridge Analytica, see Lapowsky, 2019) may inform participants’ imagining of dystopian future scenarios. However, this is not something we addressed in our research. Rather, our research illuminates how lived experience and identities produce knowledge which informs reflective imaginings about data uses, which in turn inform thoughts and feelings about and evaluations of them. Because participants’ imaginings shape their feelings about data uses, they have an impact on real life. At the same time, real life, in the form of experiential knowledge, also impacts what is imagined. In this way, different types of knowledge exist in ‘dialectical tension’ (Crapanzano, 2004: 15) with each other in reflective imaginings of data uses.
Our research shows that even when people are given information about data uses, their perceptions of these data uses are shaped by their various imaginings about them. Different, better, clearer information about data uses will not necessarily stop the reflective imagining process, because people still imagine in the presence of information. Nor would it be desirable to stop people imagining about data uses, we suggest. This is because imagining is an important component of reflectivity. It aids the reflective process, helping people to identify what they think and feel. This finding builds on scholarship on data literacies in that we identify imagining to play a significant role in the reflective process; a central domain of personal data literacies (Pangrazio and Selwyn, 2019). With data literacy argued to be connected to forms of agency (Kennedy and Moss, 2015) we therefore argue that imagining, plays an agentic role in that it facilitates reflectivity, which in turn facilitates data literacy, paving a path for individual agency. This is a different kind of agency to that seen in the work in Bucher (2017), where peoples’ algorithmic imaginaries are seen as agentic in terms of shaping how algorithms work. Instead, the data imaginings that we discuss in this paper are agentic in that they move people beyond a simple acceptance of data uses, to incorporate an everyday form of ‘critical questioning’ of the data uses shown to them (boyd and Crawford, 2012).
In this paper, we have approached reflection as a process of deliberation, of sorting thoughts, which enables access to thoughts, feelings, beliefs and values (see Bolton and Delderfield, 2018; Malthouse et al., 2014;). How data uses are experienced in everyday life is also reflected – in the sense of being mirrored – in what is ultimately imagined about data. In this way, we see a double reflective process unfolding when people talk about what they think and how they feel about data uses. Reflection happens in the deliberative sense and imagining is an important practice within this process. Reflection also happens in a mirroring sense of the term, with non-expert’s lived experiences and knowledge reflecting themselves in their imaginings. With this we see imaginings, in the context of talking about data uses, as something to be encouraged. We argue that they are an essential component of coming to understand and form views about data. Much as we aimed to find ‘the sweet spot’ in our methodological approach, we need to create spaces for people to engage in imagining as a reflective practice, given the agentic role it can play. We need to attend to imaginings, because of what they tell us about how people reflect on, come to understand and ultimately experience data uses in everyday life.
Footnotes
Acknowledgements
We would like to acknowledge Dr Lauren White at the University of Sheffield for her invaluable help with the coding and analysis of the data used within this paper.
Funding
The author(s) disclosed receipt of the following financial support for the research, authorship, and/or publication of this article: This work was supported by the Nuffield Foundation under grant [number OSP/43959].