
Abstract
This article explores how newsmakers exploit numeric records in order to anticipate the future. As this nascent area of data journalism experiments with predictive analytics, we examine its reports and computer-generated presentations, often infographics and data visualizations, and ask what time frames and topics are covered by these diagrammatic displays. We also interrogate the strategies that are employed in order to modulate the uncertainty involved in calculating for more than one possible outlook. Based on a comprehensive sample of projects, our analysis shows how data journalism seeks accuracy but has to cope with a number of different prospective probabilities and the puzzle of how to address this multiplicity of futures. Despite their predictive ambition, these forecasts are inherently grounded in the past because they are based on archival data. We conclude that this form of quantified premediation limits the range of imaginable future thoughts to one preferred mode, namely extrapolation.
Keywords
The future of data-driven journalism has inspired widespread debate. It addressed its epistemological premises and novel information products, which shape what the future of computational news making will look like (Anderson, 2018; Coddington, 2014; Hermida and Young, 2019). Departing from this burgeoning field of scholarship, we take a different approach and ask: What is the future in data journalism? In other words, how are digital numeric information and algorithmic analyses exploited in order to anticipate, draft, and evaluate what the future will have in store for us?
This general question is motivated by an observation and an ambition. For one, there is the observation that ‘even the front page, presumably replete with news of the most important and up-to-the-minute events, has an orientation to time more varied and more complicated than journalistic values would suggest’, as Schudson (1986: 82) puts it. Its multifaceted temporality points us to the complex ways in which the past, the present, and the future are used, represented, and constructed in news content. This makes clear that venturing into the future is, indeed, not a novel journalistic aspiration but an essential dimension intrinsic to news making. Thus, future temporalities not only feature prominently in weather forecasts, vote projections, and predictions of sports results, but they are part and parcel of the journalistic quest to frame public issues, probe scenarios, and speculate about potential implications.
While some sort of forethought is, therefore, innate to journalism, the increasing importance of aggregate digital information has fueled the enthusiasm for gauging data sets in order to provide more accurate projections. After all, the fundamental shift in the analysis of large troves of digital data is constituted by the ambition to provide predictions. This expectation is behind efforts in such diverse fields as political microtargeting, consumer marketing, and preemptive measures for policing. These forms of data-driven foresight have also inspired anticipations of predictive data journalism. They are powered by the belief, Maycotte (2015) postulates, that ‘by using available data, journalists will be able to orchestrate predictions and write tomorrow’s headlines and stories accordingly’. Computational approaches to reporting and journalistic knowledge creation are thus propelled by the promise of learning more about the future and formulating more precise outlooks. However, these calculated forecasts are often probabilistic in nature and thus outline more than one possible outcome, not all of which materialize (Silver, 2015).
Bringing together this observation and this ambition prompts us to explore the complex temporal orientations found in data-based journalistic reports and the ways they engage with the imperfection of their previsions. By taking a close look at prospective data journalism and its attempts at designing, processing, and communicating forecasts, our article contributes to the study of the anchoring of journalism and its products in differently oriented temporal contexts (Tenenboim-Weinblatt and Neiger, 2018). In fact, despite the vital entanglement of all three tenses, most journalism research is either interested in the mnemonic function of journalism and its commemoration of past events, or it focuses on journalism’s role in tracking the most recent news. Little attention, however, is given to its outlook on the future. This article addresses that gap by conceptualizing and examining the prospective dimension of data journalism as a nascent field of innovation in news making. Practitioners in the field are experimenting with techniques for predictive analytics that are applied to various data sets in order to generate projections (Agrawal et al., 2018).
Journalism’s future outlooks
Temporality plays a cardinal yet surprisingly often neglected role in thinking about what journalism is and what it could be (Zelizer, 2017). It constitutes an elementary aspect of both news production and the news stories generated therein. The existing time-literate scholarship favors one of two temporal orientations: It is either interested in the present or in the past but largely neglects studying how journalism also shapes the future.
By definition, the news is about novelties, emerging stories, and current events. The usual temporal reference, therefore, is the most recent past, which is reported almost in real time. In this engagement with what Rushkoff (2013: 48) calls ‘presentism’, digital and networked media are increasing the temporal exigency for news outlets by treating timeliness as a key news value (Boczkowski, 2010; Klinenberg, 2005; Patterson, 1998). Novelty, immediacy, and liveliness seem to trump the more traditional standards of accuracy and reliability (Reich and Godler, 2014; Scannell, 2014; Usher, 2014).
Besides the contraction of the journalistic view of the present, another line of scholarship stresses journalism’s significance for the commemoration of past events and for constructing the collective retrospection of bygone times (Zelizer and Tenenboim-Weinblatt, 2014). In this regard, journalists are considered memory agents who exert a considerable influence on both the way societies come to terms with the past and the kinds of collective memories that become privileged or sidelined (Lohmeier and Pentzold, 2014). Journalism, in that regard, is full of ‘overt and acknowledged memory content’, as Kitch (2008: 313) attests.
What goes missing in the preoccupation with the present of a 24/7 news cycle or in media memorialization of the past is the fact that journalism also provides forecasts that project what the future might bring. The binary view neglects the vital entanglement of the past, the present, and the future in news reports. The conjunction of all three temporal planes in news narratives seems to go hand in hand with the decline of event-centered reporting and the growing prominence of contextual, meaning-centered news stories (Barnhurst, 2011, 2013; Barnhurst and Mutz, 1997; Fink and Schudson, 2014). In this respect, Neiger and Tenenboim-Weinblatt (2016) have identified five temporal clusters in print and online news items from the United States and Israel, which they associate with different journalistic roles. They analyzed a group of articles that were grounded in the present and included both live happenings and their immediate past and future in order to provide updates about unfolding events. Another cluster was formed by reports of the recent past, while a third cluster reached from the midrange past of the last 48 h to the distant past of more than 10 years ago. These pieces were mostly about contextualization and ritualistic commemoration.
Looking toward the future, Neiger and Tenenboim-Weinblatt (2016) found two further clusters: One that covered the foreseeable future of forthcoming events and expected outcomes, and another one that sought to capture the distant and unknown future. Moreover, the comparison between print and online sources showed that online news tended to focus on the recent past while print news encompassed a broader temporal scale where the future was more prevalent (Tenenboim-Weinblatt and Neiger, 2015).
Beyond this, the literature on ‘media oracles’, as Neiger (2007) calls prospective news stories, analyzes narrative strategies that induce anticipatory suspense (Tenenboim-Weinblatt, 2008), the discursive manipulation of temporality in reports of prescheduled or diary events that are known in advance (Jaworski et al., 2003), the strategies of precontextualization through which journalists introduce and frame upcoming events (Oddo, 2013), and the role of news media as agents of prospective memory that remind their audiences of what needs to be done (Tenenboim-Weinblatt, 2013).
In essence, this body of work stresses the significance of future outlooks in journalistic reports and the intricate interrelation of all three tenses in telling, interpreting, and perpetuating the news. In order to appreciate this interplay, Grusin (2010) emphasizes the capacity of news media for premediation, a strategy that weaves together all three temporal planes: By retelling the past for present purposes, news narratives also provide templates for interpreting, classifying, and evaluating upcoming events and experiences. To this end, premediation presupposes remediation, that is, the capacity of a medium to represent another medium, for instance, by way of transferring content from paper to digital format or by repurposing the style and character of one genre into another media technology (Bolter and Grusin, 1999). Premediation, in this respect, intends to remediate the future before it happens. As such, it forms part of journalism’s general ability to invite us to scrutinize the political and ethical implications of the drafted scenarios by constructing specific social realities. It achieves this through, for instance, election prognoses, social trends in demographics, migration, or mobility, as well as through reporting on issues like climate change, public health, agriculture, and food supply.
Against this background of journalistic future thought, we consider the usage of quantified information and predictive analytics in recent news making and ask: How does the future feature in reports that are generated and circulated by data journalistic projects?
Diagrammatic displays in predictive data journalism
Journalism premediates the future and thus guides our understanding of the things to come. The future-making intervention of journalism is prefigured by the changing material conditions and technologies available to journalistic storytelling. Tenenboim-Weinblatt and Neiger (2018: 37) suggest that we think of such time-related possibilities and constraints as ‘temporal affordances’. The social and material prefigurations shape the values and epistemologies, editorial practices and organizational forms, as well as the tools and devices supporting the generation of news items. Affordances to consider are immediacy, that is, the capacity to report an event shortly after it has happened; liveness, which enables journalists to cover events in real time; preparation time available to put together a news story; transience or fixation of stories after initial publication; and their extended retrievability.
Arguably, the adoption of computational methods and numeric information has reshuffled a number of these temporal affordances since this quantitative turn impacts on the processes and products of the emerging data-based news making (Anderson, 2018; Lewis, 2015; Usher, 2014). Scholars have introduced different concepts to characterize aspects of quantified journalism as a kind of computer-assisted reporting, data journalism, or computational journalism (Coddington, 2014). The temporal affordances of this ‘intersection of journalism and technology’, as Lewis and Usher (2013: 603) call it, are particularly affected by the assumed speed at which digital data can be accumulated and analyzed. In fact, the prominent 3 Vs of ‘big data’ refer to their volume, variety, and velocity. Consequently, portrayals of data journalism stress its ability to produce rapid analyses. However, despite this apparently obvious bend toward immediacy, if not liveness, and rapid preparation time, data journalistic projects often stress the effort and diligence required for the acquisition, examination, and formatting of data: Priority is not given to speed but to careful investigation, which takes time. In effect, we assume that data journalism is not about fast news but is part of a new type of ‘contextual journalism’ (Fink and Schudson, 2014) or ‘interpretative journalism’ (Salgado and Strömbäck, 2012). As such, it supposedly departs from the focus on events and the narrow timeframe around the present and instead allows for higher levels of speculation and more futuristic conjectures.
In terms of the fixation and retrievability of their products, data journalistic projects commonly strive for long-term storage and availability. In a way, they thus mirror another temporal orientation of digital data as they preserve past events and processes. Data journalism is, in this sense, archival by default. This does not mean that it only looks backward; archival records are actually there ‘to annihilate time’, as Daston (2017: 11) observes. Hence, the records exploited in data-driven stories make past resources available for present objectives, such as projections from the past to the present. Because they rely on retrospective data, they cannot provide perfect predictions. Despite improvements in statistical methods, for instance, through agent-based modeling, dynamic system equations, and Bayesian reasoning, computer-generated forecasts must necessarily simplify more or less volatile processes and are thus prone to inaccuracies (Silver, 2015).
Besides these transformations in data journalism’s news culture and its shifting forms of knowledge work, new kinds of data-intensive products generated and communicated in these settings also foster a different sense of what news are. Actually, representations of data-based insights usually take the form of infographics, customizable probability models, or interactive data visualizations. These products ‘carry certain epistemological assumptions’, Lewis and Westlund (2015: 7) argue, ‘about how audiences might acquire knowledge, as users are encouraged to “play” with the data’. In their editing, they cater to particular conceptions of knowledgeable audiences and active engagement (Parasie, 2014; Splendore, 2016; Tabary et al., 2016). Consequently, there are a number of guidelines and hands-on introductions aimed at practitioners in order to teach the ‘visual display of quantitative information’ (Tufte, 1983).
Data journalistic presentations rarely work only through visuals but orchestrate images, texts, and numeric information in meaningfully structured compositions. Since it is difficult to communicate the insights gained from computational analyses in linear news text only, data journalism therefore uses displays that combine statistical charts and maps with images and written narratives (Amit-Danhi and Shifman, 2018). This should allow journalists to more accurately capture the insights gained from an investigation, tell a cogent story, and allow people to engage with the presentation and the underlying data. Hence, Cairo (2013: xvi) declares that ‘every infographic and every visualization has a presentation and an exploration component: they present, but they also facilitate the analysis of what they show, to different degrees’.
These versatile forms of expression are altogether diagrammatic in character and range from presenting numeric evidence via graphical data visualizations to semiotically complex, data-rich narratives (Mitchell, 1981). Their grammar encompasses visual and verbal elements that form multimodal accounts whose graphical relations are organized into spatial, not linear, coherence. Often accompanied and explained by verbal news text, they come to serve epistemological functions as they are not only there to be looked at, but to be used for exploring, generating, and communicating knowledge (Drucker, 2014).
This does not mean that aesthetic sensibilities do not matter, but merely emphasizes that design features are primarily assessed in terms of their utility and practicality for conveying news information. However, even though they are judged according to criteria of accessibility and intelligibility, the interpretation of diagrammatic compounds, which potentially contain different chart types, images, captions, units, scales, fonts, colors, and layouts, can require a number of skills. As such, diagrams as graphical, multimodal devices of future-oriented knowledge work implicate assumptions about the knowledgeability, numeracy, and responsiveness of publics. As Kennedy et al. (2016) have shown, the underlying optimistic yet flawed belief that visualizations foster data transparency and awareness is shared among data practitioners. Thus, although many visualization designers acknowledge that design conventions involve a number of critical restrictions, they nevertheless hold on to the idea that they can achieve some kind of accuracy in the representation of data and data-driven insights.
To summarize these considerations: In order to explore the future-making capacity of data journalism, we are studying the forms of presentation, temporal frames, and topics that are prevalent in its prognoses. We expect to find a variety of diagrammatic displays. Since practitioners experiment with sensible types of visualization and infographics, we assume that they employ, adapt, and combine different visual and textual elements. We furthermore presume that predictive, data-based journalism develops most of its reports around themes rather than events. As a result, it deals predominantly with historical trends, trajectories, and the formation of issues. With its focus on future developments, it should contrast with news that focus on events and thus report incidents in the past, ongoing happenings in the present, or scheduled occasions in the future (Kepplinger, 2002). Moreover, we expect to find that prospective data journalism is particularly interested in public affairs (Tenenboim-Weinblatt and Neiger, 2015). It thus furnishes decision-makers in politics, international affairs, or commerce with data-driven propositions for required actions (Barnhurst, 2013; Barnhurst and Mutz, 1997). As Dunmire (2005) has explained, references to the future can serve a rhetorical function of legitimizing actions in the present or the proximate future. That way, projections of what will happen substantiate claims about actions that must happen now in order to prevent or facilitate things to come (Tenenboim-Weinblatt, 2013).
Finally, we assume that the temporal spectrum of future-oriented data journalism mainly ranges from the conceivable future of the next 10 years up to the unknown future. On this far-reaching timescale, the potential of data-driven analyses should become especially evident, while the proximate and medium-term future can also be covered by more traditional journalistic means likes interviews, polls, or surveys (Neiger, 2007).
Sample and method
Most studies of data journalism either analyze single cases, usually a pioneering newspaper or an innovative editorial venture, or they make use of a limited collection of benchmarking products, like the nominees of data journalism awards (Loosen, 2018). In order to generate a more comprehensive sample that captures the area of predictive data journalism, we compiled an extensive list of four different types of sources. It included directories of data journalism projects, award schemes, websites, and blogs monitoring data journalism projects, as well as dedicated press sections online. This yielded 70 different legacy news outlets and recently established endeavors in total, including the blogs The Functional Art and Flowing Data, Nate Silver’s FiveThirtyEight and The Pudding data journalism and data visualization websites, as well as the dedicated sections of the Guardian, the New York Times, or the German magazine and online news site Der Spiegel. In addition, we followed references to projects in academic papers. These were downloaded and stored using the free Firefox extension SavePageWE.
We determined whether the dominant temporal orientation of a piece was geared toward the future based on the headline and sub-headline. As indicators, we used grammatical markers of the future tense, that is, verbs, prepositions, temporal adjectives, or adverbs, but also considered the general temporal direction (references to developments or events still to happen), which must not necessarily be conveyed by a grammatical tense (Hansen, 2016; Simmerling and Janich, 2016). From the total number of available cases (n = 2644), we selected only those with a recognizable projective outlook, which represented about 5.6% of the full sample (n = 150). This ratio is considerably lower than the ratio in traditional journalistic news that does not specifically use computational methods. So in their analysis of US and Israeli newspapers, Tenenboim-Weinblatt and Neiger (2015) found that 43.4% of print stories and 25.5% of online pieces had a dominant future orientation. Hence, despite the appeal of predictive analytics as a key form of exploiting digital data, data journalism that employs such computational previsions is, for the time being, a nascent area of journalistic news making that is mainly advanced by American and European outlets.
Four exemplary projects showcase the range of topic areas and temporal frames in predictive data journalism: On March 23, 2018, the Boston Globe featured an opinion piece titled ‘Seven Steps. 27,000 Lives’, which discussed the 2016 statistics on people dying from gunshot wounds in the United States. Comparing the uneven gun death rate across states and the reasons why people were killed, the Globe’s editorial board declared that ‘none of them had to die’. In order to make lives safer, they advocated for seven ‘common-sense’ laws consistent with the Second Amendment and also listed contact details of political leaders from each state. A second example was published in the run-up to the 2018 US midterm elections by FiveThirtyEight. It charted an updated estimate of the congressional generic ballot based on a calculated average of polls from different pollsters, beginning in May 2017. In the interactive timeline, readers could follow the past trajectory of estimated outcomes up to Election Day and discern similarities in the polling results. In a third example, Der Spiegel prepared a data map of Germany’s 402 administrative districts and federal cities. It visualized the proportion of births, deaths, and relocations. Readers were able to see ‘Where Germany Dies Out’, which was the title of the story. Finally, The Pudding released a report about ‘the past, present, and future of captive whales and dolphins according to data and pop culture’. It drafted scenarios for when the entire cetacean population in captivity would be extinct (Figure 1).
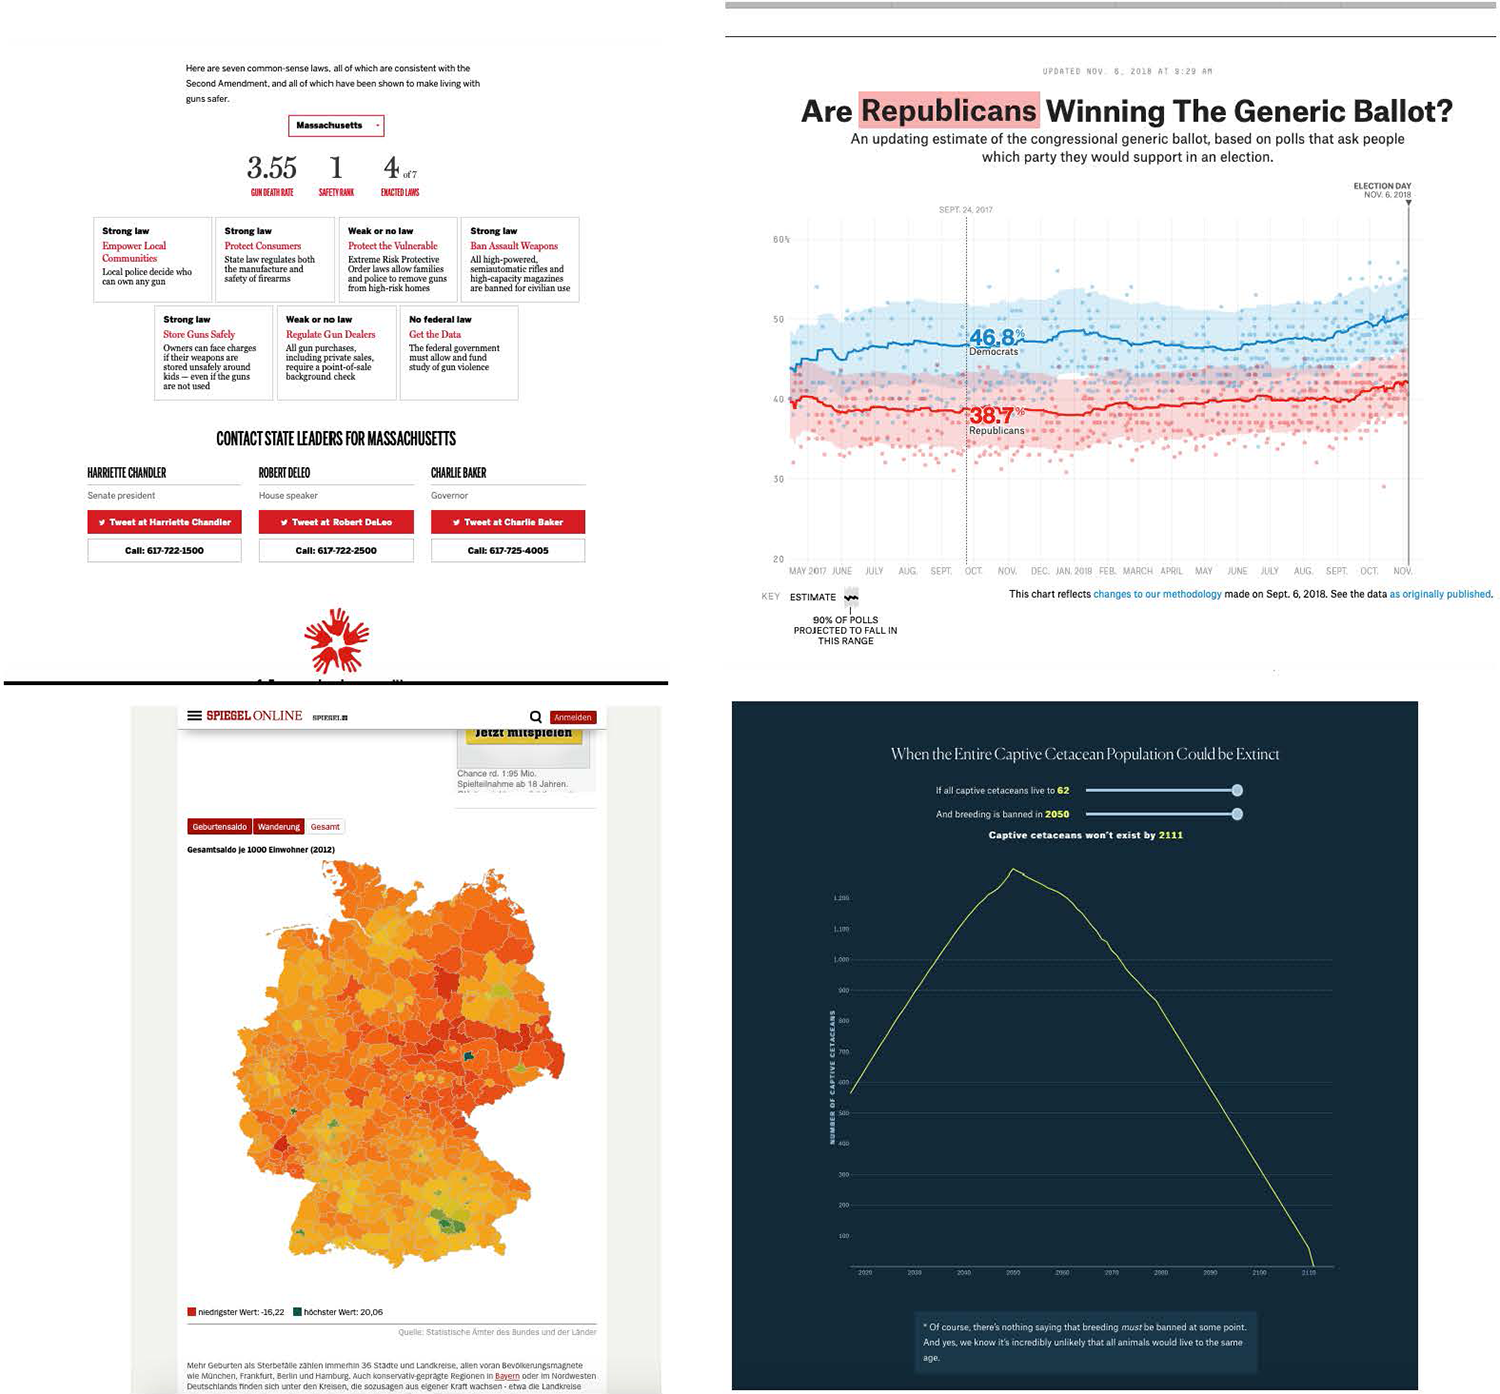
Examples of predictive data journalism. Sources (from top left to bottom right): apps.bostonglobe.com; projects.fivethirtyeight.com; spiegel.de; and pudding.cool.
First, we examined which forms of diagrammatic displays were generated and circulated in data-based journalism in order to explain and show future outlooks. To this end, we looked, on the one hand, at the method of coverage (Lewis and Westlund, 2015). We studied the multimodal, verbal and visual, representations used to depict data-based insights. These included different sorts of data visualizations and infographics. Following Tufte’s (1983) overview, we identified statistical graphs that delineated quantitative information, cartographic data maps, time series that located data in a temporal context, and relational graphics where different sorts of information were compared in order to convey differences and similarities between data sets.
Second, we registered temporal references to the past, the present, and the future. While we only sampled for products with a dominant future orientation, prior research has suggested that there are often multiple temporal layers within a single news story (Barnhurst, 2011, 2013). In order to further distinguish between different forthcoming periods, we used Neiger and Tenenboim-Weinblatt’s (2016) categorization of five layers pertaining to the future: the immediate future of the next hours, the near future of the coming 48 h, the midrange future that reaches from the next 48 h to the next 6 months, the foreseeable future of the coming 6 months up to 10 years, and the distant or unknown and conjectured future after more than 10 years.
Third, we coded for journalistic areas, placing news items in topical categories such a sports, politics, or family and parenting. We additionally included variables for event-centeredness or issue-centeredness. According to this binary category of content orientation, a story could either have a predominant focus on significant events or it could concentrate on ‘continuous states of affairs that might change their character but have no observable beginning or end’ (Kepplinger, 2002: 975). These can be current issues, historical trends, or upcoming dynamics, discussion of which might be triggered by a concrete incident. We also grouped stories into those that touched upon public affairs and those that did not. In our definition, a public affairs focus was present in pieces about politics, government, economics, or international affairs (Boczkowski et al., 2011).
Fourth, we considered the level of speculation. This follows Neiger (2007), who found that news stories modulated the degree of epistemic certainty in relation to the scope of time covered and the evidence of claims. We coded for the existence or absence of textual and graphical indicators of articulated uncertainty that were used to indicate or further discuss the likelihood of outcomes. These could take the form of subjunctive clauses, adverbs, or adjectives like ‘doubtful’, ‘probable’, and ‘likely’ in order to qualify the facticity and potentiality of a forthcoming development or occurrence (Jaworski et al., 2003). As data-based journalism rests on calculations and statistical models of possible outcomes, their likelihood was also often expressed through numeric probabilities. This probabilistic uncertainty differs from the broad notion of epistemic uncertainty because its statistical distribution can be estimated, whereas a more fundamental skepticism toward future outlooks arises from the precarious validity of prospective truth claims per se (Peters and Dunwoody, 2016). Unlike calculable risks, however, probabilistic uncertainty cannot be fully assessed; it is a ‘risk that is hard to measure’, as Nate Silver (2015) has argued. The reasons for this can stem from uncertainties about the initial conditions of a situation and uncertainties about projected scenarios, as well as from structural uncertainties inherent to the simplified models of how people behave and things develop.
In the diagrammatic displays, we looked for verbal indicators as well as numeric information of fractions, percentages, or frequencies that were employed to specify the potential of one or more possible realities to come. We noted the use of graphical tools that were employed to assess different levels of speculation (Cairo, 2016; Spiegelhalter et al., 2011). In this respect, we coded for the use of scalar devices like box plot variations, which provide information about medians, range values, quartiles, and uncertainty intervals. We also looked for graphical tools that could plot bivariate and multivariate data distributions such as scatter plots, fan charts, tree diagrams, and icon arrays (Bonneau et al., 2014; Zuk, 2008). We further considered visual modulations using points/particles (color, dispersion, and size), line/contour (blurring, extension, gradient, and continuity), and surface (shape, hue, and color saturation). These textual and visual elements were not mutually exclusive but could be combined.
To capture all these aspects, we combined a standardized content analysis with a more inductive conceptualization that followed the coding methodology offered by Grounded Theory. The scheme was tested by two coders working with a randomized selection of 10% of the material. We used Krippendorff’s alpha coefficient to measure intercoder reliability, which was between 0.79 (indicators of probability) and 1.0 (forms of presentation, temporal references, journalistic areas, and content orientation).
Findings
We first looked at the kinds of diagrammatic displays used to communicate the previsions offered by data journalism. As expected, virtually all of the 150 news stories included in our sample used infographics or other kinds of data visualization (n = 258, M = 6.14, SD = 22.55). Only one piece was entirely text-based and did not contain any illustrations. The almost inextricable link between visual and textual elements affirms the emphasis that practitioners place on the diagrammatic presentation of information. This not only serves an illustrative function but also constitutes a core aspect of journalistic sensemaking through data (Kennedy et al., 2016; Tabary et al., 2016).
Regarding the multimodal orchestration of the 149 pieces, we found an almost equal distribution of examples that had a balanced ratio between text and diagrammatic parts (n = 53), items that mostly consisted of text (n = 49), and pieces that mainly contained diagrams (n = 48). Many were created as interactive visualizations where elements changed through user actions (n = 102). Describing the sample in more detail, we found a number of statistical graphs that depicted numeric information in the form of bar charts (n = 38) or pie charts (n = 5). Unsurprisingly, given that all cases featured a temporal dimension, nearly half of them contained either area diagrams (n = 13) or line charts (n = 53) that delineated time series data. Almost the same number of cases deployed data maps (n = 60). Yet the most widely used form of data visualization were custom-made interactive infographics, which often responded to mouse rollover or entered strings (n = 89). Their original design corresponded to the topic of the news story and provided a graphical representation of what the data were meant to tell. For instance, Brazilian designers and programmers teamed up with the Google News Initiative for the project ‘In search for the candidate’. It adapted a number of visual means in order to explore Google search results before the 2018 Brazilian elections.
Second, due to the research design, all cases had a future focus based on the selection criteria we used. Yet despite their future-oriented titles, which directed the sampling, almost 1/5 showed variation in the prime temporal orientation of their subsequent display. Thus, 25 stories had a focus on the present, and 14 stories had a focus on the past. This, however, is not to say that any of these pieces only looked in one temporal direction. Given their character as premeditations, they made use of all three tenses for analysis and interpretation (Grusin, 2010).
We further distinguished between different layers of future outlook. Somewhat in line with our assumption that the data-based predictive potential is especially used for long-term projections, one principal temporal direction was the far and unknown future. The futuristic reports in this category (n = 58) concerned occurrences and developments that were expected to happen either in more than 10 years, in an even more remote future, or within a timeframe that was difficult to predict at all. In these pieces, data were, for instance, employed to speculate on the coming substitution of the human workforce by robots, like in The Pudding story ‘Why the Republication Party Wins When Robots Take Your Job’. Another piece, ‘Losing Ground’, published jointly by the New Orleans-based public interest newsroom The Lens and the ProPublica nonprofit newsroom, projected the inundation of areas in Louisiana over the next 50 years. Even more prevalent than these long-term prospects were predictions that referred to the midrange future, understood as the period between 48 h and 6 months after the publication of the story (n = 66). For example, FiveThirtyEight provided up-to-date forecasts for all National Basketball Association (NBA) teams after every game during the 2018/2019 season. This echoes Neiger and Tenenboim-Weinblatt’s (2016) finding that the midrange future also the most prevalent future layer in print and online news. The scenarios for the next 10 years made up 22 of the cases, whereas the immediate future of the next few hours (n = 3), as well as the near future of the 48 h after the next hours (n = 1), were not covered very much.
Third, the most reported themes in predictive data journalism projects were in politics (n = 65), sports (n = 27), the environment and nature (n = 16), societal issues (n = 12), or the economy (n = 10), while the remaining 57 stories covered a broad range of topics from health and eating, work, and leisure, to technology, culture, and science. The five focal points might indicate a deliberate editorial choice, but they can also be determined by the availability of useful data so that only data-rich topics were covered.
A slight majority of the items addressed issues rather than events (n = 86), although the ratio was not very pronounced and we also found a considerable portion of event-centered pieces (n = 64). Contrary to our assumption, just about one in five projects dealt with public affairs (n = 31). Thus, only some pieces combined their projections with exhortations of provisions necessary for evading or achieving certain consequences. Accordingly, the main temporal orientation of these stories was toward the midrange and distant future with sparse references to more proximate time spans (χ 2 = 34.297; df = 4; p < 0.001).
In line with this insight, we found that the future-oriented temporal layer of the predictions depended on the main topic of the article (χ 2 = 171.336; df = 64; p < 0.001). From the 65 stories whose thematic focus was on politics, more than half dealt primarily with the midrange future, (n = 36) while a significant number made forecasts about the next 10 years (n = 12) or the far and unknown future (n = 15). Of the 12 (or 16, respectively) news pieces that concerned societal or environmental issues, the lion’s share again looked to the far and unknown future (n society = 11; n environment = 10). Most of the 27 sports forecasts were, in contrast, occupied with the midrange future, usually in connection with scheduled events like matches, tournaments, or championships (n = 22).
The relationship between the topical focus on politics, societal issues, or the environment seems to support the presumed propinquity between projective data-driven journalism and the issue-centered news making of contextual journalism (Barnhurst, 2011; Barnhurst and Mutz, 1997; Fink and Schudson, 2014). However, there was no significant correlation between issue-centered stories and temporal scope. This runs counter to our assumption that data-based narratives around specific themes span larger timeframes and project into the more distant future. The temporal references did not provide us with clear evidence that data-driven storytelling seeks to advance more far-reaching projections of how issues will evolve in the long run.
Finally, speculations about the appropriateness and realization of projected outcomes were offered in almost 2/5 of the cases. In total, 60 news stories addressed the uncertainty of their accounts. This uncertainty was most frequently only reported in diagrammatic format (n = 29). A mention of uncertainty only in the text was less frequent (n = 12), or in some cases addressed in both text and diagrams (n = 19; χ 2 = 15.406, df = 1; p < 0.001; Fisher’s Exact test – two-sided: p < 0.001, one-sided: p < 0.001). When the plausibility of possible outcomes was discussed in the text part (n = 31), it was mostly indicated but rarely explained in depth or connected to underlying formulas (n mentioned = 17; n explained = 14). Prediction and speculation usually occurred by means of modal verbs and subjunctive clauses (n = 18) or a combination of verbal modifiers and numeric information in the form of fractions, natural frequencies, or percentages (n = 10). Only three pieces contained entirely numeric information. In turn, when speculations were presented diagrammatically (n = 48), almost all pieces stated probabilistic uncertainties (n = 45), while only few made use of verbal declarations. In terms of the graphical devices available for plotting statistical uncertainty, we found that only a fraction of the items used scalar tools (n = 1) or means for showing bivariate and multivariate data distributions (n = 9). A greater share of infographics and data visualizations explored less standardized resources in order to communicate a sense of uncertainty, at times backed up with some statistical information. They made use of visual modulations through points/particles (n = 4), line/contour (n = 12), and surface (n = 8).
We found that the main topic of a piece had an impact on the mention of probabilities (χ 2 = 44.816; df = 16; p < 0.001): 20 of 27 sports forecasts reported probabilities in their visuals, while only 18 of 65 projections in politics did so, and even fewer or no articles about society (n = 1), environmental issues (n = 3), or the economy (n = 0) provided information about the likelihood of their presumptions. We did not find similar correlations for the text parts; the graphical elements used to depict probabilities did not have a significant impact, too. However, we discovered that whether or not probabilities were indicated depended on the temporal horizon of the specific future explored in the article (χ 2 = 31.522, df = 4, p < 0.001). Probabilities were rarely offered in pieces that touched upon issues or events in the immediate or the near future. Instead, potentiality and uncertainty became a matter of interest in more long-term futuristic prospects. So probabilities were most likely to be disclosed in the written or the graphical parts of stories if the scenario was expected to occur in the midrange future (n = 40) or the far-away future (n = 13).
Modulating prospective probabilities
Arguably, data-driven scenarios risk jeopardizing journalism’s credibility and authority because these calculated forecasts are grounded in prognoses whose future realization is only more or less probable, but not certain. In fact, even the ambition of gauging the potential of large collections of digital data and predictive analytics does not lead to more precise knowledge of the future but often to a multiplicity of more or less likely futures. Thus, statistically calculated probabilistic uncertainty does not supplant but rather supplement the fundamental epistemic uncertainty inherent in futuristic news making.
This is not necessarily a problem. Biased forecasts might constitute added value for customers (Silver, 2015), speculation can be used to generate suspense (Tenenboim-Weinblatt, 2013), and uncertainty about the future may even have a greater news value than certainty, meaning that upcoming but uncertain events or developments attract more attention than definite facts (Jaworski et al., 2003). Science communication research has shown that journalists do not necessarily sacrifice uncertainties for factoid stories and flawed accuracy. They can use visual and verbal strategies to communicate the quality of the research results underlying their reports, mention dissenting views, point to limitations in a study, or question the expertise and motives of researchers (Peters and Dunwoody, 2016; Ruhrmann et al., 2015). By contrast, a probabilistic outcome is rendered more certain when only a single source is mentioned, caveats are ignored, and findings (rather than the analytical procedures underlying them) are presented (Binder et al., 2016; Stocking and Holstein, 2009).
Of the data journalistic projects we studied, 2/5 used verbal or visual means to address the level of speculation and estimation entailed in their projections. These stories thus implemented Cairo’s (2016: 312) request that data journalism should not ‘convey an unjustified feeling of strict accuracy’. Yet these pieces did not form a uniform collection but instead could the grouped into different patterns or ‘modes of uncertainty’, to borrow Samimian-Darash and Rabinow’s (2015: 7) notion. This concept expresses the contemporary experience of uncertainties that cannot be overcome by more knowledge. Instead, these uncertainties are actually the result of our capacity to know more about their plausibility, often through statistical approximation (Beck, 2009). The challenge, then, is not to obviate or resolve these kinds of uncertainties but to find ways of engaging with the provisional nature and fallibility of previsions.
While predictive data journalism aspires to accuracy, its more or less sophisticated computational methods nevertheless yield multiple futures. For instance, correlative patterns identify emergent developments whose configuration depends on different properties and is more or less likely to materialize. To counter this tendency, the projects deployed a number of strategies for modulating the uncertainty involved in calculating for more than one version of the future. These modulations use diagrammatical and verbal means to qualify and assess the certitude of predictions. They communicate graduated accounts ranging from ostentatious confidence to blue-sky speculation.
In our analysis of the 150 sampled news stories, four strategies to address the uncertainty of predictions and to modulate prospective probabilities emerged. We suggest distinguishing between the following communicative strategies: insinuating contingency, indicating estimated divergence, explaining probabilities, and featuring multiplicity. Usually, these four strategies combined visual and textual elements. Almost half of them were expressed in diagrammatic displays, and another third extended across the graphical and the textual parts of a story. It proved difficult to clearly associate a topic or a temporal layer with one of the strategies. Rather, they crosscut through areas of coverage; at times, an item could even use more than one strategy, especially when a number of diagrammatic displays were presented or the textual and graphical parts adopted divergent modes.
Insinuating contingency
In news stories using the first strategy, we found no concrete clues that would help readers to estimate the probabilistic uncertainty of the forecasts. These stories lacked numeric information and verifiable data about the measurable certainty of their outlooks. When they contained data-driven projections in written or graphical form, they were restricted to the past without charting trends. Hence, the future dimension was only implicated in the text of the news story. These texts used conjunctive constructions, modal verbs, and future tenses to qualify the certitude of prospects. They offered a restrained version of the projected future. In the case of the Boston Globe’s ‘Seven Steps. 27,000 Lives’, for example, the icon arrays only showed the gun death rates in 2016, yet the opinion piece demanded further actions because ‘saving lives is a choice’. As such, a changeable future was conceived in the narratives around the data analyses. The analyses themselves, however, remained in the past. This strategy was particularly evident in projects that dealt with public affairs. Their argument often rested on future implications that assumedly had to be tackled despite the absence of calculated projections. The strategy was used in 46 of the pieces we studied.
Indicating estimated divergence
The second strategy used in news stories was to rely on simplified modifications of standard plots and parameters in order to visualize statistical uncertainty and rank the likelihood of the exhibited outlooks. They labelled the estimated divergence among probable accounts by hinting at, for example, the range between smallest and largest value, the interquartile range, or the skewness and dispersion in the calculated scenarios. While such information about the distribution of results was commonly featured in the graphs, it was hardly explained or scrutinized in the accompanying news text. For example, along the timeline used in the abovementioned FiveThirtyEight project ‘Are Democrats/Republicans Winning the Generic Ballot’, a light blue and a light red bar around the blue or red line displayed the range within which the calculated average of 90.0% of polls were projected to fall. Thus, the given values reduced the complex interplay of factors and assessments undergirding the production of forecasts to few or even one single indicator. Often, their utility to the readers was further curtailed by graphical adaptation: In the attempt to provide simple and easily accessible diagrammatic designs, cues intended to facilitate a proper understanding of the visual information got lost. In the trade-off between statistical exactitude and aesthetic appeal, the explanatory value of the visualization was diminished. This strategy has been deployed in eight of the sampled news stories.
Explaining probabilities
While the first and the second strategy offered only few insights into the reliability of their stories, the third provided more detailed discussions of the data and data analytics used to generate prospects. This strategy sought to make transparent the underlying considerations and statistical specifications that shaped the analysis offered in a news piece. It also involved the use of notes on the limits of models and the probable fit between the data and the reality to be explained. In the ‘Where Germany Dies Out’ story, for instance, the demographic parameters and computations underlying the colored data map were explained. Usually, these explanations formed part of the news text associated with the diagrammatic displays. At times, they were also embedded into the graphical elements or added in fine print. These annexes and side notes elaborated on the background of predictions, forming a facultative option. We found this strategy in 47 of the stories.
Featuring multiplicity
In this fourth strategy, the multiplicity of projected futures became a feature to be explored. Usually, news stories using this strategy employed interactive diagrams and visual resources to invite readers to play with a menu of settings that generated different forecasts. Hence, uncertainty was not treated as a constraint but as a flexible condition allowing an assessment of how different choices would lead to different outcomes. Sometimes the dynamic trajectories also included explanations of the statistical operations and data under scrutiny. For example, The Pudding’s ‘Free Willy and Flipper by the Numbers’ used information about the number of orcas in human care and their minimum as well as maximum life expectancy. Readers could try out different scenarios up to the year 2110, at which point the entire captive cetacean population could become extinct. Only five stories took advantage of such an in-depth and responsive approach toward the variety and volatility of their presumptions.
Taken together, the four strategies of modulating prospective probabilities probe ways to make sense of uncertain futures. They reflect different approaches to communicating the likelihood of multiple potential outlooks that are intelligible to readers and that allow them to estimate the given varieties. As previous research in science communication has shown, tweaks in uncertainty representations respond to different conceptions of audiences and their ability to perceive expressions of uncertainty. A lack of explanatory detail was found to support misinterpretations (Broad et al., 2007; Dieckmann et al., 2015). Nonscientists seem to be better able to grasp probabilistic uncertainty expressed through natural frequencies and verbal higher/lower statements than through quantitative information. Yet contrary to the assumption that lay people generally lack statistical reasoning skills, others have stressed the prevalence of a cursory understanding of probabilities, depending on the story matter. This could be useful, for example, when reading weather forecast (Gigerenzer, 2015; Joselyn and Savelli, 2010).
Conclusion
Anticipating what comes next is an essential part of the contemporary news bulletin, and data journalism promises to contribute to its future relevance. Certainly, attempts to scrutinize large swaths of data for cues in order to predict the future are part of a larger quest to make the future increasingly foreseeable and manageable. In this respect, predictive data journalism has evolved as an area of reflection and projection that not only predicts likely outcomes but that is instrumental in helping to create those outcomes: It projects and at same time contributes to realizing visions of the future (Huxford, 2002). As such, data journalism can offer what Currie (2016: 100) has called a ‘sophisticated expectation’ that has the capacity to actuate how the future will be configured. With its temporal assumptions, it structures and shapes public understanding of what the future might bring. As such, it informs political reactions and helps to bring about the future that it has already anticipated.
However, as of now, predictive data journalism often falls short of this expectation. Thus, one of the most poignant findings in our study was the humble amount of news pieces that actually focused on making predictions. Future-oriented, data-driven news making is, therefore, a nascent field whose potential remains, for the time being, not fully developed. While the majority of the stories we sampled gave their attention to issues, not events, and discussed topics in politics, the environment, societal affairs, or the economy, only a fraction of them bore on public affairs and thus had a recognizable concern for organizing a particular kind of future. A focus on public affairs did not correlate with a specific temporal layer. Regarding the temporal layers of the outlooks, attention was split between either the distant or the proximate future, but both orientations were not definitively associated with a recognizable issue orientation.
In sum, the projective news stories we studied were marked by a mode of quantified premeditation. This mode was evidenced in all three temporal planes and was used to produce an analysis and render it meaningful and relevant to readers. Hence, the past and the present were scanned for a particular kind of information that was numeric in character. It allowed for more or less sophisticated predictive analytics and could be presented in diagrammatic displays. Certainly, all future thought resorts to available references and contexts from which forthcoming dynamics are inferred. That is, ‘the prognosis implies a diagnosis which introduces the past into the future’, as Koselleck (2004: 22) maintains. Yet in the projects we studied, the broad spectrum of potential ways to convey upcoming times was commonly reduced to the rational forecast of a more knowable future, within calculable margins of error (Heller, 1999). While many stories were aware of the limitations of their accounts, only a small number of them explicitly embraced the heuristic and nondeterministic nature of their previsions. Instead, the majority of quantified premediations adopted some kind of extrapolation. In Urry’s (2016: 96) definition, extrapolation assumes a status of ‘business as usual’ and sees some features in the past and present ‘as the key mechanisms in how people’s lives will predictably unfold in the future’.
The problem with such broad form of extrapolation is that predictive data journalism emerges at a point of insecurity when political institutions seem to be acting erratically, scientific authority is undermined, and uncertainties are mobilized in power plays (Ananny, 2018; Oreskes and Conway, 2011). In the age of reflexive modernization, the future seems increasingly unreceptive to attempts at establishing proof and compensation by scientific or political means (Beck et al., 1996). Therefore, while forward-looking planning and evaluation are increasingly important, what is risky appears less and less calculable or predictable based on an assumed persistence of past regularity; latent impacts are unbound.
It remains an open question whether data journalism can be of assistance in clearing out these complex insecurities and out-of-sample events. Indeed, the news stories employed four strategies to modulate the inevitable uncertainty of predictions: insinuating contingency, indicating estimated divergence, explaining probabilities, and featuring multiplicity. Still, their conjectures had been derived from historical data. They were thus necessarily conservative since they assumed some sort of conformity, stability, and long-term path dependency; they tended to reproduce known trends into what is an inherently unknowable and volatile emergence.
Therefore, these data-based news predictions are ‘programmed visions’, as Chun (2011: 9) says, that extract the future from the past. Clearly there are more advanced methods of calculation than status quo extrapolation, most notably those using a Bayesian approach to prediction. This approach weights contextual information and seeks to estimate the influence of different factors on the likelihood of an occurrence. However, this also has an interpretative base and relies on fallible assumptions about how seemingly foreseeable developments match against existing patterns and time series. Uncertainty remains, Silver (2015: 20) admits, ‘an irreducible part of the problem we are trying to solve’.
What is required then besides improved quantified analyses and significant data is a form of predictive data journalism that prevents the future from disappearing as a site of potentiality and possibility, as Nowotny (1994) warns. While data-based predictions can help render the future more realistic, this might backfire when it compromises our ability to imagine and realize other futures. Instead, journalism can contribute to keeping the future open by combining predictive calculations with other forms of what Urry (2016: 87) describes as ‘methods for making futures’. They allow us to see crucial but perhaps uncountable changes in the feature space that can disrupt linear extrapolation. As such, he lists complementary practices like learning from past visions, studying failed futures, developing dystopian thought, appreciating utopias, and drafting scenarios. Other methods would be at hand, too, like backcasting from a desired future in order to identify tasks required for achieving it. Analyzing methods in news making that conjoin such forms of future thought will arguably not only allow for more cogent forecasts. It can help lay the groundwork for the future of data journalism as an indispensable source of reflection and transformation in unsettled times.
Footnotes
Authors’ Note
Christian Pentzold is also affiliated with Chemnitz University of Technology, Germany.
Funding
The author(s) disclosed receipt of the following financial support for the research, authorship, and/or publication of this article: The project has received funds from the Alexander von Humboldt Foundation and the Central Research Development Fund, University of Bremen.