
Abstract
The availability of big data from popular search engines in real-time enables policymakers and market participants worldwide to explore global reactions to major events. Australia consistently ranks high on visitors’ considerations and has significant investment in digital tourism campaigns, such as the multichannel Come and Say G’day campaign through digital and content marketing initiatives around the globe. This paper examines the dynamic relationship between Google query search volumes related to travel and tourism demand outcomes using subnational quarterly data for Australian states. Employing a panel vector auto-regression (PVAR) method, we show that a positive shock to the Internet search intensity in travel themes explains over 50% of the variations in visitor nights. This effect is persistent over several quarters after the shock. Our ‘back of the envelope’ calculation suggests that a 10% increase in the Internet search intensity index leads to an increase in tourism GDP by $1.4 million.
Introduction
The tourism industry contributes to a significant part of the Australia’s economy. Just before the onset of the COVID-19 pandemic, the tourism sector contributed to about 3.1% of GDP, supporting around 674,400 jobs. The COVID-19 disruption slashed the GDP contribution by half and shed an estimated 167,400 jobs following the stringent travel restrictions that led to a decline of international visitors by 97% and domestic visitors by 30% between 2019 and 2021 (OECD, 2022). Given the importance of the tourism industry to the Australian economy and the need for diversification of the sector (see Solarin et al., 2024), effective strategies for destination-specific marketing and accurate forecasting of tourism demand are crucial to inform policy.
With the availability of technology and broadband Internet around the world, popular Internet search engines have become instrumental in travel planning and destination marketing. For example, about 86% of American online travel planners use Internet search engines for travel information and planning (Fesenmaier et al., 2011). Worldwide travel search query volumes (SQV) provide key information and unique perspectives about people’s interests in a particular theme over space and time. As a result, the use of big data for predicting tourism demand and informing policies for effective planning and destination management has grown in momentum in recent years (e.g., Bangwayo-Skeete and Skeete, 2015; Bi et al., 2022; Duncan et al., 2023; Höpken et al., 2021; Siliverstovs and Wochner, 2018). The findings in most existing studies on the predictive power of big data provide evidence that search engine data has predictive information about actual tourism demand (e.g., Bangwayo-Skeete and Skeete, 2015; Havranek and Zeynalov, 2021).
Australia offers a unique opportunity to study the impact of digital campaigns on subsequent tourism flows given the country’s significant amount of investment in these campaigns to promote its tourism industry globally. In October 2022, Tourism Australia officially launched a global campaign Come and Say G’day with Ruby, a souvenir kangaroo as a brand ambassador inviting the global community to visit Australia and say G’day. 1 As a major visitor economy, Australia emphasises the need for a speedy recovery of visitor numbers in the post-pandemic era (Duncan et al., 2023). As such, international digital presence is key for destination marketing to attract visitors to Australia’s iconic destinations, such as its world-class beaches, stunning scenery and the world’s largest coral reef system.
While this makes Australia an ideal candidate for the study of tourism performance using big data, little is known about how tourism demand in Australian jurisdictions responds to such digital campaigns. The use of subnational data from Australian states and territories provides an advantage of gaining destination-specific insights for effective and tailored policy interventions. Subnational disaggregation allows for the effective evaluations of the effects of regional factors, such as natural endowments of scenic features, cultural heritages and tourist infrastructure, and how these can influence the behaviours of tourist preferences within the same country (Massidda and Etzo, 2012).
Accurate real-time forecasting of tourism demand is essential to develop effective policy responses and marketing strategies in the tourism industry. Traditional time series forecasting models rely heavily on low-frequency historical data that may not capture real-time changes in consumer behaviour in the presence of digital marketing (Wu et al., 2024). While big data from search engines including Google Trends offers a promising alternative, its use in tourism studies in Australia remains underutilised. Methodologically, the existing literature relies heavily on time series methods and machine learning techniques with little attention given to causal dynamic modelling approaches such as PVAR, limiting our understanding of the dynamic feedback mechanisms and time-lagged effects of search behaviour on tourism demand (e.g., Dergiades et al., 2018; Havranek and Zeynalov, 2021; Höpken et al., 2021; Law et al., 2019; Padhi and Pati, 2017; Wu et al. 2024).
Despite the rapid popularity of big data in recent years, there remains a gap in the tourism literature. First, there is a lack of empirical evidence linking digital search behaviour to actual tourism demand and evaluating the dynamic impact of grand digital campaigns like ‘Come and Say G'day’, leading to an inadequate understanding of the effectiveness of such strategies in the Australian context. Second, the use of high-frequency and real-time big data, such as Google Trends, remains underexplored in tourism demand research for destination-specific insights critical for localised campaign and marketing strategies, especially for Australian jurisdictions. Accurate and timely demand forecasting using real-time data can help policymakers and market participants to effectively plan resource allocation in a way that enhances visitor experiences and supports the sustainable growth of the tourism industry. Put succinctly, we ask the following simple questions: (1) how does tourism demand respond to shocks in Internet search intensity? (2) is the effect persistent? (3) does the effect vary by type of visitor?
Using quarterly subnational data for the period from 2005Q1 to 2021Q4 and employing PVAR method, we find that an increase in Internet search intensity related to travel leads to a significant increase in tourism demand. Specifically, the variations in Internet search intensity account for over 35% of the variations in inbound visitor arrivals and over 50% of the variations in overnight stays. The estimates are robust to a battery of sensitivity tests. The results show that the effect is persistent over several quarters after the shock and the influence of travel-related search query intensity on visitor nights is significantly stronger for international visitors than for domestic visitors across Australian states. The evidence presented is crucial to inform policy and develop effective targeted marketing strategies that can help refine Australia's digital tourism campaigns, like “Come and Say G’day,” by identifying Internet search behaviours and keywords referring to activities or regions. As such, search intensity behaviours can serve as a real-time barometer to evaluate the effectiveness of digital campaigns in stimulating interest in Australian jurisdictions as preferred destinations.
This study makes important practical and methodological contributions. In terms of practical contributions, the present study offers enhanced accuracy in predicting tourism demand dynamics by leveraging Google search data which allows for real-time monitoring of tourism demand trends at subnational levels. The findings of the study can also assist policymakers and market participants in planning efficient resource allocations to respond to peak tourist seasons, as well as gauging tourist sentiment in times of shocks to the industry, such as pandemics or economic downturns. In terms of methodological contributions, the study contributes to the growing body of literature on how big data sources can enhance our understanding of tourism demand by integrating big data and dynamic panel data vector autoregressions for tourism demand modelling. This integrated approach is instrumental in bridging the gap between traditional time series econometric models and contemporary data-driven approaches. The use of the PVAR method adds theoretical depth that enhances understanding of tourism demand dynamics in real-time in the face of a rapidly changing global environment shaped by economics and geopolitical uncertainties.
The remainder of the paper is organised as follows. The next Section provides a brief overview of the related literature on the use of big data in economics in general and tourism in particular. The subsequent Section describes the data and methodology adopted in this study followed by the empirical results and discussions while the last Section presents concluding remarks.
Literature review
The availability of big data has revolutionised tourism research, enabling real-time and more granular analysis of high-frequency data. This is crucial for timely and accurate tourism demand forecasting that informs policymaking and planning in the tourism industry. As such, the relationship between Internet search intensity and tourism demand has gained significant attention in recent years, as digital data offers real-time insights into tourist behaviour. Search query data from Google Trends have been widely used to measure search intensity to predict tourism demand as it captures information about tourists’ interests and intentions before making travel decisions (Artola et al., 2015; Wu et al., 2024).
Tourists use search engine interfaces to find information about a range of activities related to their travel such as accommodations, spending habits, attractions and other activities (Jacobsen and Munar 2012; Volchek et al., 2019; Wen et al., 2021; Xiang et al. 2017). Search engine tools, such as Google Analytics capture and store such interactions that can provide valuable information about tourist search behaviours related to various outcomes such as tourist arrivals and spending (Artola et al., 2015; Höpken et al. 2021; Padhi and Pati 2017; Siliverstovs and Wochner 2018; Yang et al. 2014).
Choi and Varian (2012) show that incorporating web search information from Google Trends in the simple seasonal autoregressive models tends to enhance the accuracy of prediction by 5% to 10%. This is particularly relevant to the tourism industry as travellers rely on search engines and information technologies to book their trips and accommodation. Using autoregressive mixed-data sampling (AR-MIDAS) models, Bangwayo-Skeete and Skeete (2015) also show that web search traffic information has predictive power for tourism demand and enhances the accuracy of tourism demand forecasting. Similarly, other studies demonstrate the enhancing effect of search engine data such as Google Trends in forecasting tourism demand (Camacho and Pacce, 2018; Havranek and Zeynalov, 2021; Yang et al., 2014; Önder et al., 2020).
Summary of related literature.
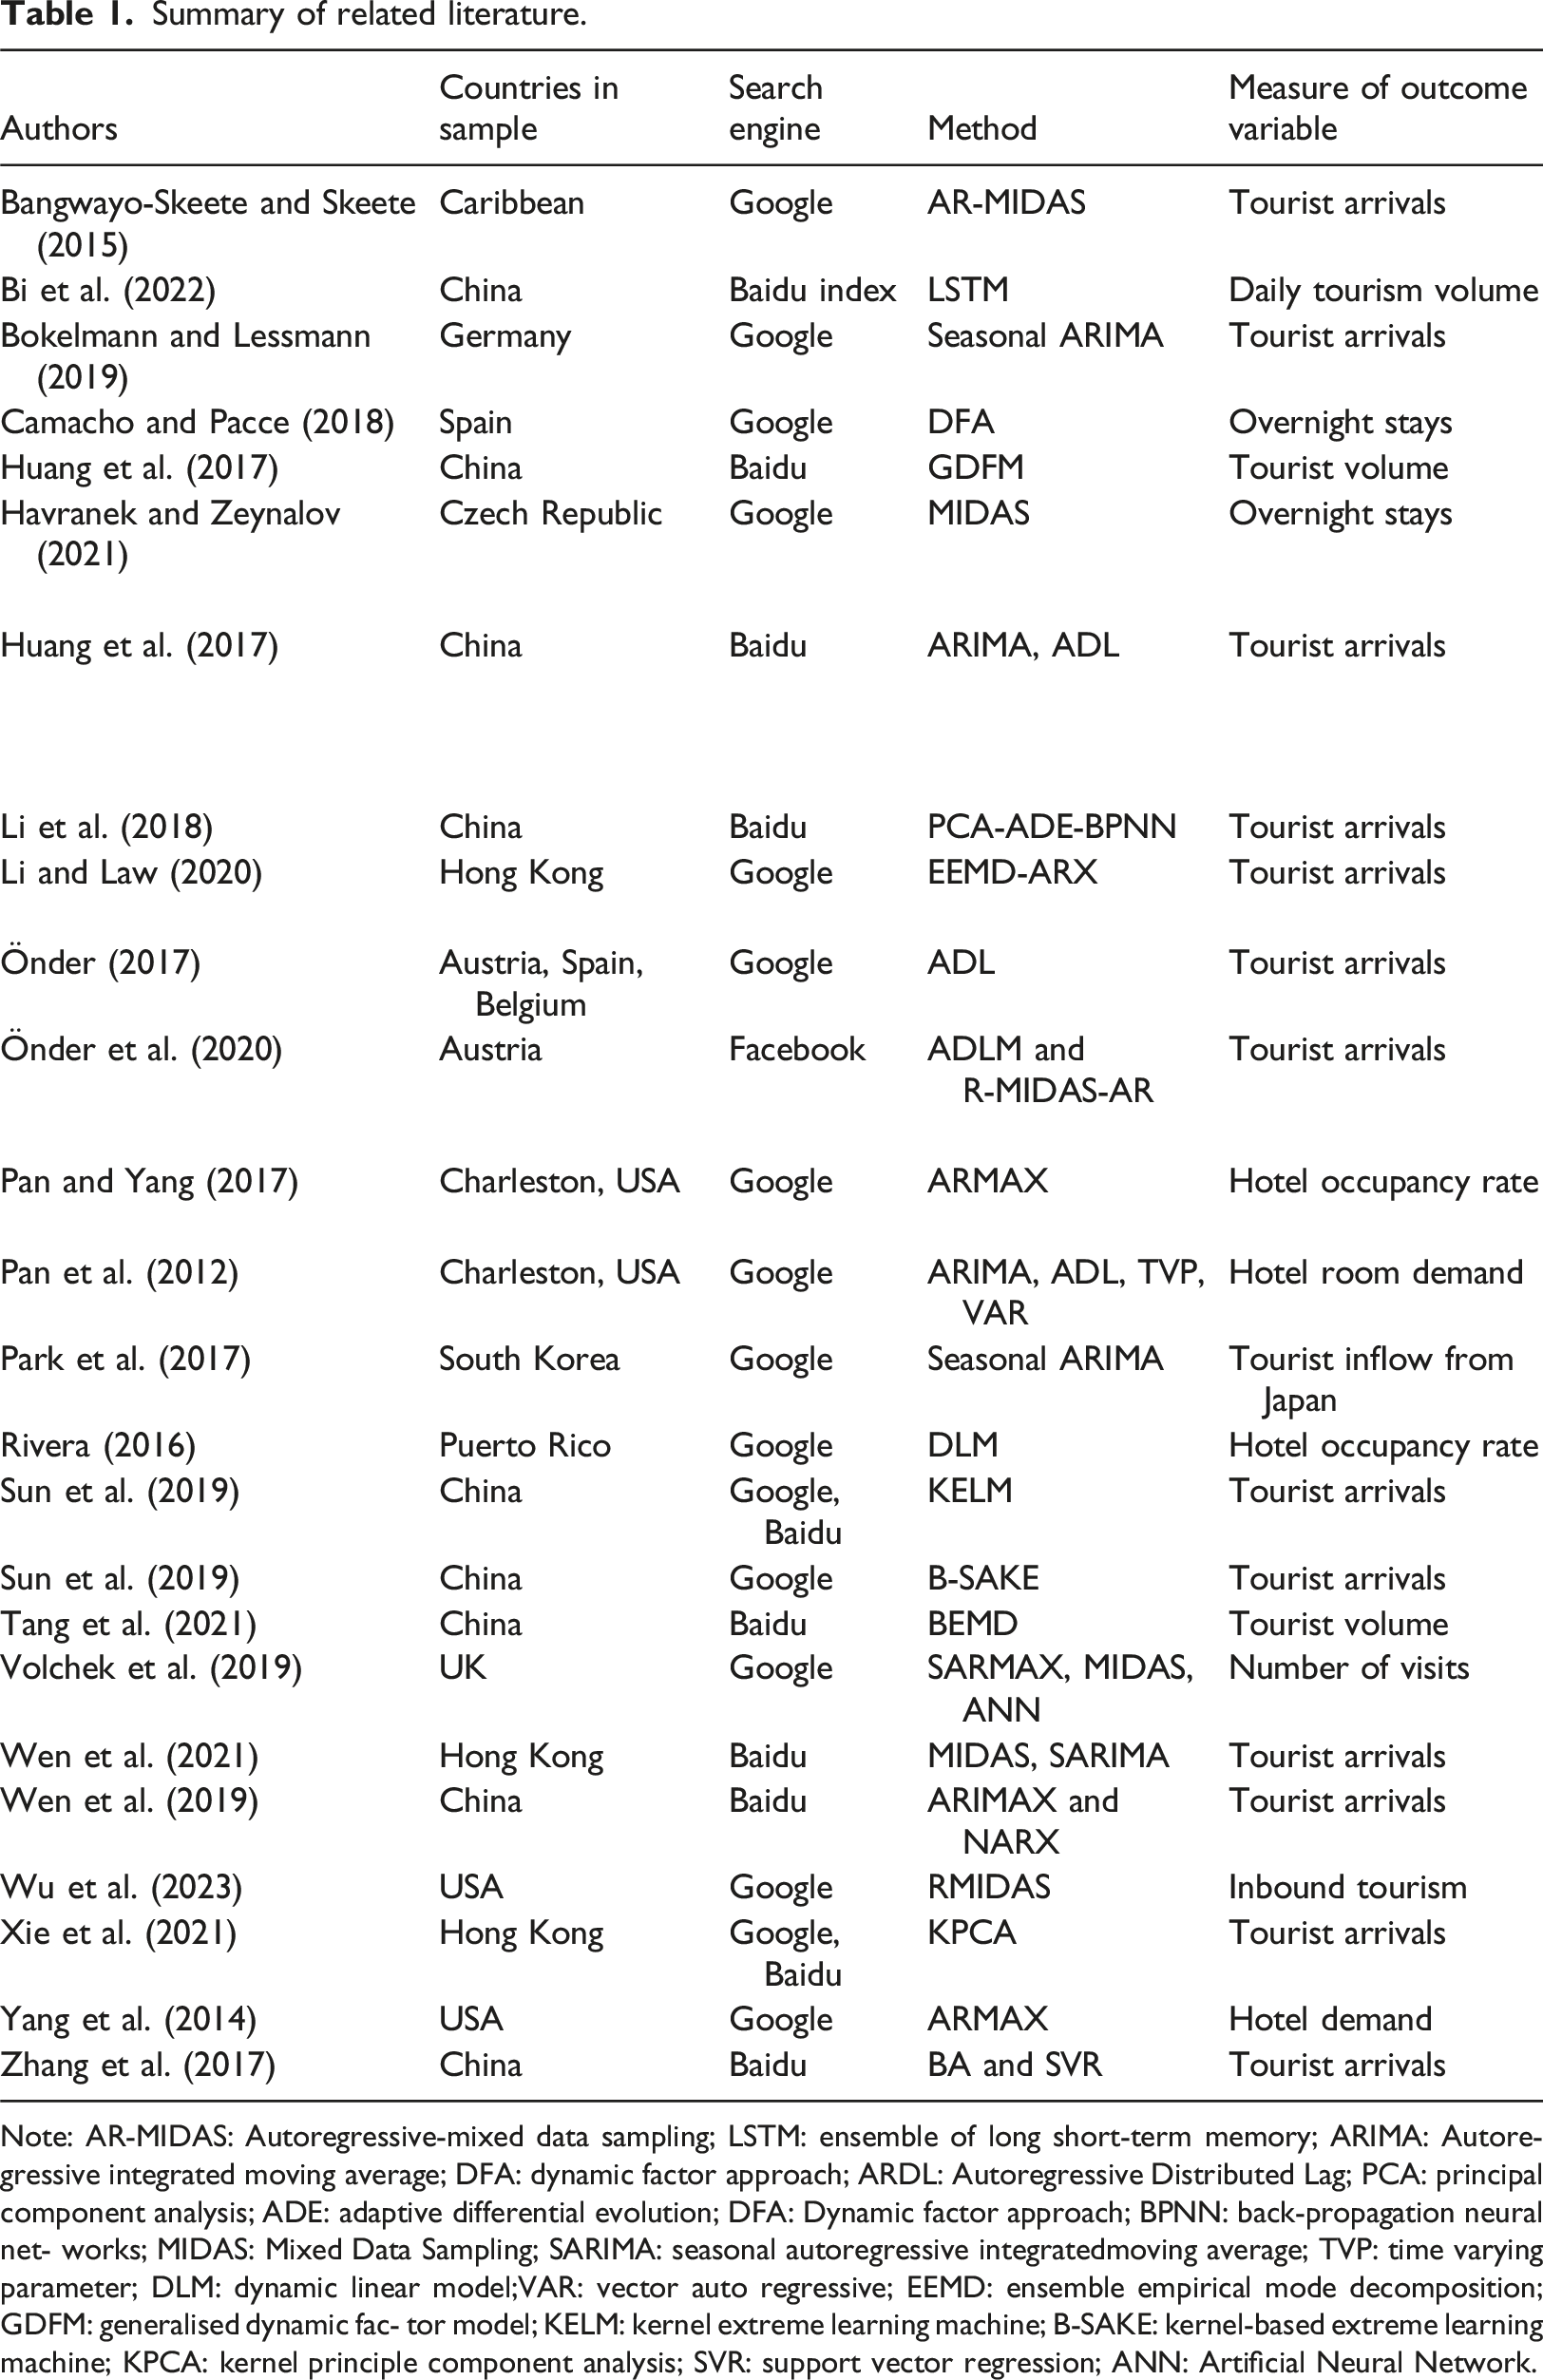
Note: AR-MIDAS: Autoregressive-mixed data sampling; LSTM: ensemble of long short-term memory; ARIMA: Autoregressive integrated moving average; DFA: dynamic factor approach; ARDL: Autoregressive Distributed Lag; PCA: principal component analysis; ADE: adaptive differential evolution; DFA: Dynamic factor approach; BPNN: back-propagation neural net- works; MIDAS: Mixed Data Sampling; SARIMA: seasonal autoregressive integratedmoving average; TVP: time varying parameter; DLM: dynamic linear model;VAR: vector auto regressive; EEMD: ensemble empirical mode decomposition; GDFM: generalised dynamic fac- tor model; KELM: kernel extreme learning machine; B-SAKE: kernel-based extreme learning machine; KPCA: kernel principle component analysis; SVR: support vector regression; ANN: Artificial Neural Network.
A common feature of the existing literature on predicting tourism outcomes using big data is that most of the studies employed either time series models or machine learning techniques. Traditional demand modelling approaches, such as time series models (e.g., Auto-Regressive Integrated Moving Average (ARIMA) and their extensions have been the popular approaches for modelling tourism demand (Song and Li, 2008). While these approaches help analyse historical data with established regularities, they are scrutinised for their limitations in capturing dynamics and sudden shifts in tourism demand in the rapidly changing global environment shaped by external shocks, such as pandemics or geopolitical uncertainties (Wu et al., 2024).
Based on the critical synthesis of the related literature, some notable gaps are identified. First, the integration of big data sources like Google Trends with dynamic modelling techniques as in PVAR is scant in the tourism literature. For example, in their recent comprehensive systematic review, Wu et al. (2024) emphasised the necessity of dynamic data analysis in tourism demand forecasting given the inherent unpredictability of the global environment. This study bridges this gap in the literature by integrating real-time search data with a robust methodological framework, PVAR to analyse and understand the dynamics of tourism demand and search intensity behaviours. Second, the existing literature lacks a detailed examination of the dynamic impact of specific digital campaigns such as the ‘Come and Say G'day’ on tourism demand with a destination-specific focus which is crucial to providing insights for policy and marketing strategies. Third, by employing dynamic PVAR model, this study provides a comprehensive view of the intricacy of the interactions of the key variables, capturing the feedback loops inherent in tourism demand systems.
Data and methodology
Description of data and time series properties
To model tourism demand using Internet search intensity related to travel, we utilise data on worldwide travel search query volumes (SQV) sourced from the Google search engine interface. Google Analytics has provided weekly data on SQV index since 2004. The SQV index for a given period of time related to tourism is constructed by analysing the frequency of specific search queries related to the travel category entered into Google at that time. The index allows researchers and destination management officials to track the popularity of a particular search term and how it changes over time and space. It offers insights into changes in Internet search behaviour and public interests, accounting for variations in search activity at different times and geographic locations.
Below we provide a detailed description of how the SQV index is constructed. First, relevant data are collected from Google Trends based on the particular search terms in certain categories that the users enter into the Google search engine based on geographic selections and search type. We choose the travel category and worldwide web search for search type and Australian jurisdictions for geographic locations. The next important step is normalisation of the search data to ensure comparability across different regions and time periods. This is done through the adjustment of the raw search volume based on the total number of searches performed in that particular region or time period. That is, the process adjusts for differences in overall search volumes across time and space to ensure comparability in the trends across geographic locations with varying levels of Internet use. This captures the relative popularity of the search term in a given geographic location or period in a manner that is independent of the overall search volume.
More explicitly, the normalized SQV index is computed as: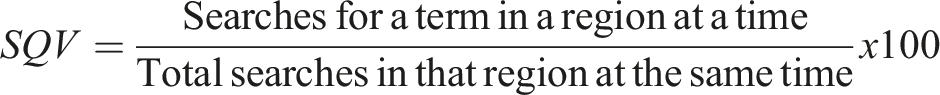
The normalised index of the relative search interest ranges from 0 to 100, where 100 represents the peak popularity of the search term and 0 represents insufficient search interest in the term in the given geographic location and time period. It is important to understand that the index helps track the relative interest in search terms and it does not provide absolute search volumes. That is, the index represents the proportion of searches for a term relative to the total number of searches instead of the absolute number of searches. The SQV index captures the intensity of users’ online search related to a certain theme/topic. Higher values of SQV index represent higher search intensity. Based on the earliest date of data availability, our sample begins with quarter 1 of 2005.
Data on actual tourism demand indicators for Australian states, including the number of inbound travellers and visitor nights are sourced from the Tourism Satellite Accounts and Tourism Research Australia. A range of control variables are obtained from various sources. Data on indicators for world economic activity, proxied by world industrial production index, is sourced from Baumeister and Hamilton (2019). Data on the cost of living, measured in consumer price index (CPI), is obtained from the Australia Bureau of Statistics (ABS) and exchange rate data are sourced from the Reserve Bank of Australia.
Our choice of the control variables is based on economic theory and the evidence in the empirical literature. International trade theory states that demand for the exports of goods and services of a country depends on the income or GDP of the trading partners from the rest of the world (Keum, 2010). To control for this, we use world industrial production index as the proxy of GDP as it is available at a higher frequency which is well-suited for our empirical study. This index is widely used in the recent literature related to tourism demand models (Işık et al., 2020).
Exchange rates play a crucial role in influencing tourism demand through their effect on the competitiveness of the tourism sector by altering the relative costs of travel, accommodation, and other spending in destinations. As a result, fluctuation in exchange rates can either encourage or discourage tourist flows depending on whether the changes lead to the appreciation or depreciation of the currency in the destination country. Specifically, a weaker value in the destination currency makes that country more attractive to foreign tourists because it reduces the cost of visiting and vice versa (Athari et al., 2021; Dogru et al., 2019; Rookayyah et al., 2024).
Another important covariate is the cost of living or inflation in the destination location, proxied by the changes in consumer price index (CPI). This is firmly grounded in the purchasing power parity theory that explains differences in the costs of similar goods or services in different locations. A high cost of living in the destination location leads to higher costs for accommodation, food and transportation making the destination location more expensive for tourists, especially those coming from countries with a lower cost of living. A rise in inflation can influence budget-conscious tourists either to reduce their tourism demand or choose alternative destinations that provide better value for money (Athari et al., 2021; Raifu and Afolabi, 2024).
Summary statistics: 2005Q1–2021Q4.
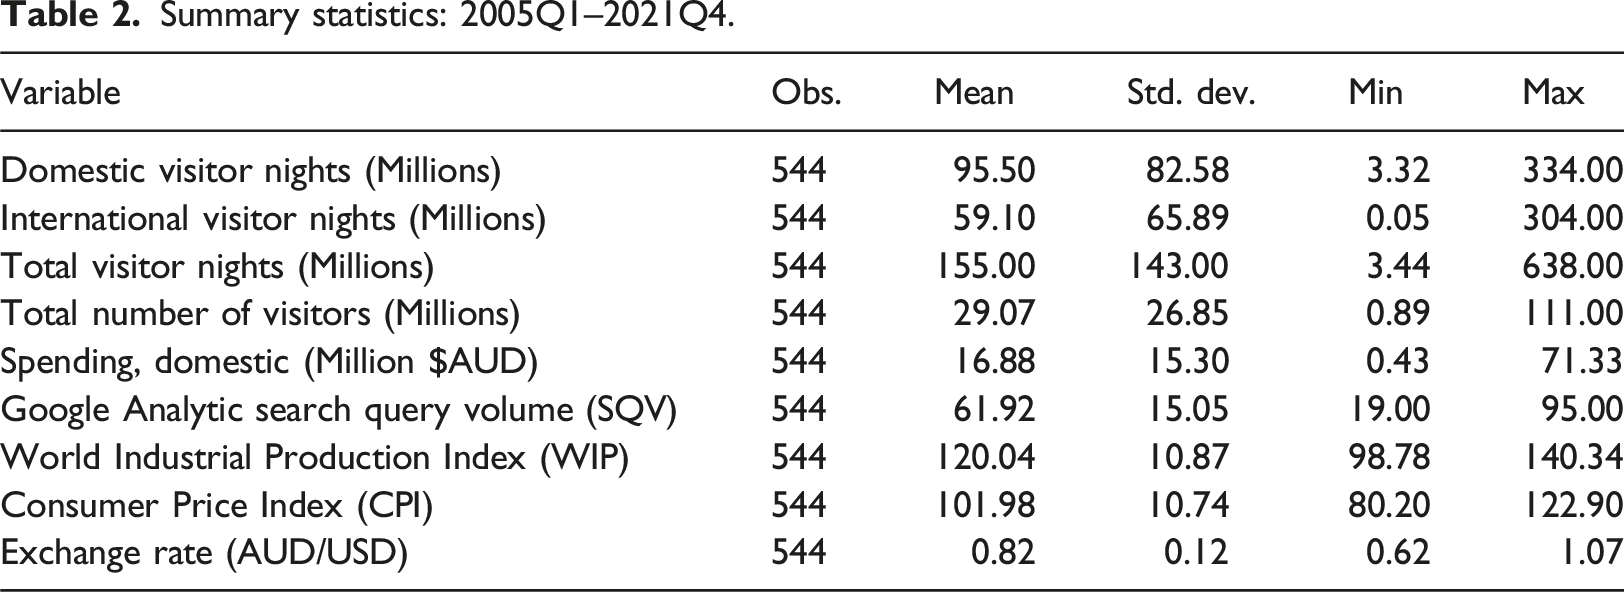
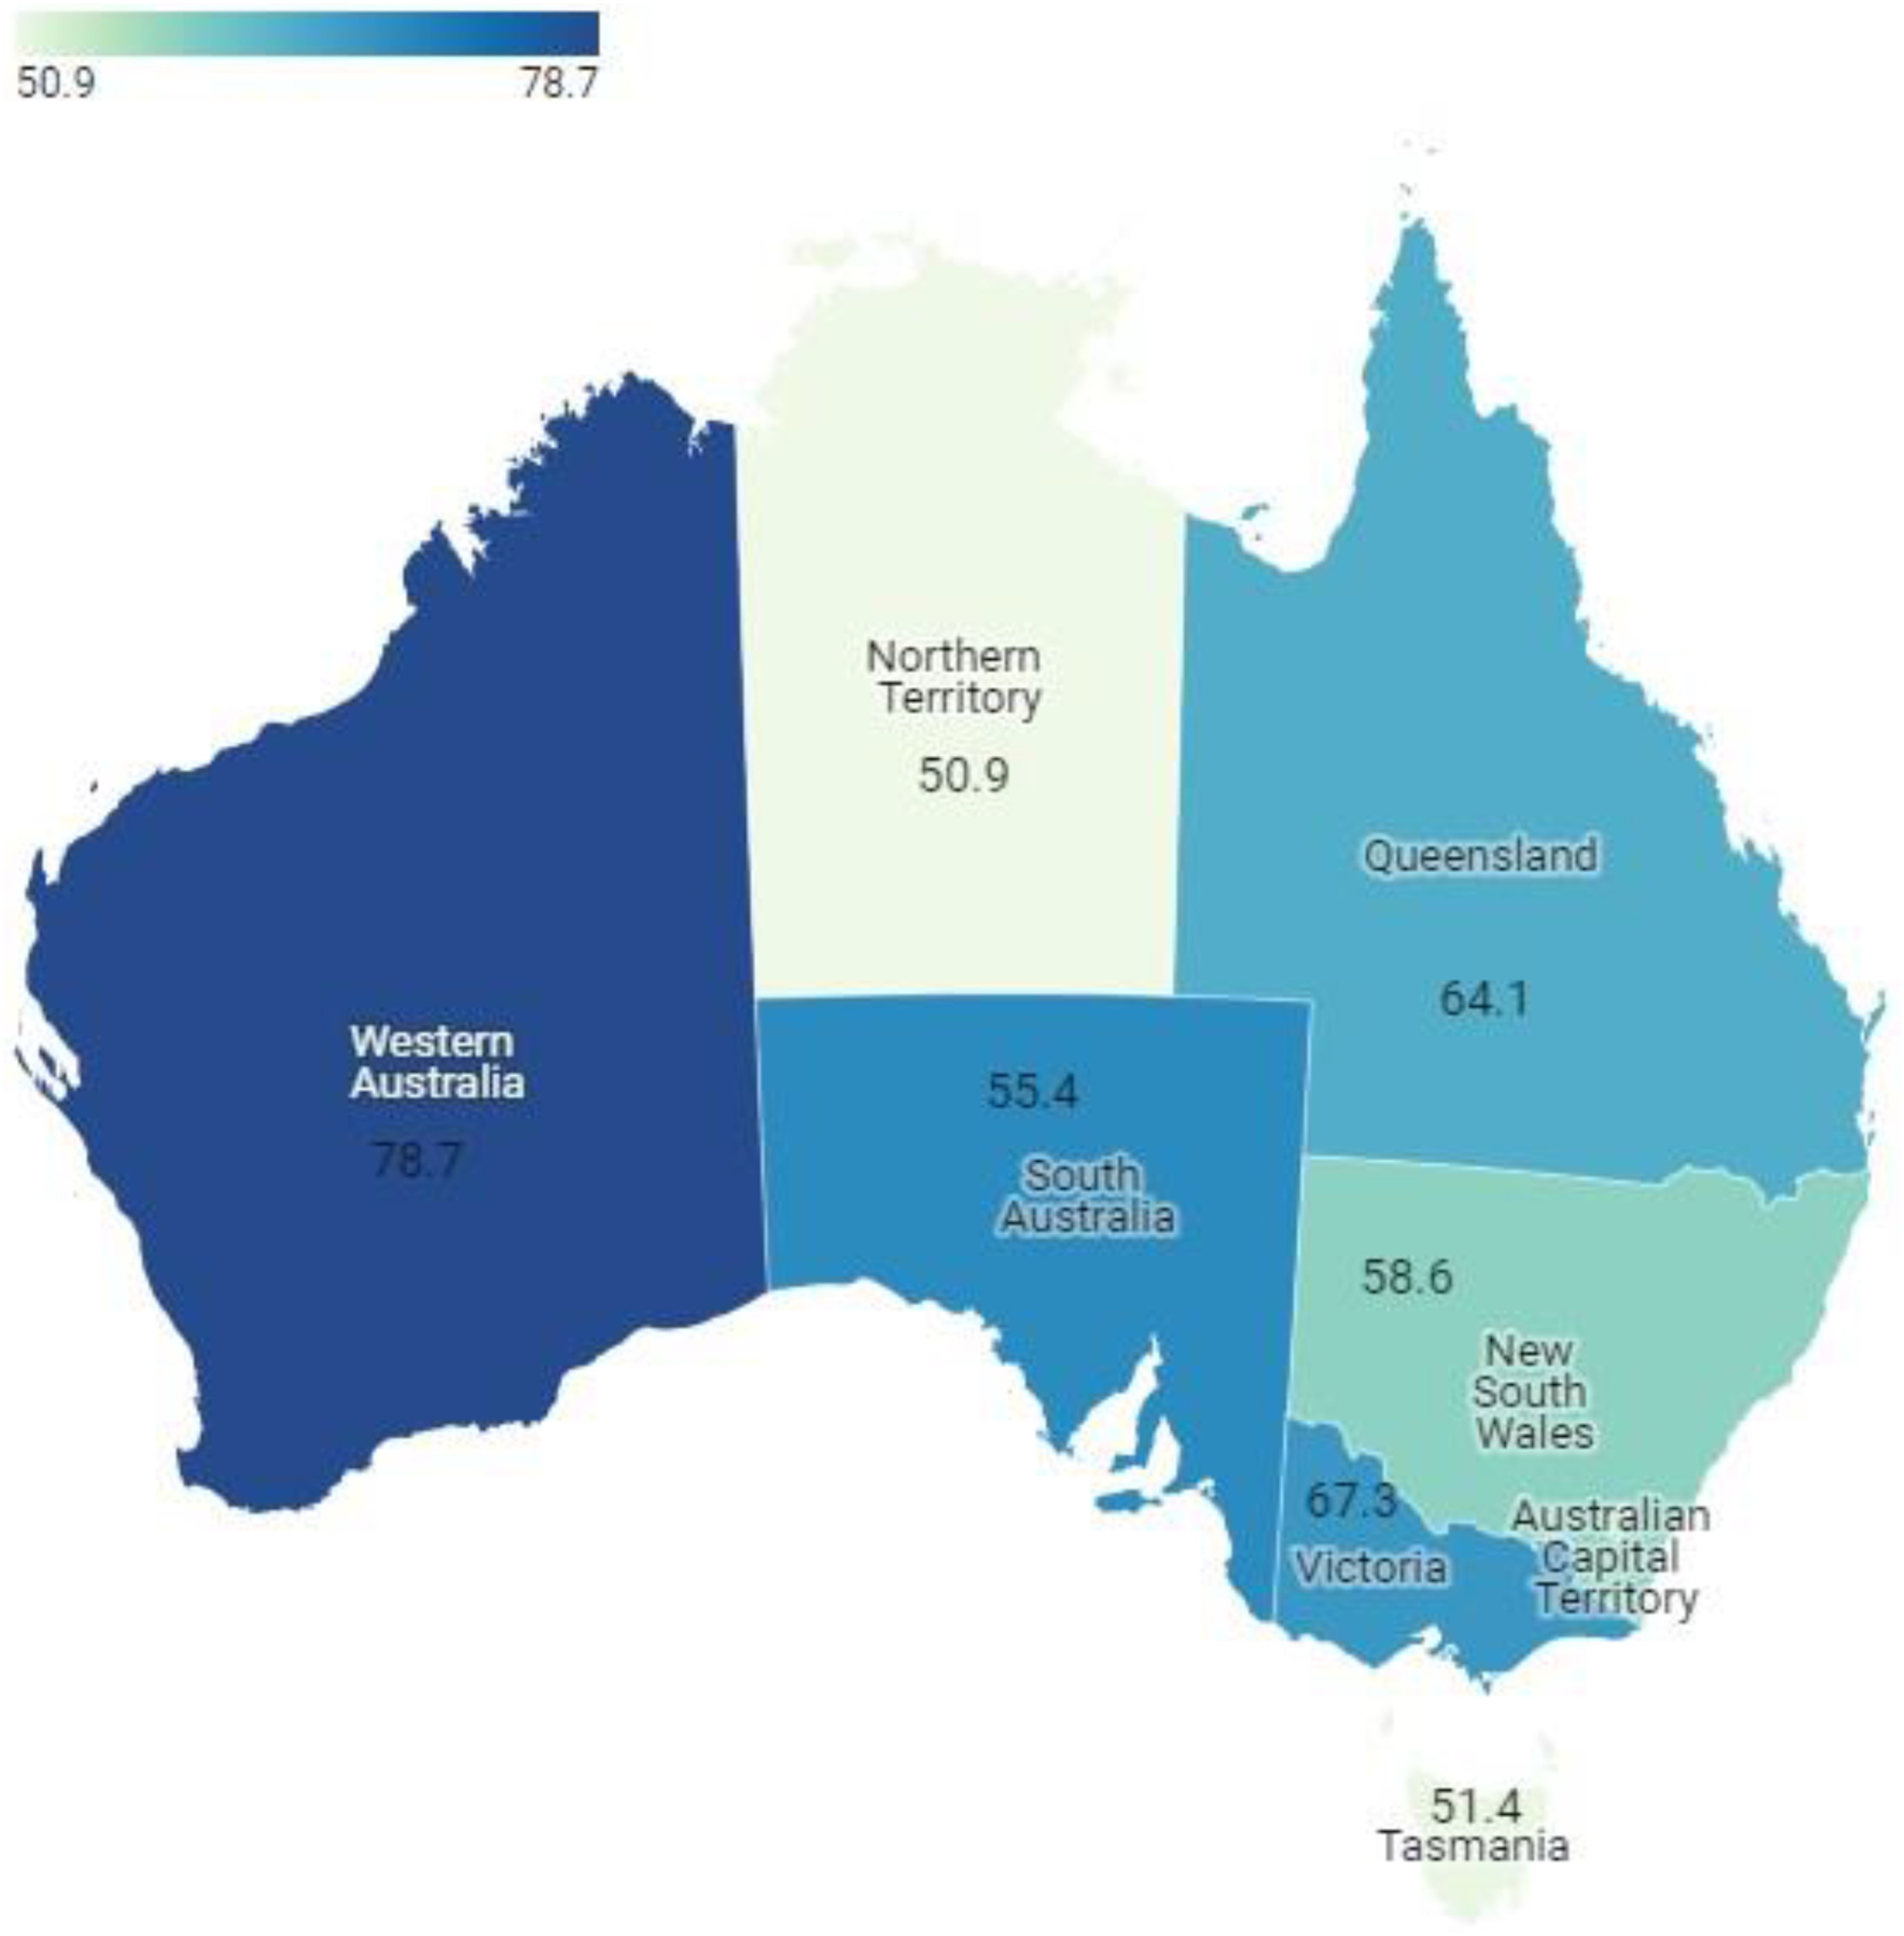
Figure 1 provides an overview of the trajectory of the search intensity for major Australian cities. The trend in search intensity clearly captures the episodes of major global events including the timeline of the COVID-19 pandemic and major global tourism campaigns by Tourism Australia. There was a sharp decline in search intensity in 2020 with the emergence of the COVID-19 pandemic. The trend depicts a sign of recovery of the sector following the removal of border restrictions and the surge in global digital marketing activities, such as the Come and Say G’day campaign. Figure 2 shows the map of the regions studied in Australia with the average values of SQV for the sample period. Trends in worldwide travel search intensity index. Average search intensity index by states and territories.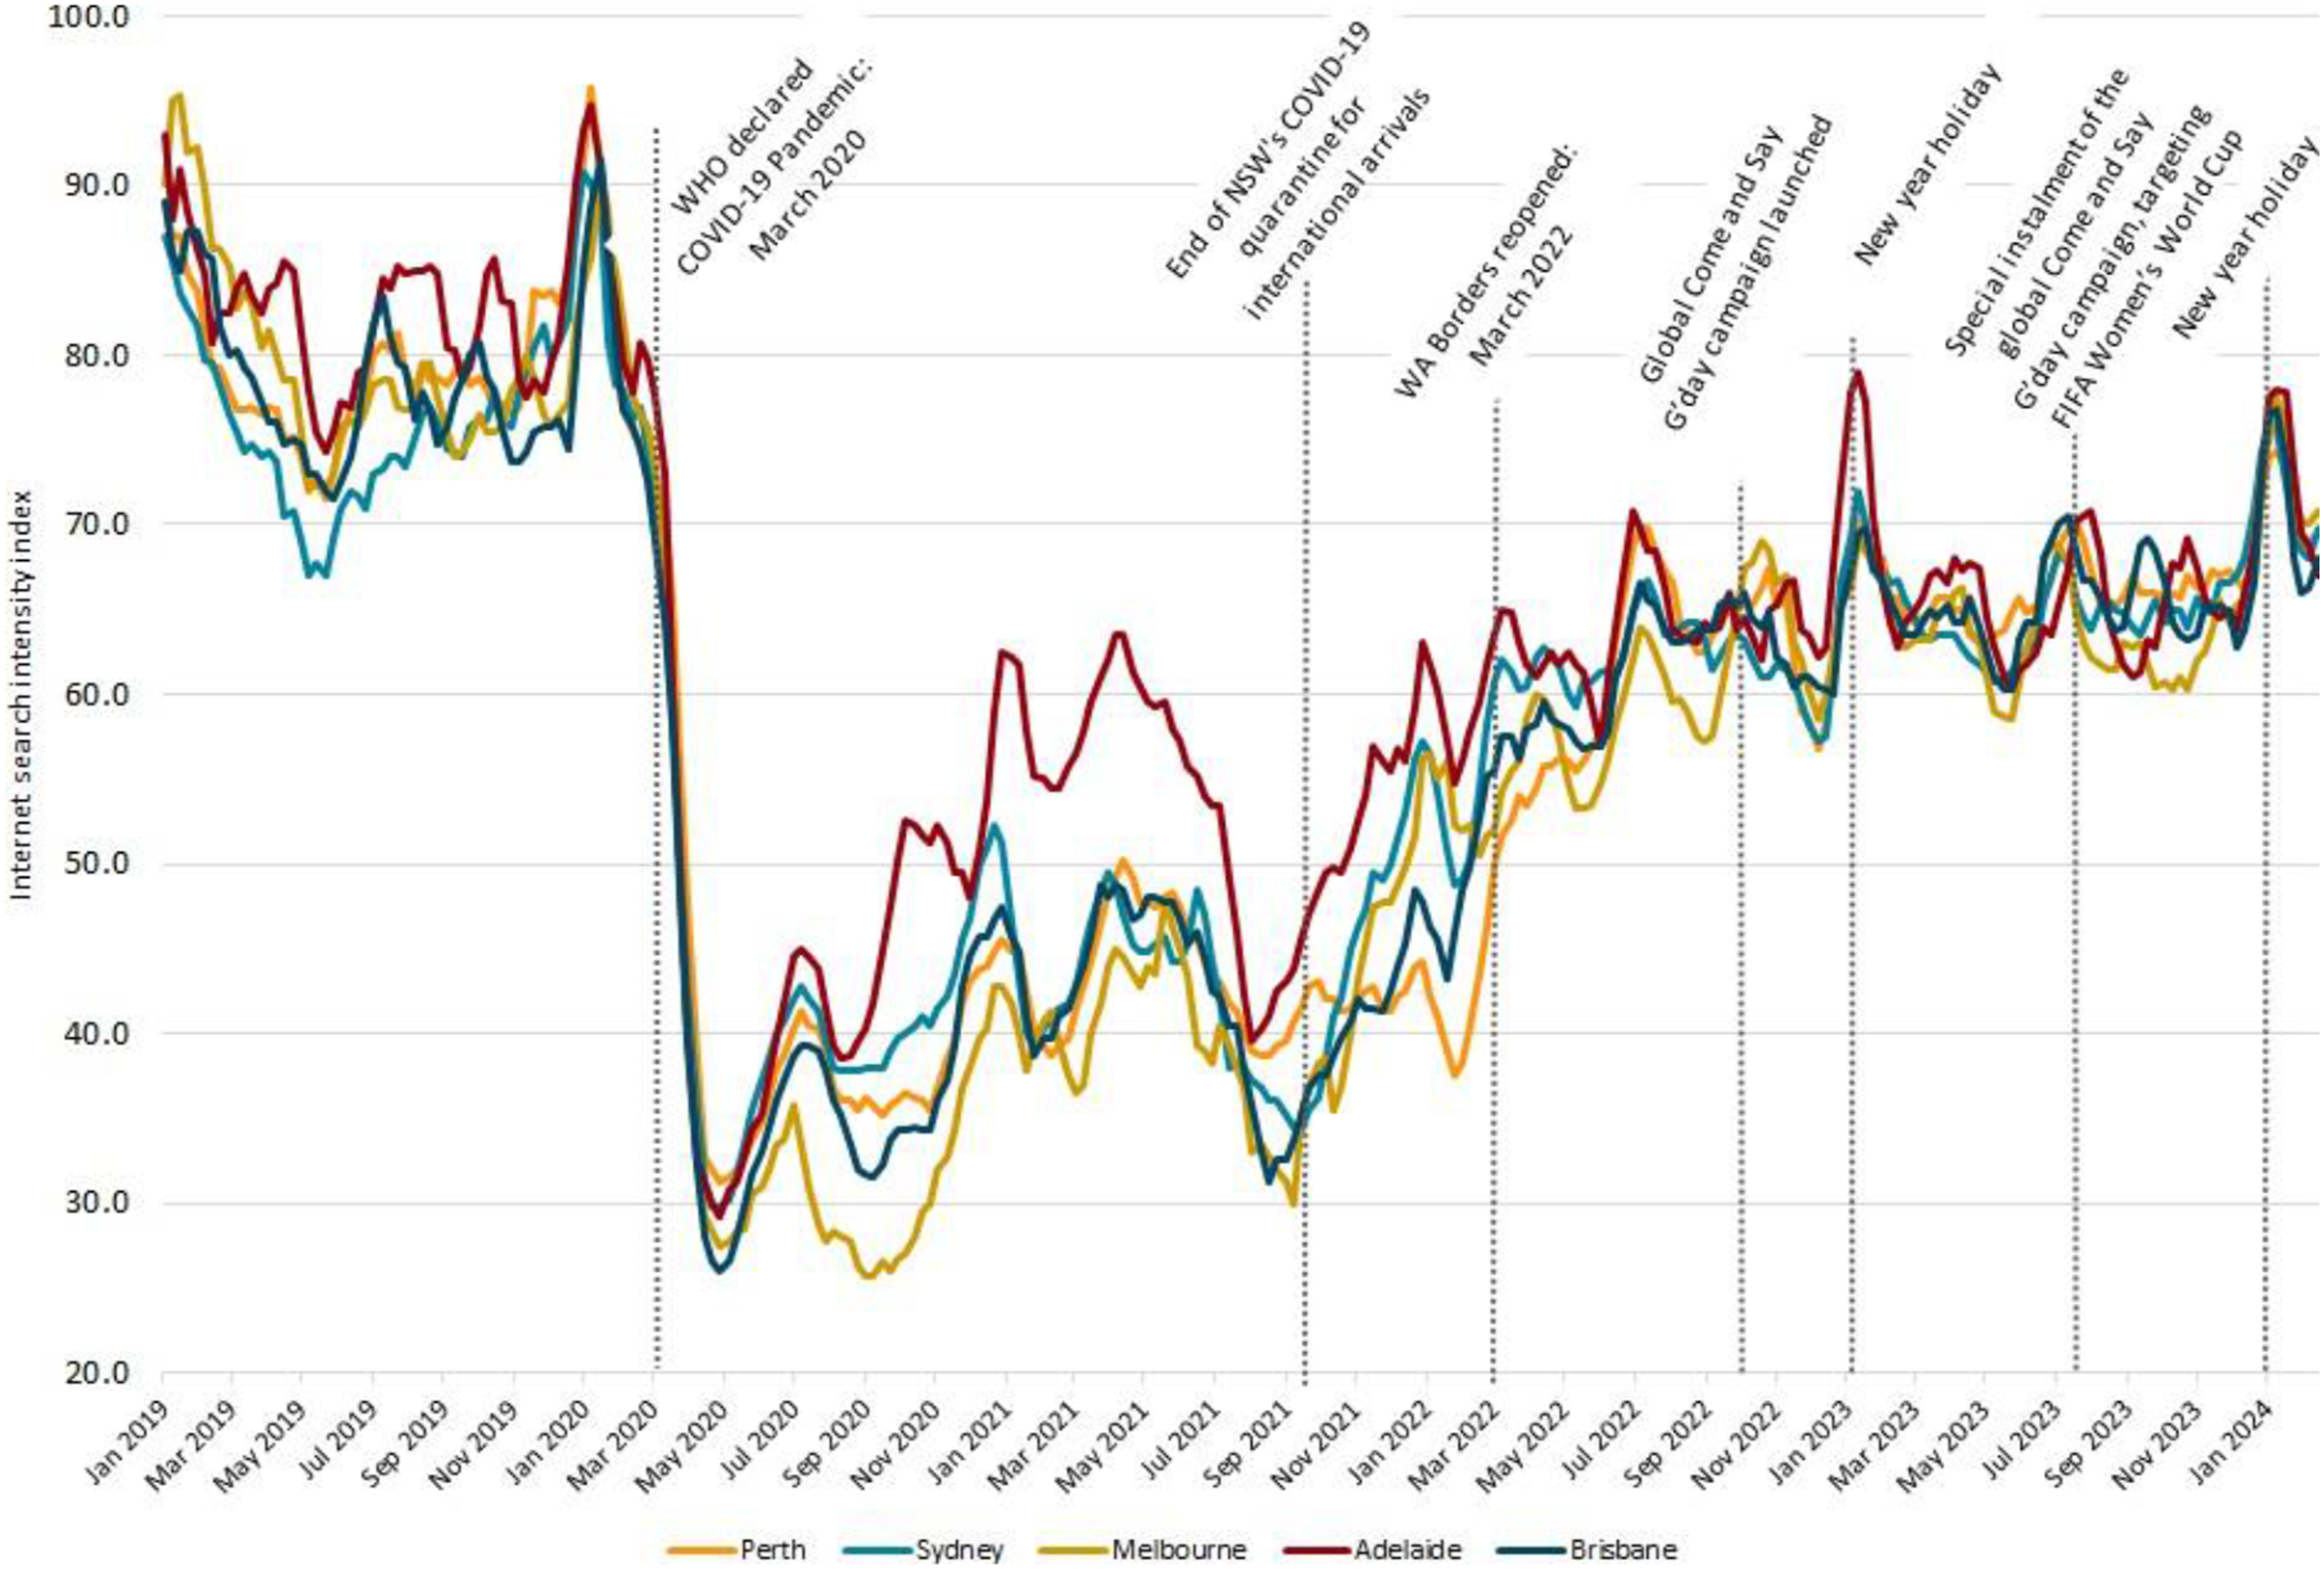
Panel unit root test results.
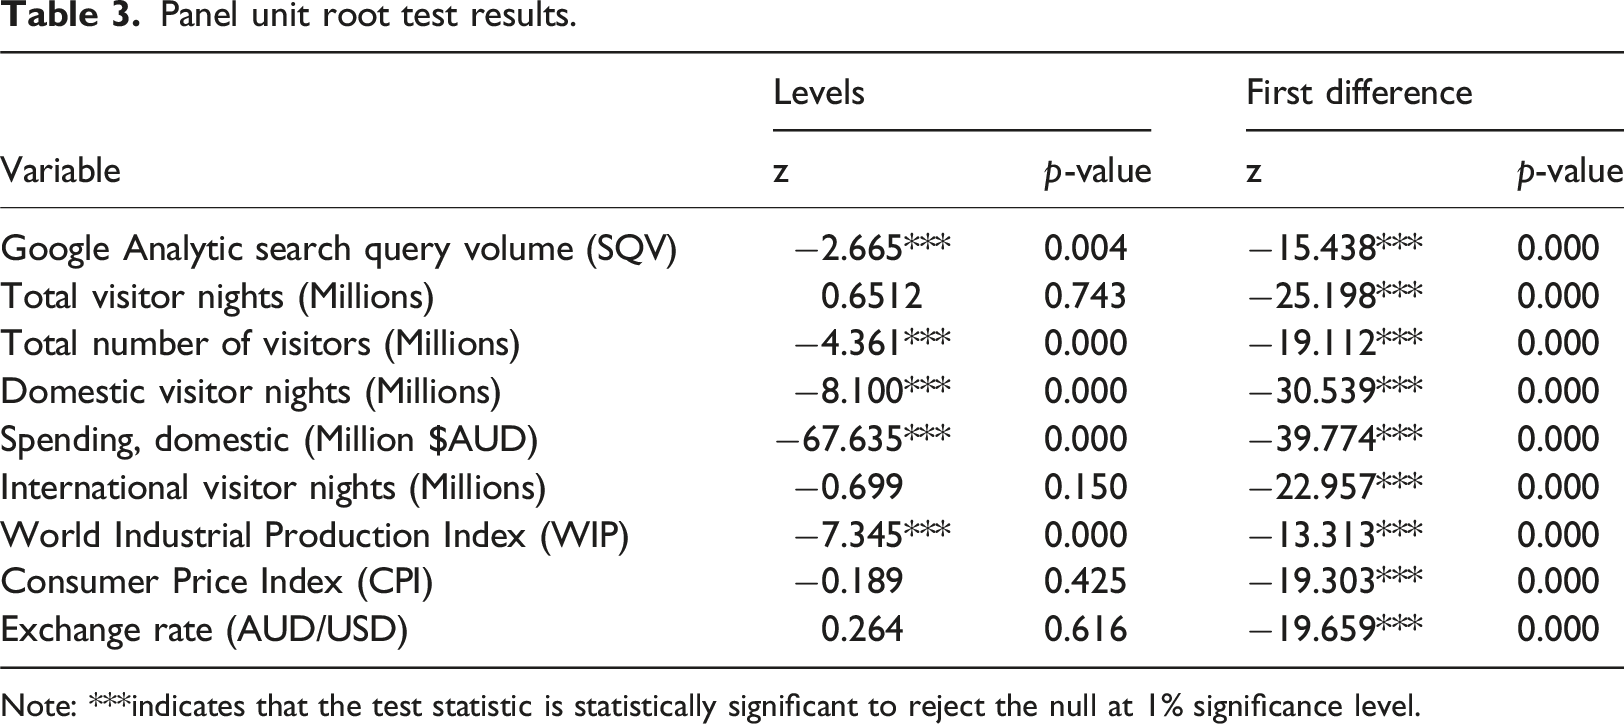
Note: ***indicates that the test statistic is statistically significant to reject the null at 1% significance level.
Panel cointegration test results.
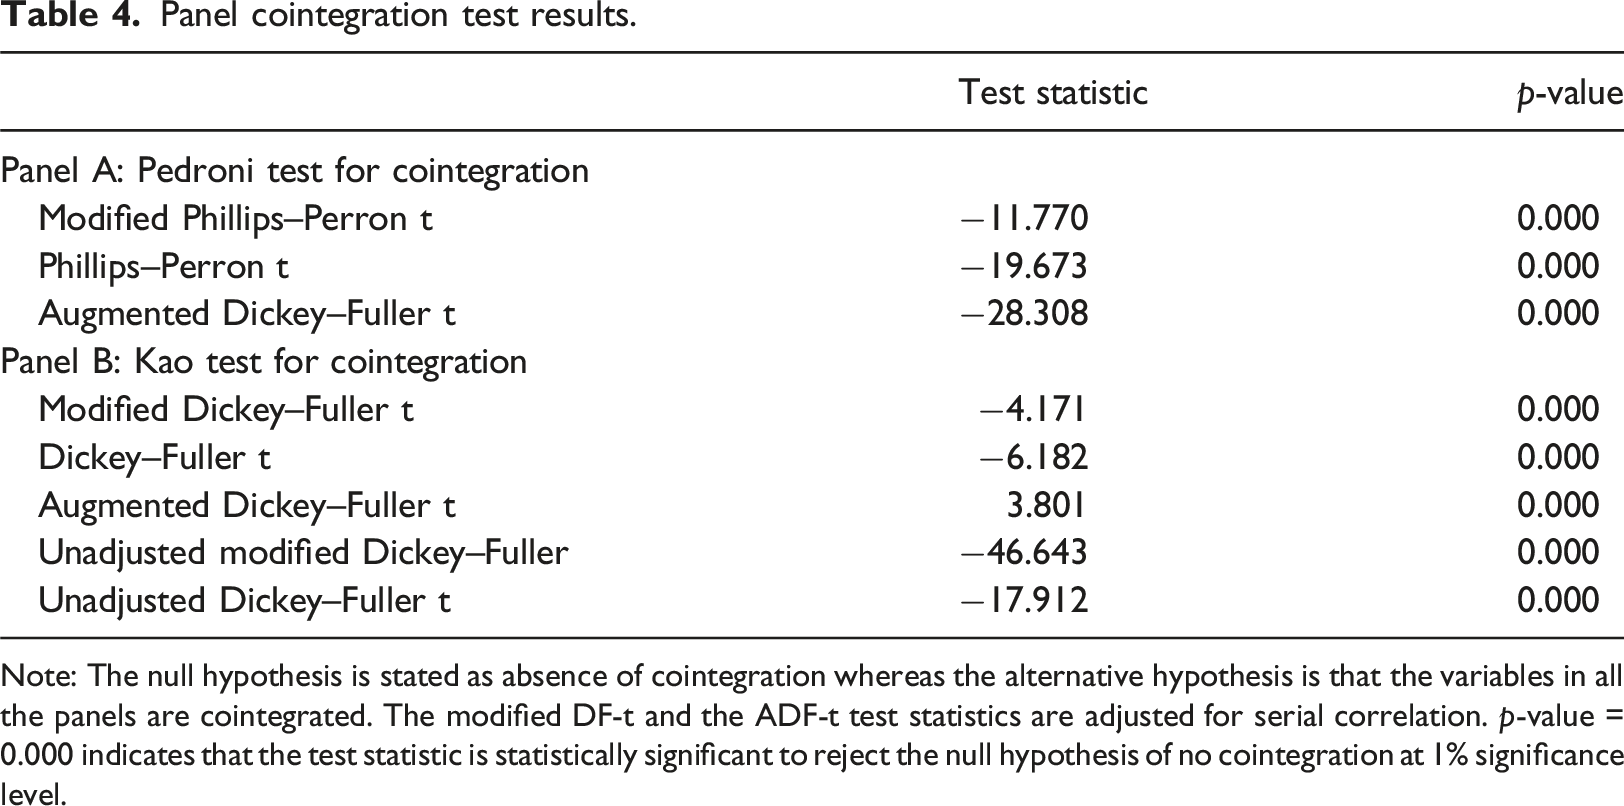
Note: The null hypothesis is stated as absence of cointegration whereas the alternative hypothesis is that the variables in all the panels are cointegrated. The modified DF-t and the ADF-t test statistics are adjusted for serial correlation. p-value = 0.000 indicates that the test statistic is statistically significant to reject the null hypothesis of no cointegration at 1% significance level.
Empirical strategy
We employ a panel VAR (PVAR) model to quantify the impact of Internet search intensity on actual tourism demand. The PVAR model was initially developed by Holtz-Eakin et al. (1988) and has been used as a workhorse in empirical research in economics. The advantage of this approach is that it integrates the traditional time series based VAR model in the presence of endogenous variables in the system with the panel-data approach that accounts for unobserved heterogeneity (Canova and Ciccarelli, 2009; Holtz-Eakin et al., 1988; Love and Zicchino, 2006).
In this context, the PVAR model is best suited to this research as it allows for multiple variables to be endogenous and interdependent in the VAR system. Following Cao and Sun (2011), we employ panel GMM estimator based on the first differenced equations in the 
The covariance matrix of the disturbance term in the PVAR is defined as 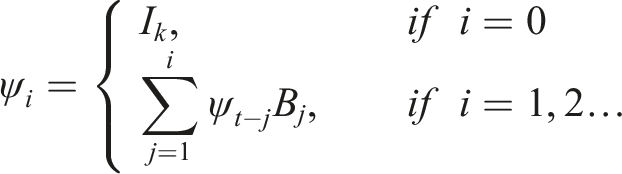
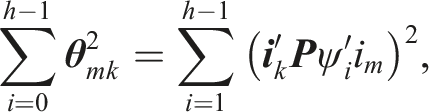
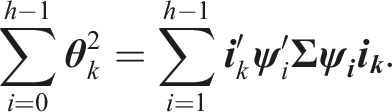
To provide a brief description of this approach, the h-step-ahead forecast error is computed as: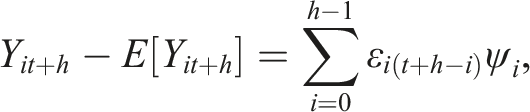
There are several advantages of the PVAR model compared to the time series models adopted in the existing studies in the tourism literature, such as ARIMA and SARIMA. First PVAR is a multivariate model, capable of simultaneously modelling multiple endogenous variables along with their dynamic interactions that addresses the issue of reverse causality (Kuok et al., 2023). In comparing the PVAR model with machine learning approaches, both methods are valuable tools in empirical analysis, but they serve different purposes and offer distinct advantages depending on the contexts and study objectives.
It is important to acknowledge that while machine learning algorithms are powerful tools for predictions, they are not suited for the purpose of causal inference at this stage as outlined in notable studies (Bajari et al., 2015; Mullainathan and Spiess, 2017; Varian, 2014). Our research objective, revolves around estimating the causal relationship between tourism outcomes and Internet search behaviours, controlling for covariates. In addition, a key advantage of the PVAR model is that it provides extremely helpful tools such as the impulse response functions (IRFs) and forecast error variance decomposition techniques to analyse the dynamic impact of a shock in the explanatory variables on tourism outcomes and quantify the relative importance of each shock.
Results and discussions
We begin our empirical analysis with discussions of the estimated impulse response functions, followed by forecast error variance decomposition and panel Granger causality tests. Further, we explored a series of sensitivity tests using alternative measures of tourism demand to ascertain the robustness of the results.
Impulse responses
Figure 3 presents the orthogonalised impulse functions (IRFs) of tourism demand measured by the number of visitor nights in response to a positive shock in SQV and other key covariates estimated using equation (1). The blue solid lines represent the estimated responses of actual tourism demand in response to a one standard deviation positive shock to the explanatory variables in the PVAR system. The shaded area represents the 95% confidence interval for the estimates derived from the Monte Carlo simulation of 200 draws. Orthogonalised impulse response functions of visitor nights to a one standard deviation shock in SQV and covariates.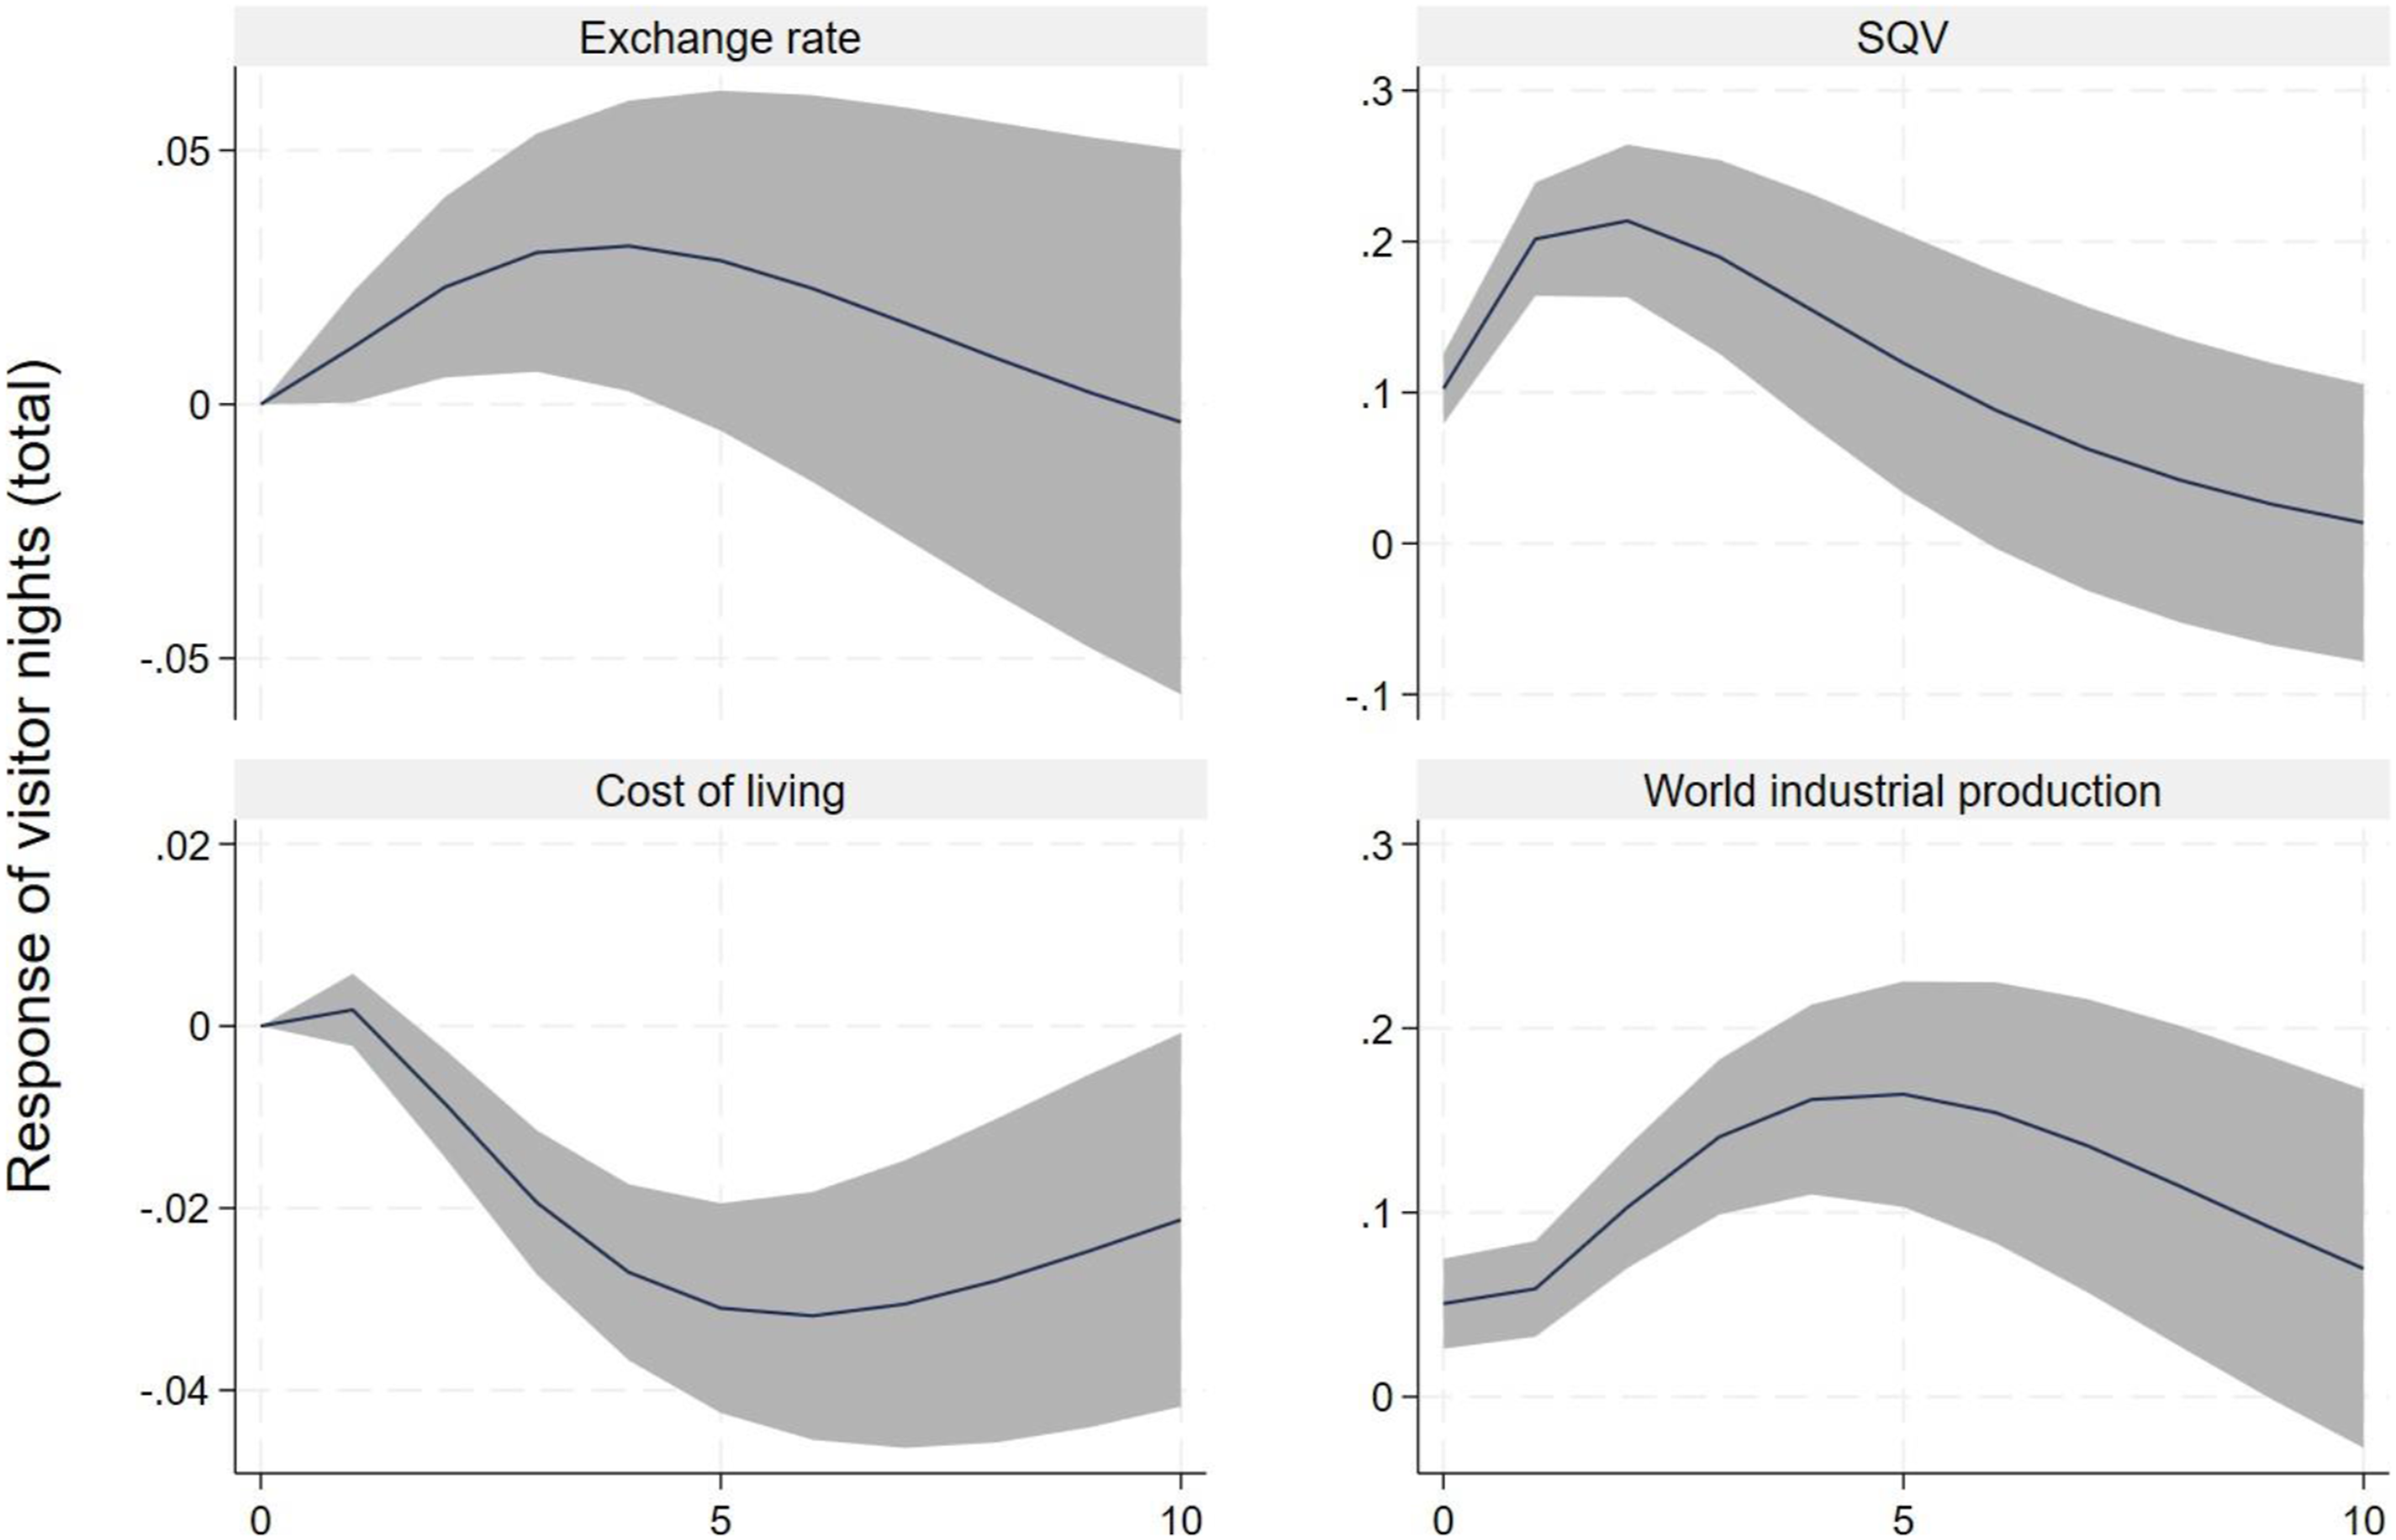
The upper right panel of Figure 3 shows that an increase in Internet search intensity related to travel to Australia is associated with a positive and statistically significant surge in tourist visitor nights. Specifically, the results show that a one standard deviation shock in SQV leads to about 2% increase in tourist visitor nights and the effect is persistent up to six quarters following the shock.
Based on the tourism statistics from the National Tourism Satellite Account of the Australian Bureau of Statistics (ABS) for the 2022–23 financial year, our back of the envelope calculation shows that a 10% increase in worldwide search intensity for Australian destinations will increase tourism GDP by about $1.4 million at current prices.
Consistent with expectations, a global surge in economic activities, proxied by a positive shock in world industrial production has a strong positive and statistically significant effect on tourism demand. As can be seen in Figure 3, tourism demand increases on impact following a positive shock in world industrial production with the effect of picking up in the fifth quarter and declining slowly thereafter before it vanishes after the tenth quarter from the time of shock. An increase in the cost of living is found to have a negative and statistically significant effect on tourism demand although the effect is a transitory one that vanishes quickly after three quarters, while exchange rate has an insignificant impact.
We perform a diagnosis test for the PVAR model by assessing the assumptions for the normality of residuals. To do so we use Kernel density estimates of the residuals from the PVAR estimation and overlay them with a normal density on the same plot for comparison. Figure 4 provides a visual comparison between the empirical distribution of residuals from kernel density estimates following the PVAR estimation and a normal distribution. The Figure shows that the estimates from the kernel density closely mirror the overlaid normal curve suggesting that the residuals are likely to be normally distributed. Normality test for residuals.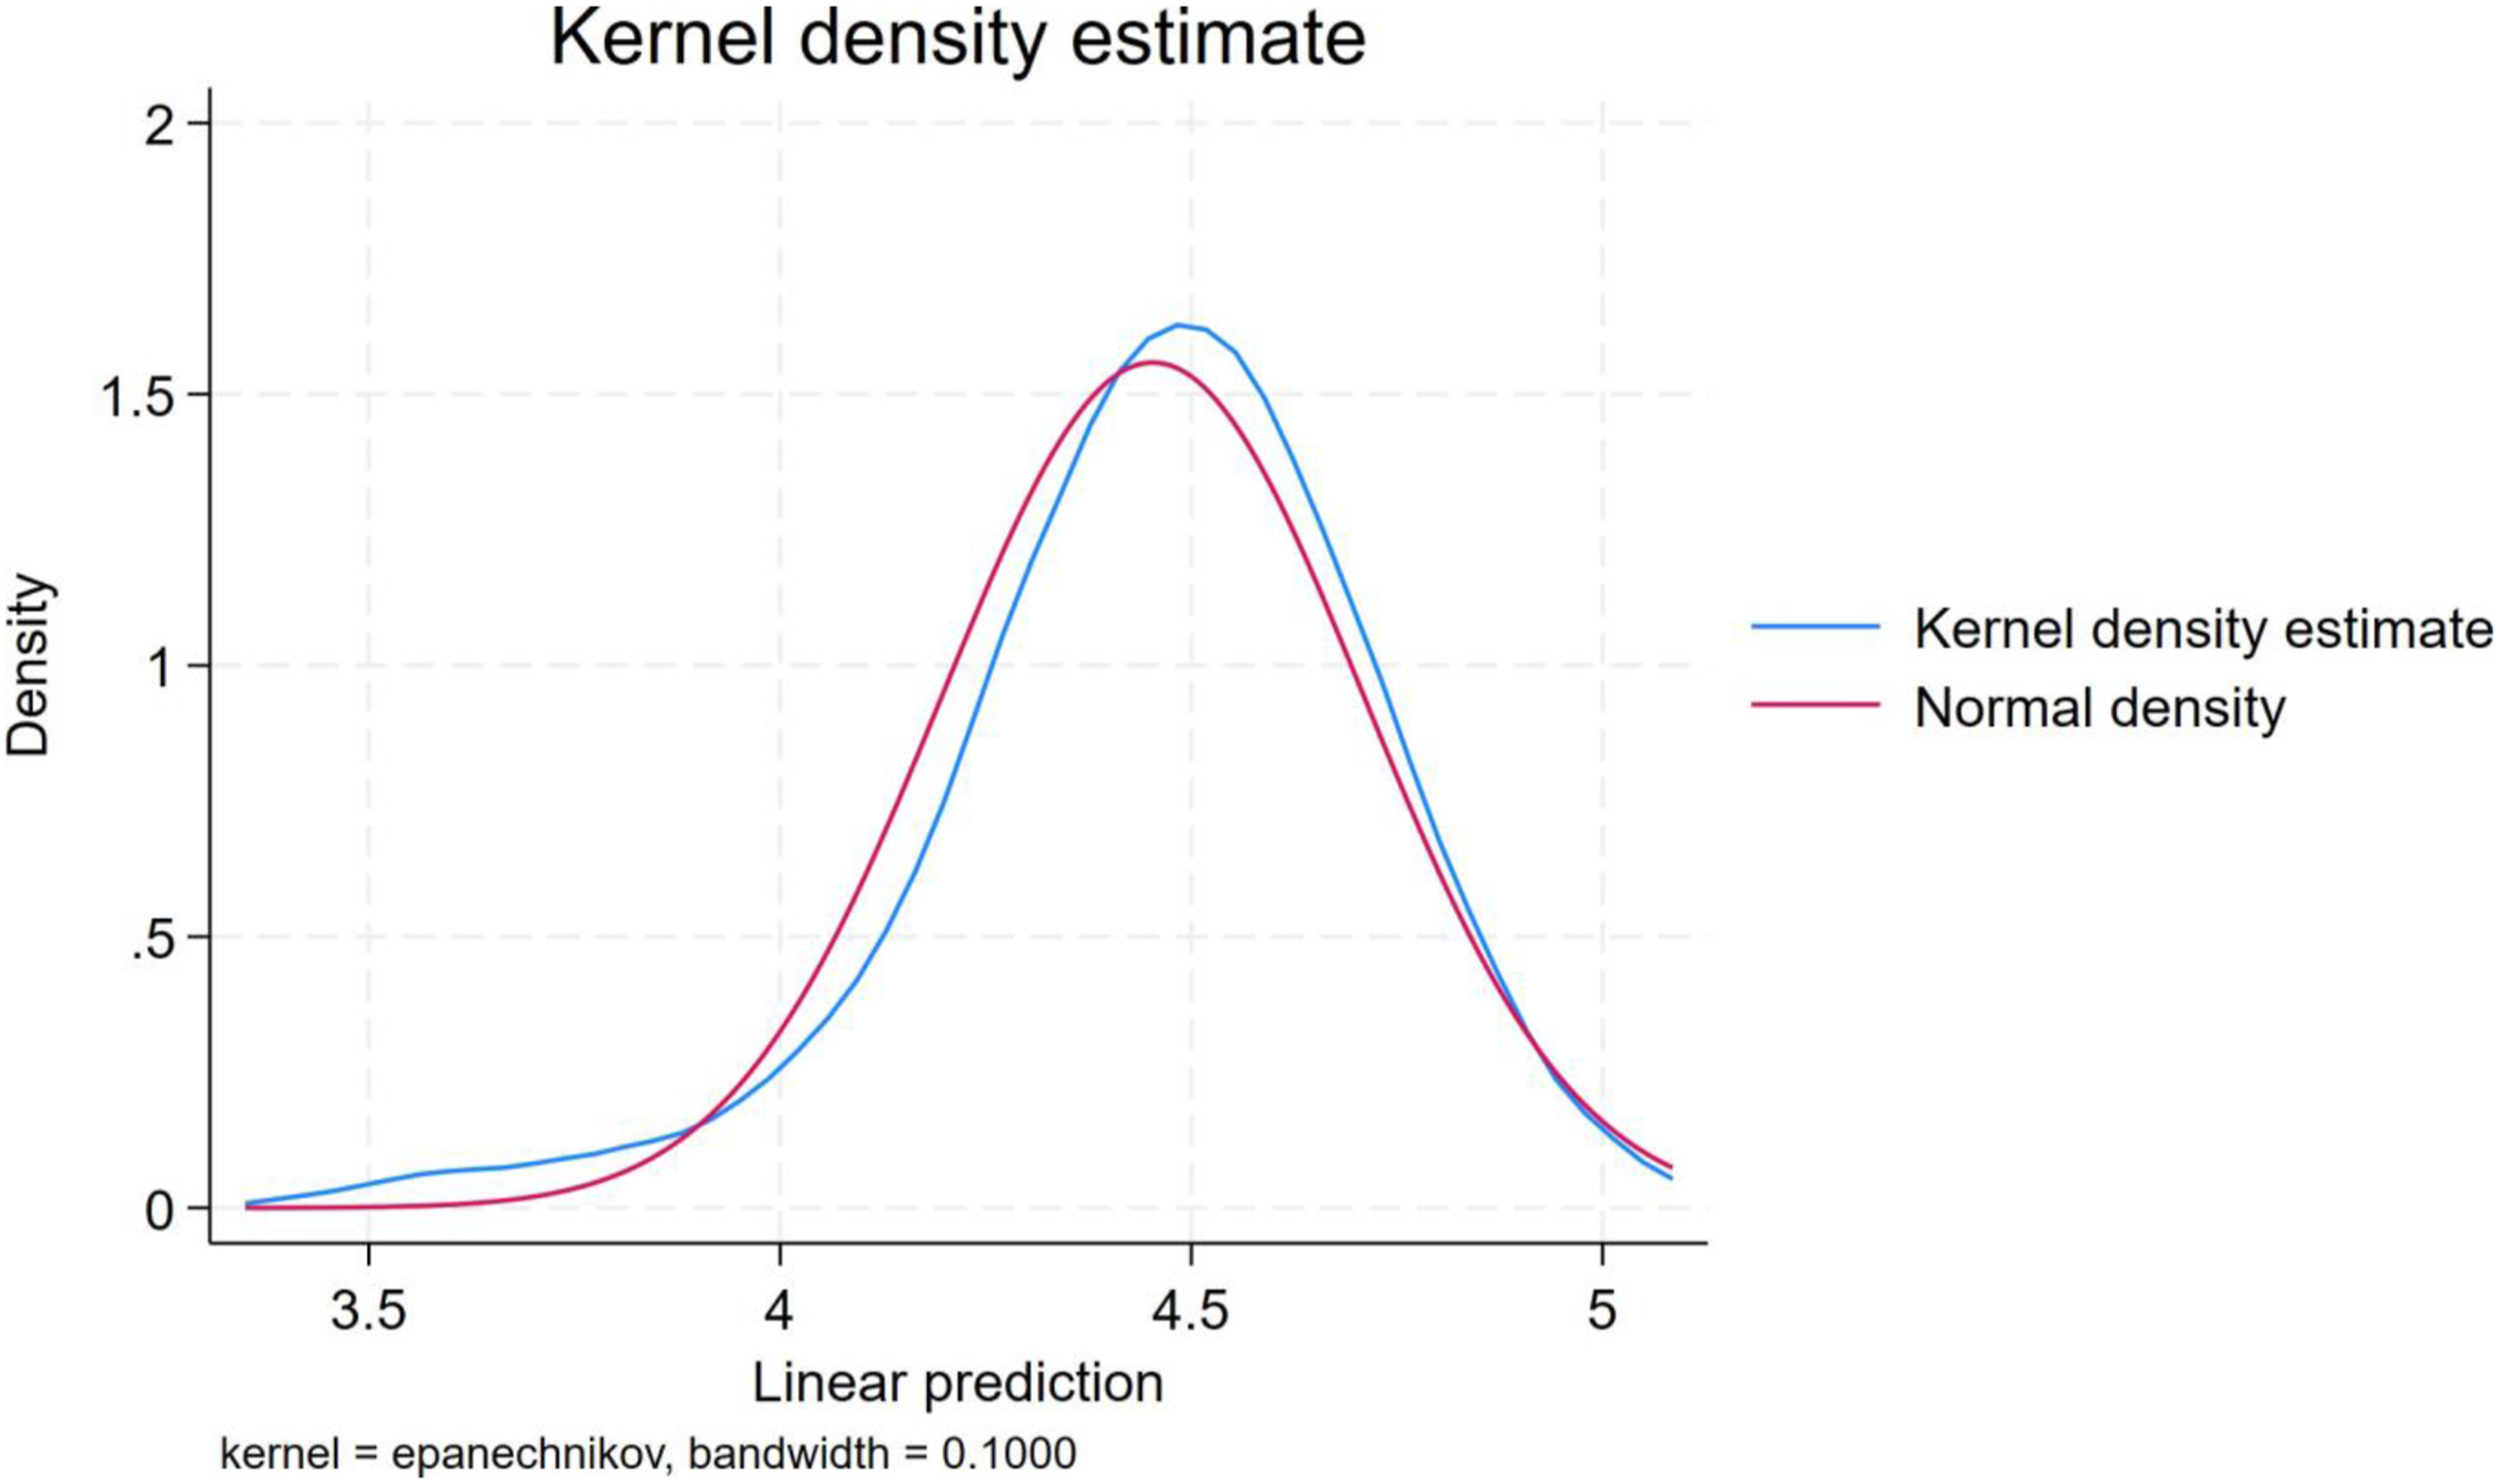
We also check the stability condition following the estimation of the PVAR model by examining whether all the roots of the companion matrix lie inside the unit circle. For the PVAR model to be stable, the modulus of each eigenvalue should be strictly less than one (Abrigo and Love, 2016). This condition ensures that the impulse-response functions and forecast-error variance decompositions have the usual interpretations. Graphically, we show this condition by plotting the eigenvalues with the real components on the horizontal axis and the complex components on the vertical axis. Figure 5, clearly shows that all the eigenvalues lie inside the unit circle, confirming that our PVAR model satisfies the stability condition. Test for stability of the PVAR estimates.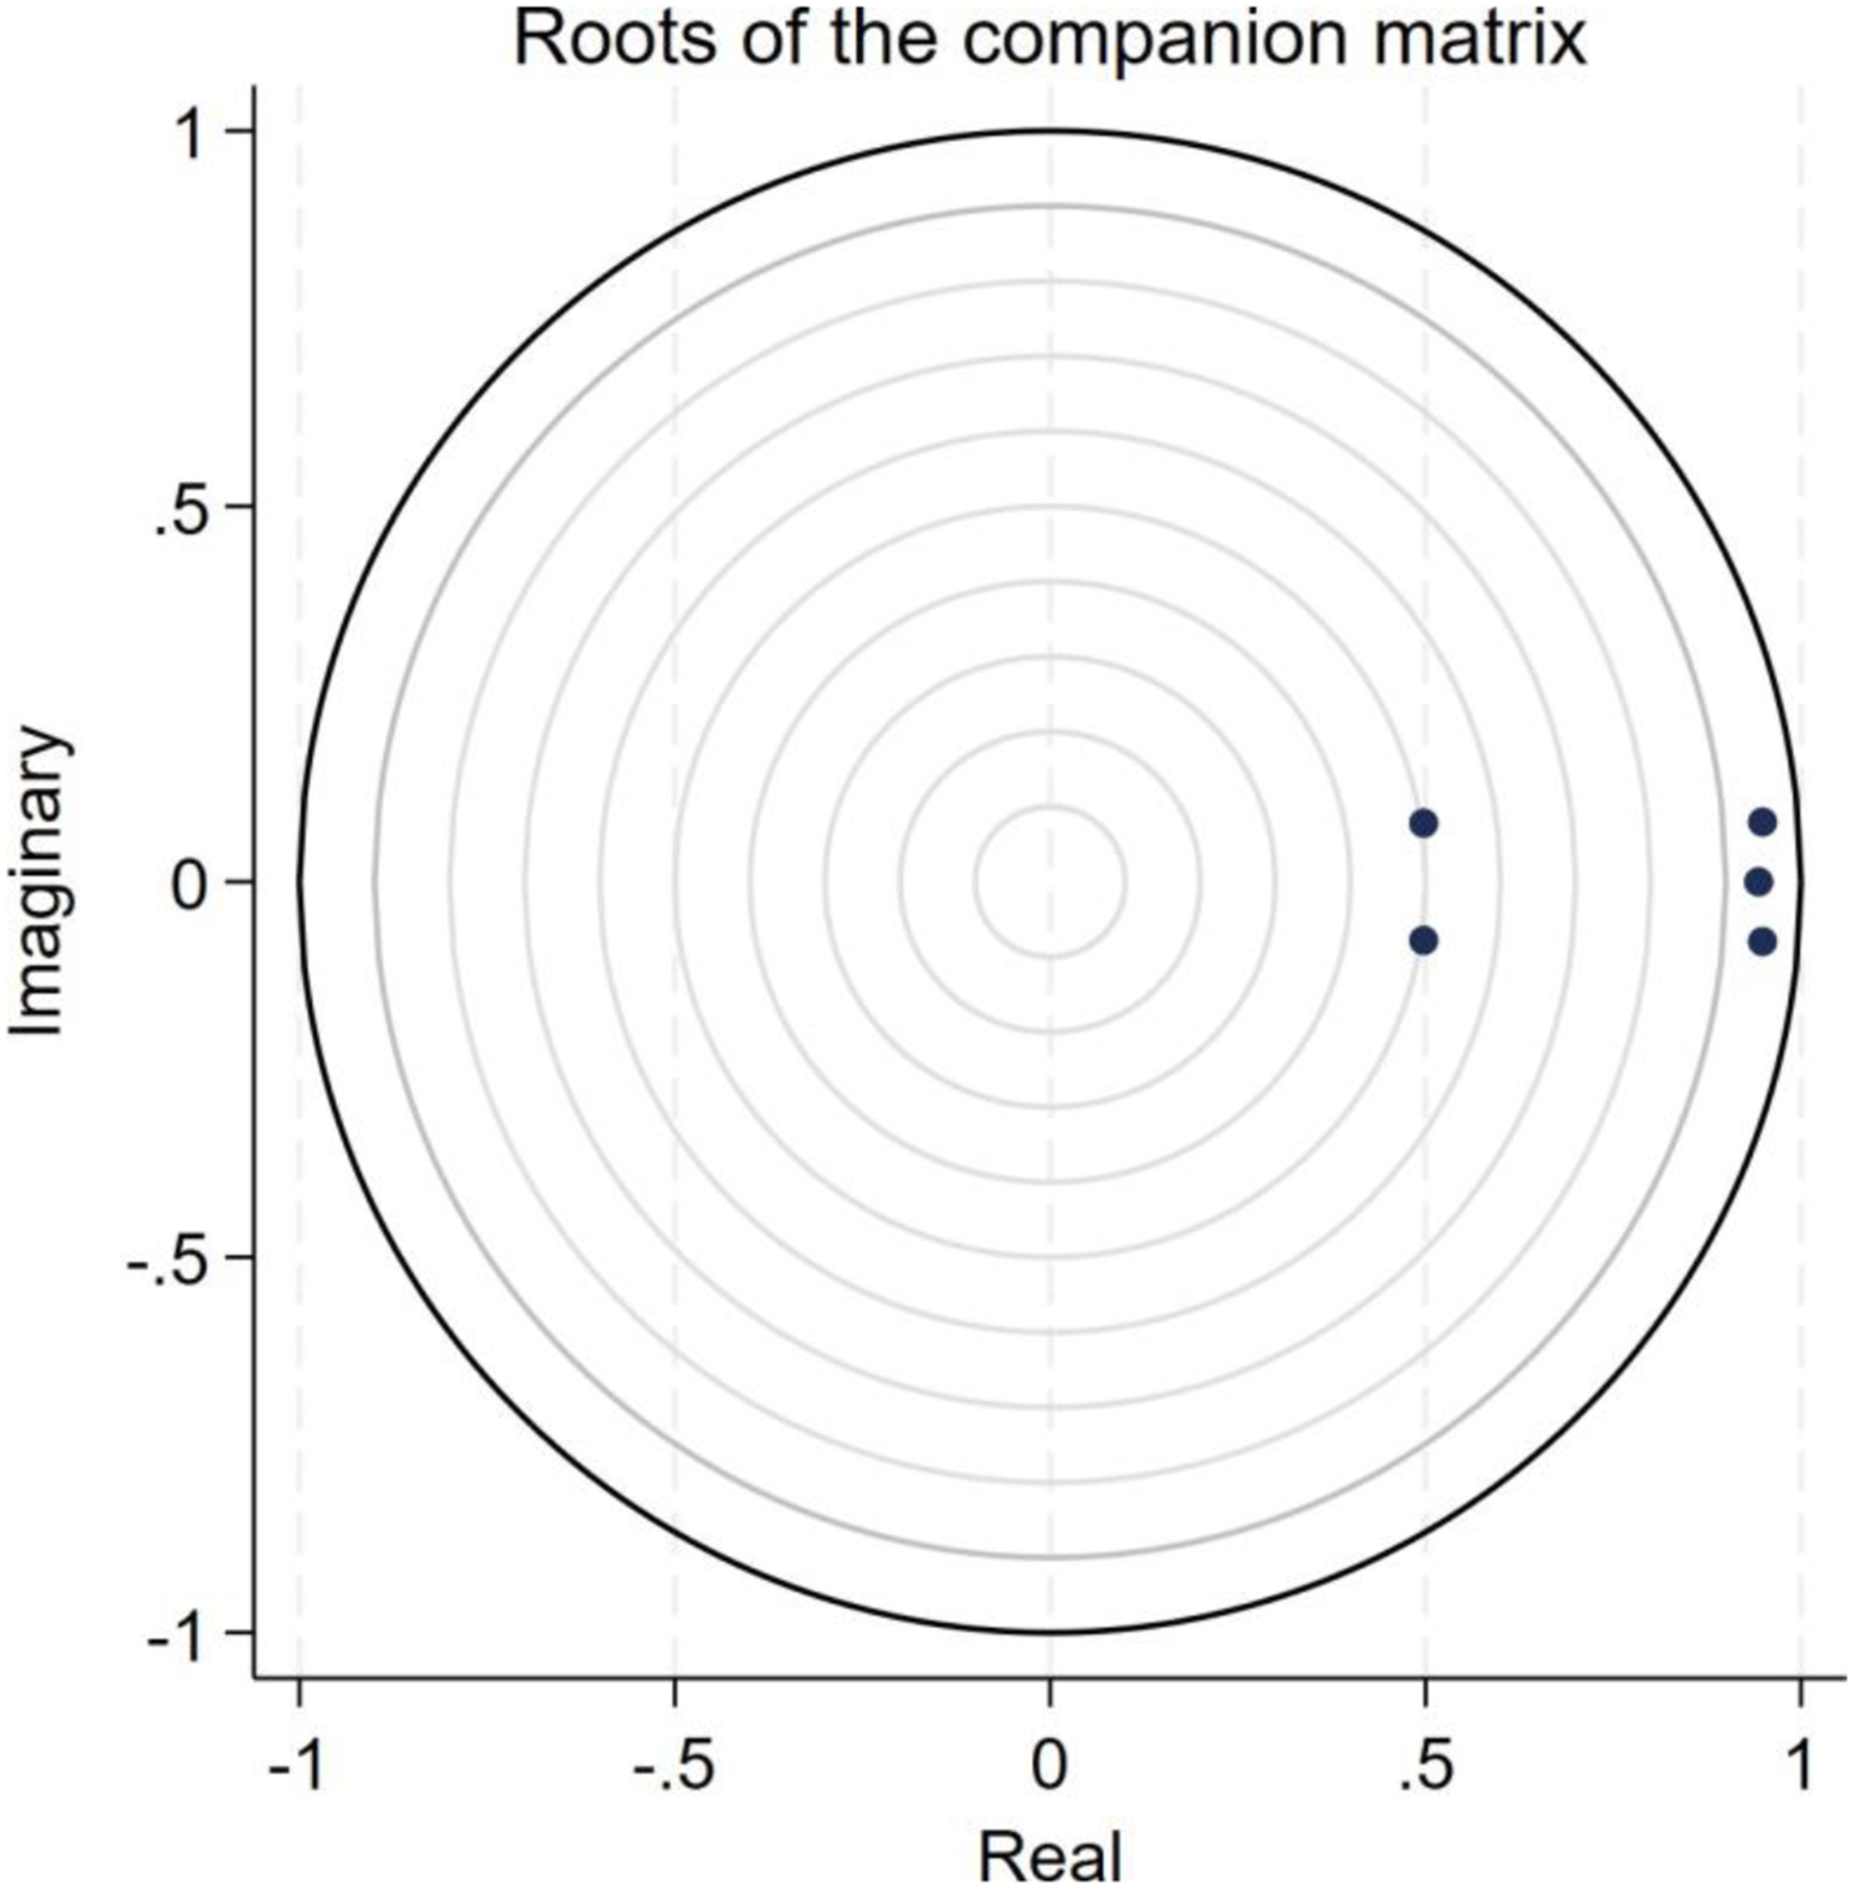
We also examine the sensitivity of the PVAR estimates by considering alternative estimations with different recursive ordering of the variables. In this case, SQV is ordered first and everything else remains the same. The results reported in Figure A1 in the Supplemental Appendix are very similar to the main results reported in Figure 3. This confirms that our results are less sensitive to alternative specifications and the main conclusion holds.
Heterogeneity and persistence
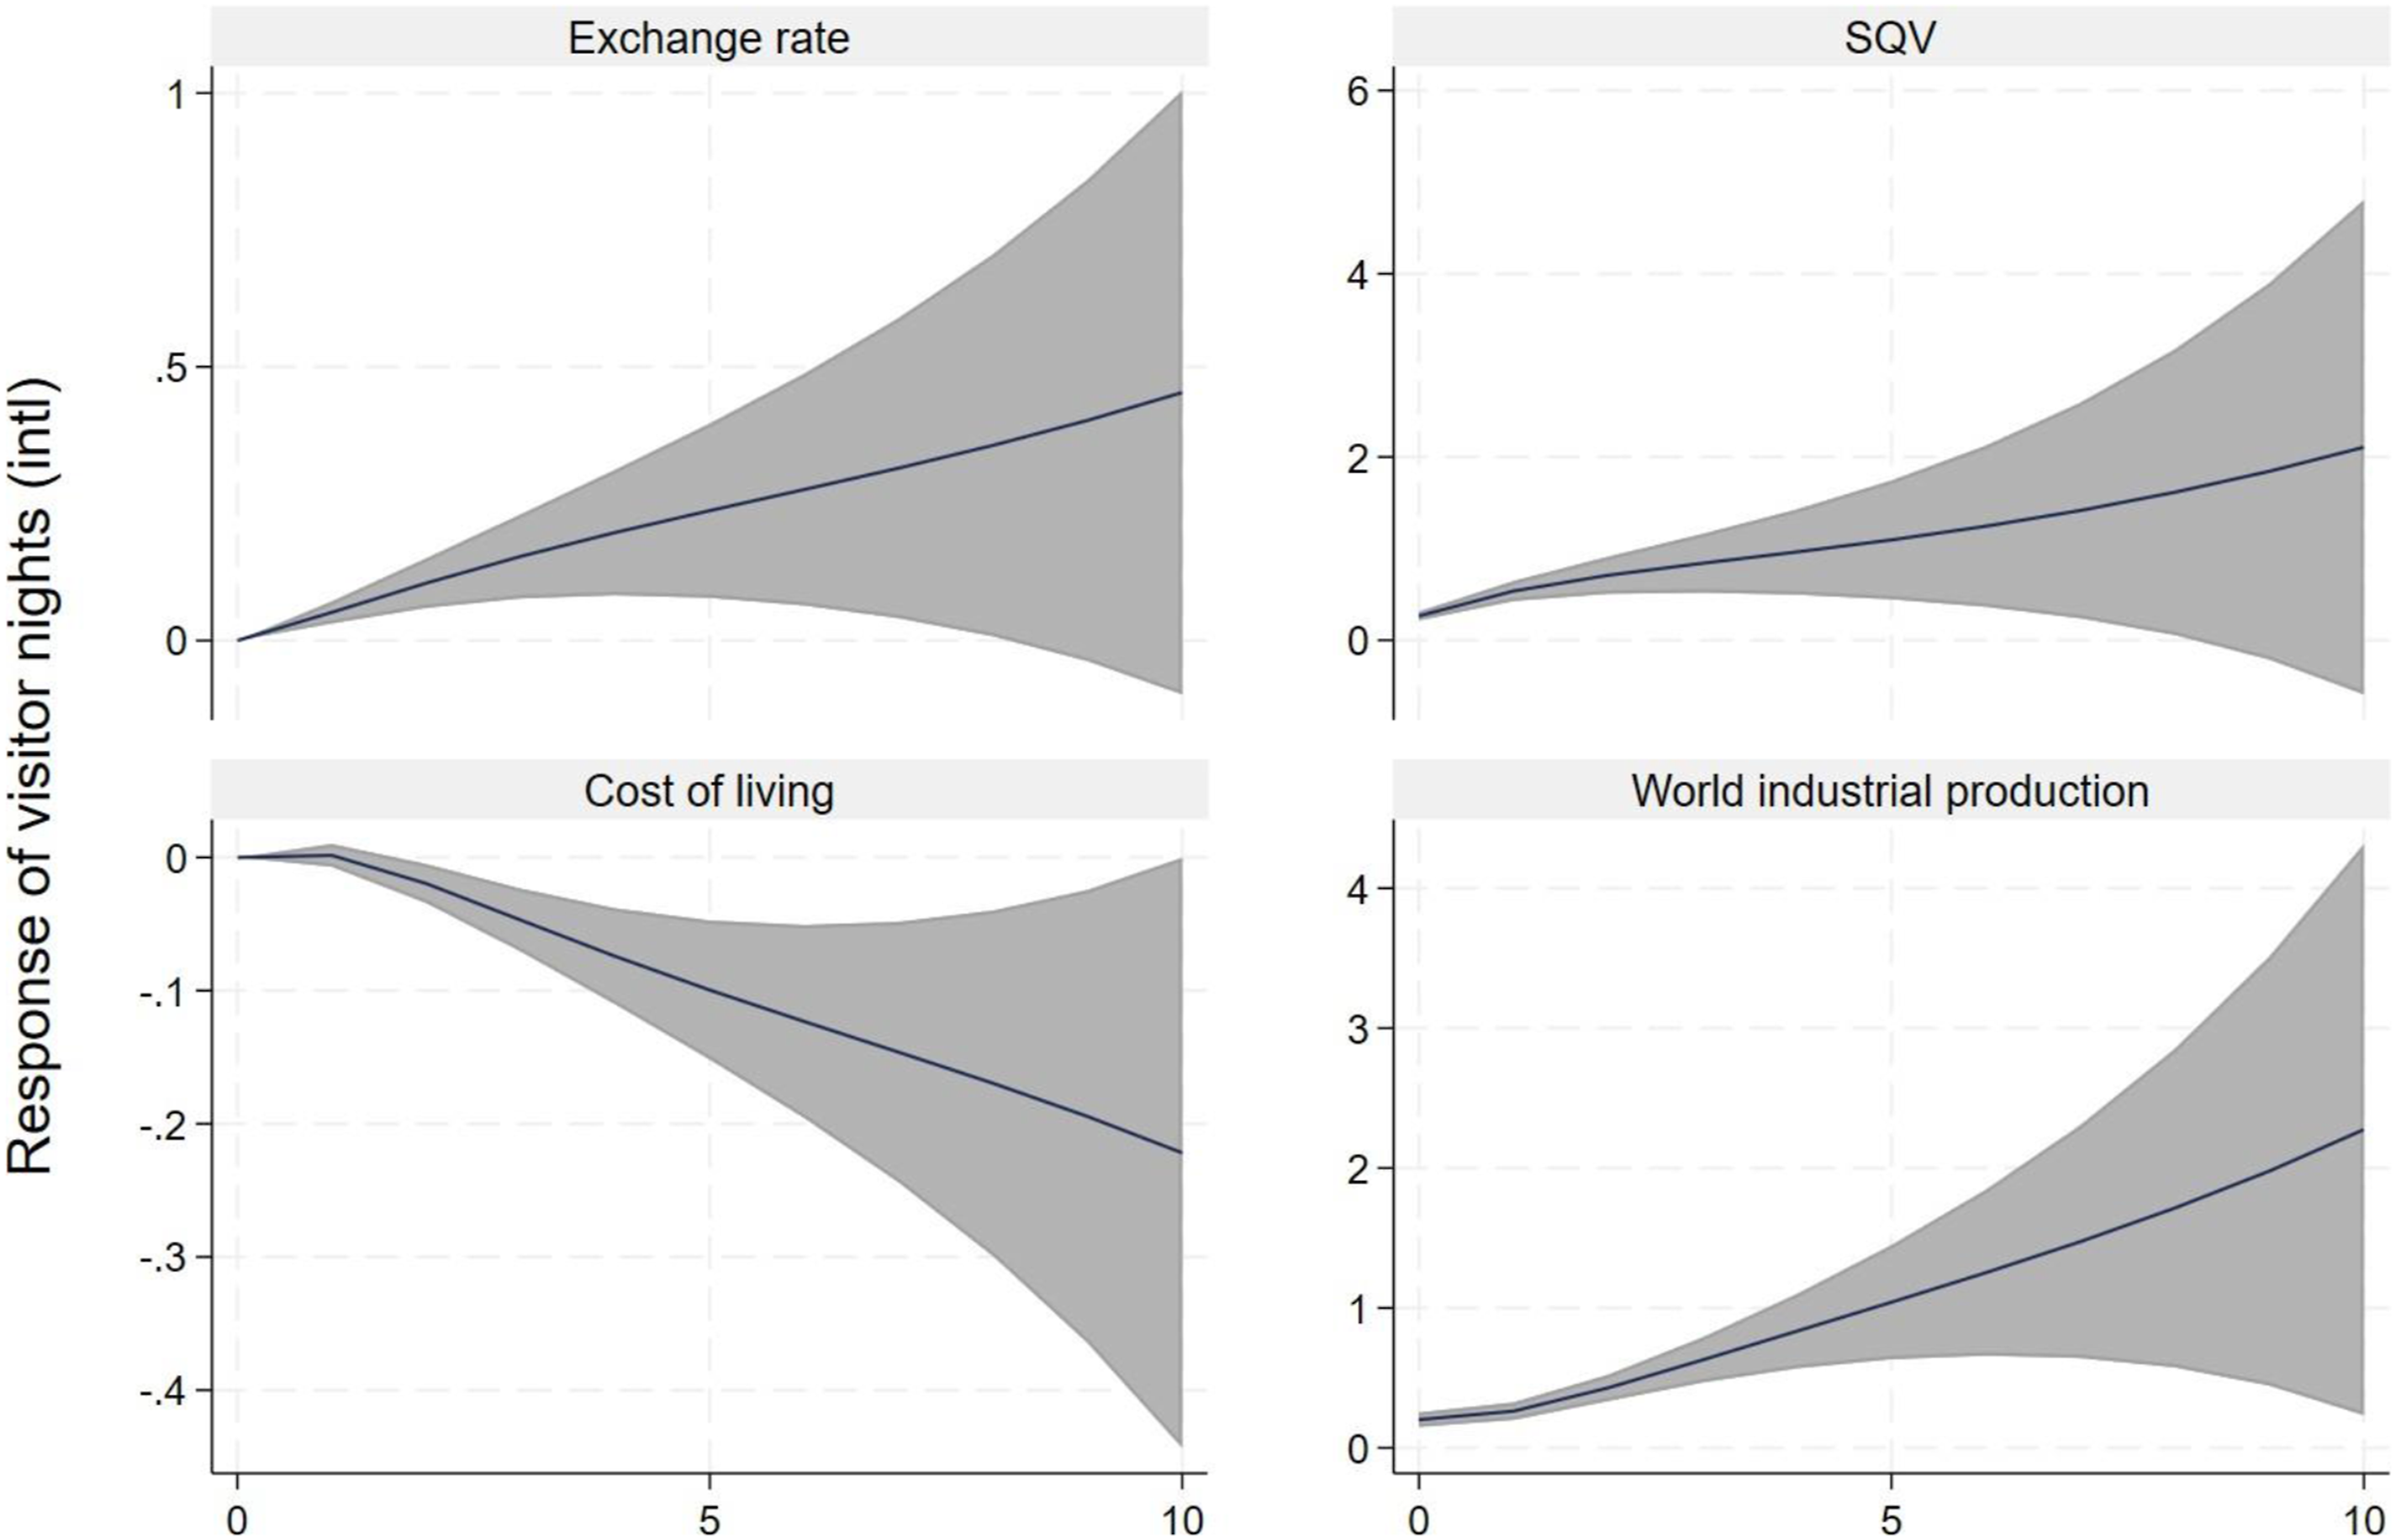
To assess whether the response of tourism demand varies by visitor type, we report the disaggregated impulse response functions by domestic (Figure 6) and international visitor nights (Figure 7). Clearly, both Figures show that the response of visitor nights to search intensity is positive and statistically significant. However, there is a stark difference in the magnitude and persistence of the effect of the shock. Specifically, the effect on domestic visitor nights is short-lived and hump-shaped with the effect dying in about four quarters. In contrast, the effect of the shock on international visitor nights is persistent and remains significant up to eight quarters following the shock in SQV. Orthogonalised impulse response functions of domestic visitor nights to a one standard deviation shock in SQV and covariates. Orthogonalised impulse response functions of international visitor nights to a one standard deviation shock in SQV and covariates.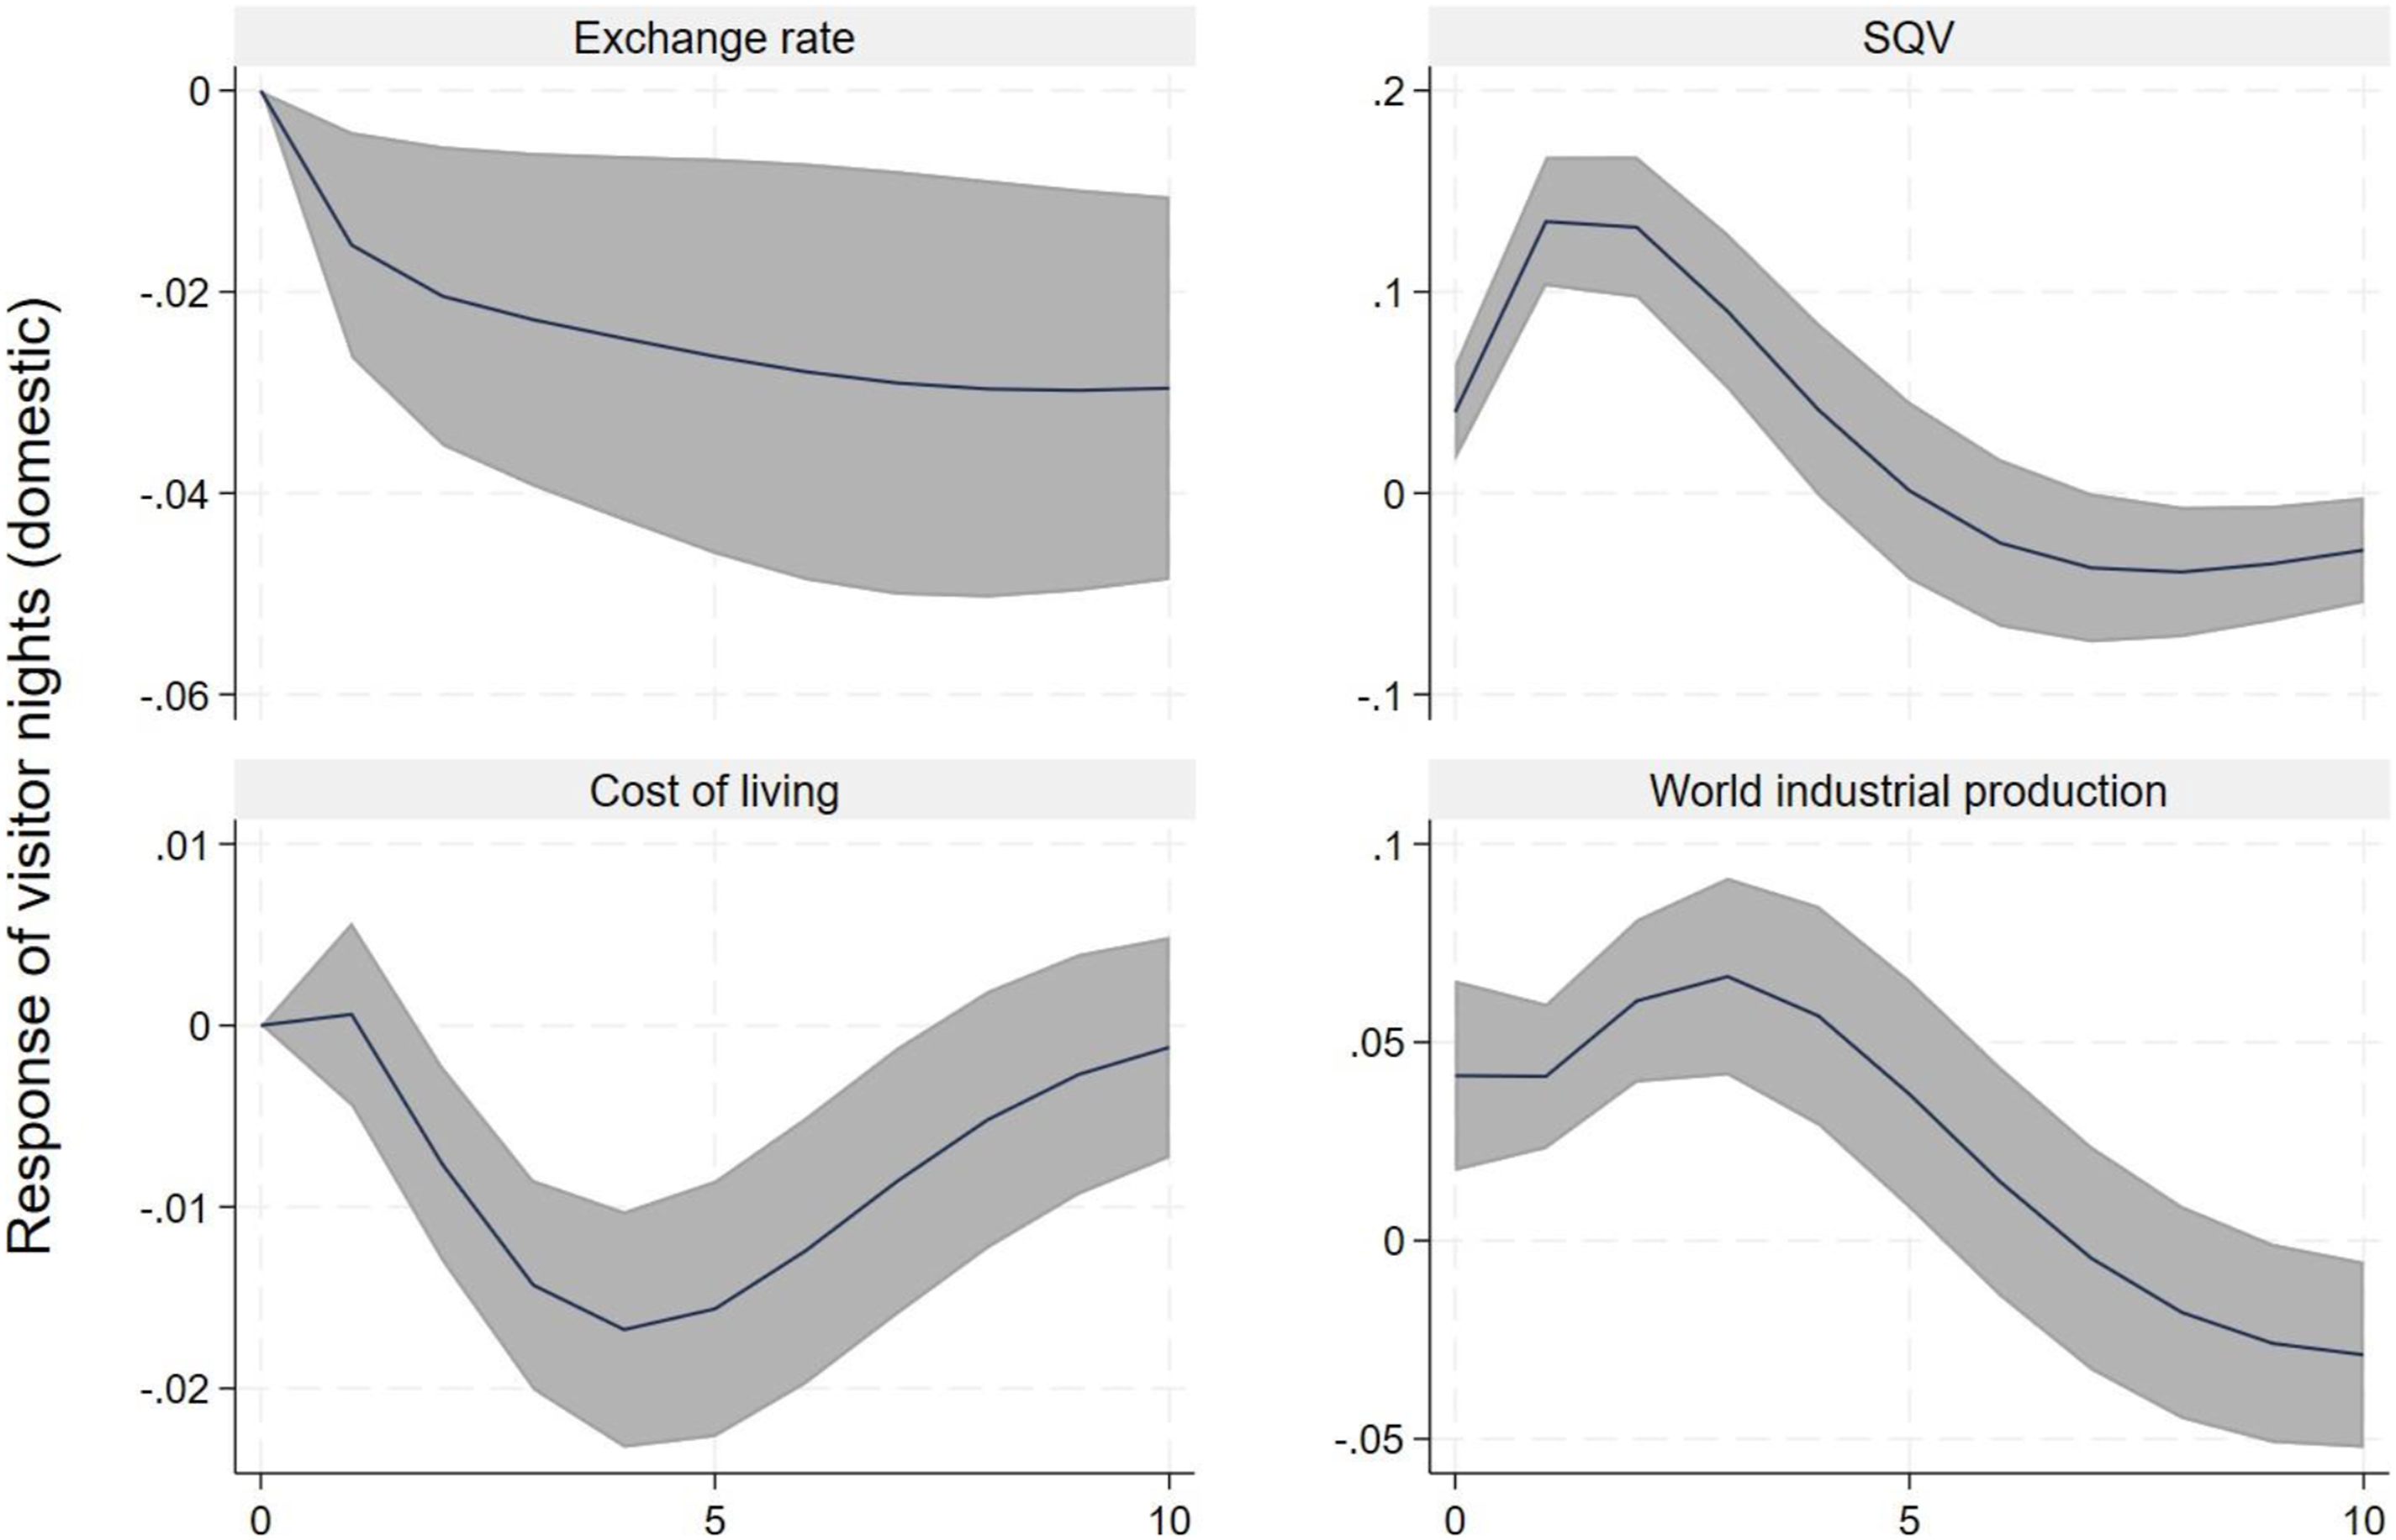
While the impulse response estimates provide informative insights about the magnitude and timing of the mean effects of a one-time structural shock in the explanatory variables on tourism demand, they do not necessarily represent the long-term effects of these shocks on tourism demand. To address this issue, we compute cumulative impulse responses of tourism demand to a shock in SQV and the other covariates in period t at horizon h by summing the impulse response estimates over 0 to h.
The estimated cumulative impulse responses of tourism demand to a one standard deviation shock in SQV and the covariates are reported in Figure 8. The Figure shows that the effects of the shocks (except for the exchange rate) on tourism demand are strongly persistent. Positive shocks in SQV and world industrial production have a persistent positive effect on tourism demand while a surge in cost of living has a persistent negative effect on it. The fact that the cumulative effects of the shocks are significantly different from the one-time orthogonalised responses suggests that it is crucial to account for the time dynamics in the shock process of these predictor variables to tourism demand over a longer time horizon (Hailemariam and Ivanovski, 2022). Cumulative impulse response functions of tourism demand to a one standard deviation shock in SQV and covariates.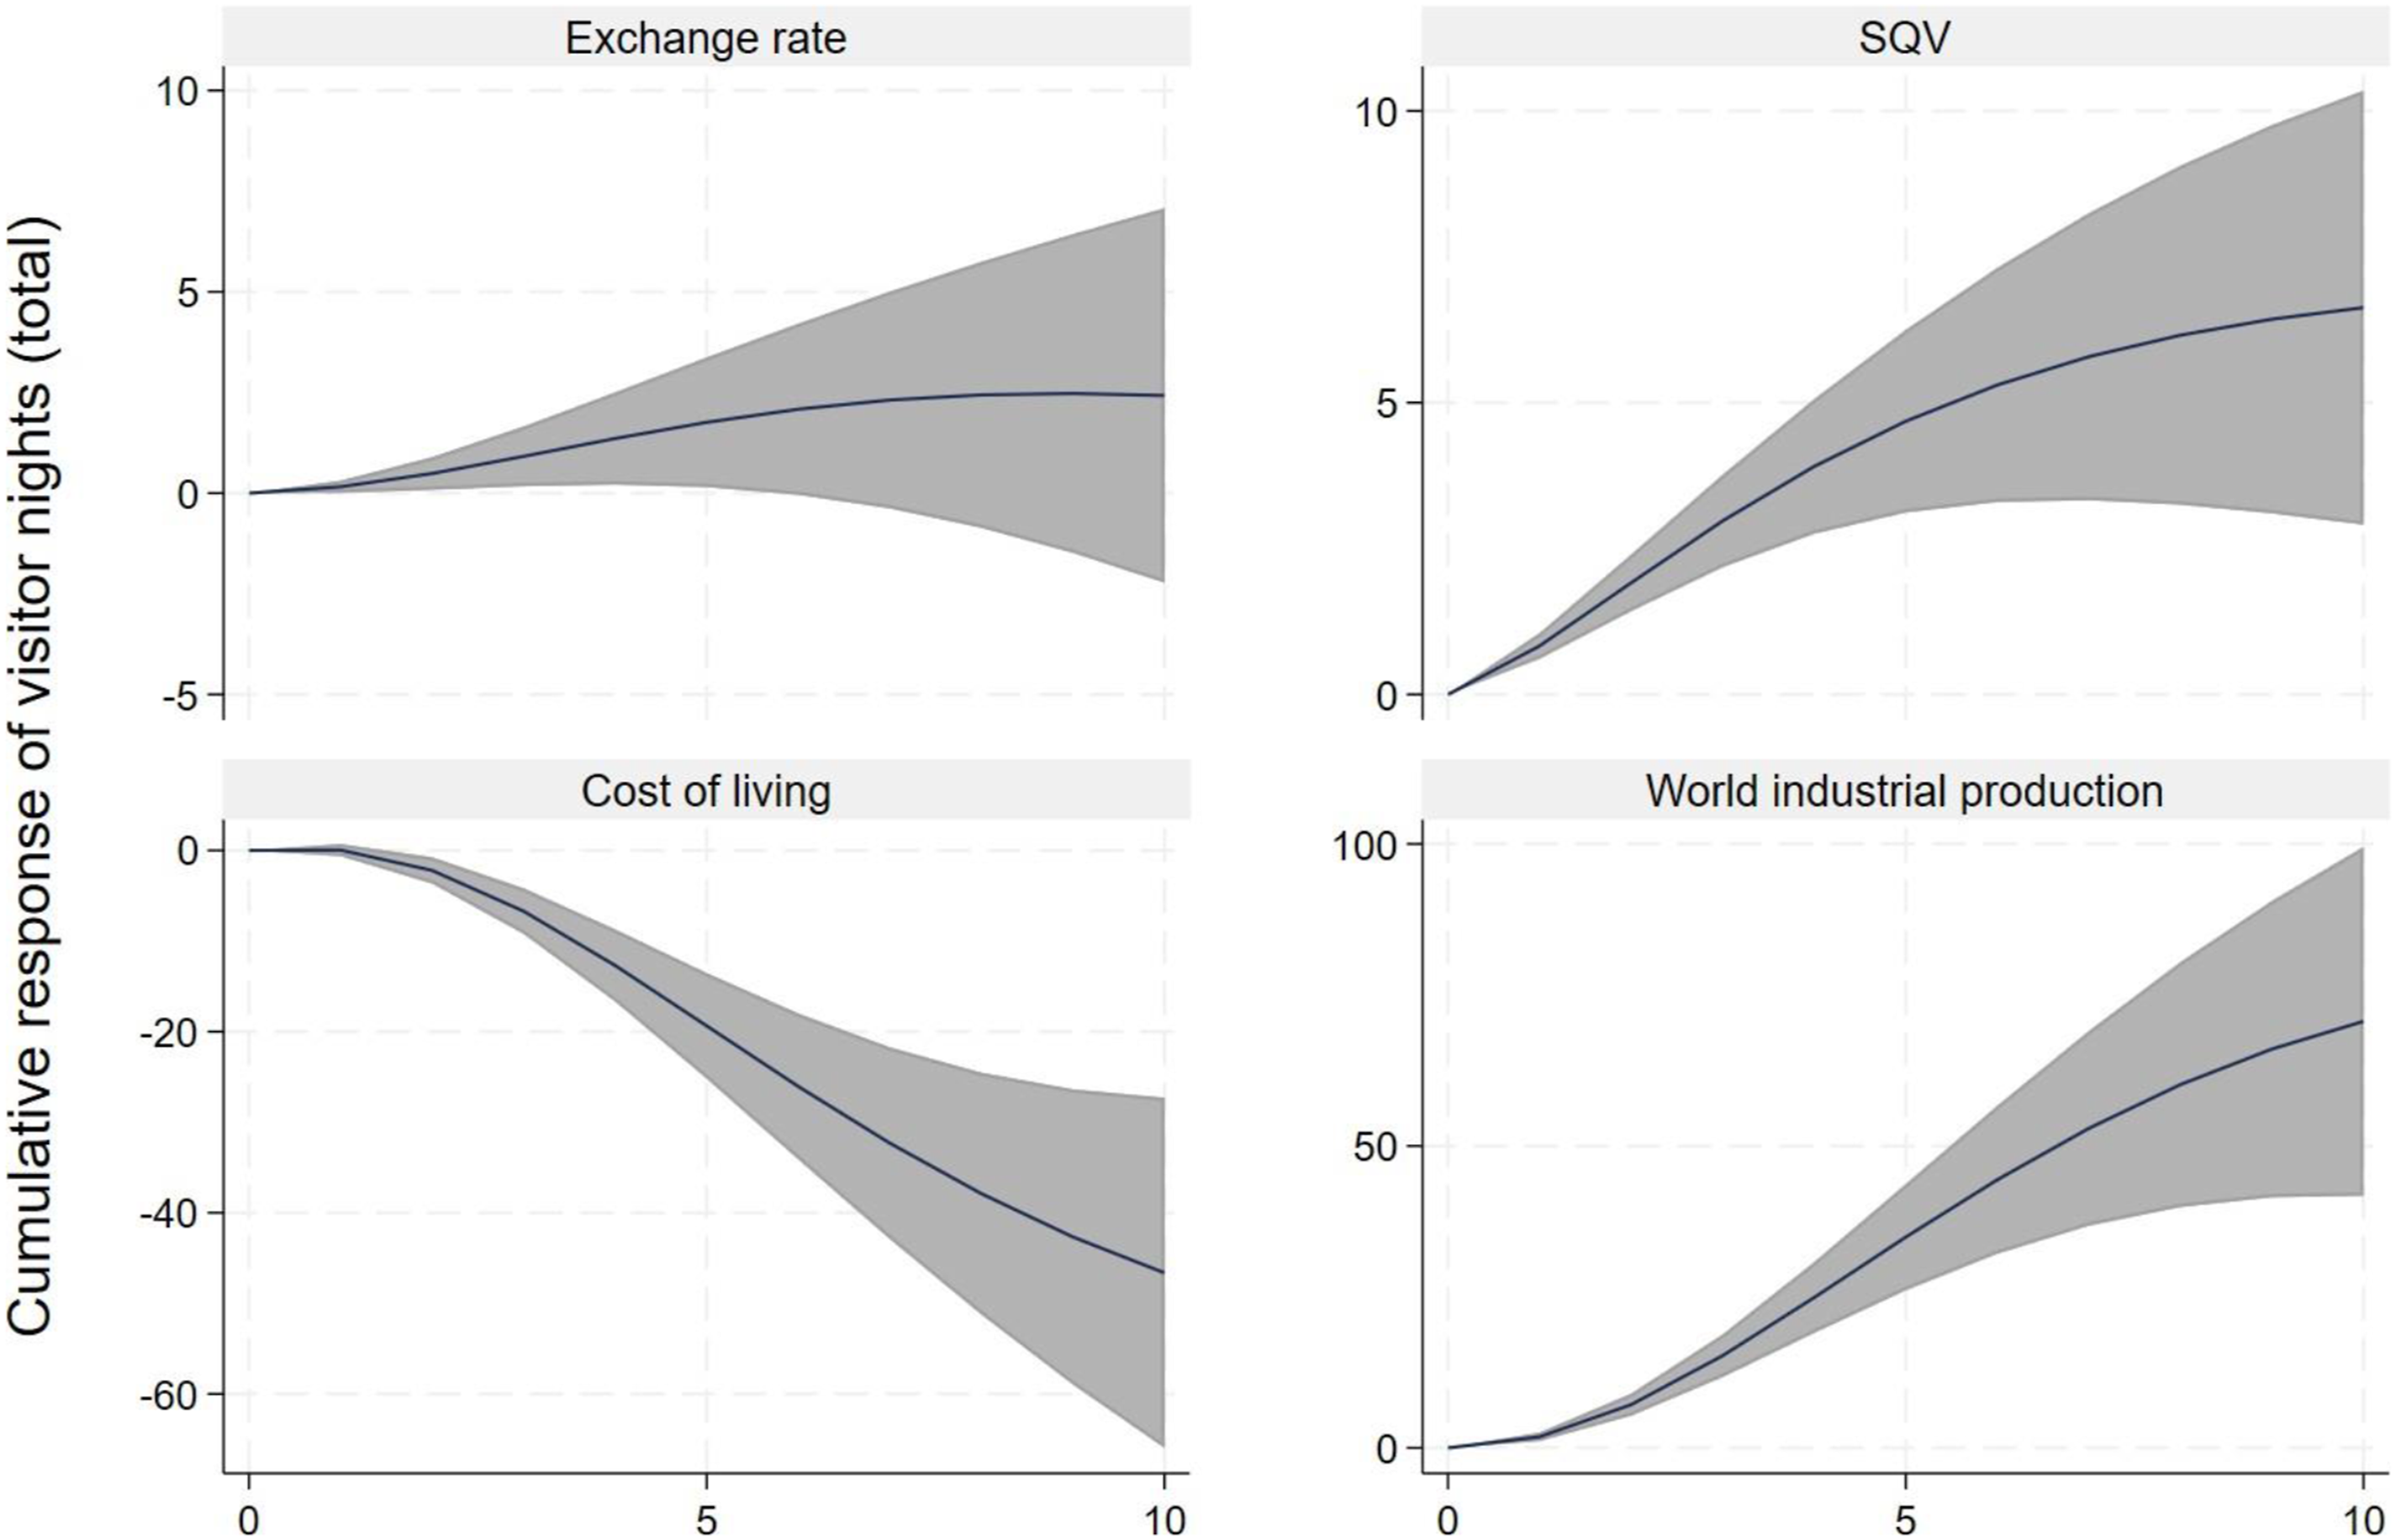
Robustness check
To ascertain the robustness of our results, we also use the number of visitors instead of visitor nights as an alternative measure of tourism demand. The estimated impulse response functions for number of visitors are presented in Figure 9. The results are statistically similar to the main findings. The response of tourism demand measured in visitor arrivals in response to positive shocks in SQV and a global surge in economic activities is positive and statistically significant. More precisely, Figure 9 shows that a one standard deviation positive shock in SQV leads to an increase in tourist arrivals by up to 1%. A similar result is obtained for the impacts of world economic activities. Also consistent with the findings in Figure 3, an increase in the cost of living has a negative and statistically significant effect on tourism demand while exchange rates seem to have little or no effects. For further checks on the robustness of our results, we also perform a subsample analysis for the pre- and post-COVID-19 periods. The results reported in Figure A2 in the Supplemental Appendix are generally consistent with the main findings. Orthogonalised impulse response functions of visitor arrivals to a one standard deviation shock in SQV and covariates.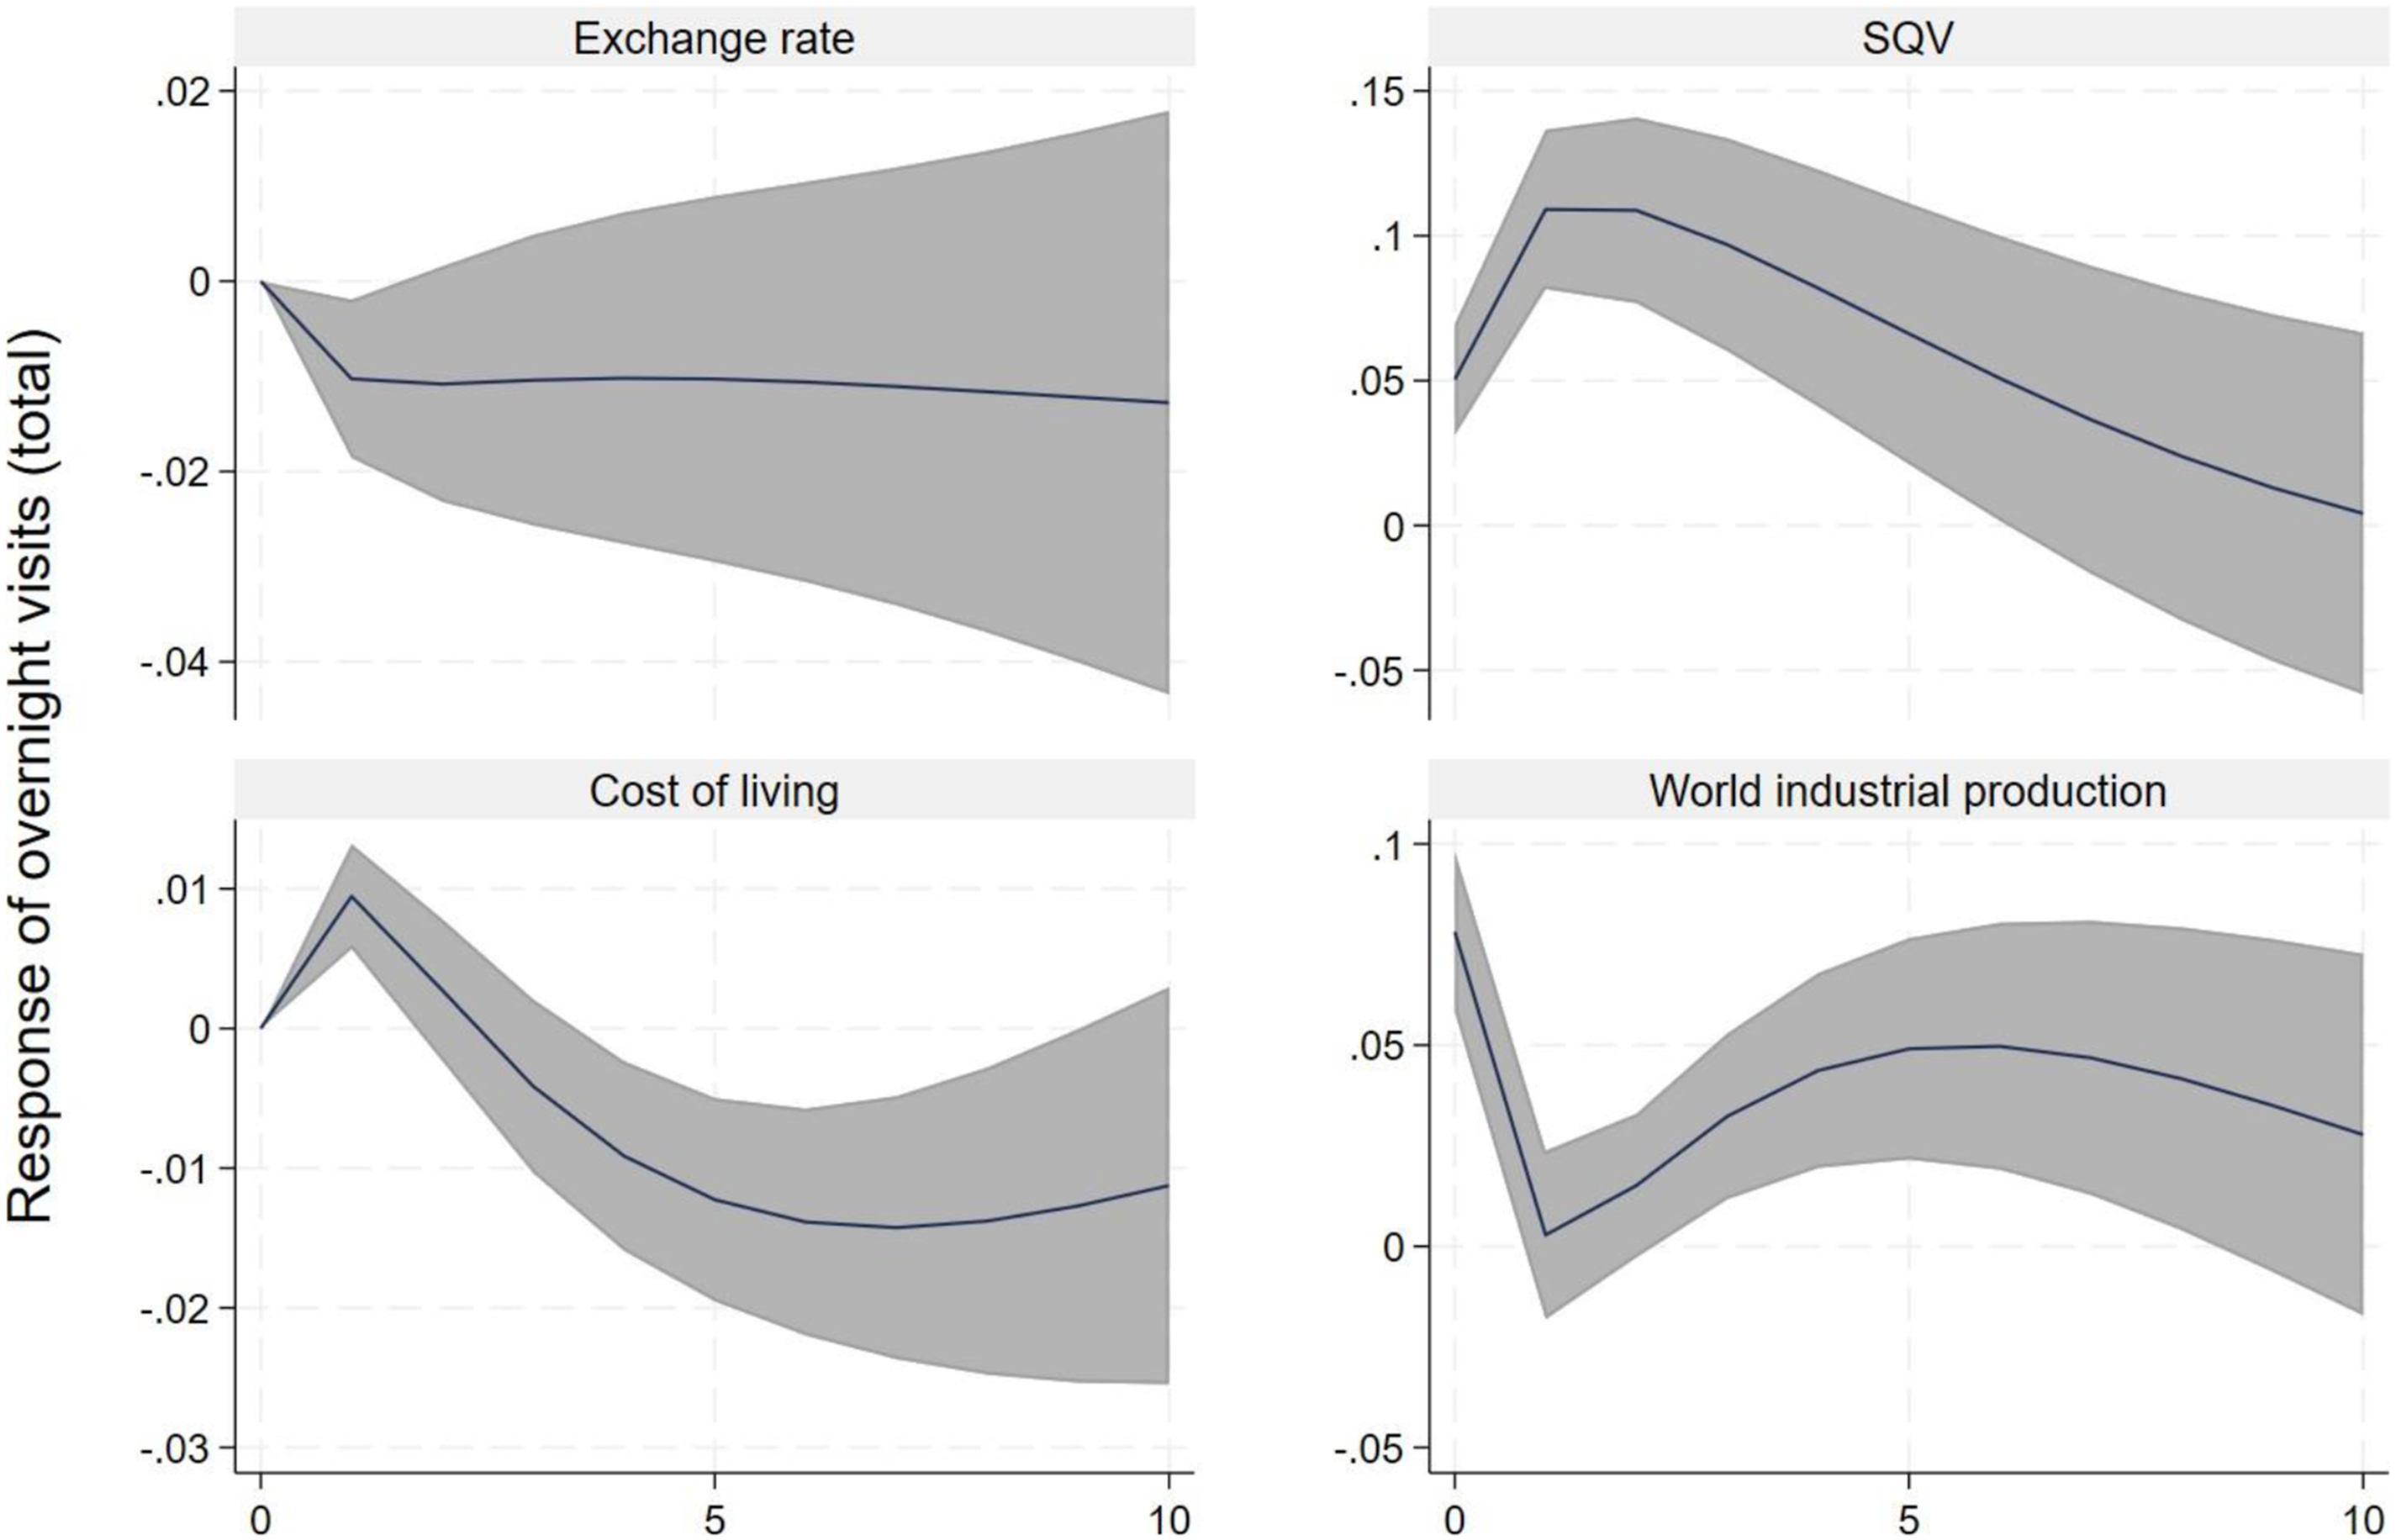
Comparing the results with the findings of the existing literature, our results lend support to the findings of some recent studies (Bangwayo-Skeete and Skeete, 2015; Dergiades et al., 2018; Havranek and Zeynalov, 2021; Wen et al., 2019). Although the majority of the studies focused on predictions of tourism outcomes using big data, a common consensus is that there is a positive association between Internet search intensity and tourism demand. The work on establishing causality using machine learning and big data is at the infancy stage and it is crucial to address potential biases in establishing causal inference (Bokelmann and Lessmann, 2019; Dergiades et al., 2018).
Our results show that relative Internet search intensity behaviours, which capture search queries related to travel, accommodations, flights and other tourism-related activities, can serve as reliable indicators of actual inbound tourist flows. This is consistent with the rational expectations theory that consumers are forward-looking; hence they research travel options online before making bookings or travelling. Earlier empirical studies provide evidence of the surge in travel related search intensity followed by an increase in actual inbound tourist flows (Bangwayo-Skeete and Skeete, 2015). This is consistent with the findings from the pioneering work of Choi and Varian (2012) that Google Trends data can predict real-world trends in economic variables, including tourism demand by providing timely insights into consumer behaviour.
Önder (2017) also finds that Google search data enhances the performance of tourism forecasting models, providing valuable insights for destination managers and policymakers to formulate strategies in response to real-time shifts in the interests of tourists. These results are supported by the findings of Bangwayo-Skeete and Skeete (2015) that focus on forecasting tourist arrivals in the Caribbean using search intensity as a valuable predictor for short-term tourism demand. Along these lines, Artola et al. (2015) also find that Google Trends data could effectively forecast short-term tourism demand for Spain while Dergiades et al. (2018) argue that search engine data is used to predict tourist flows to Greece. Our study complements this strand of literature by establishing a causal link between search behaviour and actual tourism demand.
Granger causality test
Granger causality test.
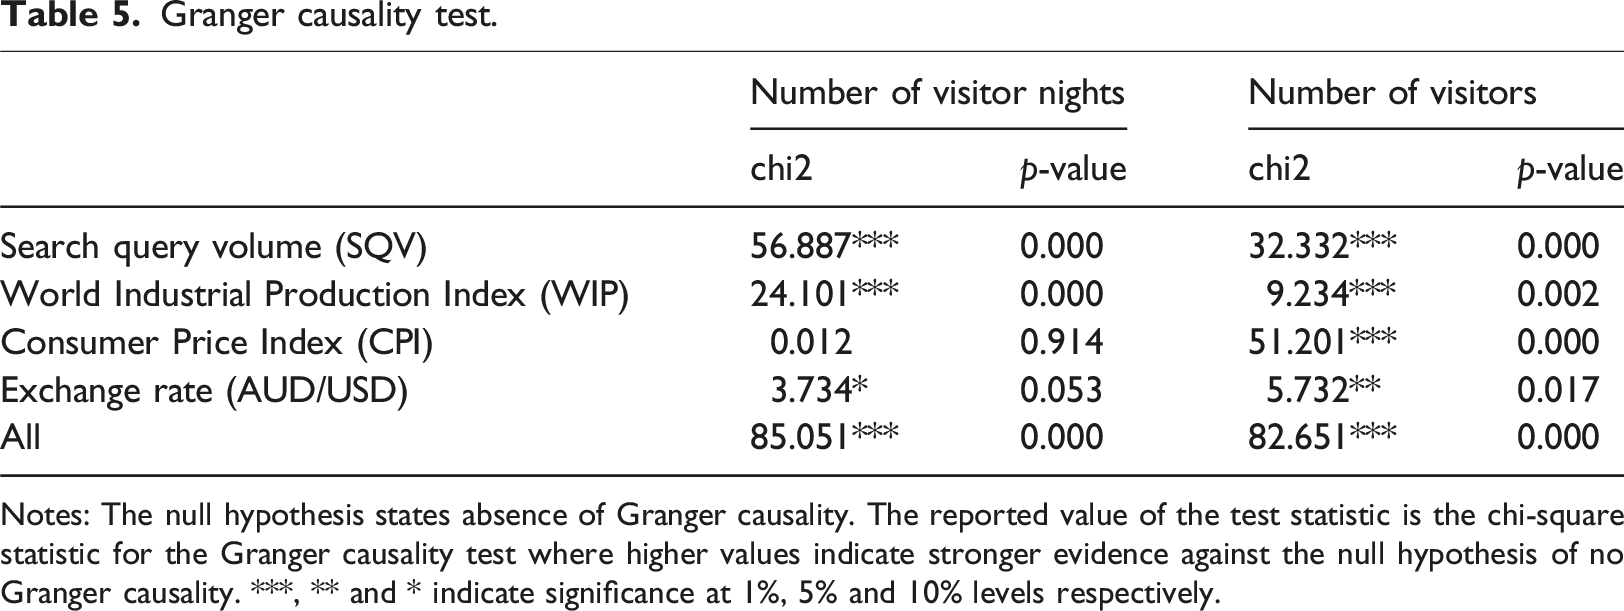
Notes: The null hypothesis states absence of Granger causality. The reported value of the test statistic is the chi-square statistic for the Granger causality test where higher values indicate stronger evidence against the null hypothesis of no Granger causality. ***, ** and * indicate significance at 1%, 5% and 10% levels respectively.
As shown in Table 5, the Granger causality test strongly rejects the null hypothesis of no causality from Internet search behaviour to actual inbound tourism flows regardless of the measure of tourism demand (visitor nights and number of visitors). The test statistic is significant at 1% significance level, confirming the causal relationship between search behaviour and inbound tourism flows. The same is true for world economic activities and for the overall test of causality. The causal effect of the cost of living is stronger when the number of visitors is used as the outcome variable instead of the number of visitor nights.
Forecast error variance decomposition
An appealing feature of the PVAR method is that it allows for the decomposition of the magnitude of the contributions of each shock to the variations in tourism demand using the forecast-error variance decomposition (FEVD) technique. Our results from the FEVD analysis provide insight into why variations in the Internet search intensity index from Google Trends have explanatory power in predicting tourism demand. The estimates from FEVD are useful to quantify the proportion of the forecast error variance of tourism demand that can be attributed to shocks in the independent variables in our model, including the index of Internet search intensity.
FEVD.
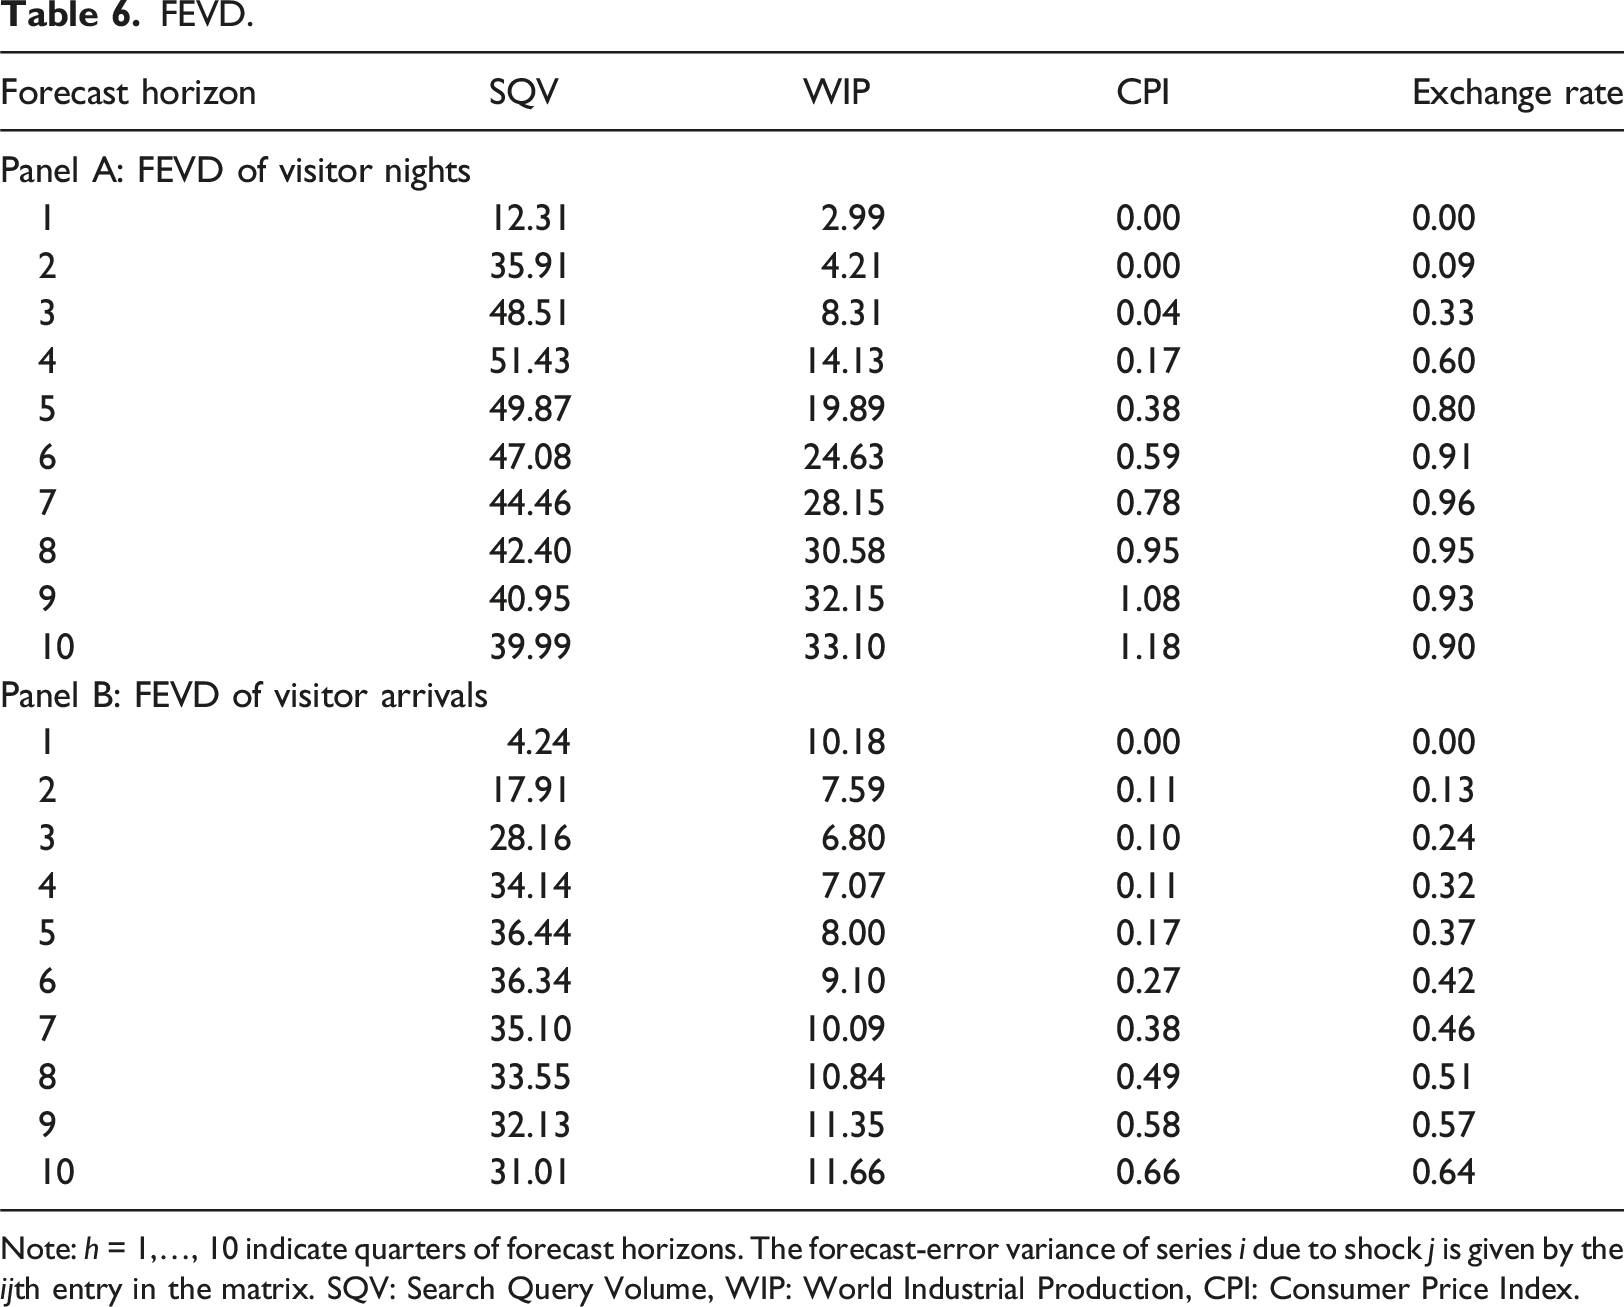
Note: h = 1,…, 10 indicate quarters of forecast horizons. The forecast-error variance of series i due to shock j is given by the ijth entry in the matrix. SQV: Search Query Volume, WIP: World Industrial Production, CPI: Consumer Price Index.
Panel B of Table 6 presents the contributions shocks from each explanatory variable to the variations in the number of inbound visitors. Consistent with the results in Panel A, the shocks in Internet search intensity contributed to the largest share of variations in the number of inbound visitors, followed by the shocks in world industrial production. Together, shocks in these two variables account for over 45% of the variations in the number of inbound visitors.
Comparing our results with the findings of previous studies, our findings lend support to the conclusions of the study by Dergiades et al. (2018) and Bangwayo-Skeete and Skeete (2015). These findings show that shocks in relative Internet search intensity explained a significant portion of the variations in tourism demand within the first few months following the shock. Using Mixed Data Sampling (MIDAS) model, Bangwayo-Skeete and Skeete (2015) find that search intensity explained a significant portion of the variations in future tourist arrivals. Interestingly, the variations in search intensity capture both spontaneous and planned changes in tourist behaviour, providing strong explanatory power for tourism activities.
Conclusion
Tourism is a vital contributor to Australia’s economy. As such, understanding the drivers of tourism demand has become even more critical in the post-pandemic recovery phase. Given the importance of the sector and the challenges for speedy recovery and sectorial diversification, it is crucial to understand the response of actual tourism demand to global events to inform policy for effective destination management. This paper examined the role of digital engagement, captured through Internet search intensity as a leading indicator of actual inbound tourism flows. Specifically, we examined how shocks to search intensity volumes influence tourism demand outcomes using a dynamic PVAR model applied to subnational quarterly data.
In response to our first research question on how tourism demand responds to shocks in Internet search intensity, our findings indicate a strong and positive causal relationship. Specifically, a one-standard-deviation positive shock in SQV leads to a statistically significant rise in inbound tourism flows, with over 35% of the variation in visitor arrivals and more than 50% of the variation in visitor nights explained by changes in search intensity.
Addressing our second question on persistence, the effects of a search intensity shock are not short-lived. Our impulse response analysis shows that the impact endures over several quarters following the SQV shock, reflecting the sustained nature of travel planning and consumer interest captured by increased search activity.
Regarding the third research question, whether effects vary by visitor type, we find heterogeneous impacts. The response is notably stronger and more persistent for international visitors than for domestic ones, suggesting that search behaviour is particularly indicative of long-haul travel planning.
These findings provide both practical and methodological contributions to the literature. On the practical side, the findings support the use of real-time digital search behaviours serve as early indicators of tourism demand, offering policymakers and destination marketers a timely, cost-effective tool for monitoring and forecasting visitor flows. For example, tourism agencies can respond to a surge in online search activity by increasing promotional investments, tailoring messaging, or deploying targeted incentives to convert interest into actual visits.
From a methodological standpoint, the use of PVAR allows us to go beyond simple correlations and explore the dynamic interdependencies and feedback loops within the system. This approach enhances causal inference and strengthens the case for using big data as a predictive and policy-relevant input. By integrating search behaviour into a rigorous dynamic framework, the study advances the literature on tourism demand forecasting. Unlike previous studies that extensively used time series models and machine learning approaches to establish correlations (see Wu et al., 2024), this study focuses on uncovering the underlying causal relationship. This is crucial to enhance our comprehensive understanding of destination-specific tourism demand drivers.
Importantly, our findings respond to the broader “So what?” question by highlighting the strategic value of digital presence. The results suggest that real-time digital data on search behaviour can serve as a low-cost, timely predictor for tourism demand, enabling quicker response by tourism agencies and better resource allocation. Digital tourism campaigns, such as Tourism Australia's Come and Say G’day, gain new empirical support through our results, emphasising the link between increased online engagement and significant returns in terms of economic outcomes. Our back-of-the-envelope calculation shows that a 10% rise in SQV translates to an estimated $1.4 million increase in tourism GDP, providing a compelling economic case on the importance of integrating digital strategies. Enhancing online presence through improved search engine optimisation and user-friendly websites tends to foster travel decisions by tourists to destinations that will translate to economic values and job opportunities for the local economies. Thus, our study underscores the importance of aligning tourism strategy with digital trends and adopting big data-driven policy approaches.
While our analysis is grounded in the Australian context, the implications extend globally. In an era of digital transformation and growing emphasis on sustainable, data-informed tourism management, the role of Internet search data can inform international best practices. Future research can build on this by applying similar frameworks to other countries, incorporating alternative data sources such as social media or mobile phone data, and exploring demand-side heterogeneity across demographic or cultural segments.
Supplemental Material
Supplemental Material - Come and say G’day: Using search engine data to understand the dynamics of tourism demand in Australia
Supplemental Material for Come and say G’day: Using search engine data to understand the dynamics of tourism demand in Australia by Alan Duncan and Abebe Hailemariam in Tourism Economics.
Note. AR-MIDAS: Autoregressive-mixed data sampling; LSTM: ensemble of long short-term memory; ARIMA: Autoregressive integrated moving average; DFA: dynamic factor approach; ARDL: Autoregressive Distributed Lag; PCA: principal component analysis; ADE: adaptive differential evolution; DFA: Dynamic factor approach; BPNN: back-propagation neural net- works; MIDAS: Mixed Data Sampling; SARIMA: seasonal autoregressive integrated moving average; TVP: time varying parameter; DLM: dynamic linear model; VAR: vector auto regressive; EEMD: ensemble empirical mode decomposition; GDFM: generalised dynamic fac- tor model; KELM: kernel extreme learning machine; B-SAKE: kernel-based extreme learning machine; KPCA: kernel principle component analysis; SVR: support vector regression; ANN: Artificial Neural Network.
Footnotes
Declaration of conflicting interests
The author(s) declared no potential conflicts of interest with respect to the research, authorship, and/or publication of this article.
Funding
The author(s) received no financial support for the research, authorship, and/or publication of this article.
Supplemental Material
Supplemental material for this article is available online.
Notes
Author biographies
References
Supplementary Material
Please find the following supplemental material available below.
For Open Access articles published under a Creative Commons License, all supplemental material carries the same license as the article it is associated with.
For non-Open Access articles published, all supplemental material carries a non-exclusive license, and permission requests for re-use of supplemental material or any part of supplemental material shall be sent directly to the copyright owner as specified in the copyright notice associated with the article.