
Abstract
The growing frequency and intensity of disasters due to climate change present considerable risks for tourist destinations, necessitating comprehensive research on their economic impacts. This study investigates the contemporaneous dose-response relationship between natural disasters and inbound tourism by estimating a flexible binned regression model. The analysis is conducted in a panel data setting from 1995 to 2019, spanning over 150 countries and accounting for the impact of more than 8,300 individual disasters from seven distinct categories. Examining seven natural disaster types (earthquakes, epidemics, extreme temperature events, floods, landslides, storms and wildfires) and five disaster impact metrics reflecting their human and economic impacts, the analysis reveals that increased disaster impact, except for earthquakes, correlates with reduced levels of tourist arrivals and travel expenditure. The paper provides valuable insights into the relationship between disasters, climate change, and tourism economics, informing disaster mitigation strategies and broader climate change assessments for tourism sector policy and decision-makers.
Introduction
Natural disasters have emerged as a pressing global issue due to their increasing economic and trade disruptions. The 2023 World Economic Forum’s Global Risks Report (WEF, 2023) ranks “natural disasters and extreme weather events” as the second most likely risk to occur between 2023 and 2025, following the current cost of living crisis caused by the COVID19 pandemic and the war in Ukraine. In the next 10 years, it ranks as the third most likely risk. According to the World Meteorological Organization, weather, climate, or water hazard-related disasters have occurred daily over the past 50 years, killing 115 people and causing US$202 million in losses each day (WMO, 2022). The number of recorded disasters has increased five-fold over this period, leading to considerable loss of life and property damage. Possible explanations for this increase include accelerated climate change (Adrian et al., 2022), improved reporting, and data collection.
Examples of disasters include category 4 & 5 storms in small states such as the Bahamas, the Dominican Republic, Fiji, or the Vanuatu (2012–2019), the 2004 Indian Ocean earthquake and subsequent tsunami, Hurricane Katrina and Hurricane Harvey in the United States (2005 and 2017, respectively), earthquakes in Haiti and Chile (2010), Japan’s earthquake and tsunami (2011), Nepal’s earthquake (2015), and the 2023 earthquakes in Syria and Turkey which caused over 50,000 casualties.
Current disaster impact data are conservative estimates due to sparse data, especially for smaller-scale disasters (WTO, 2019). Empirical studies on natural disasters’ sectoral macroeconomic and social impacts are still in early development (Botzen et al., 2019; El Hadri et al., 2019; Osberghaus, 2019; Panwar and Sen, 2019; Rosselló et al., 2020). Most studies focus on merchandise trade (Da Silva and Cernat, 2012; Gassebner et al., 2010; Oh and Reuveny, 2010). Research on service trade impacts is limited (Xu and Kouwoaye, 2019).
Given this context, empirical economic literature is needed to explore the effects of various disasters on service sectors, including tourism. Inbound tourist arrivals typically decline following natural disasters or threats, as increased risk perception prompts tourists to cancel trips or choose unaffected destinations. Climate change-induced disasters pose significant risks for tourist destinations, necessitating in-depth research on their economic impacts. Tourism scholars have increasingly examined disaster events’ influence on tourists’ travel decisions (Becken et al., 2014; Genç, 2018; Okafor et al., 2021, 2023; Rosselló et al., 2020). However, empirical research on natural disasters and international tourism flows remains scarce (Okafor et al., 2023; Rosselló et al., 2020).
This study combines observations from the EM-DAT database (Guha-Sapir et al., 2016) with annual country-level tourism flows provided by the UNWTO to assess natural disasters’ effects on inbound tourism. We quantify the magnitude of natural disasters thanks to a combination of variables that account for their human and economic impacts from 1995 to 2019.
Our methodology allows us to classify disaster magnitudes and evaluate how each natural disaster’s human and economic impacts affect inbound tourism concerning tourist arrivals and international tourism receipts. To our knowledge, this paper is the first in the tourism literature to estimate how each disaster (classified by type and severity) affects inbound tourism in terms of tourist arrivals and international tourism receipts.
The remainder of the paper is organized as follows. The second section provides a review of the studies on the impacts of disasters on international trade and services (including tourism). The third and fourth sections describe the data used throughout the analysis and the main empirical model, respectively. Section 5 highlights the main findings while the sixth section attempts to contextualize said findings by discussing matters that are related to our choice of model but that are not discussed in the main specification. Finally, a concluding discussion is presented in the last section to put these results into perspective and to provide an outlook on future research.
Literature review
This section does not intend to provide a complete and comprehensive overview of the existing literature on the economic impact of natural disasters. Rather, it aims to review the empirical studies on the effects of natural disasters on economic growth and the international trade of goods and services in general and on the tourism sector in particular, the latter outcome being the main interest of our study.
Economic impact of natural disasters
Natural disasters can cause both direct and indirect impacts. The burgeoning field of climate economy literature (CEL) integrates data-driven analyses to assess these two types of effects natural disasters can have on various macroeconomic and social outcomes at the sectoral level, including agricultural output, industrial output, exports, labor productivity, energy demand, health, migration, conflict, and economic growth, among others. Direct economic damages refer to the damage inflicted on assets as a direct consequence of a natural disaster, with losses occurring during or shortly after the event. Instances of direct economic losses encompass the destruction of physical capital, such as commercial businesses, residential properties, infrastructure, crops, livestock, and farm equipment. Additionally, disasters can lead to disruptions in economic activity, population displacement, and various forms of environmental degradation, both in terms of market and non-market damages.
These direct losses can subsequently give rise to indirect impacts, which encompass the positive and negative shifts in economic activities that occur because of the disaster. Such impacts may include the disruption of economic activities as well as any positive multiplier effects that arise post-disaster. For instance, consumer demand may increase in certain sectors, such as construction, while decreasing in others as consumers reallocate their expenditures toward rebuilding efforts. Consequently, indirect impacts encapsulate short and long-term economic losses concerning production and consumption, as well as any associated economic recovery trajectories (Kousky, 2014). The indirect consequences of disasters are often estimated using computational macroeconomic models, such as input-output, computable general equilibrium, and integrated assessment models, like Dynamic Integrated Climate-Economy (DICE) and Regional Integrated Climate-Economy (RICE) models. These models frequently rely on exogenous economic growth theory in relation to climate change (Botzen et al., 2019), with predictions focusing on various economic indicators, including GDP levels and growth, trade, and employment.
Most estimates in the empirical climate-economy literature (ECEL) rely on regressions of aggregate variables (measured at the country level) on certain disaster measures, such as the number of disasters, monetary damages, or the number of fatalities (Dell et al., 2014; El Hadri et al., 2019; Hsiang and Jina, 2014; Osberghaus, 2019; Panwar and Sen, 2019; Toya and Skidmore, 2007). Early ECEL research (e.g., Skidmore and Toya, 2002) tended to use cross-sectional regressions, which resulted in cross-country differences in natural disaster events being the primary source of econometric identification. A major issue with these regressions is the potential for omitted variable bias if determinants of economic outcomes are not included in the model and are correlated with disaster measures (Botzen et al., 2019).
To address this potential bias, recent empirical studies on the impact of natural disasters have predominantly utilized panel data, which allows for the inclusion of location-fixed effects, controlling for all time-invariant location-specific unobserved determinants of the outcomes. Overall, these empirical investigations indicate that both direct and short-term indirect economic effects are generally negative, while negative long-term impacts are observed only for specific disaster events, such as hydrometeorological disasters (typhoons, hurricanes, floods, etc.). By investigating the indirect losses stemming from natural disasters, Felbermayr and Gröschl (2014) discovered that such disasters significantly and negatively affect the economic growth rate. Their results also indicated that this negative relationship is particularly nonlinear with respect to disaster intensity. A disaster in the top one percent of the disaster index distribution results in a 7% decrease in GDP, while an event in the top five percent of the disaster index distribution leads to a more contained 0.5% reduction in GDP.
Other empirical studies have assessed the influence of natural disasters on trade flows (e.g., Jones and Olken (2010); Gassebner et al. (2010); Oh and Reuveny (2010); Da Silva and Cernat (2012); El Hadri et al. (2019)). For instance, a study conducted by Da Silva and Cernat (2012) showed that small developing countries are most affected by the increasing frequency and costs of natural disasters. Their findings suggest that exports of affected small developing countries decline by 22%, whereas exports of larger developing countries remain largely unaffected, with such effects tending to persist for approximately 3 years. By employing two distinct databases (EM-DAT and GeoMet), El Hadri et al. (2019) found that total countries' exports are not significantly affected by natural disasters. However, their results show that earthquake events reduce agricultural exports by 3% irrespective of the country’s characteristics (size, level of development), while flood and windstorm disasters only negatively influence the exports of agricultural products in poor countries and small countries, respectively.
Research on the impacts of natural disasters on services trade remains scarce. By employing a structural gravity model, Xu and Kouwoaye (2019) investigated the magnitude of natural disasters using two distinct sets of variables that define large disasters by their human fatalities and economic loss, as well as their geophysical and meteorological magnitudes. They discovered that a large natural disaster, ceteris paribus, reduces services exports by approximately 2% to 3% in the year the disaster occurs. Xu and Kouwoaye (2019) also found that travel exports are negatively influenced by natural disasters, with one large natural disaster leading to a decline of travel exports by 3% in the year the disaster takes place, and this negative effect can last for 3 years after the event. The fall of international tourism receipts is attributed to a decline in inbound tourist arrivals due to transportation disruptions or trip cancellations following a natural disaster.
The effects of natural disasters on tourism
Destinations are vulnerable to natural disasters, which can damage their tangible assets (infrastructure and built facilities) within a relatively short time frame, but also hurt their reputation and image by inspiring fear and uncertainty, lowering their attractiveness in the long-run (Liu-Lastres et al., 2020; Tsai et al., 2016). Existing tourism studies on natural disasters have primarily adopted a case study approach and have focused extensively on the impact of disasters on tourists’ intention to travel, the significance of crisis management principles for enhancing the resilience of destinations to natural disasters, and effective prevention methods to support tourism businesses (Huan et al. (2004); Kozak et al. (2007); Chiou et al. (2013); Becken et al. (2014); Miller et al. (2017); and Jin et al. (2019). For instance, Huan et al. (2004) demonstrated that natural disasters adversely affect the image of tourism destinations by increasing risk perceptions. Kozak et al. (2007) also discovered that tourists tend to alter their travel plans away from destinations affected by natural disasters. Chiou et al. (2013) revealed that Typhoon Herb reduced tourist arrivals by an estimated 530,000 over a 3-year period; the Chichi earthquake led to a loss of 2.59 million tourist arrivals over 7 years; Typhoons Toraji and Nari resulted in a decrease of 360,000 tourist arrivals over a 3-year period; and Typhoon Mindulle reduced tourist arrivals by 80,000 within just 1 year. In the Indian Ocean, the tsunami that killed more than 225,000 people in the region in December 2004 is another example of a devastating natural disaster that had repercussions on tourism. In the Maldives, for instance, this disaster led to a decline of tourist arrivals by 69.7% (Park and Reisinger, 2010).
As the perception of safety is a crucial component of a destination’s image, large natural disasters are likely to reduce international tourism flows over a long period. The time it takes a destination to recover from a natural disaster could vary greatly from one destination to another, ranging from a very short period to up to 8 years (WTTC, 2019). On the one hand, some destinations have difficulties re-attracting tourists despite the fact they have completed the repair and restoration; but on the other hand, some destinations become more attractive to tourists who are interested in “dark tourism” (Liu-Lastres et al., 2020; Prayag, 2016). For instance, Acef, in Indonesia, which was hit by the Indian Ocean earthquake and tsunami in December 2004, was transformed from a disaster site to a popular destination, boasting various attractions ranging from beaches, cultural attractions, marine activities, and tsunami tourism attractions. Although tourism was not a main activity in this destination, the rapid development of tsunami tourism has made it a new crucial economic sector in the aftermath of the disaster (Nazaruddin and Sulaiman, 2013). Shondell Miller (2008) also assessed the case of post-disaster tourism development in New Orleans after Hurricane Katrina, focusing on the branding strategy of promoting New Orleans as a “comeback city” to rebound the local tourism industry. Prayag (2016) named this segment of tourism demand as “post-disaster dark tourism,” which generally occurs in the post-disaster phase and surrounds the disaster theme. This type of tourism demand is in contradiction with the typical tourism demand that relies on visitors who are interested in exploring pleasant destinations. By attracting tourists to post-disaster areas, dark tourism contributes to the process of disaster recovery. Note that international tourists’ perceptions of natural disasters and travel risks differ depending on their familiarity with a destination and national culture (Park and Reisinger, 2010; Reisinger and Mavondo, 2006a, 2006b). For instance, Bontempo et al. (1997) found that the perception of risk of the Chinese significantly differs from that of Westerners. Reisinger and Mavondo (2006a) also found that Australian, Hong Kong, and US tourists perceive higher travel risks than tourists from Greece and Canada.
While the tourism industry appears to be particularly susceptible to the impacts of natural disasters, global empirical studies assessing the relationships between disasters and international tourism remain scarce. To address this gap, Rosselló et al., (2020) developed a gravity model for international tourism flows to evaluate the effects of various types of natural and man-made disasters on bilateral tourist arrivals to the affected destinations. Their findings provide evidence that natural disasters negatively impact international tourist arrivals over the period 1995–2013. Concurrently, the study revealed that the tourism impacts of a natural disaster in terms of deaths and affected people are quite ambiguous. Their examination of different types of disasters demonstrates that volcanic eruptions cause the most significant and negative impact on tourism. Other disasters have smaller and shorter-term impacts (e.g., floods and storms). When a country is affected by an earthquake, wildfire, industrial accident, storm, or drought, mixed effects may be anticipated. Finally, this study revealed that some types of disasters are unlikely to have a substantial impact on tourist arrivals, such as pandemics, landslides, cold and heat waves. More recently, Okafor et al. (2023) employed a gravity model to investigate the effects of natural disasters and trade openness on bilateral tourism flows. Their study also examines the influence of income levels across countries in the underlying relationship between natural disasters and tourism flows over the period 1995–2007. The authors' findings indicate that the population share affected by storms negatively impacts inbound tourism flows in low-income countries, while its effect on high-income countries is statistically insignificant. Furthermore, the weighted population affected by earthquakes also adversely affects inbound tourism flows in upper-middle-income countries, whereas its impact on other income groups is statistically not significant. As for volcanoes, the effect is also negative and statistically significant in low-income, lower-middle-income, and high-income groups, with higher negative impacts on low-income countries, validating the assumption that the negative impact of natural disasters on inbound tourism flows declines with the level of income in the affected country.
It is important to note that the two empirical studies discussed above estimate the mean impact of natural disasters on bilateral tourism flows. By concentrating on the mean, researchers overlook risks around the central forecast and underestimate risks, particularly tail natural event risks, which are crucial for natural disasters. Our paper represents the first attempt to report the results of the empirical model in tourism, where the coefficients of disasters are presented by their type and socio-economic impact. To accomplish this, we first classify each disaster according to 10 deciles of severity. The severity of a disaster is defined here by five variables: the absolute number of deaths following the disaster in the impacted country, the number of deaths per 100,000 inhabitants, the number of people affected by the disaster, the number of people affected by the disaster per 100,000 inhabitants, and the total economic damages generated by the disaster, measured in millions of 2020 US$.
To the best of our knowledge, this paper constitutes the first attempt in the tourism literature to estimate how each disaster (classified by its type and intensity) affects contemporaneous inbound tourism in terms of tourist arrivals and international tourism receipts.
Data and stylized facts 1
Presentation of the datasets
Tourism data
The inbound tourism data used as the dependent variables throughout this analysis (Y it ) are from the Compendium of Tourism Statistics compiled by the United Nations World Tourism Organization (UNWTO). The data cover the period 1995–2019 for a balanced sample of approximately 160 countries. The raw UNWTO data include inbound tourist arrivals (163 balanced countries) and international tourism receipts (158 balanced countries). More specifically, we have:
Arrivals at the national borders (in thousands)
Arrivals of non-resident visitors, overnight visitors, and tourists at national borders of the inbound country (in thousands). According to the UNWTO, the variable measures the “number of tourists who travel to a country other than that in which they usually reside, and outside their usual environment, for a period not exceeding 12 months and whose main purpose in visiting is other than an activity remunerated from within the country visited 2 .”
Travel expenditure (2020 USD millions)
It is defined by the UNWTO as the “[...] expenditures by international inbound visitors, including payments to national carriers for international transport. These receipts include any other prepayment made for goods or services received in the destination country. They also may include receipts from same-day visitors, except when these are important enough to justify a distinct classification 3 .”
Summary statistics for the tourism, income, and natural disaster-related variables, once pooled and aggregated at the country-year level.
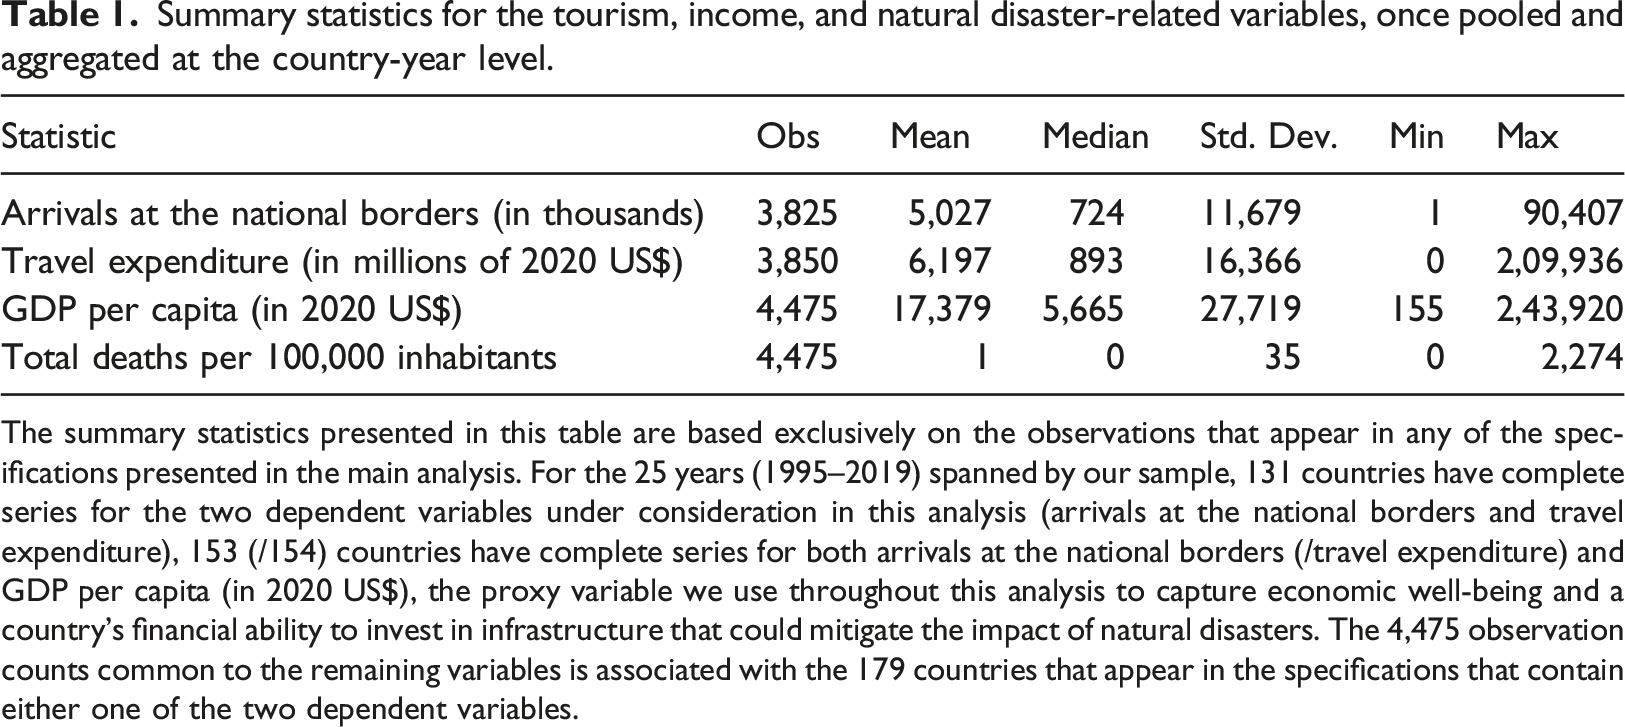
The summary statistics presented in this table are based exclusively on the observations that appear in any of the specifications presented in the main analysis. For the 25 years (1995–2019) spanned by our sample, 131 countries have complete series for the two dependent variables under consideration in this analysis (arrivals at the national borders and travel expenditure), 153 (/154) countries have complete series for both arrivals at the national borders (/travel expenditure) and GDP per capita (in 2020 US$), the proxy variable we use throughout this analysis to capture economic well-being and a country's financial ability to invest in infrastructure that could mitigate the impact of natural disasters. The 4,475 observation counts common to the remaining variables is associated with the 179 countries that appear in the specifications that contain either one of the two dependent variables.
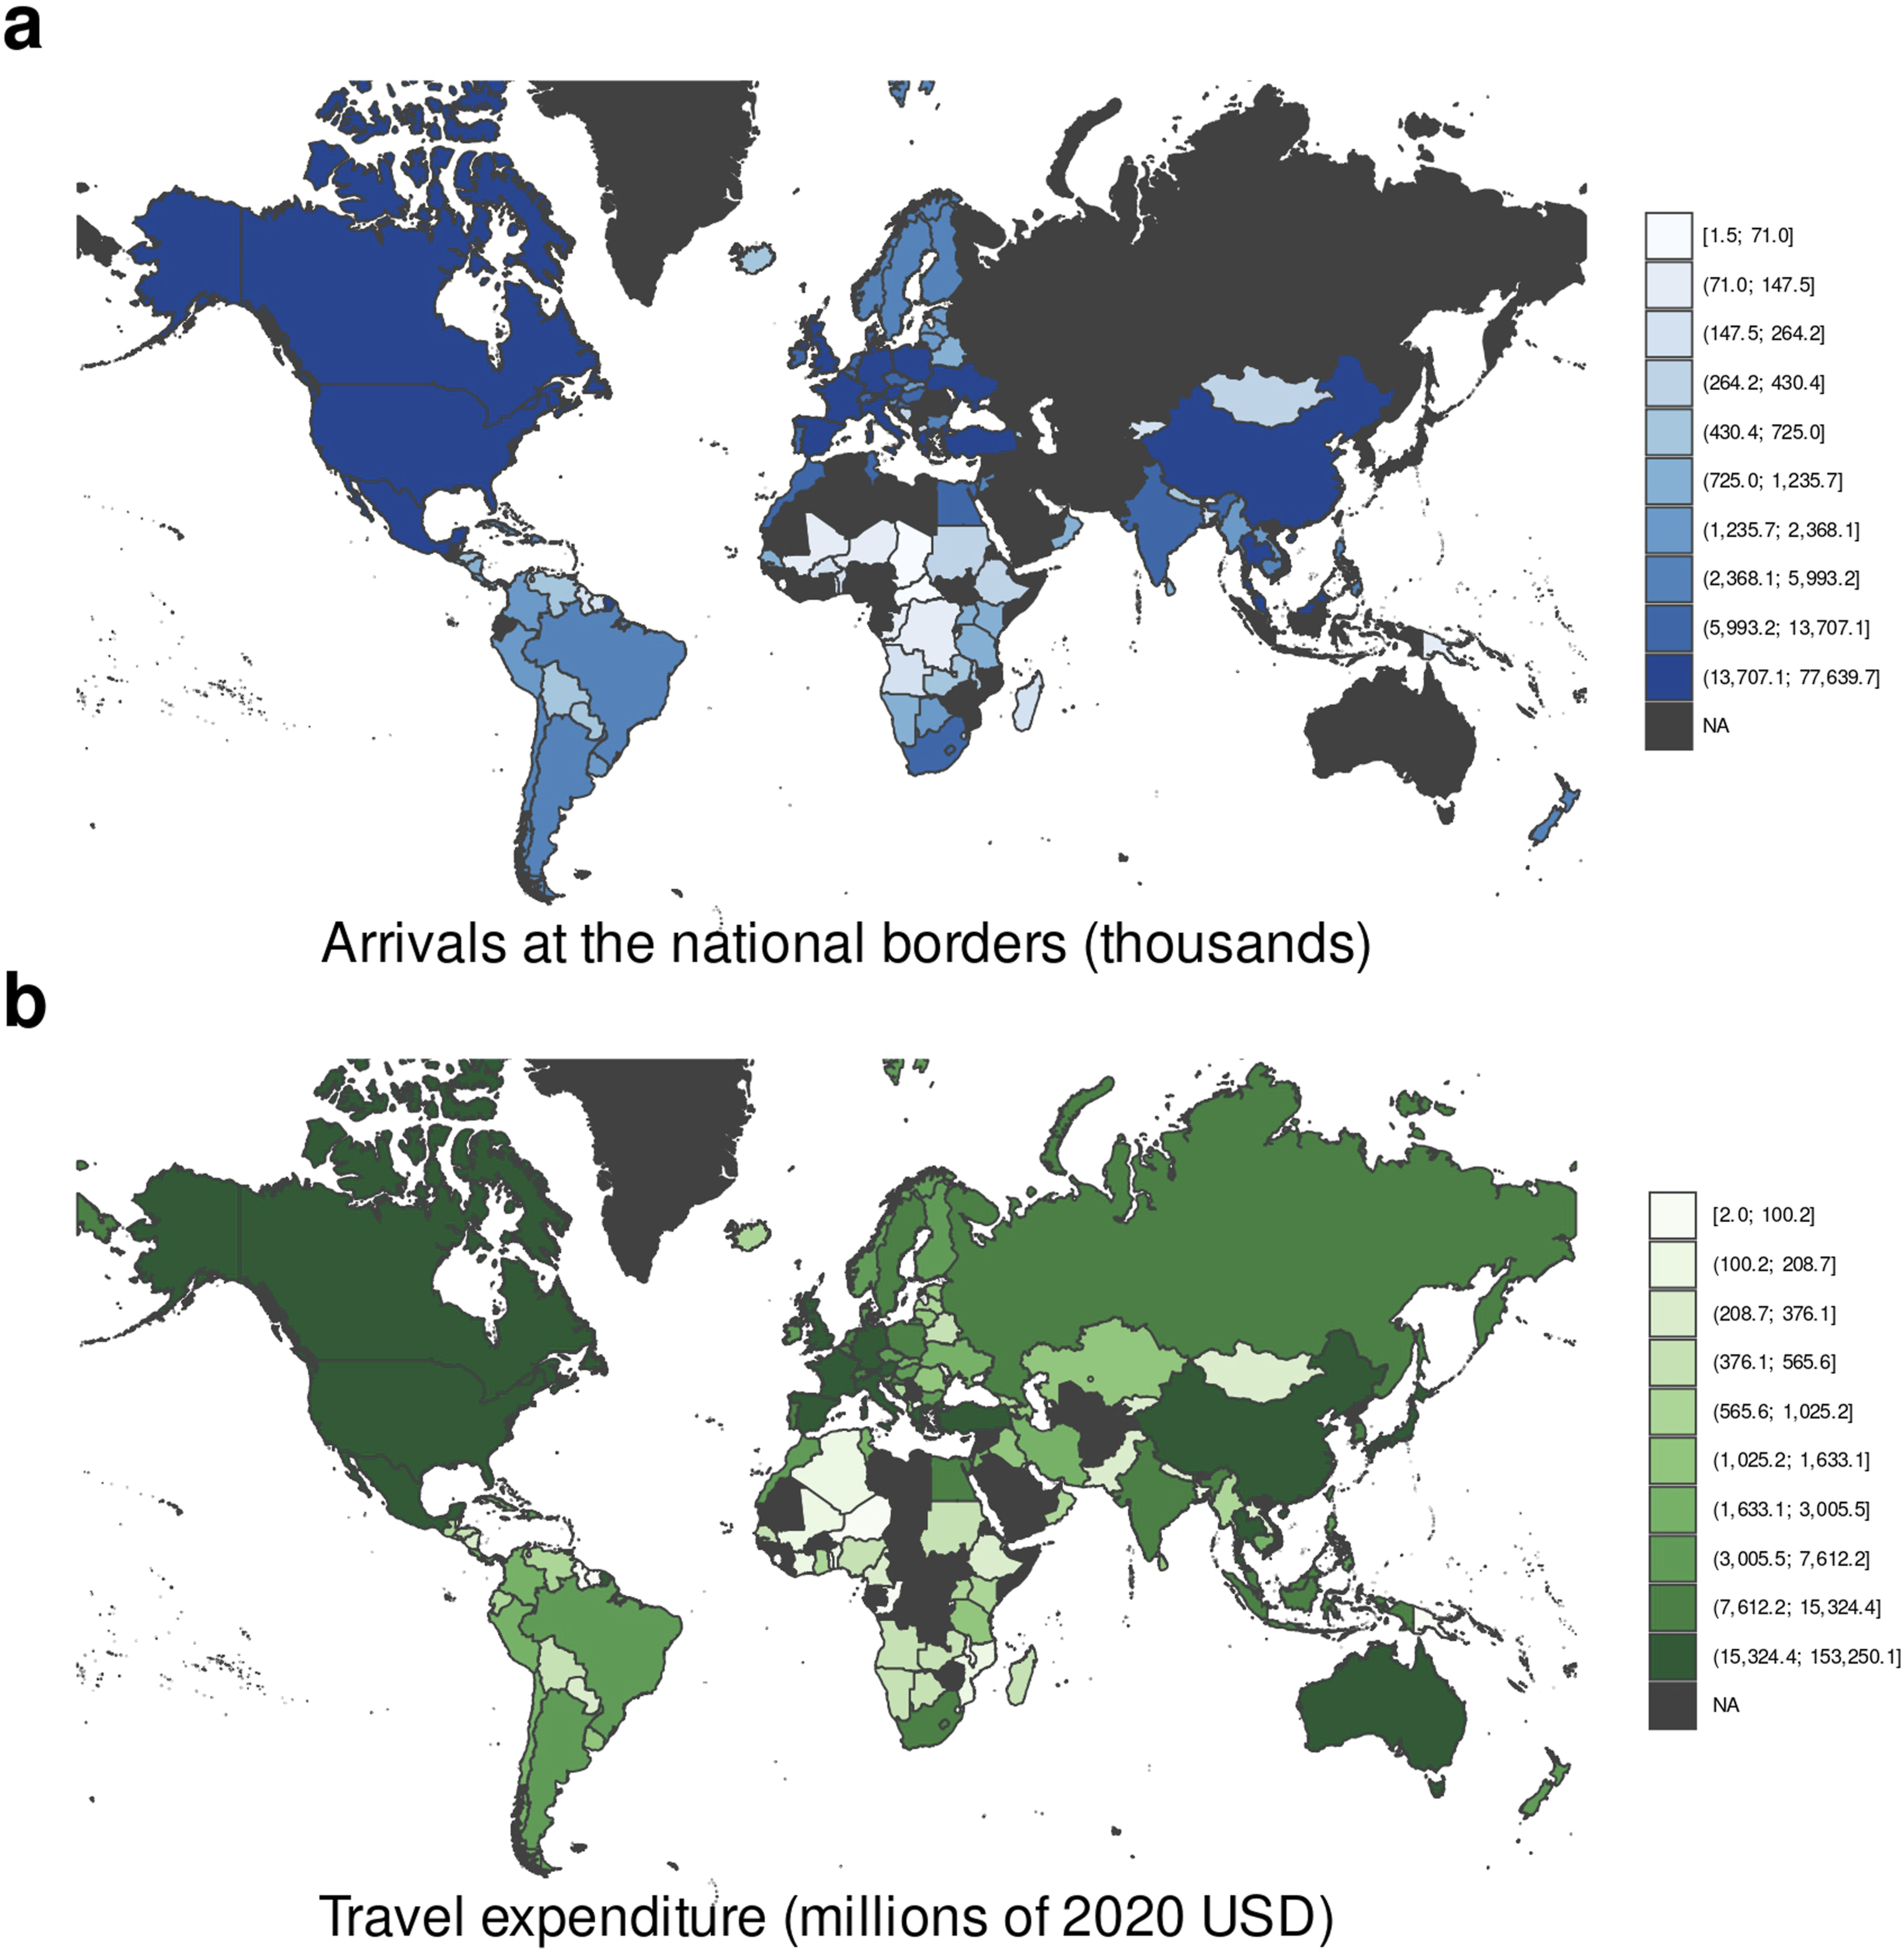
Choropleth maps displaying the average annual values for the two inbound tourism variables used throughout this analysis, calculated over the 1995–2019 period. Values are displayed only for the countries that were included in the estimation of the polynomial regression model and the binned regression model. As such, panel a shows the average number of visitors (in thousands) for 153 countries while panel b represents the average level of tourism expenditure (in millions of US$) for 154 countries.
Empirically assessing the effects on inbound tourism is a complex task, as tourism trade can be realized in very different ways. Previous studies by Rosselló et al., (2020) and Okafor et al. (2023) employed structural gravity models with bilateral tourism flows as the dependent variable, allowing for differentiation between source and host countries. However, due to data quality concerns associated with UNWTO data, which are seldom addressed in the tourism literature, our analysis focuses on the above two dependent variables measuring unilateral tourism trade flows at national level (international tourist arrivals and tourism receipts) rather than their bilateral counterparts often used in prior research.
Although the UNWTO reports progress in harmonizing definitions and measurement, differences in national practices still prevent full comparability. Sources and collection methods for arrivals vary across countries. In certain cases, data are from border statistics (police, immigration, and the like) and complemented by border surveys. In other cases, data are from tourism accommodation establishments. If data are collected through accommodation surveys, the number of guests is used as an estimate of tourist arrivals; consequently, breakdowns of tourists by country of residence, nationality, the main purpose of the trip, etc. are based on complementary visitor surveys. Furthermore, some countries record non-resident tourists’ arrivals at national borders by their country of usual residence, while in others, the tourists’ nationalities are used regardless of the country of residence. Additionally, some countries include tourist arrivals of nationals residing abroad while others do not. These discrepancies necessitate caution when comparing bilateral tourist arrivals data across countries.
The UNWTO dataset presents another challenge as some countries report bilateral tourism flows data for only a subset of origin countries or regions, rather than for all source countries of their international tourists. This leads to an inability to differentiate between true zero flows and missing observations between two countries, which could potentially bias the coefficients of structural gravity models, an issue recently highlighted in Rosselló Nadal and Santana Gallego (2022). Furthermore, when both source and host countries report tourism receipts, the reported values often differ for the same year. While this issue also arises in the context of trade in goods, the discrepancies in reporting for tourism receipts tend to be considerably larger (Nowak et al., 2012).
In consideration of the foregoing regarding our two dependent variables and for the sake of consistency, we favored in this paper a common unifying methodological approach that used national tourism data rather than bilateral tourism data. We limit our study to a balanced sample exceeding 150 countries—for any given specification—that reported inbound tourism data over the period 1995–2019. This limitation constrains our panel data analysis to disaster-impact data from EM-DAT based on 8,322 unique disasters from seven categories (earthquakes, epidemics, extreme temperature events, floods, landslides, storms, and wildfires). These combined datasets allow us to estimate the contemporaneous closed-form non-linear relationships between disasters of various levels of human and economic impacts on arrivals at the national borders and on travel expenditure.
Natural disasters data
The data on natural disasters that have been used in this paper are from the “EMergency events DATabase” (Guha-Sapir et al., 2016) run by the CRED, which is located at Université Catholique de Louvain. Although alternative sources of information on natural disasters are available, to the best of our knowledge, none are as comprehensive as that available from EM-DAT. This database contains information on the occurrence and effects of technological and natural disasters in the world from 1900 to the present day. Natural disasters include droughts, earthquakes, epidemics, extreme temperature events, famines, floods, insect infestations, (mud)slides, volcanic eruptions, waves/surges, wildfires, and windstorms. Technological disasters include industrial accidents like chemical spills or radiation leaks, transport accidents like airline crashes and miscellaneous accidents. The database is compiled from different sources, such as UN agencies, insurance companies, research institutions, non-governmental organizations, and press agencies.
For a disaster to be included in the EMDAT database, it has to satisfy at least one of three criteria: a) at least 10 people were killed, b) at least 100 people required immediate assistance during an emergency/were declared homeless/were injured. c) the impacted country declared a state of emergency or appealed for international assistance.
In this paper, we cover the 1995–2019 period since the tourism data are only available for this time frame and restrict our attention to seven types of natural disasters: earthquakes, epidemics, extreme temperature events, floods, landslides, storms, and wildfire. 4
EM-DAT provides the following human and economic measures of a disaster’s impact:
Total deaths
The variable is defined as the sum of casualties known to have been caused by the event and of missing people who have officially been presumed dead.
Total affected
This variable is defined by EM-DAT as the sum of people whose house was destroyed or heavily damaged, forcing them to seek shelter, people requiring immediate medical assistance because of the disaster, and the number of people needed immediate assistance in a more general sense.
Total damages (millions of 2020 US$)
The variable is defined by EM-DAT as the aggregated value of all damages and economic losses directly or indirectly related to the disaster. It is measured in millions of 2020 US$.
Using annual national population estimates 5 from the World Bank’s World Development Indicators (WDI), we construct the additional intensity metrics:
Total deaths per 100,000 inhabitants
A standardized variation of the preceding variable to reflect the number of deaths per 100 000 inhabitants.
Total affected per 100,000 inhabitants
Same as the metric above but standardized to reflect the total number of people affected per 100,000 inhabitants.
In all the specifications in the main text, the total number of deaths per 100,000 inhabitants serves as our baseline metric for the severity of a disaster—acting as the
First, the variables assessing the severity of a disaster through its human impact (total number of deaths and total number of people affected) have over twice as many available observations as the number of observations available for the variable measuring the economic impact of a disaster (over 6,500 and 6,900 for deaths and people affected, respectively, vs. slightly over 3,100 for the latter). 6
When choosing between using the number of deaths or the number of people affected as the measure of impact, we believe the former is likely more appropriate since deaths are often the primary measure of the disaster’s severity. They are generally easier to assess than other measures such as economic costs, property damage, or long-term environmental impacts. They are also more likely to be the metric reported by foreign media covering a natural disaster (typically mentioned in headlines), and as such, could have a stronger influence on a potential tourist’s decision to visit the impacted country than the number of people affected by the disaster would have. Furthermore, using the number of people affected can prove problematic when aggregating observations at the country-year level since multiple disasters can affect the same individuals multiple times. In other words, the true number of people affected must be mathematically less than or equal to the number found when adding the observations over each country-year. This issue is not present with deaths since people can only die once.
Deciding between favoring the absolute number of deaths and its counterpart standardized to 100,000 inhabitants is not as straightforward. However, we ultimately believe that a flood killing 100 people in a country with a population of 300,000 would be considered a relatively more devastating event than a flood killing 100 people in a country with a population of 100,000,000.
Having said that, we provide the results derived from the remaining impact metrics in the supplementary materials, as a robustness check (Figures A8–A11).
Summary statistics for the tourism variables, the proxy variable for economic prosperity and the preferred disaster human impact metric are displayed in Table 1, after these variables have been aggregated at the country-year level.
Prevalence of the natural disasters included in the curated EM-DAT database between 1995 and 2019 and the associated impact summary statistics when looking at the total number of deaths per 100,000 inhabitants.
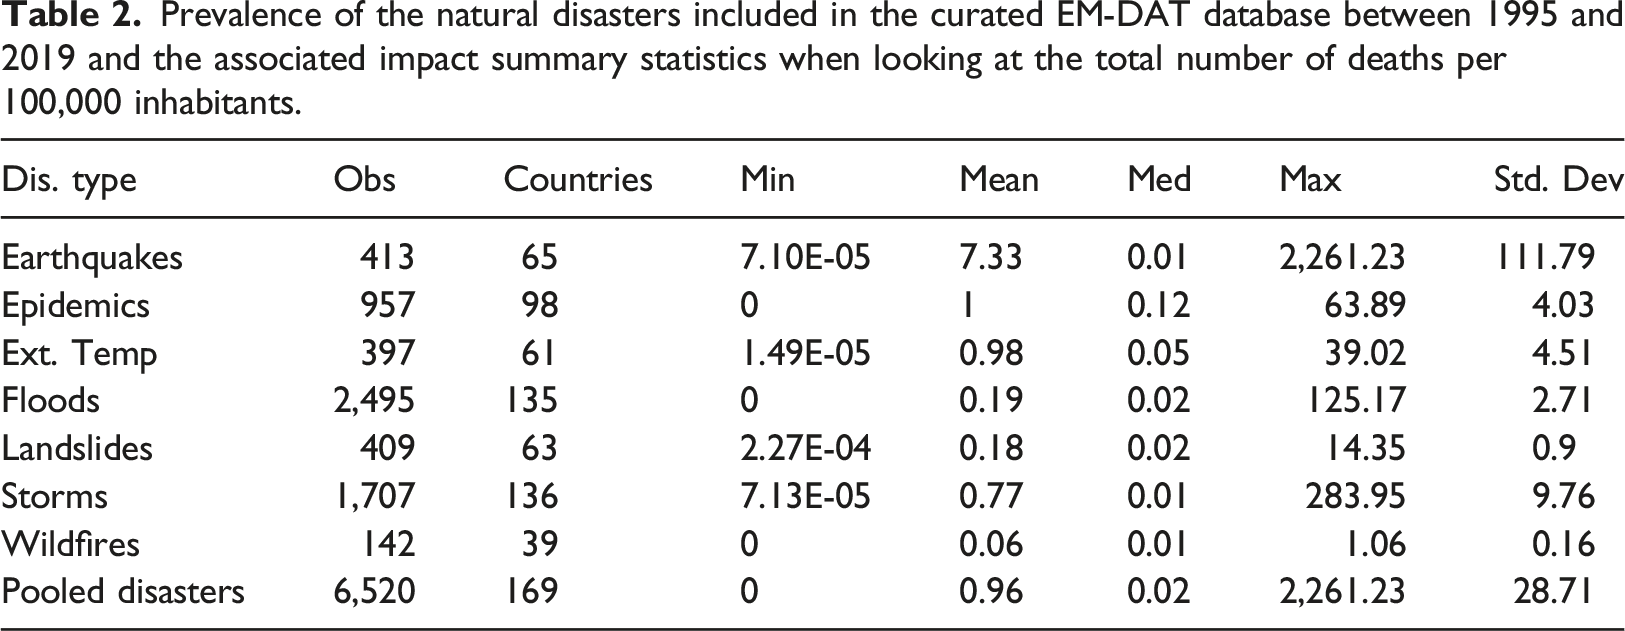
The regional distribution of the disasters included in the main analysis (which relies on the number of deaths per 100,000 inhabitants) is shown in Table A3 (located in the supplementary materials).
A visual representation of the geographic distribution of average annual total deaths per 100,000 inhabitants is displayed in Figure 2. Choropleth maps displaying the average annual number of deaths per 100,000 inhabitants caused by each type of disaster under consideration in any of the regressions. Countries shaded in grey are countries which do not appear in any of the regressions in this analysis. The ones shaded in light blue are the countries which never experience the disaster type under consideration during the 25 years under investigation. The fact that they are colored in blue rather that in grey means that they experience at least some type of disaster during the period, meaning that they are part of at least one of the regression specifications detailed later in the analysis.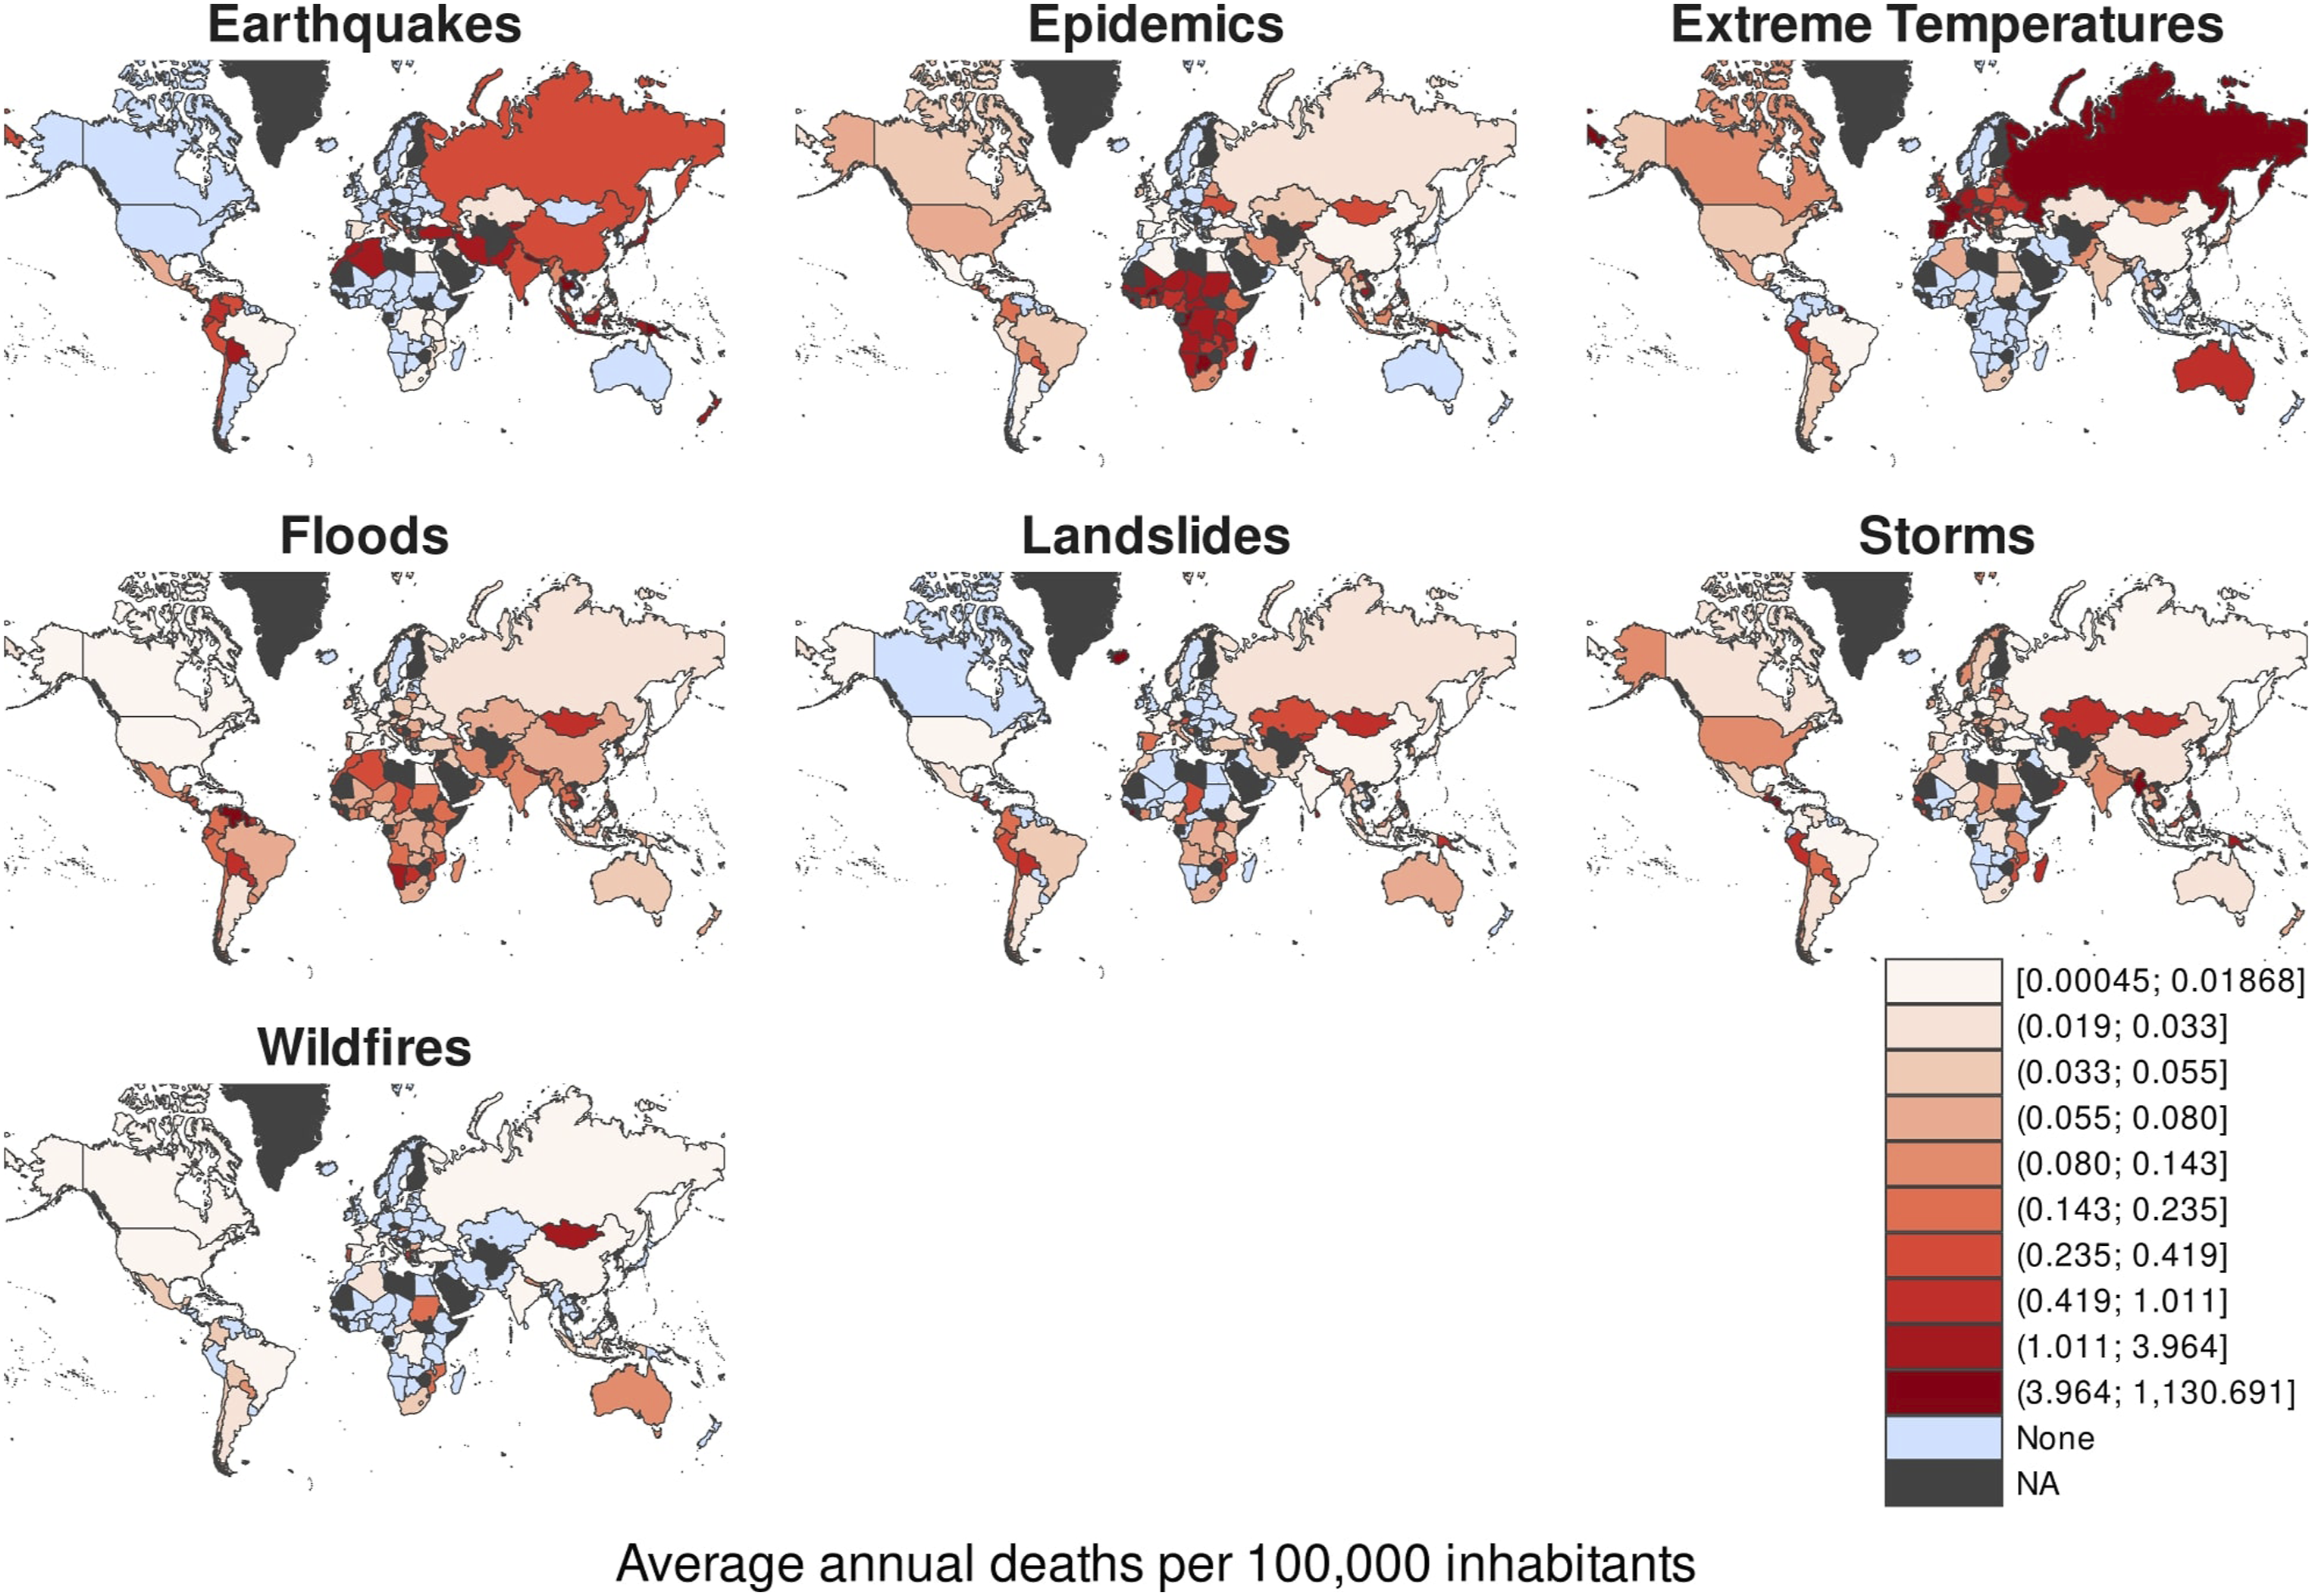
Stylized facts
Before delving into the core analysis, we perform a cursory preliminary exploration using a straightforward panel regression, incorporating country fixed effects, year fixed effects, and region-specific time trends. This initial step serves a dual purpose: first, to highlight the potential pitfalls of presuming a constant average treatment effect over the entire domain of the dose-response function, and second, to underscore the significance of delineating the sources of impacts.
Exploratory regression results from the estimation of linear model with fixed effects, using the total number of deaths per 100,000 inhabitants as the measure of a disaster’s impact.
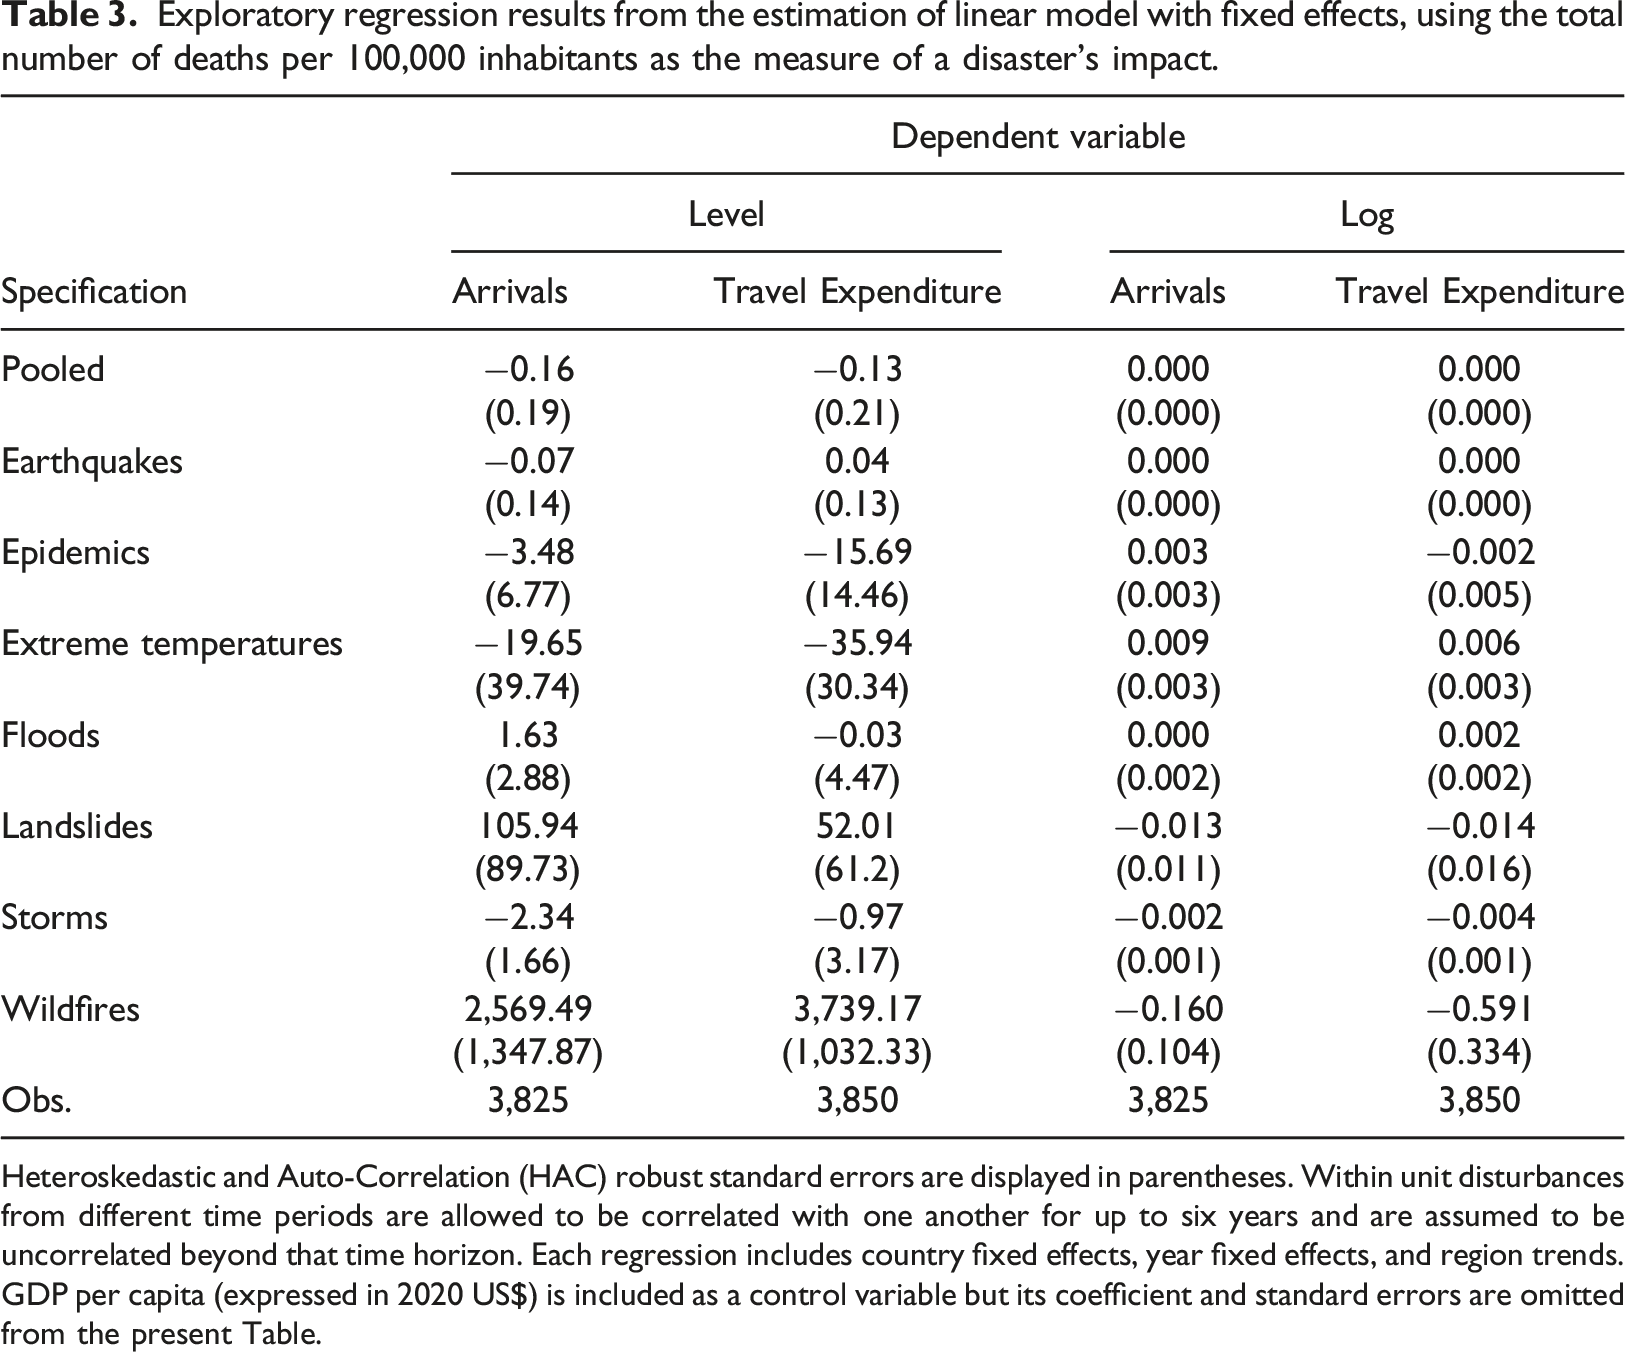
Heteroskedastic and Auto-Correlation (HAC) robust standard errors are displayed in parentheses. Within unit disturbances from different time periods are allowed to be correlated with one another for up to six years and are assumed to be uncorrelated beyond that time horizon. Each regression includes country fixed effects, year fixed effects, and region trends. GDP per capita (expressed in 2020 US$) is included as a control variable but its coefficient and standard errors are omitted from the present Table.
Subsequently, we refine our regression by disaggregating the casualties per 100,000 inhabitants based on the specific disaster type, such as earthquakes, epidemics, and so on. The outcomes, while more nuanced, still don’t present a compelling narrative. Most estimates fail to achieve statistical significance at the familiar 5% level. However, a closer look reveals that five out of the seven disaster types exhibit negative impacts in the level-level specifications, while the remaining two show positive effects. This pattern persists in the log-level specifications (albeit with a more balanced distribution of signs on the coefficient estimates), with an added observation: the coefficients tied to total deaths per 100,000 inhabitants due to storms are both negative and statistically significant across both outcome variables.
Were one to solely rely on these linear results to gauge the merit of a deeper investigation into the topic, the conclusion might lean towards skepticism. At best, one might acknowledge the necessity to differentiate between the impacts of various disaster types. Pooling them together seems to mask the variability in their effects, potentially leading to oversimplified interpretations.
The binned regression model
Justification for the use of the model
Our working hypothesis is that low-impact disasters are associated with smaller negative impacts on inbound tourism (arrivals and expenditure) than high-impact disasters. To capture the potential non-linearities in the dose-response function of marginal disasters with varying levels of severity on inbound tourism, we rely on a binned regression specification, a type of partition-based linear regression that offers considerable flexibility while retaining the desirable properties of OLS.
As the name of the model implies, the disasters are categorized into bins. In this analysis, each bin corresponds to a decile in terms of human or economic impact, calculated for all disasters to ensure that the bins cover similar impact intensity intervals across disaster types. This concept is best understood when examining specific examples taken directly from the EM-DAT disaster database. Let us consider two disasters that impacted France in 2003: disaster n° 2003-0391-FRA and disaster n° 2003-0586-FRA. The first one corresponds to a regional heatwave that caused the death of 19,490 people in France alone in August, while the second corresponds to floods that caused the death of 9 people in early December of the same year. In terms of severity, this puts the first event in the last decile, namely the bin containing all the events that caused the death of [124;222,570) people, while the second event would fall into the fourth decile, the bin associated with any event that killed [7;11) people.
Once each disaster has been categorized by its severity, we aggregate the number of disasters in each bin for each country-year in our sample. We can then estimate the following regression model:
Formal presentation of the model
• • • • • • • • item • Countries are indexed by 
Given the structure of the model described above, after accounting for country-specific fixed effects
Note that we start the bin summation with
In the main specification, we end up including
Main results
We include all seven types of natural disasters at once when estimating equation (1). Indeed, this allows us to avoid the bias that would arise from omitting the occurrence of other types of disasters affecting the same country during the same year. 8 For instance, China experienced 13 disasters in 1995: 5 storms, 3 earthquakes, 3 floods, 1 landslide, and 1 wildfire. Estimating the regression separately for each type of the other types of disasters would theoretically attribute too much of the impact associated with the inbound tourism variables to the category of disaster included in the regression, provided both disasters’ impacts go in the same direction. However, for the sake of clarity, we represent the dose-response functions on separate graphs.
We regroup the dose-response functions obtained when looking at a natural disaster’s impact through the number of casualties per 100,000 inhabitants it caused, on the inbound tourism variables (thousands of arrivals at the national borders, millions of 2020 US$ ’s worth of tourism expenditure). The associated post-regression plots are shown in Figure 3. Alternative specifications involving the other intensity metrics for the human and economic impacts of a natural disaster are shown in the supplementary materials, from Figures A8–A11. (a) Estimated impact of a disaster in ten severity bins, where severity is measured by the number of deaths per 100,000 inhabitants, on annual arrivals at the national borders (in thousands), relative to a disaster from the same category falling in the lowest bin. (b) Estimated impact of a disaster on annual tourism expenditure, measured in millions of 2020 US$. 95%-confidence intervals derived from HAC robust standard errors (allowing autocorrelation within a country for up to 6 years) are shaded in grey. The severity intervals used to construct the bins are common across disaster types. An alternative version of this graph where the impact deciles are specific to each type of disaster rather than shared across disaster types is available upon request. A horizontal dashed line is used for 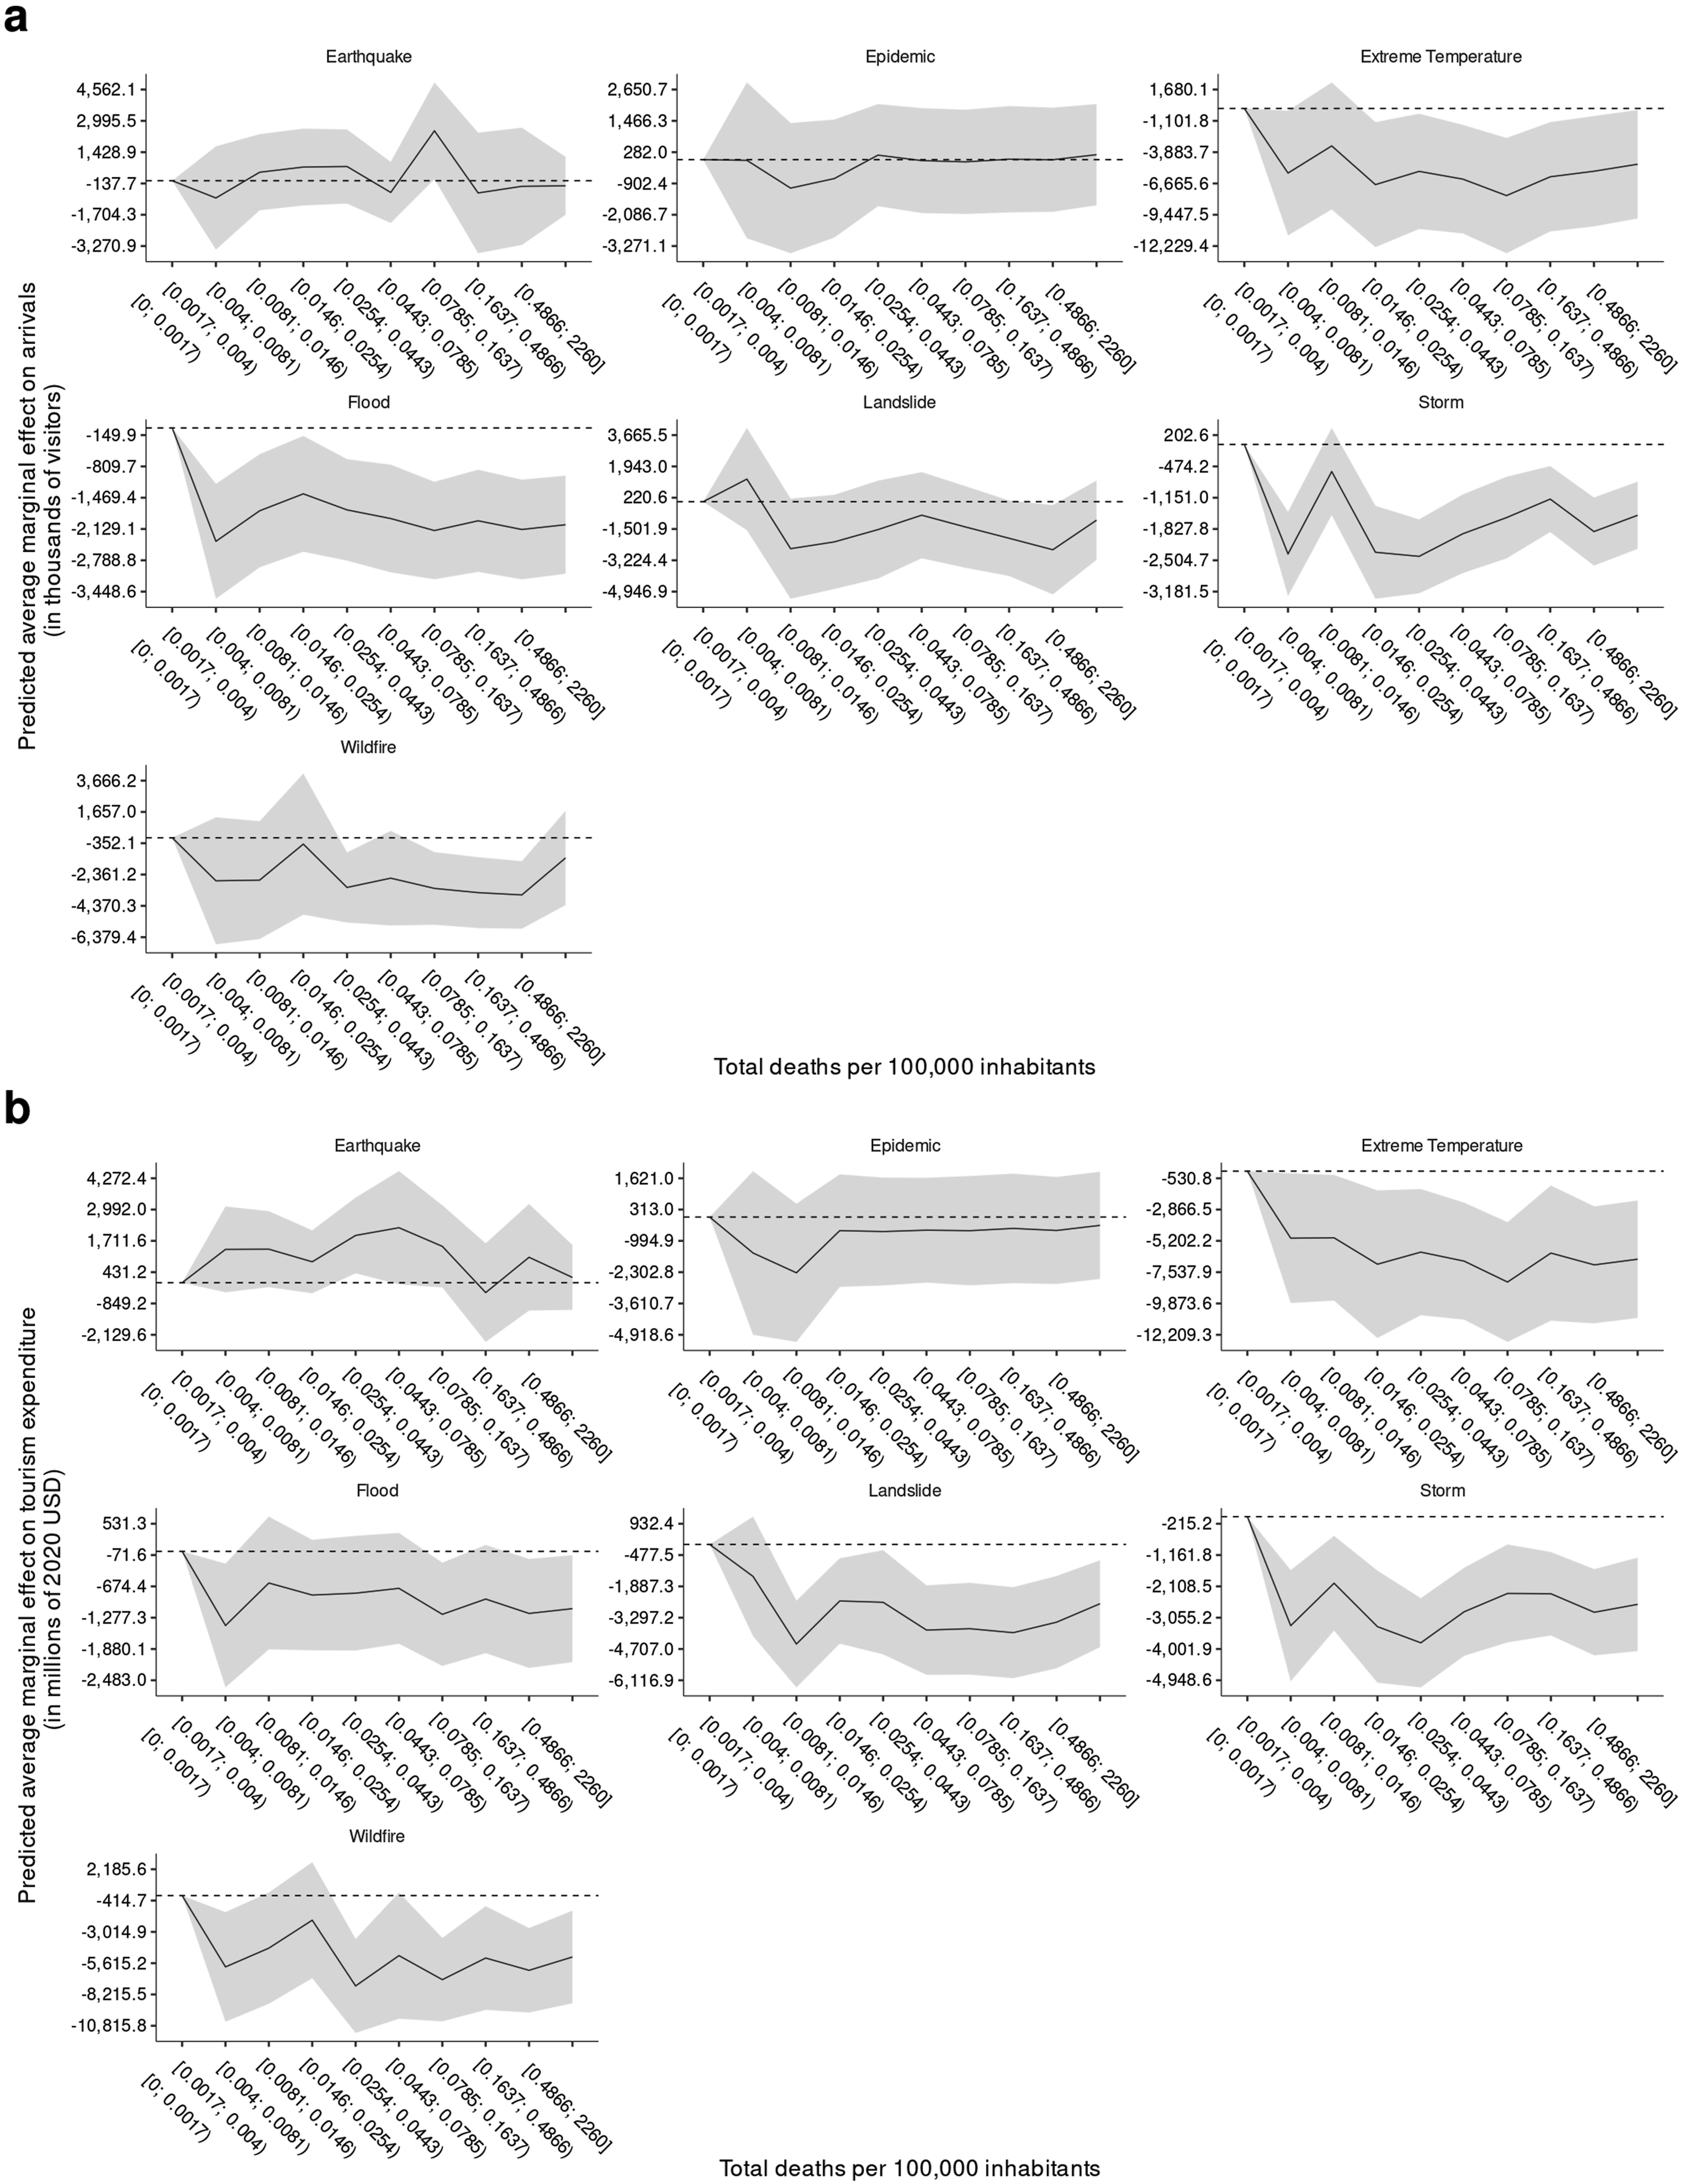
The graphical interpretation of Figure 3 is quite straightforward. From the
Similarly, we can see from panel
Interestingly, we can see from Figure 3 that except for earthquakes, all the disaster-specific dose-response functions share somewhat similar characteristics in their overall shape, 9 available upon request.
All disaster impacts exhibit a negative effect on travel expenditure when compared to a disaster of the same type that falls within the lowest impact decile, which serves as our reference point. Interestingly, the most pronounced negative marginal effects are observed for impact levels that are just slightly more severe than the reference category. As we move further along the dose-response curve, particularly around the midpoint or the 5th bin, the relative marginal impact begins to stabilize. From this point onward, the impact either remains consistent or even diminishes, especially for disasters categorized within the last two to three bins.
In other words, the severity of a natural disaster that is not an earthquake may have a varying effect on inbound tourism. Generally, the greater the severity, the more pronounced the negative impact on inbound tourism. However, the largest disasters of each type may be subject to a lower negative impact as international volunteers from other parts of the world may enter the country with regular visas and provide assistance with the disaster recovery effort (or simply have a desire to witness scenes of destruction, a morbid type of tourism that has been identified in the tourism literature). This influx of visitors and their associated expenditures may be accounted for in the measurements of inbound tourism, thereby helping to mitigate the negative effect of the disaster on inbound tourism. We discuss at a later point in the analysis how these scenarios fit within the framework developed in this section in the next part of the paper.
Additional considerations
A comprehensive exploration of the robustness of our findings is presented in the supplementary materials associated with this paper. The curious reader will find alternative specifications in which we explore the impact of estimating a model with the log-transform of the dependent variable (to measure semi-elasticities), along with models incorporating the lagged dependent variable to account for temporal dynamics and persistence effects. Additionally, the supplementary materials delve into the use of polynomial regression models to capture non-linear relationships and assess the cumulative impact of disasters of various types on inbound tourism. Below, we discuss spatio-temporal considerations we believe are worth mentioning to help contextualize the relevance of our main findings.
Dynamic modeling
As mentioned in the presentation of the binned regression model, our approach to account for temporal dynamics consists in employing Heteroskedasticity and Auto-correlation Consistent (HAC) robust standard errors, which we allow to accommodate the possibility of error correlations within a country spanning up to 6 years. This method provides a way to mitigate the inefficiencies arising from auto-correlation by adjusting the standard errors, ensuring more reliable inference in the presence of serially correlated errors. While HAC-robust standard errors offer a valuable tool to address auto-correlation concerns, they primarily correct for the consequences of auto-correlation rather than its underlying causes. As such, while they enhance the robustness of our results, they do not solve the underlying issue. Recognizing the potential limitations of relying solely on HAC-robust standard errors, we delve deeper into exploring alternative strategies to more directly address the inherent temporal dynamics in our data, ensuring a more comprehensive treatment of auto-correlation and its implications for our analysis.
Estimating a fully dynamic version of the binned regression model, which would theoretically allow for the investigation of non-contemporaneous effects of natural disasters on future realizations of the dependent variable(s), is not feasible for this specific model and dataset. The challenges arise from the inherent structure of dynamic models, which necessitate the inclusion of past realizations of all covariates for multiple lagged years. This poses several complications.
First, as detailed throughout the empirical section of the paper, our model incorporates multiple bins for each type of disaster under study. In the primary specification, each of the seven disaster types is associated with 10 variables on the right-hand side (9 for the bins and one for the total number of disasters). Later, we presented an alternative model with 5 variables per disaster to demonstrate the robustness of our findings. Including lagged years would necessitate adding 70 variables in the former case and 35 in the latter. This not only reduces the number of usable observations per country but also significantly diminishes the degrees of freedom in the estimation.
Second, the design of the binned regression inherently introduces noise when past realizations are incorporated due to the high correlation between past realizations of a specific disaster-bin category and its current values. This often results in many variables being dropped during the matrix inversion process. Given that the binned model’s design makes individual bin coefficients relative to a reference category (the least impactful one), this correlation issue hinders meaningful interpretation of the remaining covariates.
After several attempts, we were thus unable to secure a convergence of the Feasible Generalized Methods of Moments (GMM) parameters when relying on the Arellano–Bond estimator (Arellano and Bond, 1991), one of the most popular dynamic panel tools in which an iterative process is used to estimate the parameters of the model where the lagged variables included in the model serve as instruments. On top of correcting for the potential presence of an auto-correlation bias, it would have allowed us to investigate the effects of the disasters over the years rather than just the contemporaneous effects. Thus, by exploring the nonlinearities of the dose-response function, we had to forfeit our ability to explore the effects over time of the disasters. 10
Cross-disaster contamination
In interpreting the results of this study, it is important to acknowledge the inherent complexities and potential biases associated with analyzing the impacts of natural disasters, particularly given the interconnected nature of such events.
The EMDAT database, while comprehensive, records potentially linked disasters—such as storms and subsequent storm surges—as distinct occurrences. This separation can potentially lead to an overestimation of the individual impacts of each disaster type on inbound tourism, as the combined effects of linked disasters might be attributed to each event independently. Additionally, the high correlation between certain disaster types, such as earthquakes and landslides, poses challenges in isolating their individual effects, potentially leading to attribution errors and multicollinearity issues. These factors imply that one should remain cautious in their interpretation of the estimated coefficients presented in this analysis and underscore the importance of considering the synergistic and concurrent impacts of multiple disaster types.
In theory, there are options which could bypass these issues. The more obvious ones would involve the inclusion of interaction terms and of a joint occurrence indicator variable. The former would consist in including interaction terms for disaster types that often occur together to account for their combined effects while the latter would control for the simultaneous occurrence of different disaster types. In the context of the binned regression model presented in this analysis, a potential implementation of this workaround would involve the creation of joint-disaster types, with their own dedicated bins. For instance, storm-flood could be its own category, distinct from the two individual types. Unfortunately, the spatial resolution of the data (national level) makes it impossible in most instances to fully account for the potential joint occurrence of various types of disasters. Since we observe country-level occurrences of disasters, we cannot rely on the timing of disasters alone as an indicator that one disaster came about because of another, as this could lead us to mistakenly associate disasters taking place in entirely different locations inside a country, an error that appears to be more likely to occur for larger countries.
It is worth noting for EMDAT offers additional details pertaining to the within-country locations affected by the disasters listed in the database. Alas, the variable appears to be populated on a somewhat ad hoc basis using non-standard names and aggregation levels, making it harder to exploit the information in a consistent way, without a dedicated pre-analysis.
The recent developments in remote sensing methods and in machine learning techniques (e.g., generalizable downscaling methods) give us confidence future work will be able to disaggregate these impacts at finer scales (administrative regions, cities, etc.), possibly through the use of natural language processing (NLP) models or thanks to approximate string matching methods, which would allow to better identify the spatial joint distribution of occurrences across disasters types, allowing in turn for the use of statistical tools that could further disentangle the impact of intertwined disaster types.
Spatial spillovers
An important aspect to consider in the analysis of natural disasters and their impact on inbound tourism is the potential for spatial spillovers. Disasters occurring in one country could have repercussions on neighboring countries, either directly through shared natural phenomena or indirectly through shifts in tourism patterns. For instance, a severe earthquake in one country might deter tourists not only from visiting that specific country but also its neighboring countries due to perceived risks or logistical challenges. Similarly, a flood in one region could affect transportation networks, influencing tourism in adjacent areas.
In the context of our binned regression model, accounting for spatial spillovers would require considering not only the disasters occurring within a country but also those taking place in its neighboring countries. This would introduce an additional layer of complexity, as the impact of a disaster might vary based on proximity, regional interconnectivity, and the nature of the disaster itself.
While our study provides a comprehensive analysis of the reduced-form impacts of natural disasters on inbound tourism, we acknowledge that spatial spillovers represent a limitation in our current model. The interconnected nature of today’s globalized world means that events in one country can have ripple effects on its neighbors, especially in sectors as sensitive and competitive as tourism. However, given the scope and focus of our current research, we opted to concentrate on the reduced-form effects within individual countries.
With that being said, the potential influence of spatial spillovers presents an intriguing avenue for future research. Subsequent studies could delve deeper into this aspect, exploring how disasters in one country might influence tourism patterns in neighboring countries and how these spillover effects vary based on disaster type, severity, and regional dynamics.
We believe that such an endeavor would benefit immensely from the application of a structural model designed to capture these regional spillovers. One prominent example is the gravity model, which has been widely used in the literature, as mentioned in our literature review. The gravity model, with its formulation of multilateral resistances, offers a robust framework to account for the interdependencies between countries. In the context of our study, it could be employed to model the interrelated impacts of disasters on tourism flows, considering both the direct effects on the affected country and the indirect effects on its trading partners or neighboring nations. The multilateral resistance terms in the gravity model would capture the relative attractiveness or resistance of one country to another, considering both observable and unobservable factors. This would allow for a more nuanced understanding of how disasters in one country might influence tourism patterns in another, especially in cases where countries are closely linked through trade, culture, or geography.
Alternatively, one could narrow their focus to the subset of disasters from EMDAT that impact multiple countries simultaneously. By leveraging sources of exogenous variation in the severity with which different countries are affected by a shared disaster, it becomes feasible to assess differentiated impacts on inbound tourism.
Discussion and conclusions
This study makes a valuable contribution to the burgeoning tourism literature by presenting novel estimations of the economic impact of natural disasters on inbound tourism at a global scale. Our implementation of a binned regression model, a partition-based regression model, yields distinctive insights into the non-linear associations between natural disasters and inbound tourism. This choice of methodology offers valuable perspectives on the size and direction of the impact of natural disasters on inbound tourism.
Capturing these non-linearities is of paramount importance, as climate change is expected to intensify natural disasters, resulting in more substantial human and economic consequences (e.g., increased casualties and infrastructural damage). These repercussions could have far-reaching implications for the tourism industry, exceeding the estimations produced by conventional (linear) structural gravity models that assign a single average treatment effect to each disaster type.
The binned regression model described by equation (1) takes into consideration a discretized transformation of the human and economic impacts of natural disasters, with the focus being on the number of casualties per 100,000 inhabitants as the metric of reference, for reasons discussed in the data section. Instead of estimating a continuous function, the binned regression is used to capture the non-linearities between climate change and the inbound tourism sector by binning the natural disaster observations into different buckets and estimating the average treatment effect of each bucket, allowing us to better understand the different effects of disasters of varying magnitude on the tourism sector. With this model, we find statistically significant negative impacts of disasters of larger magnitude relative to the lowest category the disasters could have fallen into in terms of impact, for every disaster under consideration but earthquakes, which are associated with a positive, albeit non-significant impact on inbound tourism. The results are overall quite robust (both in terms of direction and statistical significance) to the use of alternative binning choices, both regarding the number of bins included (5 vs. 10, although we tested other variations as well) in the regression and the way the intensity intervals delimiting the bins get defined (common across disaster types vs. specific to each type).
This empirical study is of particular relevance in the context of climate change because it provides insights into how natural disasters can impact inbound tourism and the economic benefits associated with attempts to mitigate the impact of these disasters, which are expected to increase in both frequency and intensity. As such, we believe its inclusion in the growing literature tying climate change to the tourism sector can contribute to enabling better preparedness for the incoming impacts of climate change. The damage functions estimated thanks to this model could be included in the future in broader Integrated Assessment Models (IAMs) of climate change and help policymakers determine the extent to which their countries would need to invest in infrastructure dedicated to mitigating the consequences of these natural disasters, should their goal be to shield the tourism sector from environmental shocks, an important industry in many countries.
In our exploration of the impacts of natural disasters on inbound tourism, several intriguing mechanisms underlying the observed relationships have emerged, warranting further investigation.
One potential driver of decreased visitor numbers at national borders could be the direct damage to essential tourism infrastructure. Events such as the destruction of hotels, airports, or even the adverse effects on communities reliant on tourism could deter tourists from visiting. If this is the primary cause, a detailed spatial analysis of disaster trajectories could identify the affected infrastructure. By understanding the tourism sector’s response to localized impacts, it would be possible to generate a comprehensive gridded map, highlighting the critical infrastructure vital for the tourism industry’s smooth operation.
While our study predominantly focuses on the country level, it’s essential to acknowledge the potential for significant events at the sub-national level. Natural disasters often strike specific tourist destinations, causing significant repercussions for those areas. However, these localized events might not significantly impact the national economic figures, especially in larger countries with diverse infra-national tourist destinations. Such localized disasters can have profound effects on the affected areas without showing substantial aggregate consequences. A significant challenge in this context is the lack of systematic sub-national inbound tourism data. To address this limitation, some researchers have employed satellite imagery of nighttime light intensity within a particular country or region as an indirect measure of economic activities (Klomp, 2016).
Another potential factor contributing to the decline in arrivals could be the “negative advertising” associated with a natural disaster’s aftermath, especially when covered extensively in foreign media. Such negative portrayals could deter potential travelers from choosing the affected country as their destination, either postponing their trips or opting for alternative locations. In such scenarios, a bilateral gravity model could be employed, treating negative news reports of natural disasters as a shock equivalent to increasing the bilateral distance between pairs of countries.
As discussed in the literature review, while there are destinations that have difficulties reattracting tourists after the repair and restoration phase; other countries can become attractive to tourists interested in “dark tourism.” Additionally, international tourists’ perceptions of natural disasters and travel differ depending on their familiarity with a destination and national culture. There are also situations where natural disasters might inadvertently boost travel to the affected regions in the short run. The rapid dissemination of information through online platforms and media ensures that international humanitarian workers are informed and can travel to disaster-stricken areas. Natural disasters might prompt visits from individuals seeking to support friends and relatives affected by the event, leading to increased tourism receipts and inbound flows. In such cases, a bilateral gravity model could assess whether outbound tourism flows from countries with a significant diaspora from the affected nation are more resilient than those from countries with fewer connections to the impacted region.
Supplemental Material
Supplemental Material - Investigating the non-linear impacts of seven types of natural disasters on inbound tourism: Insights from the EM-DAT database
Supplemental Material for Investigating the non-linear impacts of seven types of natural disasters on inbound tourism: Insights from the EM-DAT database by Leopold T Biardeau and Mondher Sahli in Tourism Economics.
Footnotes
Declaration of conflicting interests
The author(s) declared no potential conflicts of interest with respect to the research, authorship, and/or publication of this article.
Funding
The author(s) received no financial support for the research, authorship, and/or publication of this article.
Supplemental Material
Supplemental material for this article is available online.
Notes
Author biographies
References
Supplementary Material
Please find the following supplemental material available below.
For Open Access articles published under a Creative Commons License, all supplemental material carries the same license as the article it is associated with.
For non-Open Access articles published, all supplemental material carries a non-exclusive license, and permission requests for re-use of supplemental material or any part of supplemental material shall be sent directly to the copyright owner as specified in the copyright notice associated with the article.