
Abstract
In this paper, we analyze the factors that have determined why certain companies in the hospitality industry managed to buffer themselves from the effects of COVID-19 more consistently than others. In particular, we focus on downside risk measures. We found that hotel companies quoted in the United States were the most affected and that investors were less willing to hold shares in those companies during the pandemic. We also observe that, although hotels obtained lower returns during the period of analysis, restaurants were more affected by extreme events.
Introduction
COVID-19 has proven to be a real challenge for the hospitality industry. Investors are finding it difficult to anticipate the evolution of the industry, and the specter of a new SARS-2 variant or similar airborne disease does not make this any easier. The pandemic caused large swings in the stock prices of companies in the sector and increased their volatility (Mazur et al., 2021; Wang et al., 2022). In this paper, we propose to analyze the factors that have contributed to companies’ relative success in managing the effects of the crisis. We will use data from companies in the hotel and restaurant sector since they have been two of the hardest hit areas of the economy (Norris et al., 2021; Cepni et al., 2023).
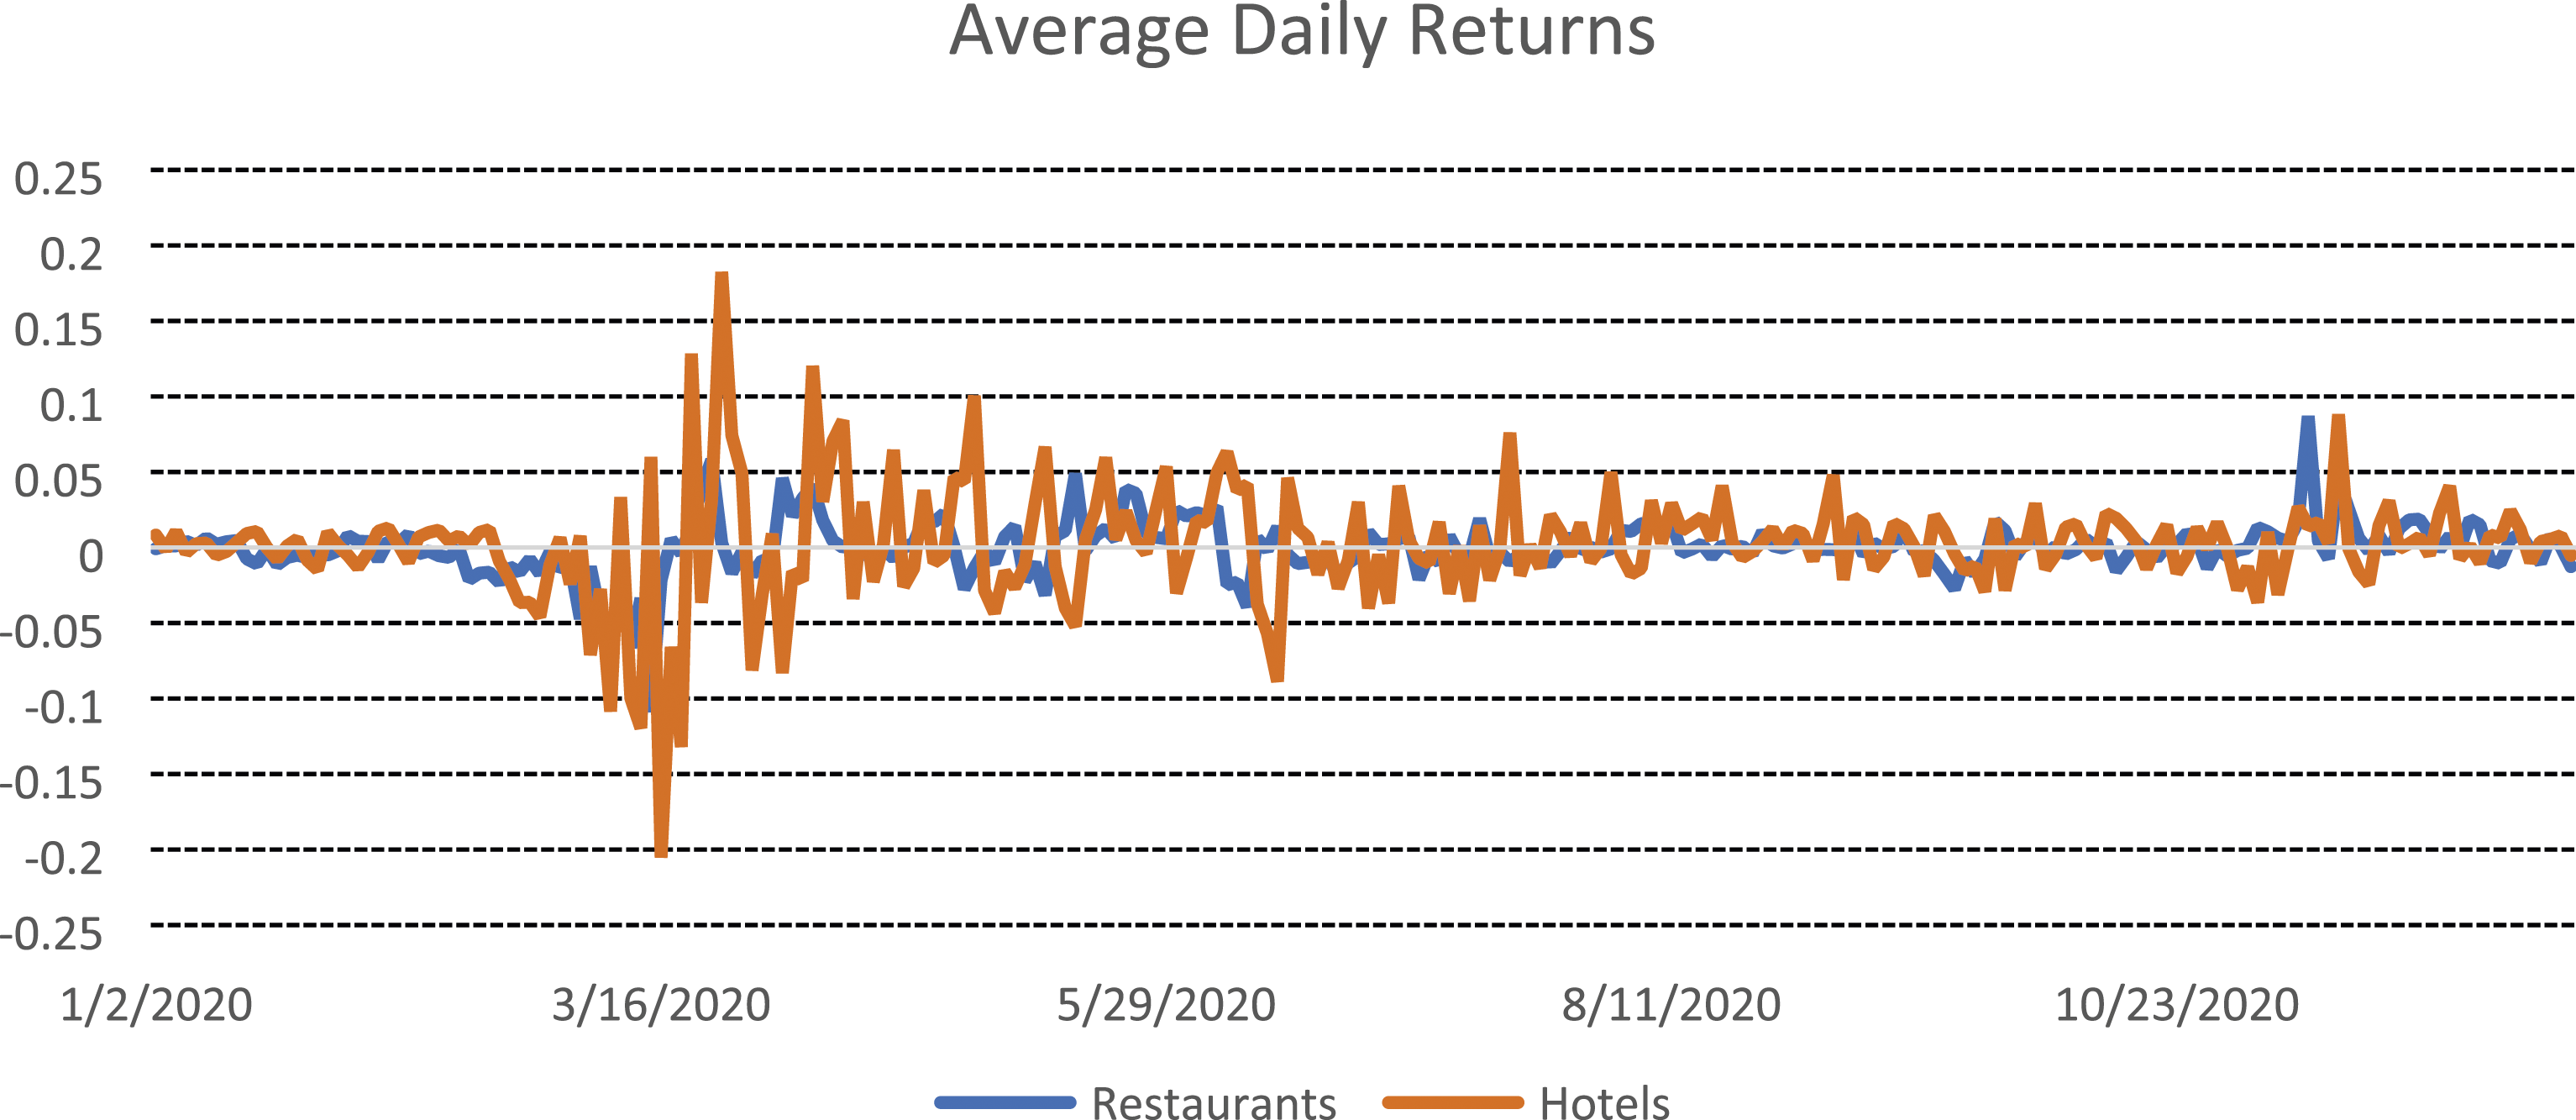
However, not all companies have suffered in the same way. In this paper, we seek to explain the determinants of this uneven effectiveness in cushioning shocks, emphasizing the use of extreme performance measures. We will study the elements that determined why certain companies suffered larger movements in their stock prices than others, focusing on the difference between hotels and restaurants, in particular. In Figures 1 and 2 we can see that although restaurant companies suffered, on average, the largest falls in their stock prices in 2020 (Figure 1), hotels experienced greater variability throughout the year (Figure 2). Daily drawdowns. Notes: This Figure presents the daily drawdowns calculated as stated in formula (1) for the average daily returns for hotels and restaurants (average across institutions of the same category) in 2020. The y-axis is measured in decimals. Average daily returns. Notes: This Figure presents the average daily returns for hotels and restaurants (average across establishments in the same category) in 2020. The y-axis is measured in decimals.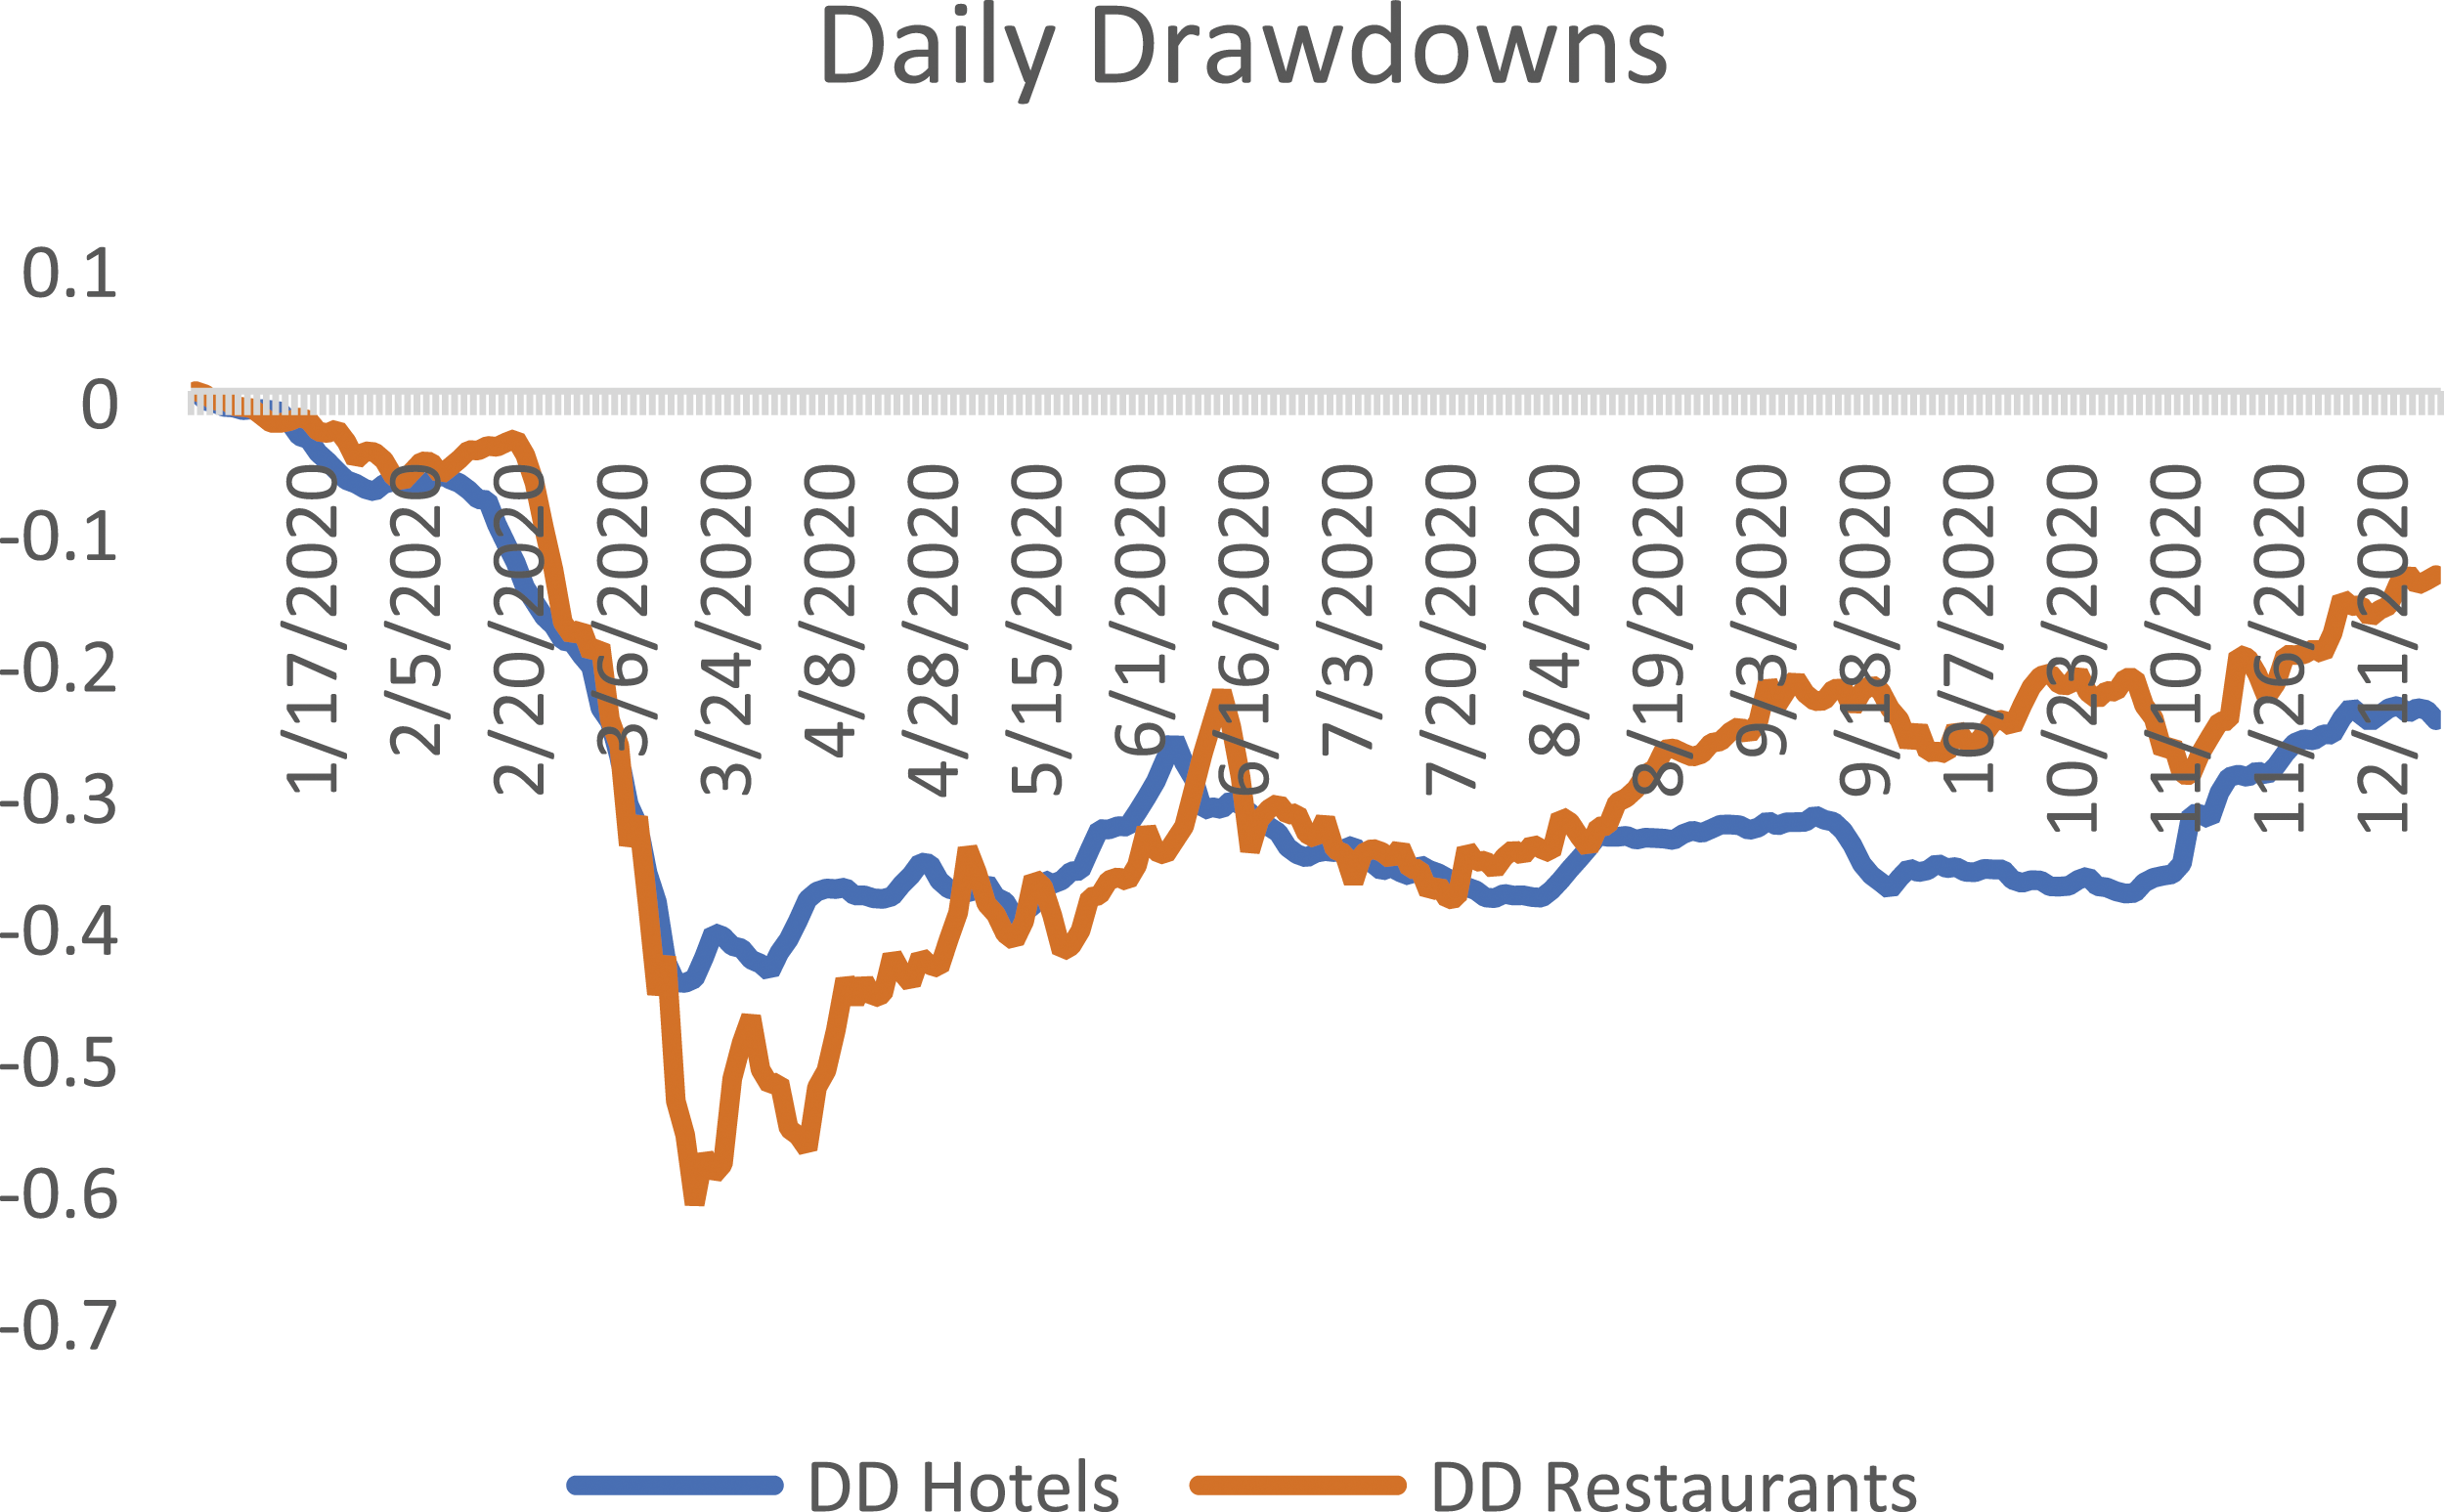
In this paper, we analyze what is called the “risk of a crash” understood as stock prices moving down (see Habib et al. 2018 for an extensive literature review) using the Maximum Drawdown (MDD).
Numerous research papers have delved into and substantiated the profound influence of the COVID-19 pandemic on financial markets (see, e.g., Albulescu (2020); Akhtaruzzaman et al. (2020), and Zaremba et al. (2020)). This study contributes to the literature in a number of ways. First, it allows us to better understand why certain companies in the hospitality industry suffered huge falls in their stock prices. In particular, this study offers an in-depth analysis of the capital destruction that many investors could have suffered by investing in such stocks in times of relative calm while reverting their position in times of turbulence. Second, it evaluates the elements that allowed certain companies to avoid losses better than others. Finally, it seeks to shed light on the determinants of extreme losses, which reach a critical point in periods of heightened uncertainty.
Data and methodology
We use data on publicly traded companies from the hospitality industry (hotels and restaurants). Our dataset comprises companies from different markets including North America, Europe, Oceania, and Asia. The data was collected from Thomson Reuters Datastream, MarketScreener, and Yahoo Finance. In addition, we apply a variety of filters to our sample. Our sample has observations for all variables of interest in the pre- and COVID-19 period, which we define as occurring between January 1, 2019 and November 30, 2021. We winsorize 1 our variables at the 1% and 99% levels, respectively, to mitigate effects from outliers. After this filtering process, we are left with 62 companies (36 hotels and 26 restaurants).
As in Hassan et al. (2021), our empirical approach includes two steps. First, we use daily data to calculate a series of downward measures that are going to be our dependent variables. These measures take into account the possible losses for those investors who decided to trade the stocks under analysis. Our main measure is the Maximum Drawdown.
(Drawdown process): For a horizon T ∈ (0,∞), the drawdown process


(Maximum Drawdown): It is defined as the largest price decline that an asset has ever experienced from a previous peak (maximum loss incurred from peak to valley):

Since we want to analyze the determinants of this measure, we use the explanatory variables with a lag. The model to be tested takes the following form:

Empirical findings
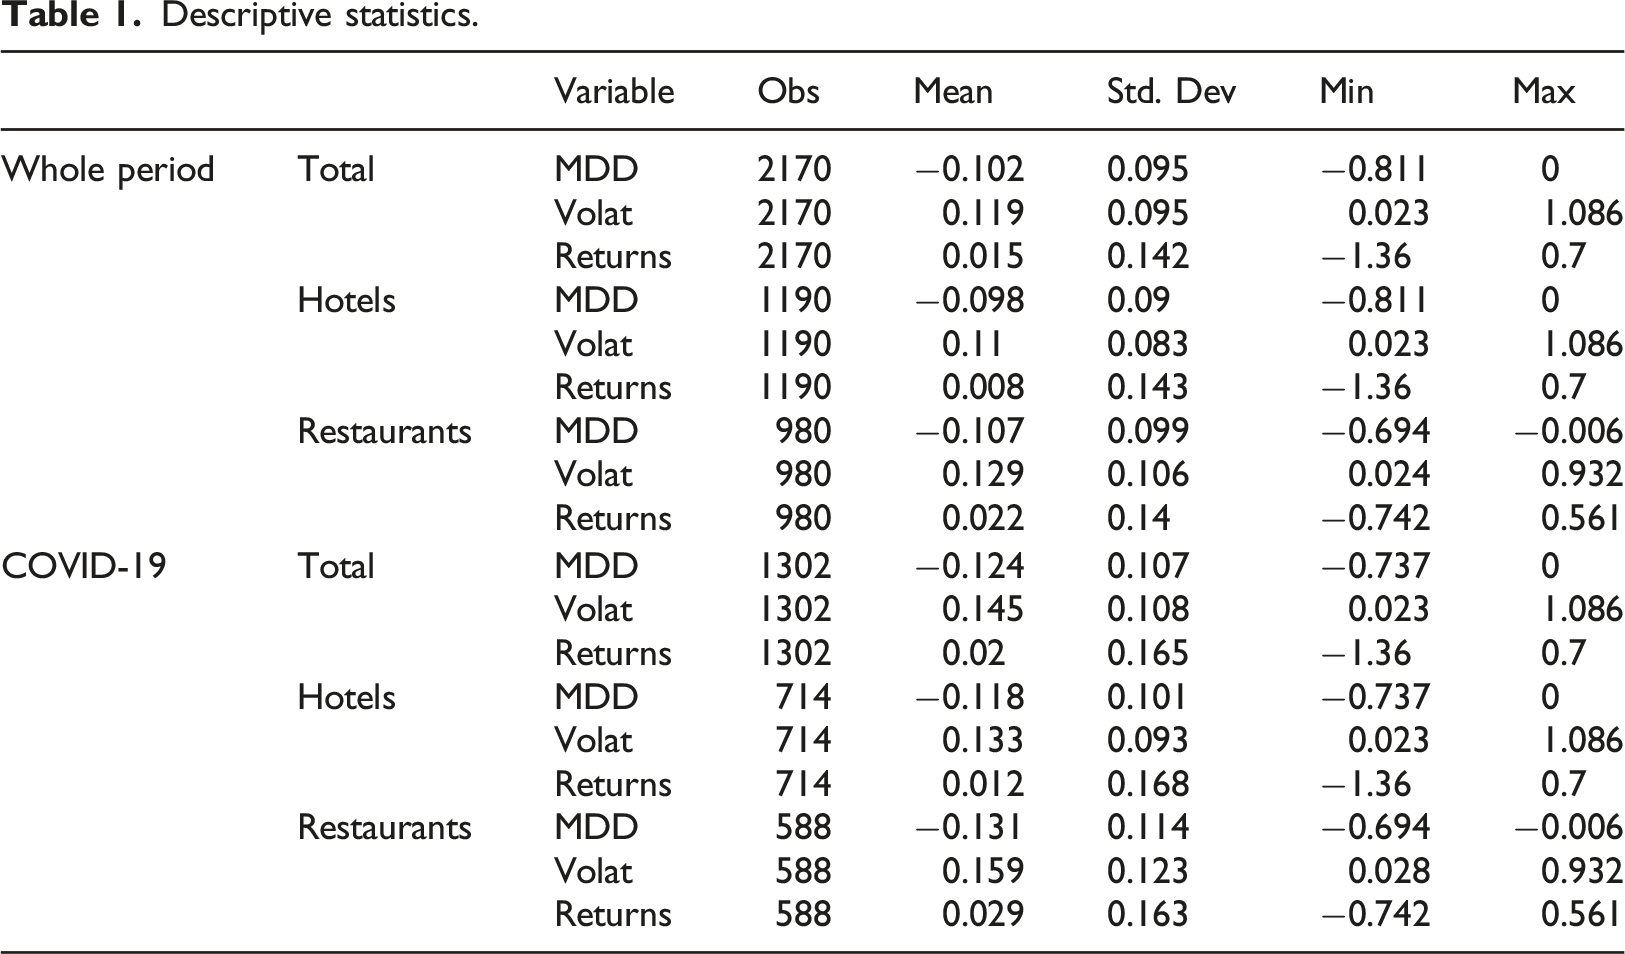
Descriptive statistics.
MDD as the dependent variable (whole sample).
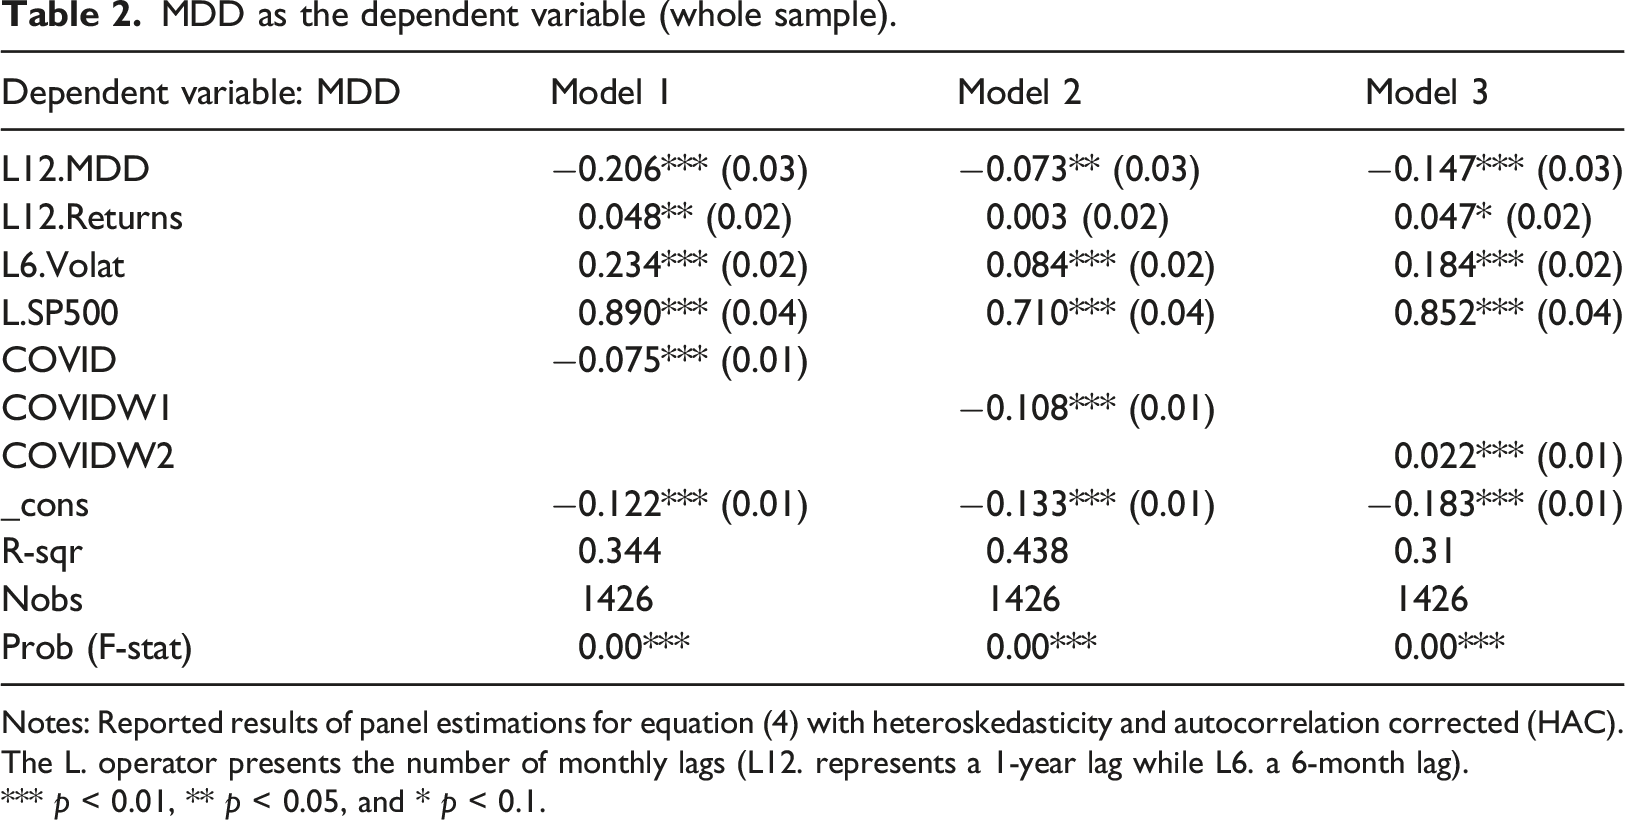
Notes: Reported results of panel estimations for equation (4) with heteroskedasticity and autocorrelation corrected (HAC). The L. operator presents the number of monthly lags (L12. represents a 1-year lag while L6. a 6-month lag).
*** p < 0.01, ** p < 0.05, and * p < 0.1.
MDD as the dependent variable (Hotels vs Hotels in the U.S.).
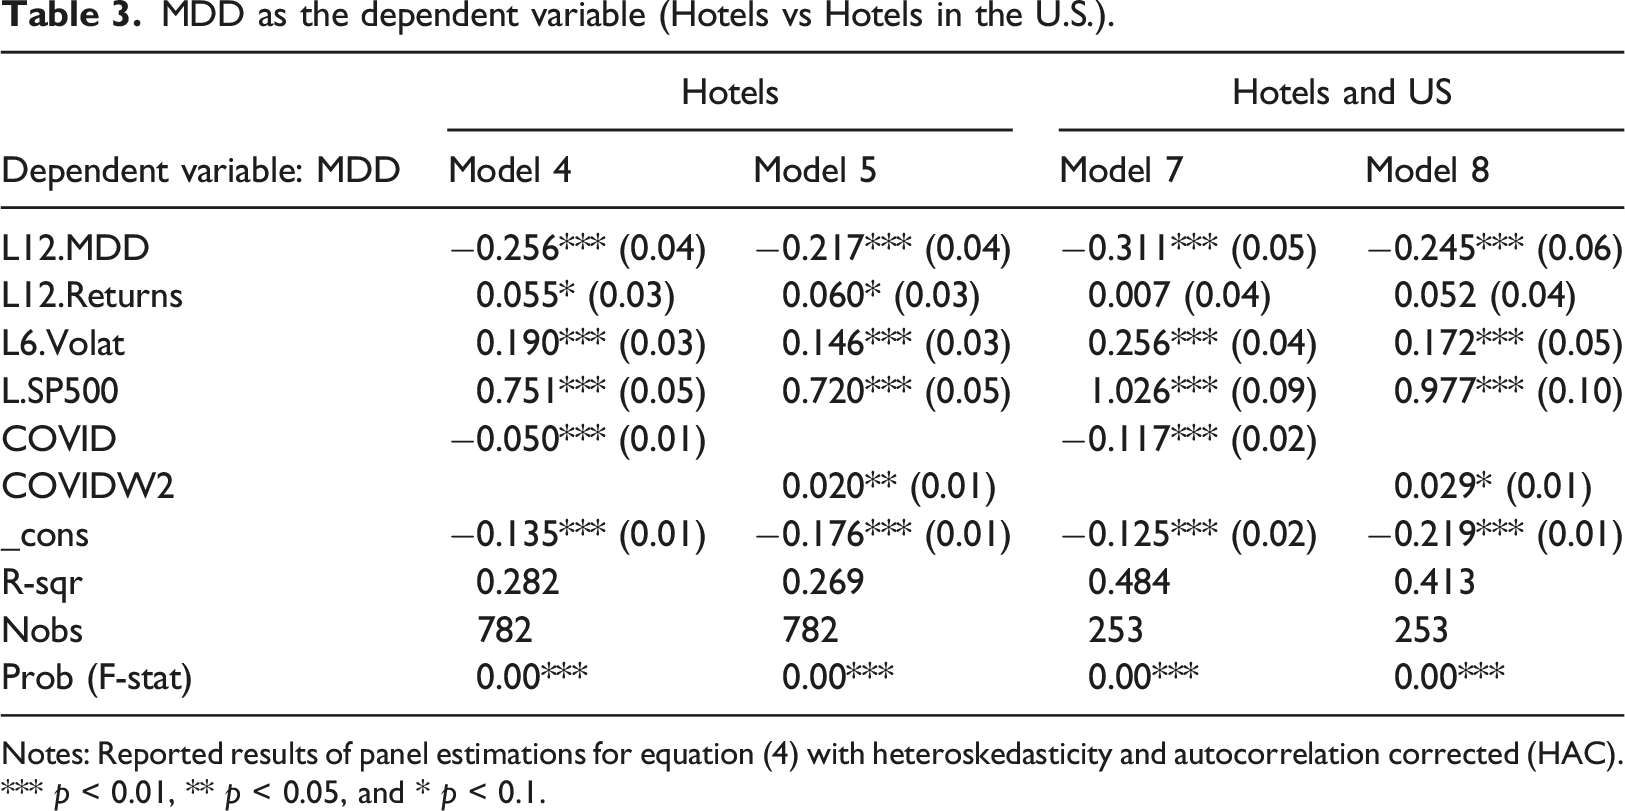
Notes: Reported results of panel estimations for equation (4) with heteroskedasticity and autocorrelation corrected (HAC).
*** p < 0.01, ** p < 0.05, and * p < 0.1.
MDD as the dependent variable (Restaurants vs Restaurants in the U.S.).
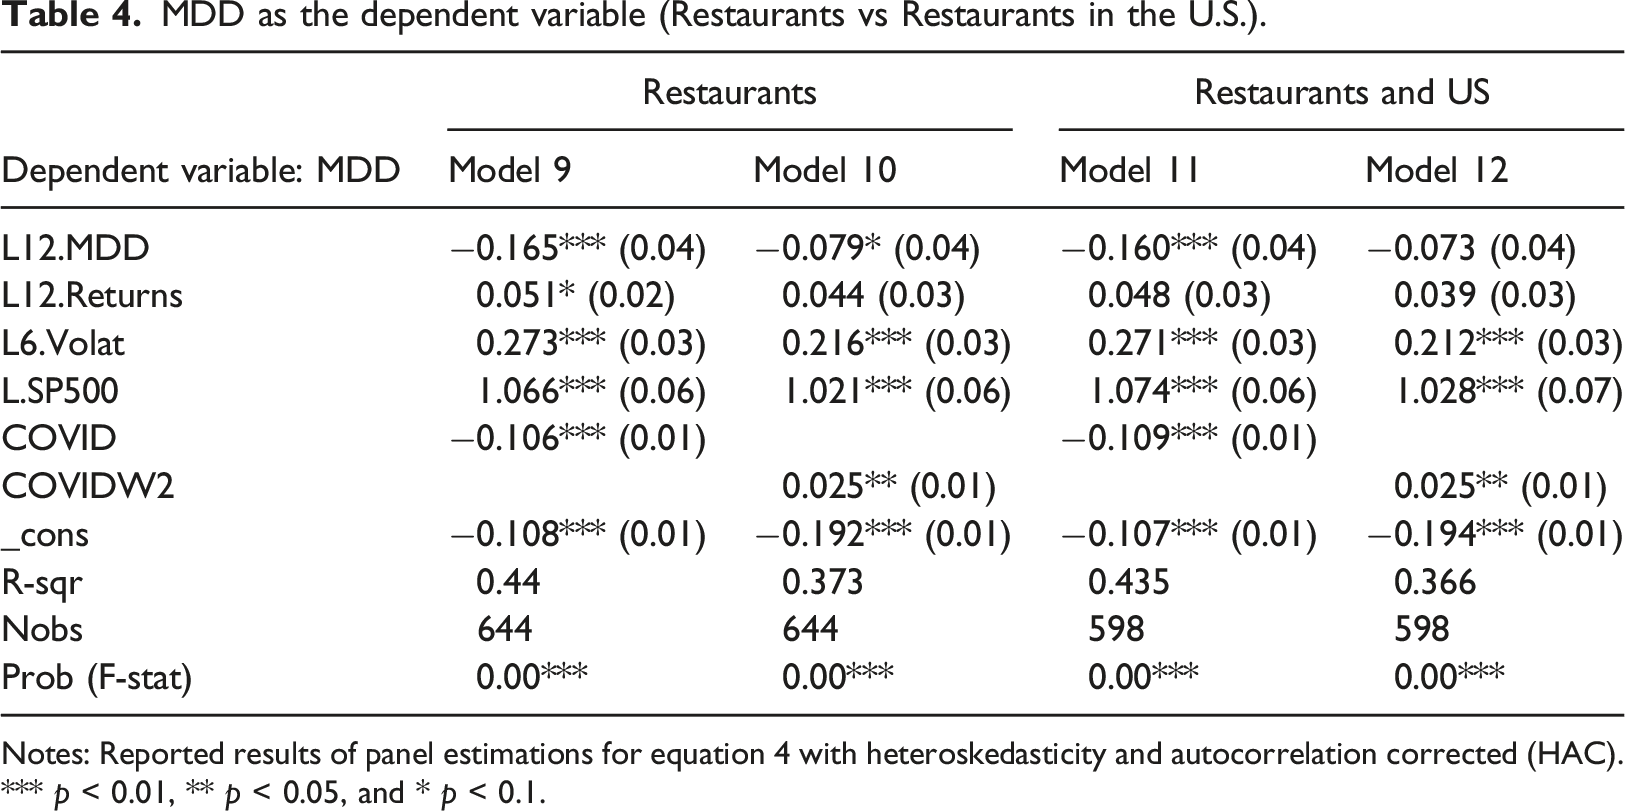
Notes: Reported results of panel estimations for equation 4 with heteroskedasticity and autocorrelation corrected (HAC).
*** p < 0.01, ** p < 0.05, and * p < 0.1.
In Table 3, models 4 and 5 analyze the case of hotels in general, while models 6 and 7 focus on hotels in the United States. We observe a similar pattern to the one seen for the whole group, except that returns before COVID-19 were not significant for hotels in the U.S. What is remarkable is that those hotels in the U.S. that suffered extreme events before the crisis were those that better managed to navigate the crisis versus the whole sample. Moreover, the correlation with the SP500 also increased during this period.
Finally, Table 4 presents the case of Restaurants in general (models 8 and 9) and in the U.S. in particular (models 10 and 11). We observe that the sign of parameters is similar, but the impact of pass returns and volatility is more significant. The impact of the first wave was not significantly different from the impact of the whole COVID period when the sample was split and consequently not included in Tables 2 and 4. 3 We can also observe that restaurants react more to changes in the overall market than hotels.
Concluding remarks
In this paper, we shed new light on the implications of a shareholder’s decision to hang on to a stock during times of crisis like a pandemic, focusing on downside risk.
In particular, we found that companies that were willing to engage in more risky activities before COVID-19 were less affected by the crisis. Even if the volatility of those assets was not necessarily lower during the crisis, the downside risk was lower. We also observe that although hotels suffered bigger losses during the period of analysis, restaurants were more affected by extreme events. Finally, we found that during the first wave of COVID-19 share prices dropped more than during both the second wave of COVID-19 and the entire pandemic.
Our results are extremely important for those investors who are averse to extreme events. We provide some hints that can be useful when evaluating where to invest. It is important to recognize that our results might be biased due to limitations in the database and the fact that COVID-19 was still an ongoing problem while writing this paper.
Footnotes
Acknowledgments
This research is partially funded by RCSO Economie & Management, project “Corporate Decision making under high uncertainty” (N° Sagex 105743; HES-SO) and by the Spanish Ministry of Science and Innovation, project PID2020-114108GB-I00.
Declaration of conflicting interests
The author(s) declared no potential conflicts of interest with respect to the research, authorship, and/or publication of this article.
Funding
The author(s) disclosed receipt of the following financial support for the research, authorship, and/or publication of this article: This work was supported by the Haute école Spécialisée de Suisse Occidentale; Sagex 105743; HES-SO.