
Abstract
We use county-level data to examine how the COVID-19 pandemic affected the tourism and hospitality sector, which was by far the most impacted of all sectors, focusing on employment and wage changes. Results support our hypothesis that rural counties experienced fewer negative impacts or even benefited from the COVID-19 pandemic in terms of job growth. We present maps showing the pandemic’s effects on leisure and hospitality (L&H) employment across the nation, identifying the communities both hardest hit and least impacted. A linear regression model is developed to explore independent factors that influenced the pandemic’s local impact. Results are robust across different measures of the key variable (rurality), including rural-urban continuum codes, distance from metropolitan areas, and population density. We also consider the impacts of social capital, income, and local economic diversification, among other factors. Our results suggest that remote, less-populated counties were more likely to experience stable employment in the L&H sector relative to pre-pandemic levels, and in some cases even experienced employment growth.
JEL Classification: J2, J3, R1
Introduction
Leisure and Hospitality (L&H) was by far the hardest hit sector early in the COVID-19 pandemic, with employment collapsing by more than half. The L&H sector includes Arts, Entertainment, and Recreation (NAICS 71) and Accommodation and Food Services (NAICS 72) establishments. Firms in these sub-sectors were severely impacted by lockdowns in many states that ensured social distancing and reduced the spread of the SARS-CoV-2 virus. As of summer 2021, nearly one year-and-a-half after the start of the pandemic, L&H employment nationally was still 8% below pre-pandemic levels (Figure 1). Monthly employment by sector, July 2019 = 100.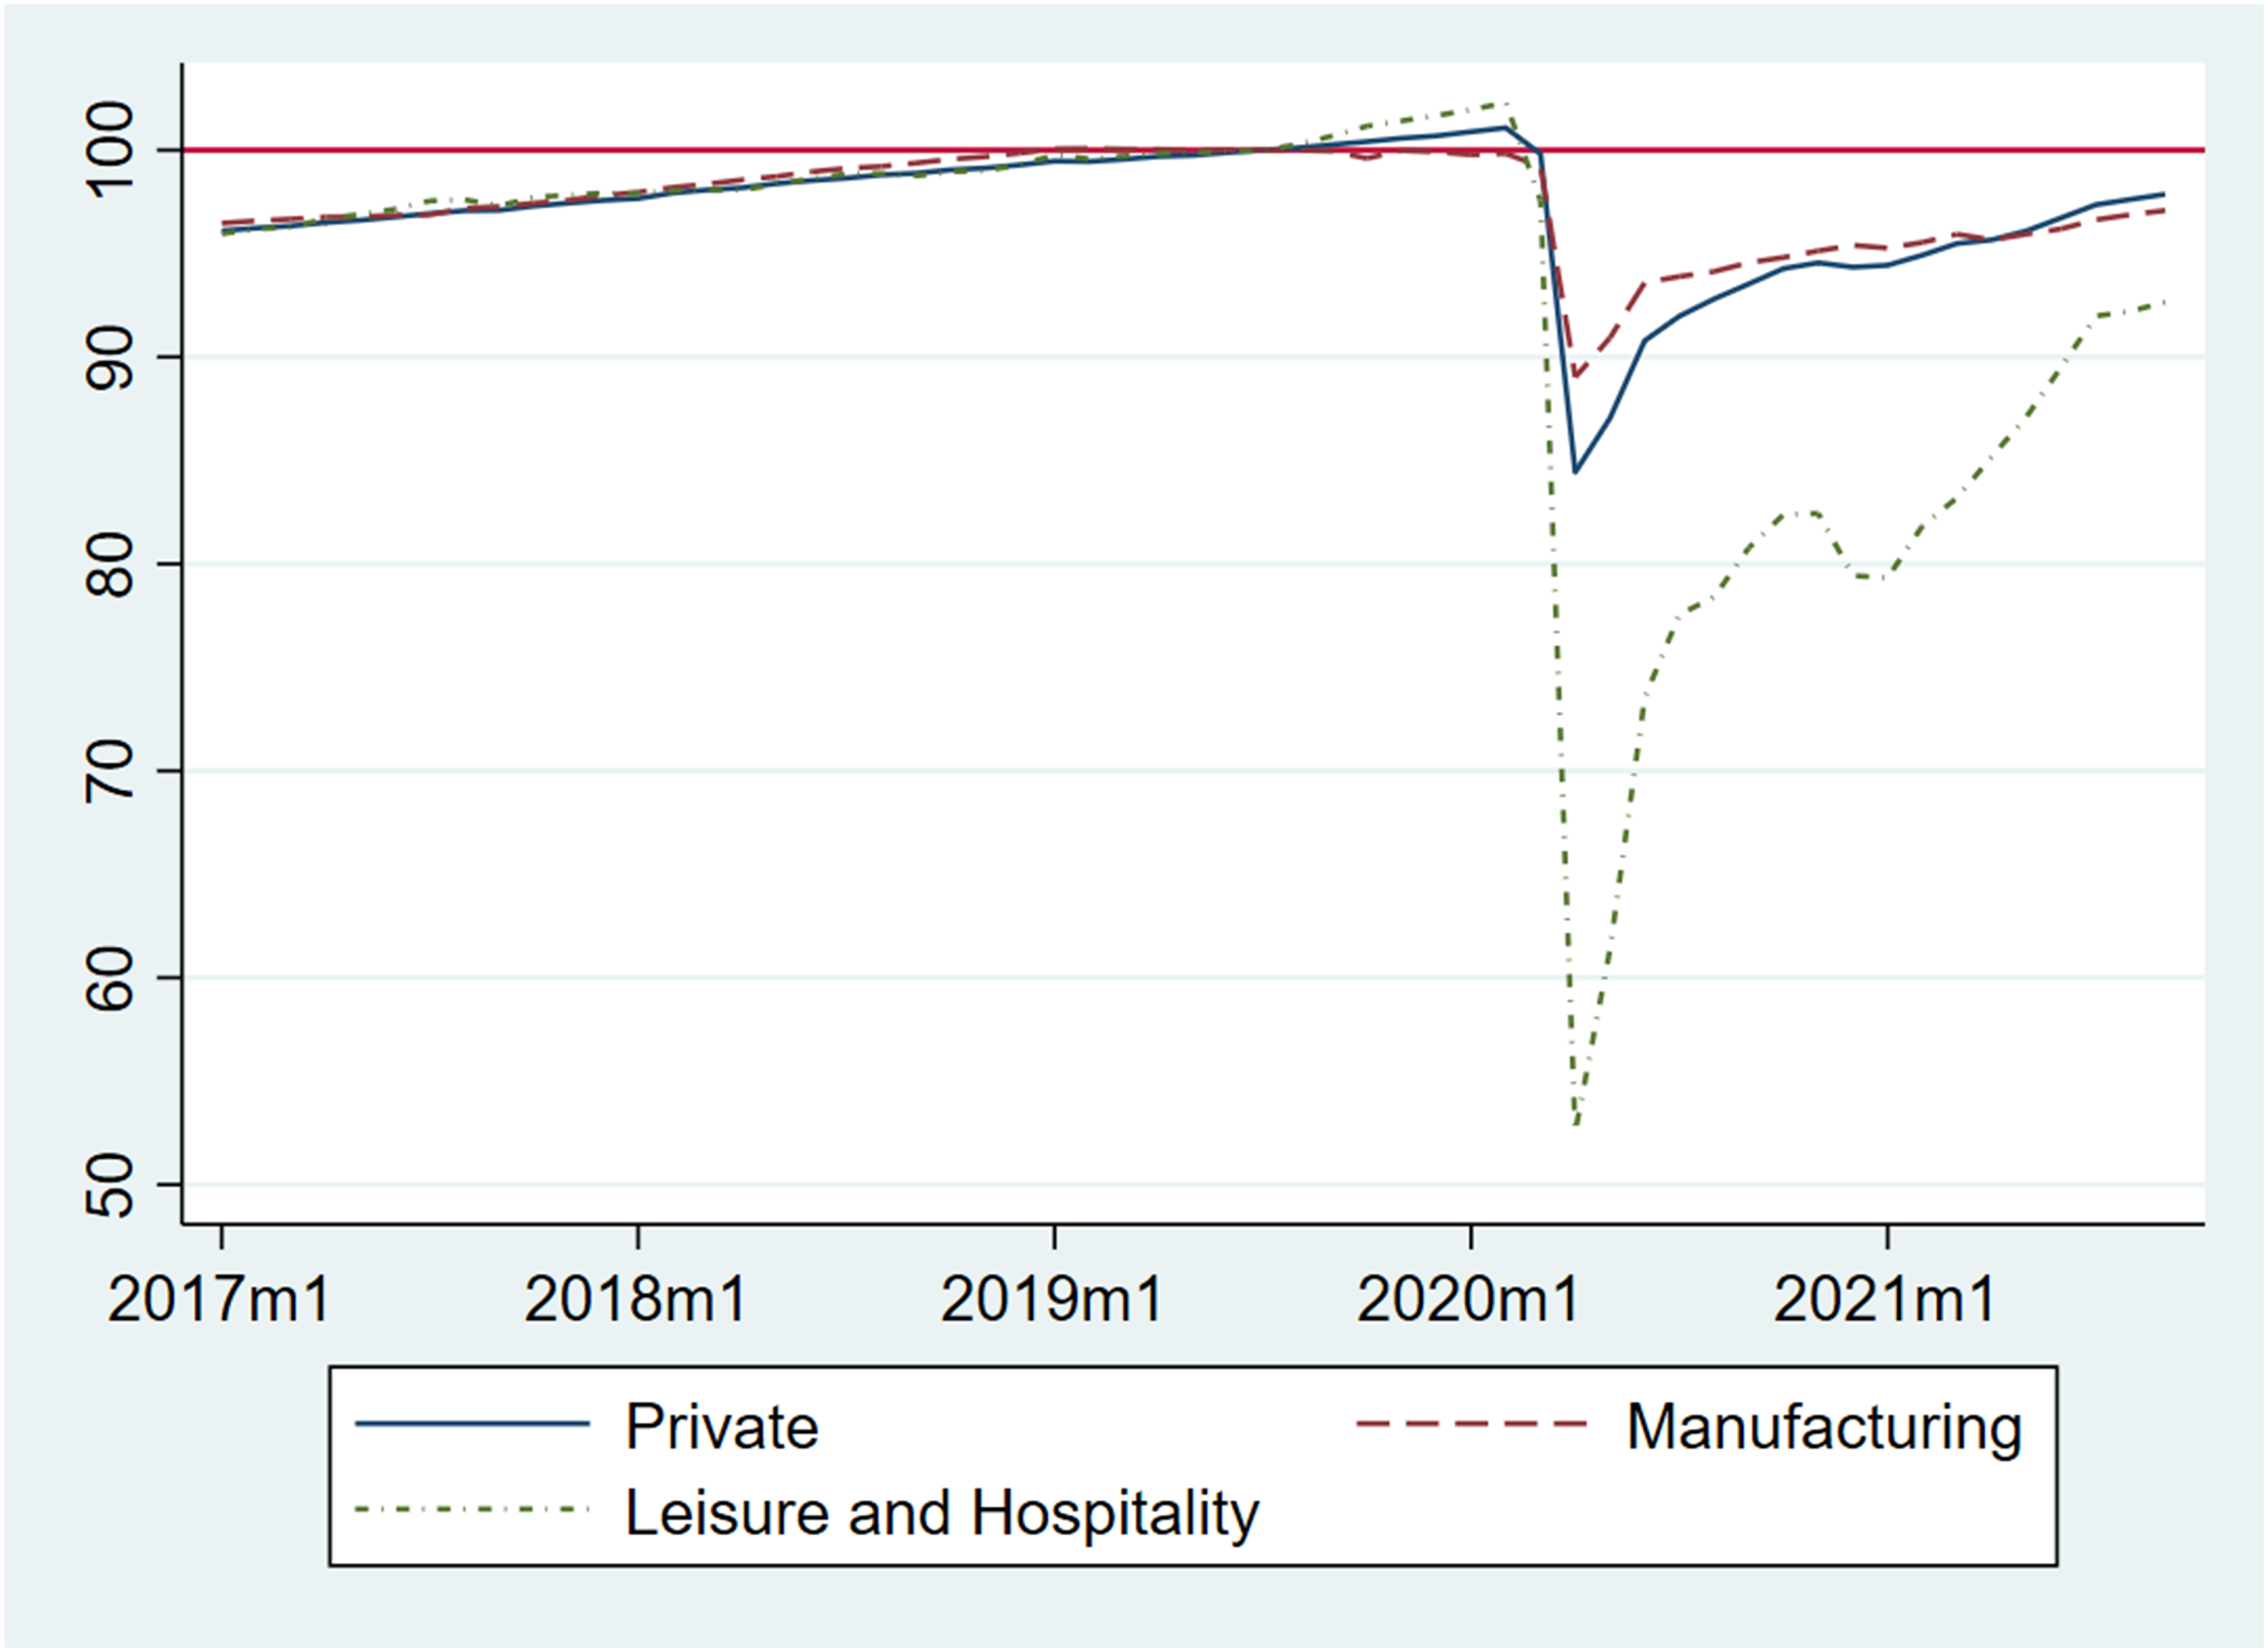
In this paper, we examine county-level changes in L&H employment between the third quarter of 2019 (2019 Q3) and 2020 (2020 Q3) using Quarterly Census of Employment and Wages (QCEW) data. The third quarter—July, August, and September—covers the period corresponding to peak U.S. vacation months, and this allows us to compare typical seasonal employment patterns prior to the pandemic and in its midst. In addition to employment change, we also consider contemporaneous average weekly wage changes in the L&H sector from 2019 Q3 to 2020 Q3, in part to assess the impact of the federal Payroll Protection Program authorized in response to the pandemic.
Our study is generally motivated by anecdotal observations in public media according to which outdoor recreation and tourism in remote rural, high amenity areas increased dramatically during the pandemic (e.g., Chow, 2020; Guilford, 2020; Pohle, 2021), as urban residents sought to escape from densely populated areas. Related to this were reports of widespread local labor shortages, which are important to consider in the context of changes in wages, and we also examine these here. More generally, by identifying independent variables affecting employment and wage changes during a major economic shock such as COVID-19, we seek to assist local and federal decision-makers in understanding how the effects of a pandemic may spread out over space and how they impact different kinds of communities. In turn, these insights could be used for better targeting of different policy instruments designed to mitigate the effects of labor market shocks.
Our central hypothesis is that the more densely populated urban counties lost relatively more L&H-related economic activity while the opposite occurred in more remote, less densely settled areas as city residents and vacationers sought out rural areas with less risk of infection from COVID-19. Our results indeed suggest that more remote, less-populated counties were more likely to experience stable employment in the L&H sector relative to pre-pandemic levels, and in some cases, even experienced employment growth. While this experience can lead to over-tourism as a serious problem, a related challenge especially for declining rural communities may be to engage visitors not only to return as tourists at a later (post-pandemic) date, but also to explore ways of recruiting tourists to become potential long-term residents.
Motivation and literature review
Our study builds from a broad strand of literature related to labor market shocks. The Great Recession, natural disasters, and import shocks all have had substantial and varying effects on labor markets (e.g., Arestis et al., 2013; Autor et al., 2016; Barr and Turner, 2015; Fan et al., 2016; Gignoux and Menéndez, 2016; Han and Goetz, 2015; Hoang et al., 2020). Recent papers have started to discuss how COVID-19 affected labor markets (e.g., Heggeness, 2020; Hoehn-Velasco et al., 2022), but so far tourism has not received much of any attention. In pre-COVID-19 research on shocks to tourism specifically, Chen (2013) found that both demand and supply shocks impacted five hospitality sector-related economic indices, including those for airlines, gambling, hotels, restaurants, and travel and leisure. Using country-level data and the Granger causality test, Iglesias et al. (2018) investigated whether income shocks from countries that have major tourism connections with Spain affected foreign tourists’ arrivals to Spain. They found that causal relationships existed from origin countries’ income shocks to inbound Spanish tourism. Liu (2014) discussed the impacts of the typhoon on Taiwan’s national scenic area and found a loss of over 700,000 visitors in the year-and-a-half after the disaster. Watson and Deller (2021) studied the resiliency of tourism and hospitality-dependent counties to the Great Recession of 2007–2008 and found that greater dependency on this sector was associated with lower resilience. Finally, Mykerezi and Kostandini (2016) suggested that late summer travel in the U.S. declines substantially when school starts before Labor Day, indicating the importance of the timing of official federal holidays.
The L&H sector is of interest in the economic development and pandemic recovery context not only because it was severely impacted but also because the recreation sector plays an increasingly important role as a local engine of growth. The Outdoor Foundation’s recent outdoor recreation participation report (2021) showed that more than half (53%) of Americans aged six and over participated in at least one outdoor activity in 2020. Data from the Bureau of Economic Analysis’ Outdoor Recreation Satellite Account (ORSA) show that the outdoor recreation economy accounted for 2.1% ($459.8 billion) of U.S. gross domestic product and employed nearly 5.2 million workers in 2019 (U.S. Bureau of Economic Analysis, 2020). Outdoor recreation is especially important for rural economies. Outdoor Recreation Satellite Account data from 2018 show that the industry represents a larger share of GDP than many industry sectors that are commonly the focus of economic development efforts in rural areas such as mining (1.2%) and utilities (1.6%), and its contribution is more than double that of U.S. farm production (0.7%) (Highfill et al., 2018; U.S. Bureau of Economic Analysis 2020). Moreover, USDA Economic Research Service data show that since 2010, recreation-dependent counties have been the fastest-growing of all rural counties in both population (Marema, 2021) and per capita personal income (Pender et al., 2019).
Evidence is mixed for how economic shocks impact regional economies that depend on tourism and hospitality industries for employment and income. As already noted, Watson and Deller (2021) found that a higher dependence on tourism and hospitality was associated with lower levels of county resiliency during the Great Recession, a finding consistent with the sector's dependence on consumer discretionary spending. However, the authors also note regional variations in this pattern, especially in tourism destinations where residents from the larger region could substitute long-distance travel for access to relatively cheaper and more accessible public lands (e.g., northern Minnesota). In contrast, Boettner et al. (2019), in a study of the Appalachian Regional Commission region, found that counties with higher recreational activity-related employment tended not only to be economically more resilient but also recovered more quickly from the 2007–2008 Global Financial Crisis. They explained this as reflecting a substitution from international to lower-cost domestic travel resulting from lower disposable incomes in the short term.
The economic downturn in the L&H sector caused by COVID-19 was unique in that the reductions in spending were primarily driven by personal and public health safety measures such as social distancing requirements, travel bans, community lockdowns, and self-imposed quarantines (Sigala, 2020). Given the nature of the virus’s spread and the subsequent real and perceived risks to visitors, the impacts to L&H actors, activities, and places will also show variation across space and time (Sigala, 2020). For example, despite the impact on L&H employment data, participation in outdoor activities in 2020 increased by 7.1 million participants from 2019 levels (Outdoor Foundation, 2021). Research suggests this was primarily driven by participants’ perceived risk. For example, in a global study of tourist and traveler risk management perceptions, Rahman et al. (2021) found that increased travel risk perceptions were associated with avoiding overpopulated destinations. Likewise, Landry et al. (2021) found in a survey of U.S. residents that households with a lower subjective perception of infection took more outdoor recreation trips. Additionally, households with pre-existing health conditions that could cause complications from COVID-19 were more likely to take outdoor recreation trips all else being equal, perhaps because of the perceived relative safety associated with being outdoors (Landry et al., 2021).
These findings suggest that more remote destinations may have been less negatively impacted by the economic fallout from COVID-19. Recent ERS and BLS data show that the August 2020 unemployment rate in recreation dependent nonmetro counties (7.0%) was 2.4% points below the rate in recreation dependent metro counties (9.4%) (Cromartie et al., 2020). This raises questions as to the spatial differences in impacts of the pandemic and whether the L&H sector, although among the most severely impacted, allowed at least some counties and regions to recover more rapidly from the pandemic.
Data
Our primary data are from the Quarterly Census of Employment and Wages (QCEW). The QCEW reports employment and wages at the industry level for different geographies (e.g., nation, state, MSA, and county). We use the county-level third quarter QCEW data for the Leisure and Hospitality industry from 2019 to 2020 as this allows us to compare changes over the peak tourism periods in the US (i.e., July and August). County-level data are the smallest geographical area for which we have consistent data over time from which to derive reliable estimates to test our hypothesis. County-level data allow us to examine whether rural areas within states were impacted differently by the pandemic; an MSA-level analysis alone would miss the entire set of rural counties rich in L&H activity. In this manner, each county is regarded as a unit representing employment and wages in the local L&H industry, which in turn are impacted by local economic conditions, including the rural-urban status.
Dictionary of variables.
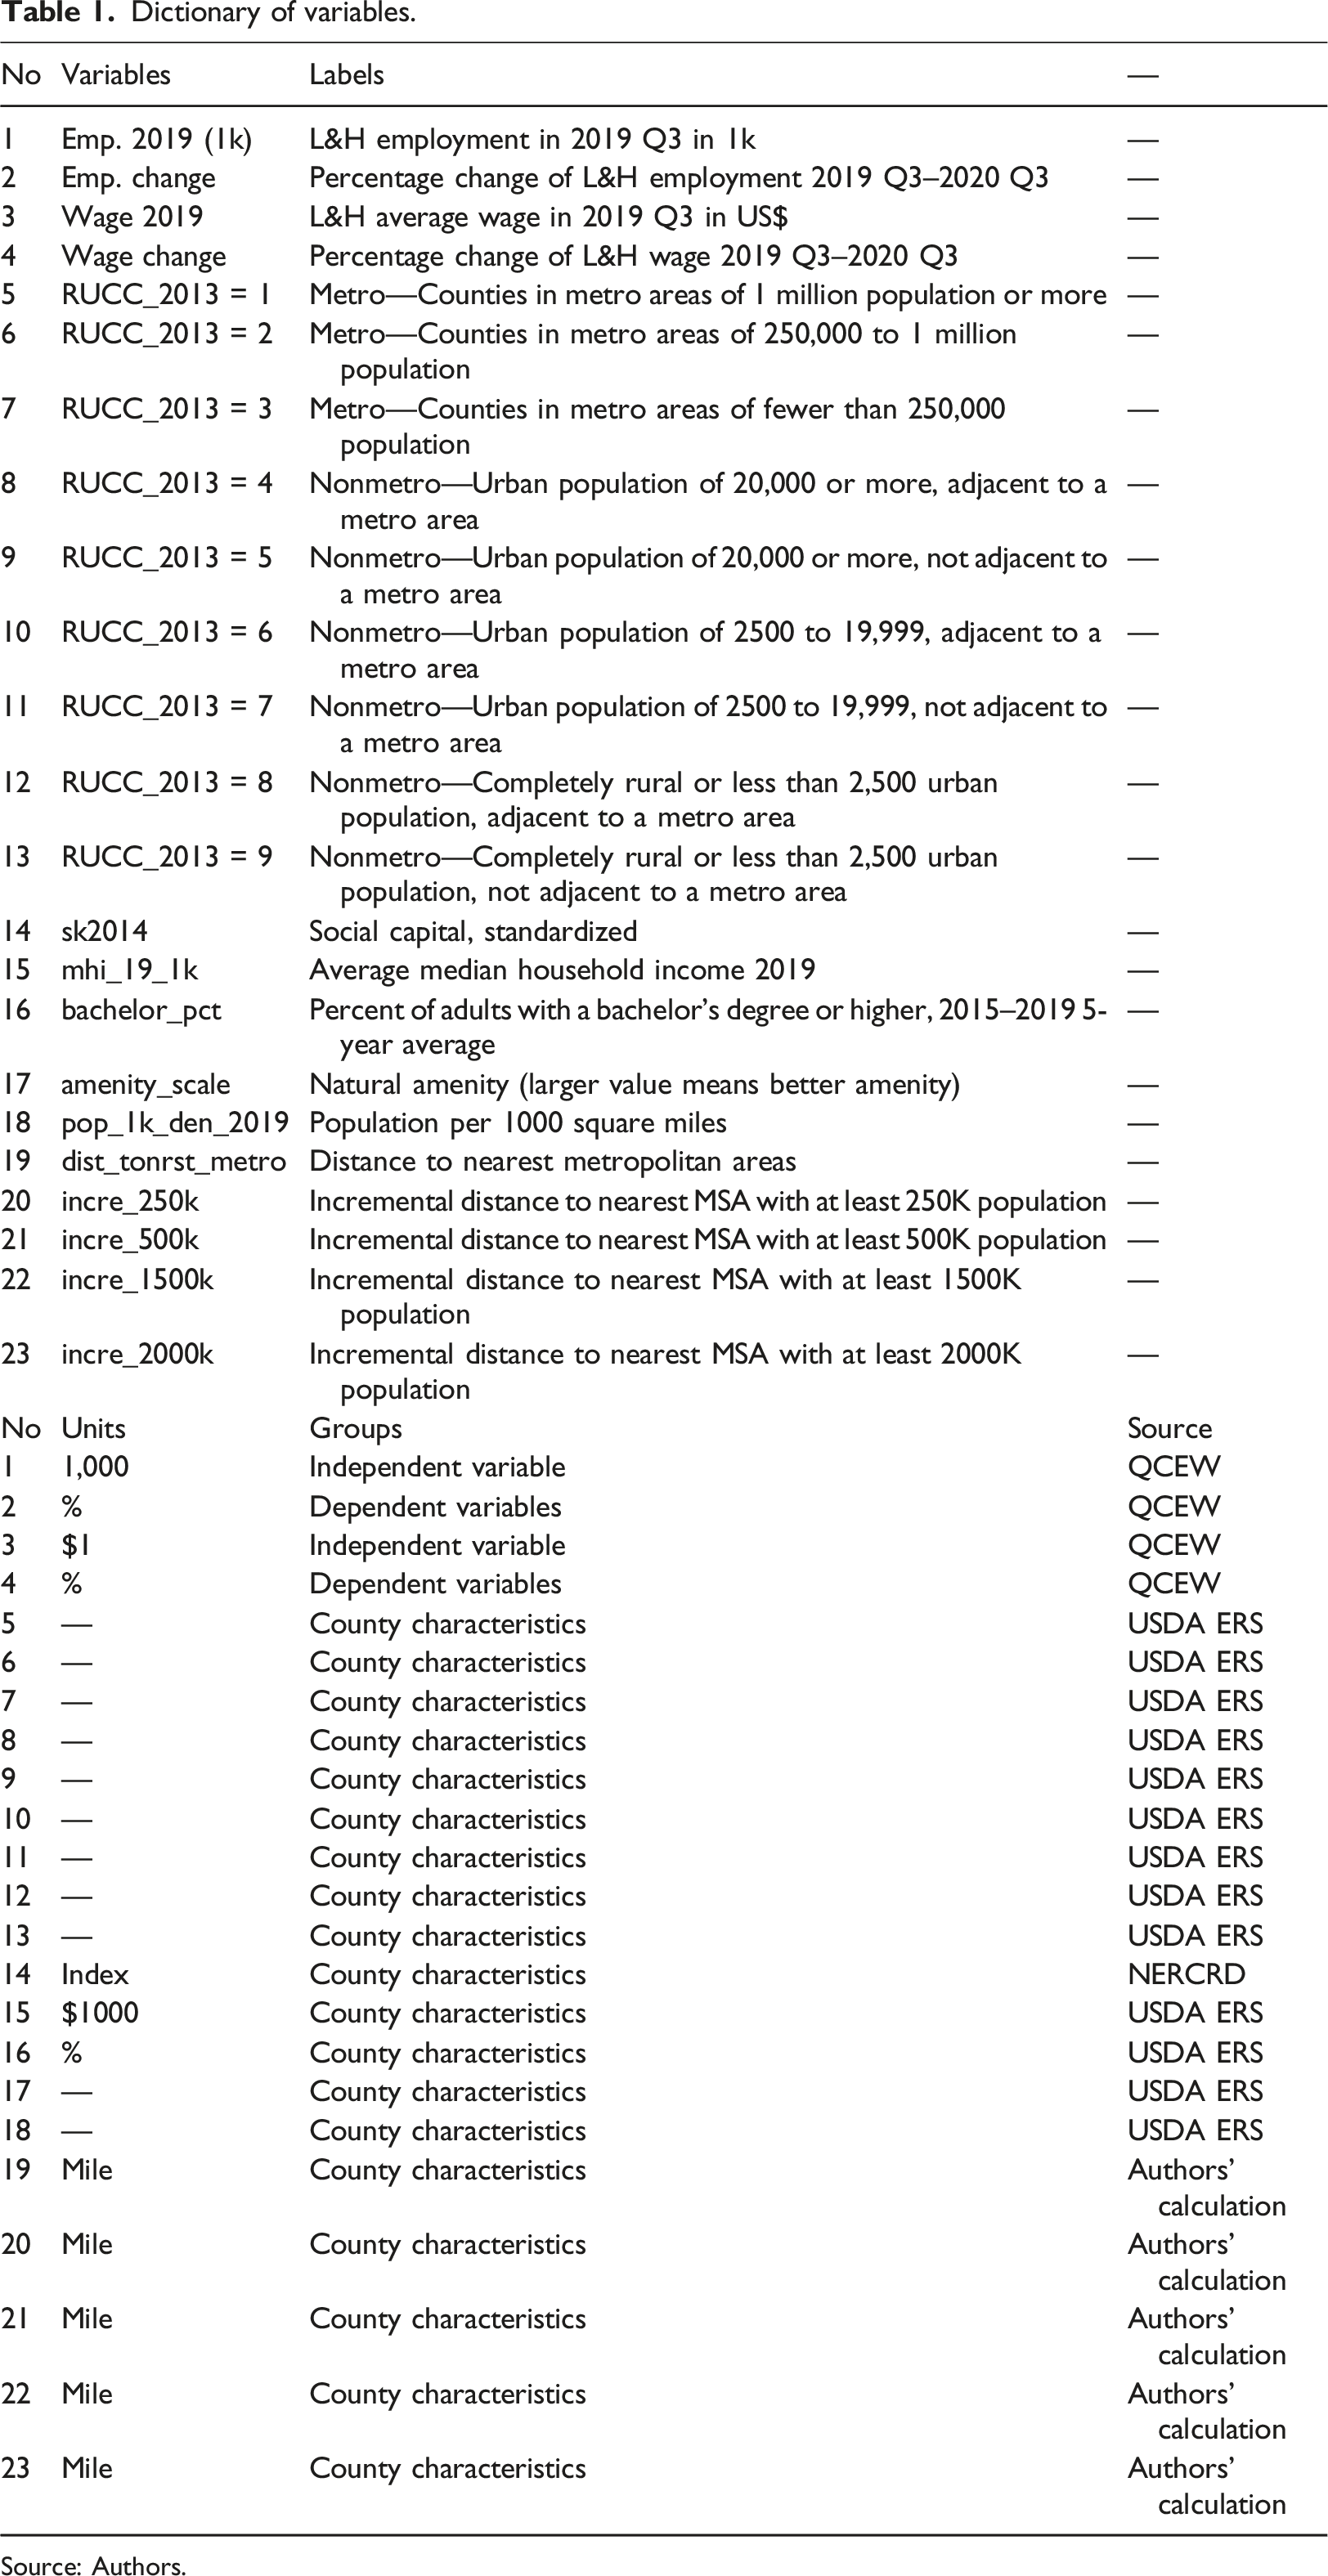
Source: Authors.
Finally, in terms of sample selection, the sampling units in these types of county-level regression analyses are considered to be representative units of the phenomena being studied. As such, they also represent the entire population (i.e., the US) rather than a random sample in any given year. This also means that the classical statistical concern of validity is not an issue as we are measuring actual variations in economic and social processes over all geographic units, as captured in official survey statistics. More generally, this follows in a long tradition of research in regional science that uses this type of data and analysis, including most recently Watson and Deller’s (2021) article.
Descriptive analysis
Figure 2 shows L&H employment as a share of total employment at the county level.
1
High employment shares are evident along the nation’s coasts as well as in pockets of Northern New England, the Great Lakes with their high densities of second or vacation homes, the intermountain West as well as numerous pockets of well-known tourist destinations such as Branson, MO in the Ozarks and Gatlinburg, TN in the Smoky Mountains, etc. The USDA’s ERS has published a similar map showing high concentrations of recreational activity (Recreation Counties, 2015 edition).
2
These areas generally coincide with those in Figure 2. However, there are fewer concentrations with high recreational activity in the ERS map, given its inclusion and weighting of seasonal housing, along with recreation sector employment and earnings. Share of leisure and hospitality employment in all employment, 2019 Q3.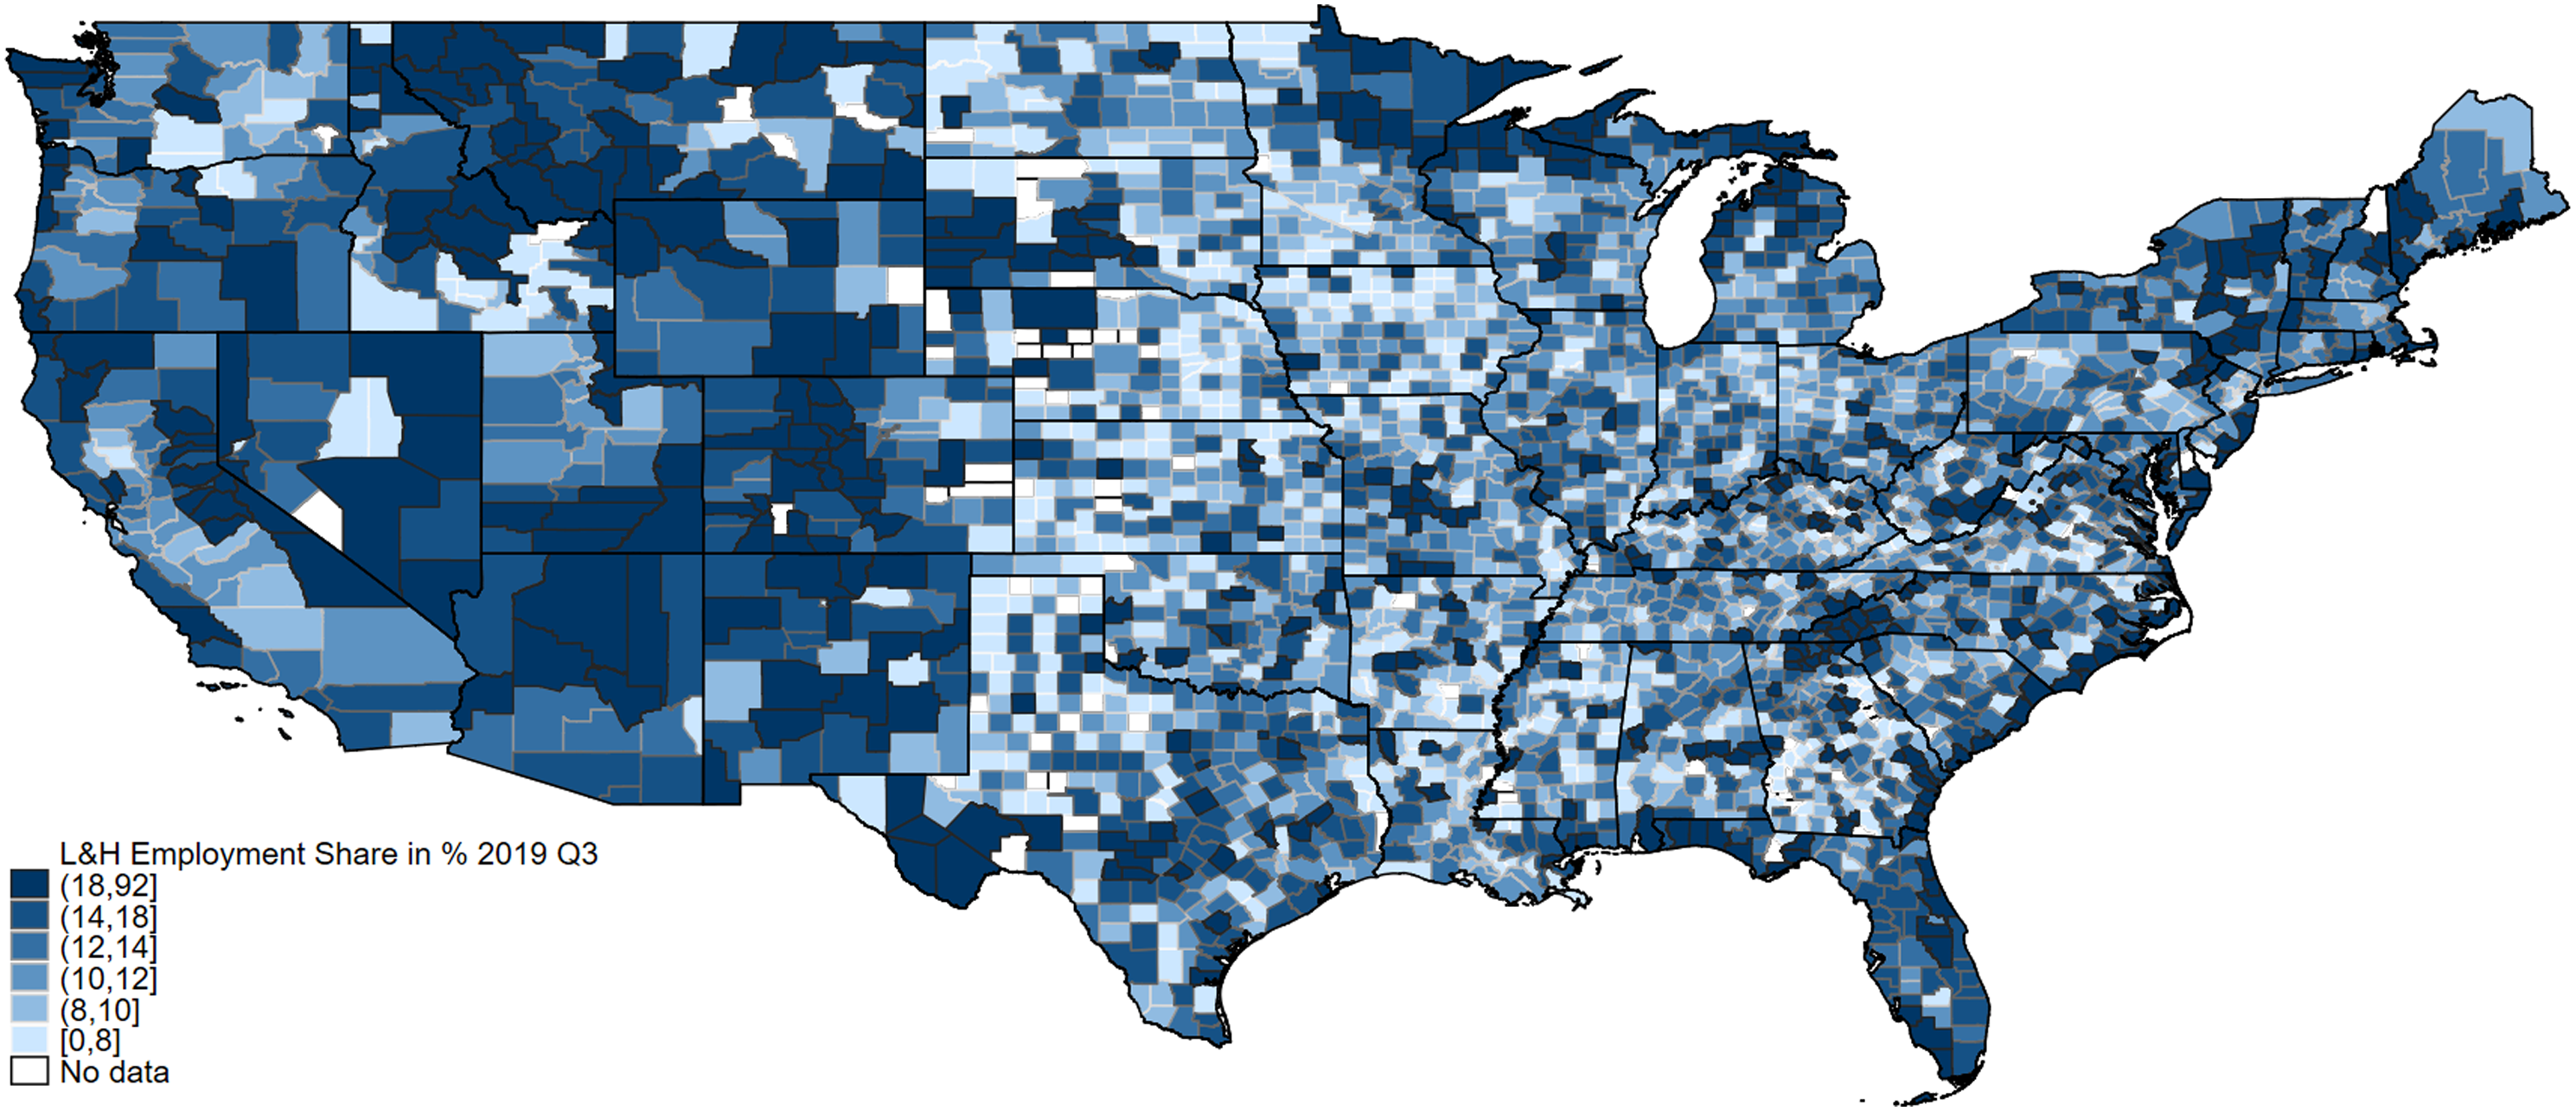
Next, we map L&H employment change over the third quarters from 2019 to 2020 (Figure 3). Because the third quarter covers peak vacation months and the COVID-19 outbreak started in March 2020, comparing the change over this period allows us to scrutinize how the L&H industry in each county was affected by the COVID-19 shock. On average, employment in L&H declined by 12.2% across all counties over the one-year period, with a minimum of –71% and a maximum of 123% (Table 2). In Figure 3, large concentrations of decline (red areas) appear in northern counties of the Northeast and Arizona, New Mexico, California, and Washington State. Individual counties scattered throughout the nation’s heartland also lost employment at rates above 27%. In contrast, many counties throughout the nation's central regions, the intermountain West and the U.S. South, experienced significant growth in L&H employment over this period. A cursory analysis of the patterns in Figure 3 thus supports our central hypothesis. Percent change in leisure and hospitality employment, 2019 Q3–2020 Q3. Descriptive statistics. Source: Authors. Note: Sample includes all the counties in contiguous 48 U.S. states, excluding Alaska, Hawaii, and the District of Columbia. The employment/ wage change is calculated as the leisure and hospitality employment/ wage in 2020 Q3 minus 2019 Q3 and divided by 2019 Q3 L&H employment/ wage, and times 100 to get percentage change. See Table 1 for variables’ descriptions.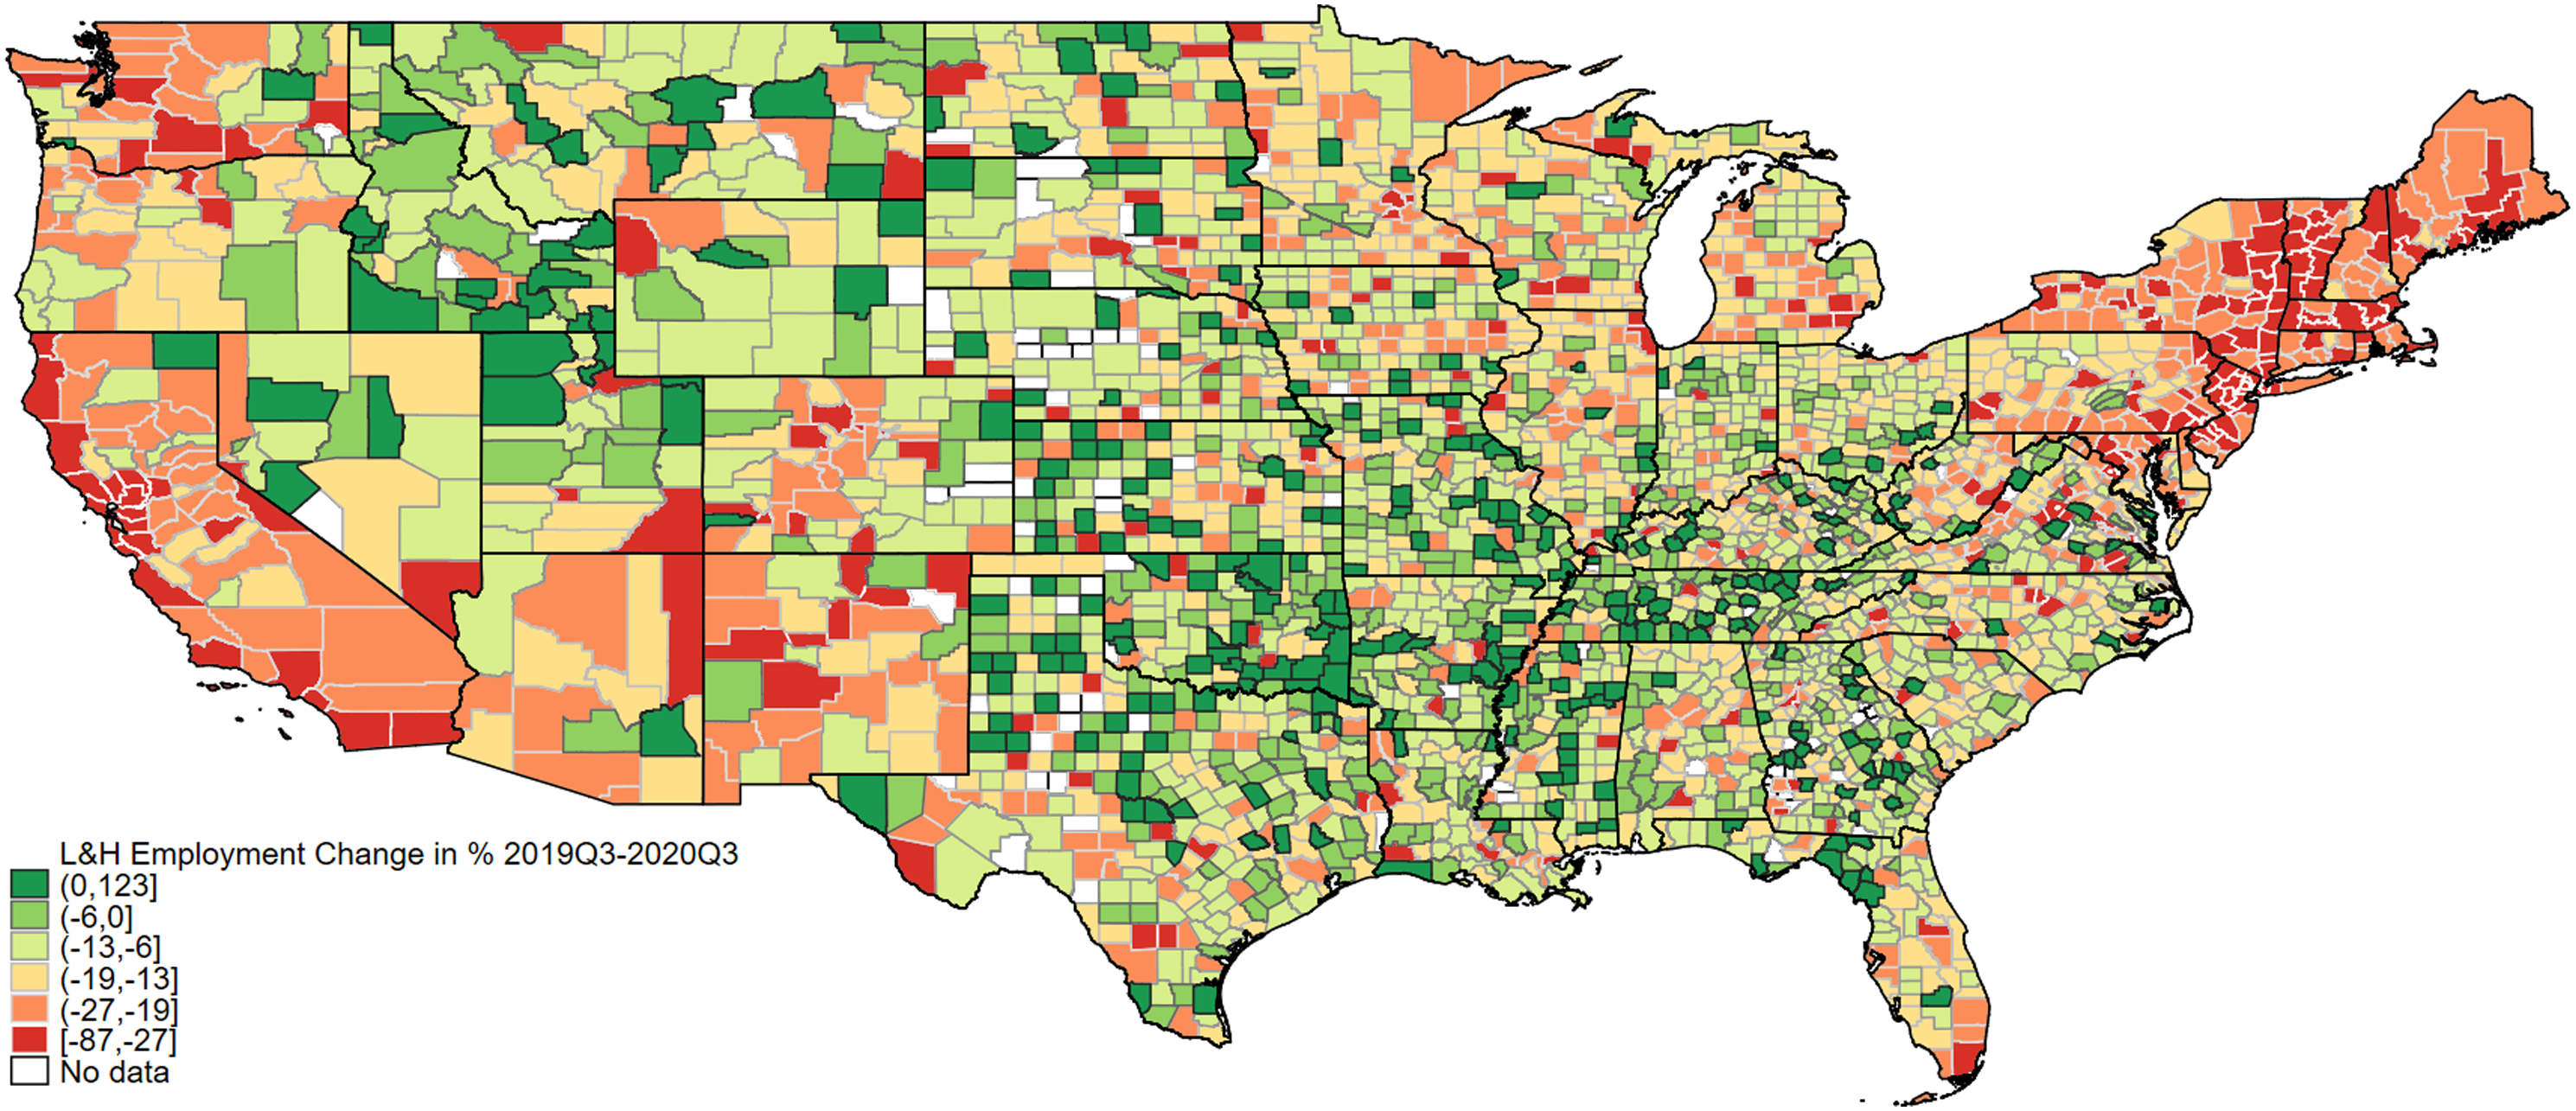
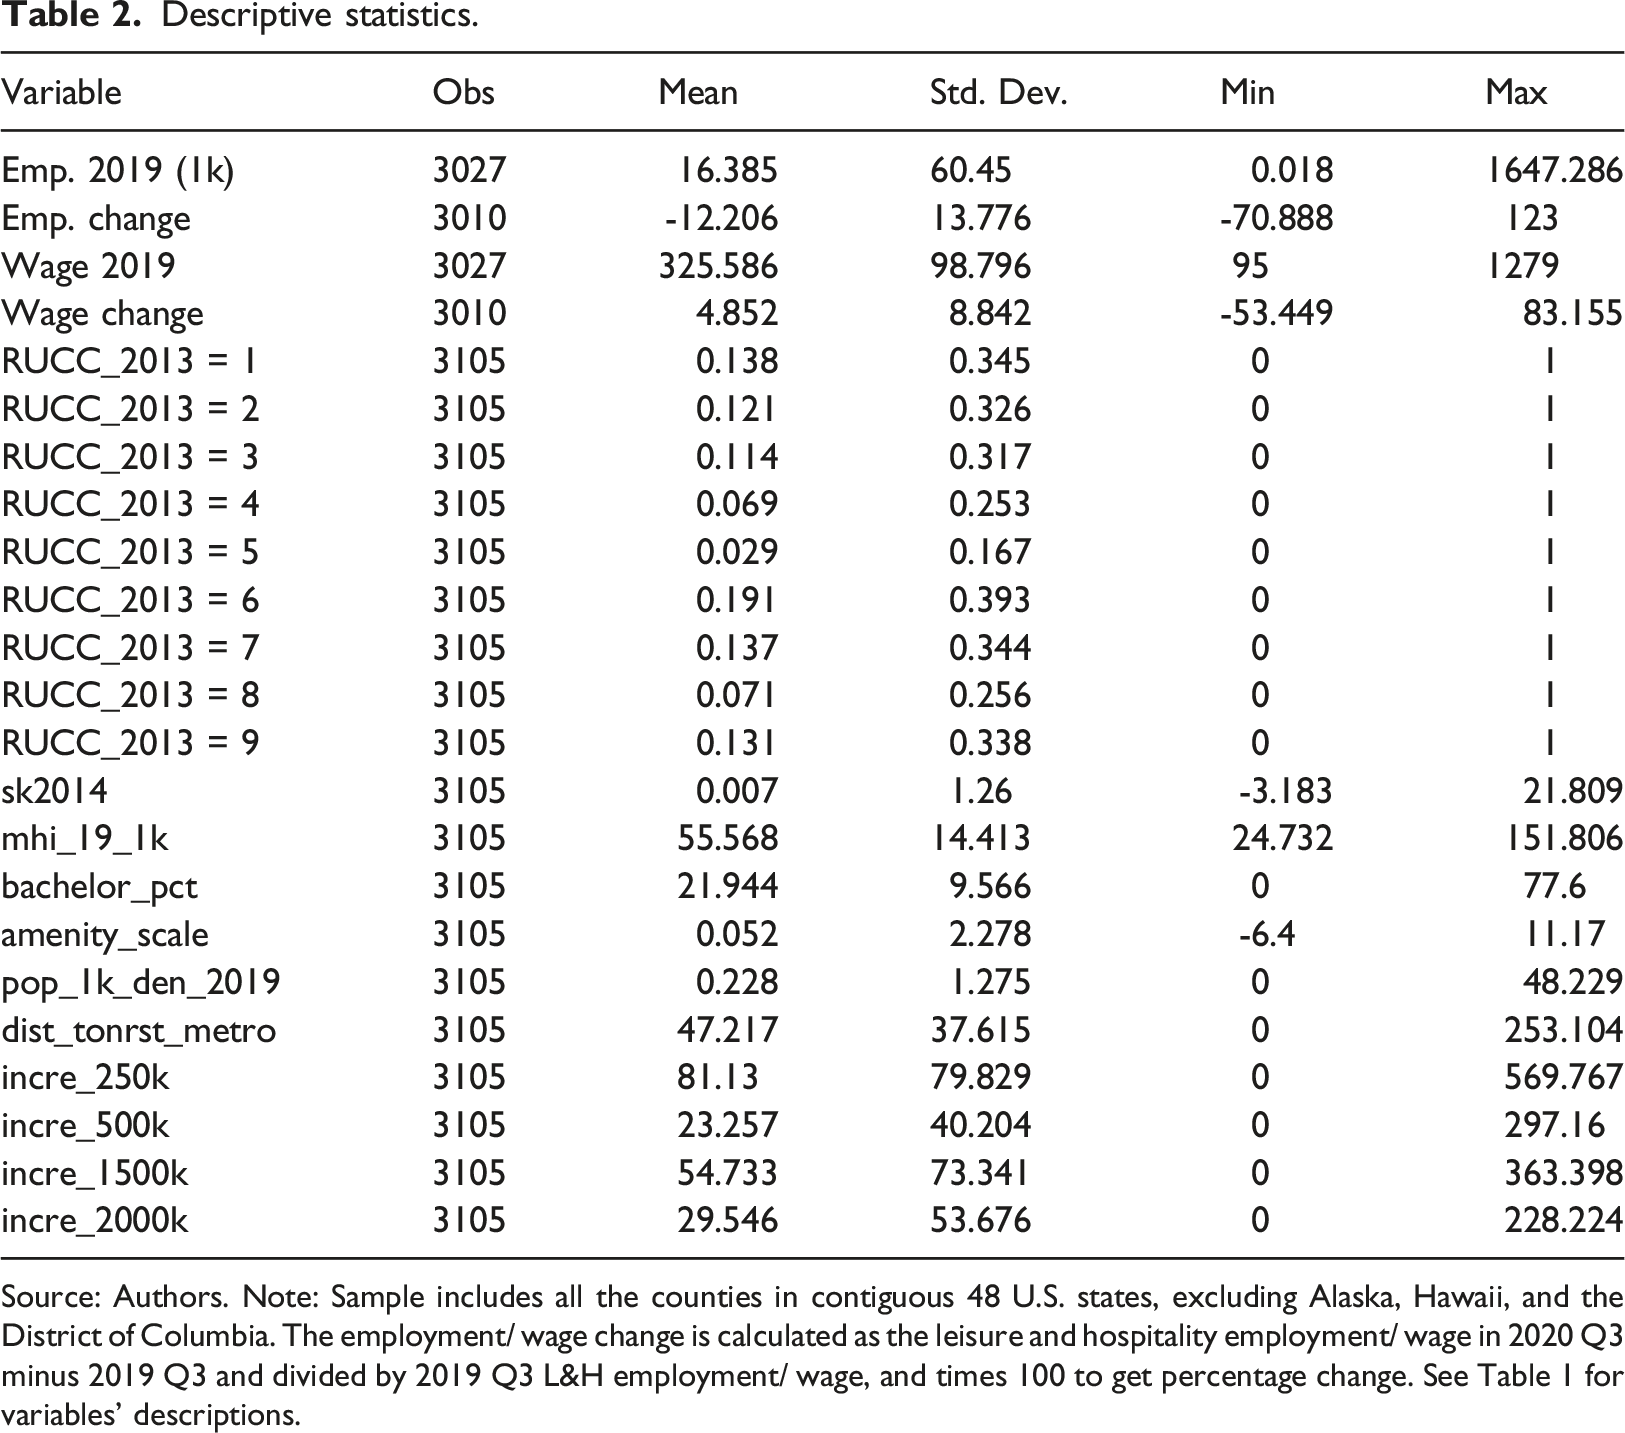
Figure 4 shows an entirely different story for wage changes from 2019 Q3 to 2020 Q3 compared to employment changes in Figure 3. For example, coastal areas of California, New York, and Florida, where employment was hard hit, saw slightly higher average wages. On average, L&H wages increased by 4.9% across all counties over the one-year period, with a minimum of –53% and a maximum of 83% (see Table 2). A tabulation of the data shows 2400 counties in which the real wage in the leisure and hospitality industry increased from 2019 Q3 to 2020 Q3, while employment increased in only 332 counties.
3
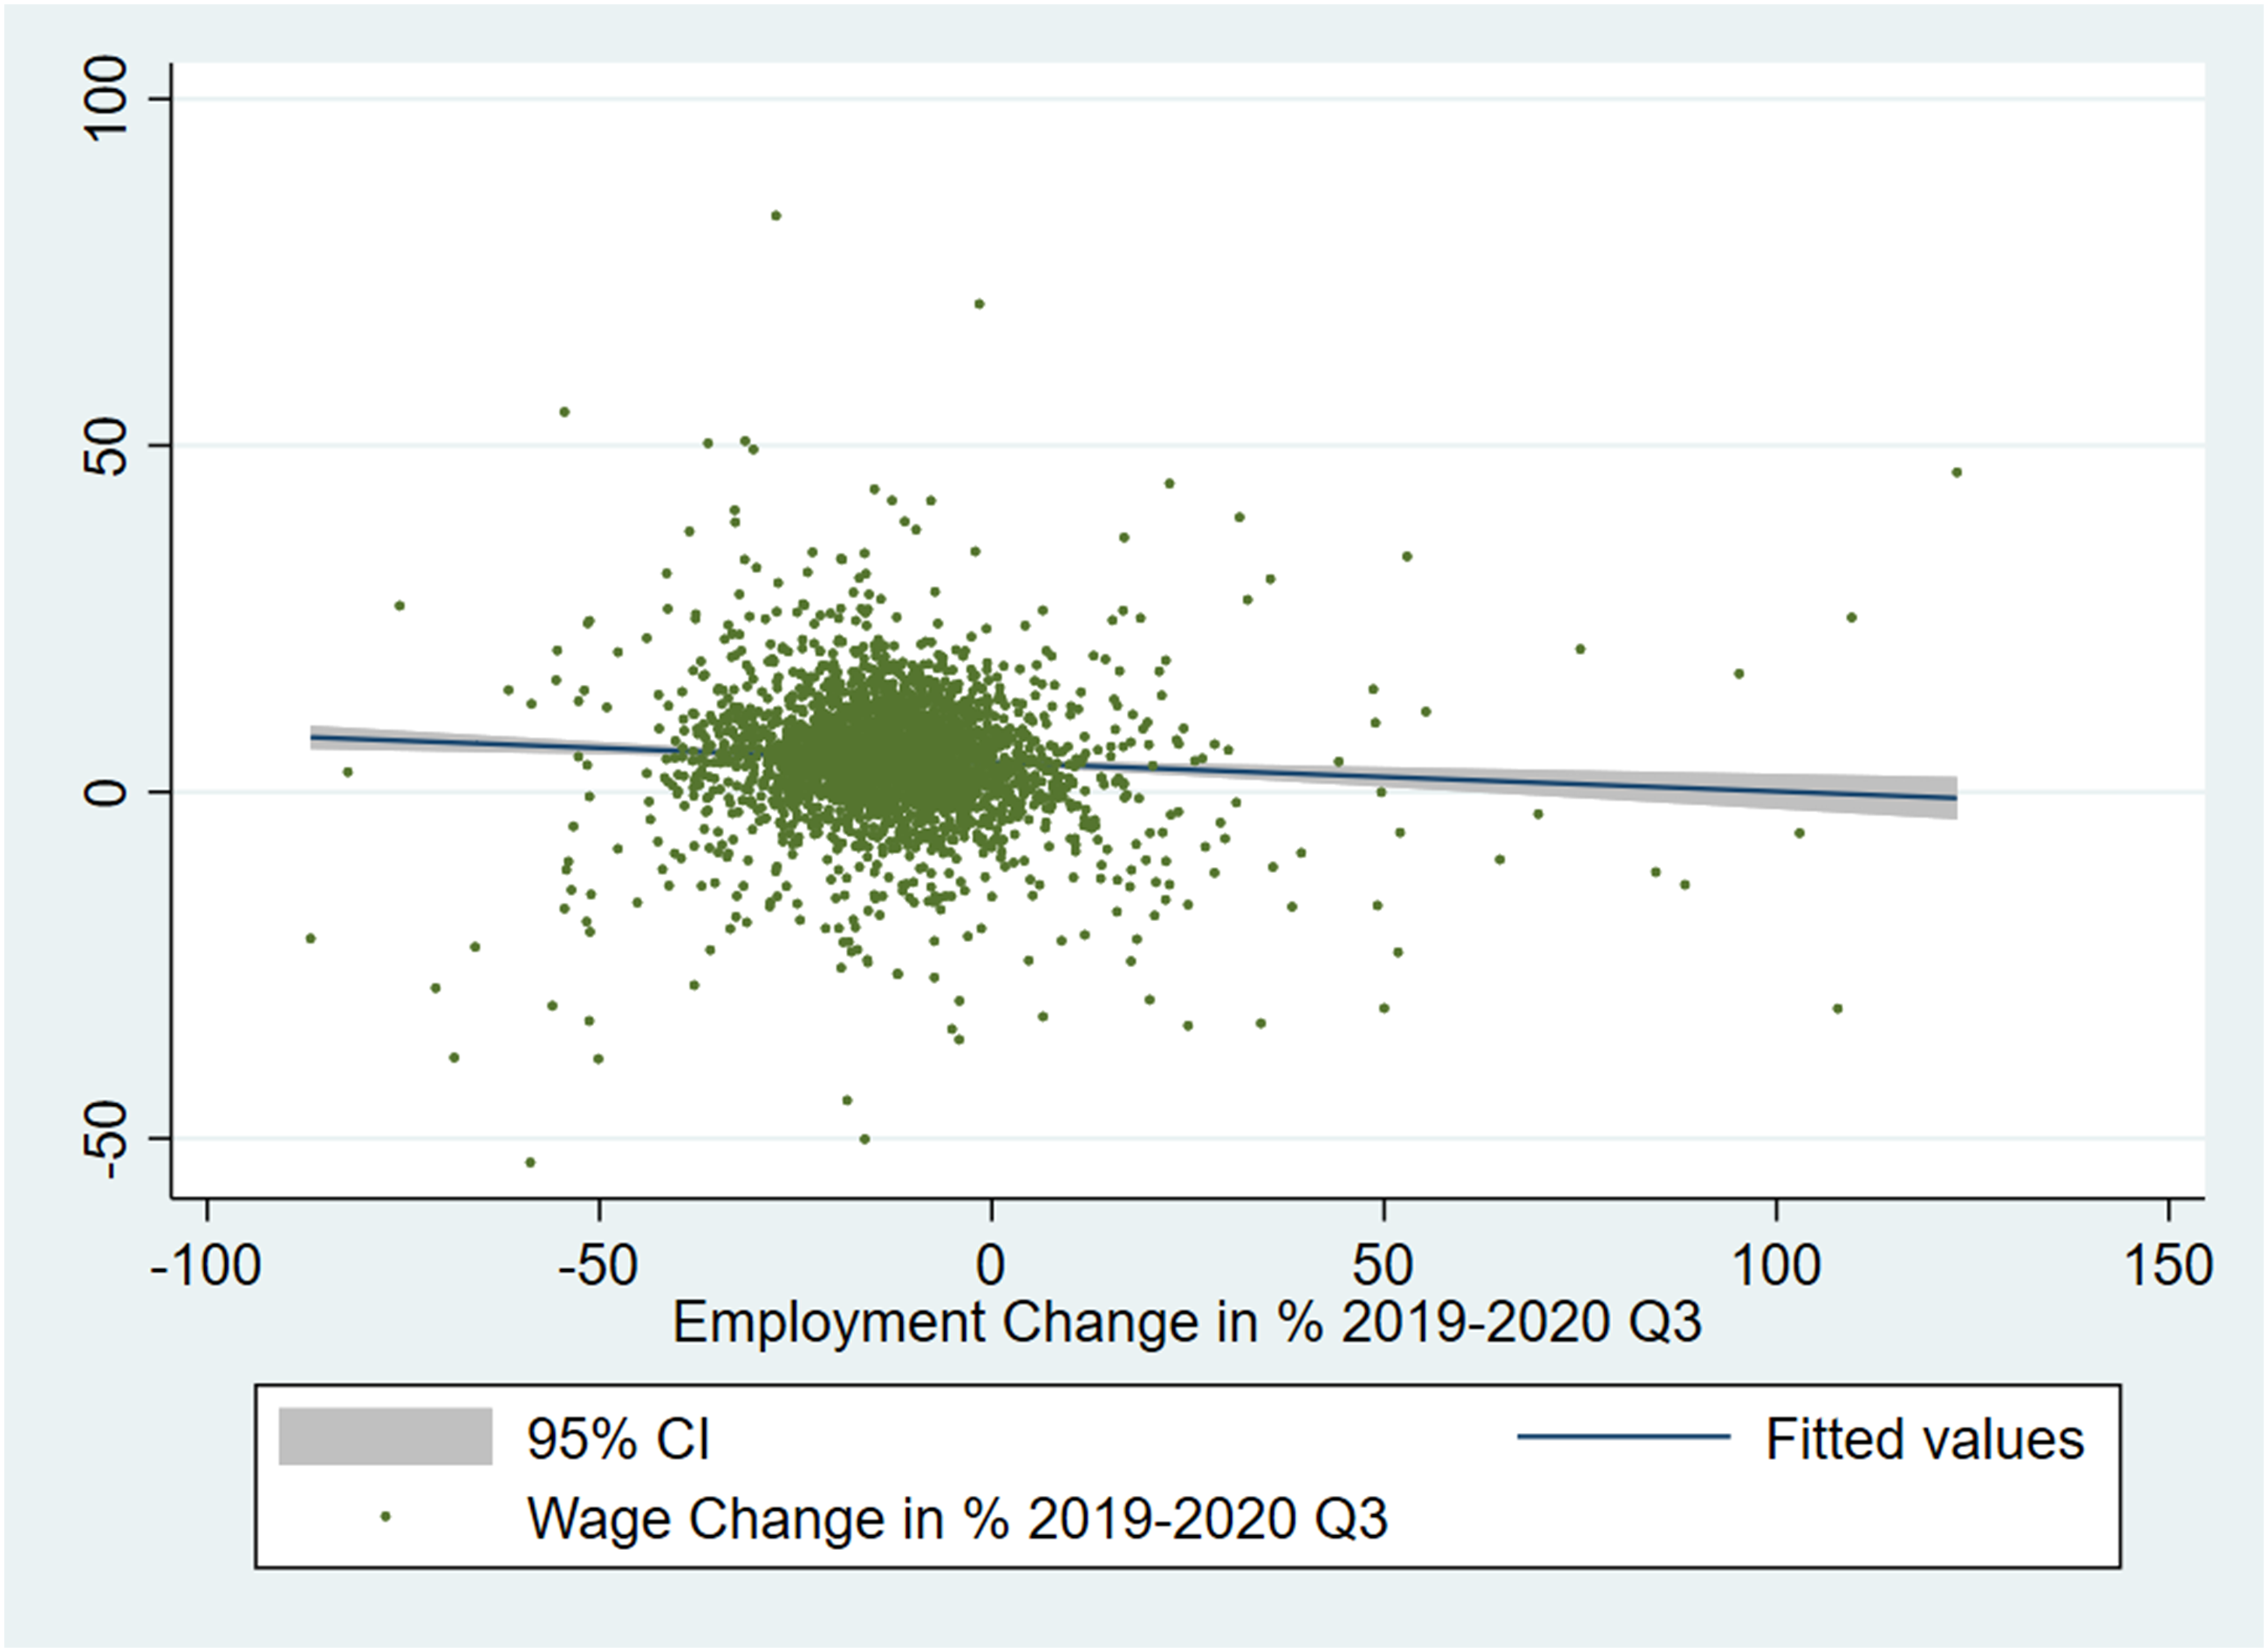
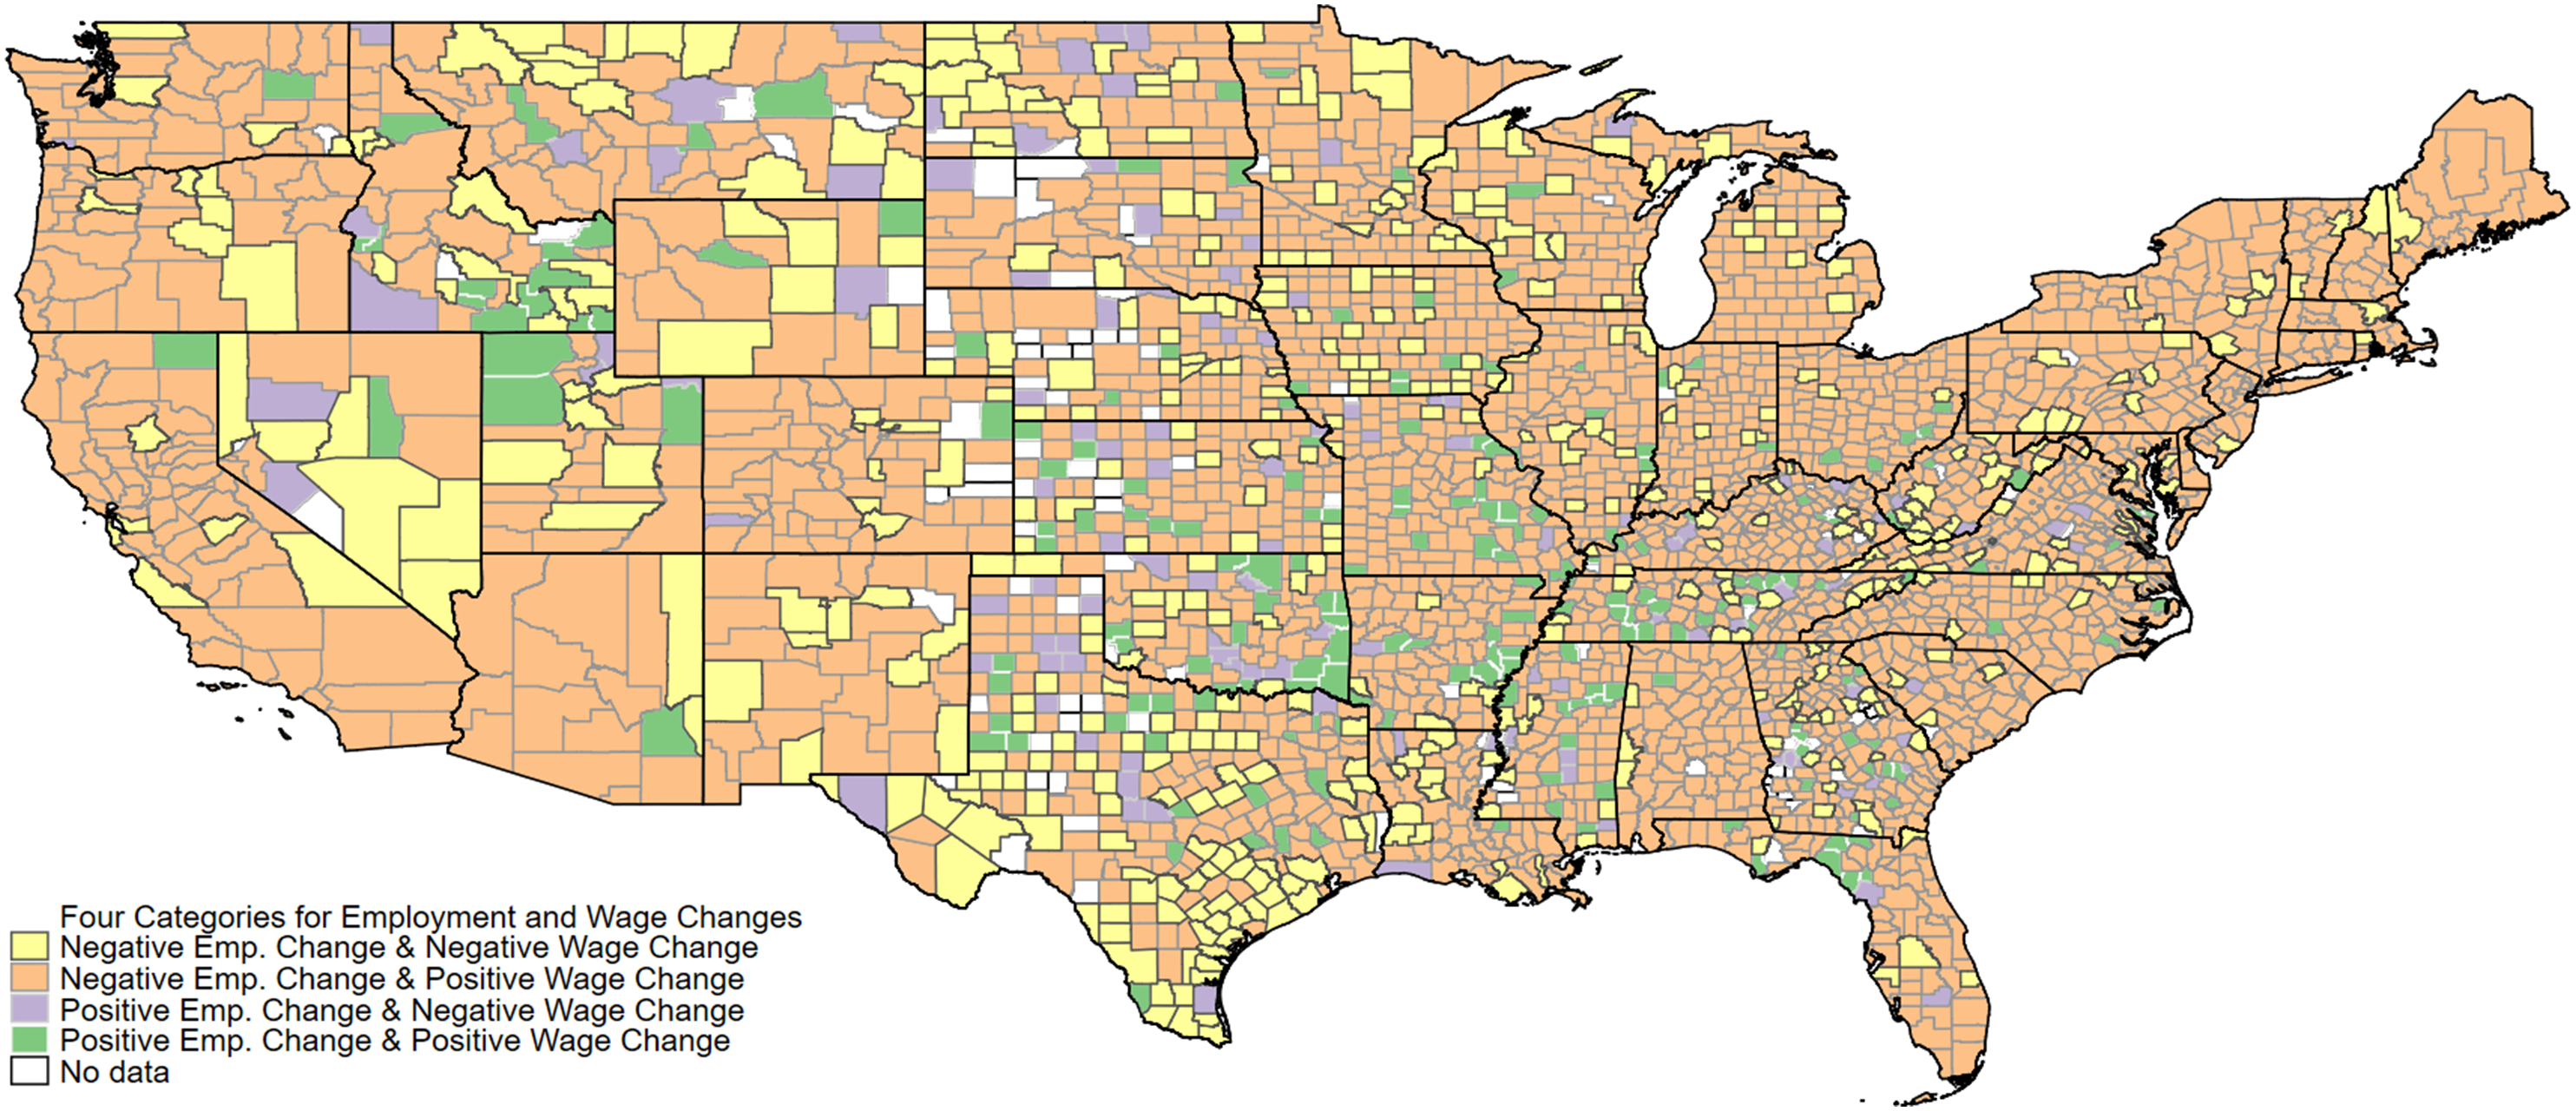
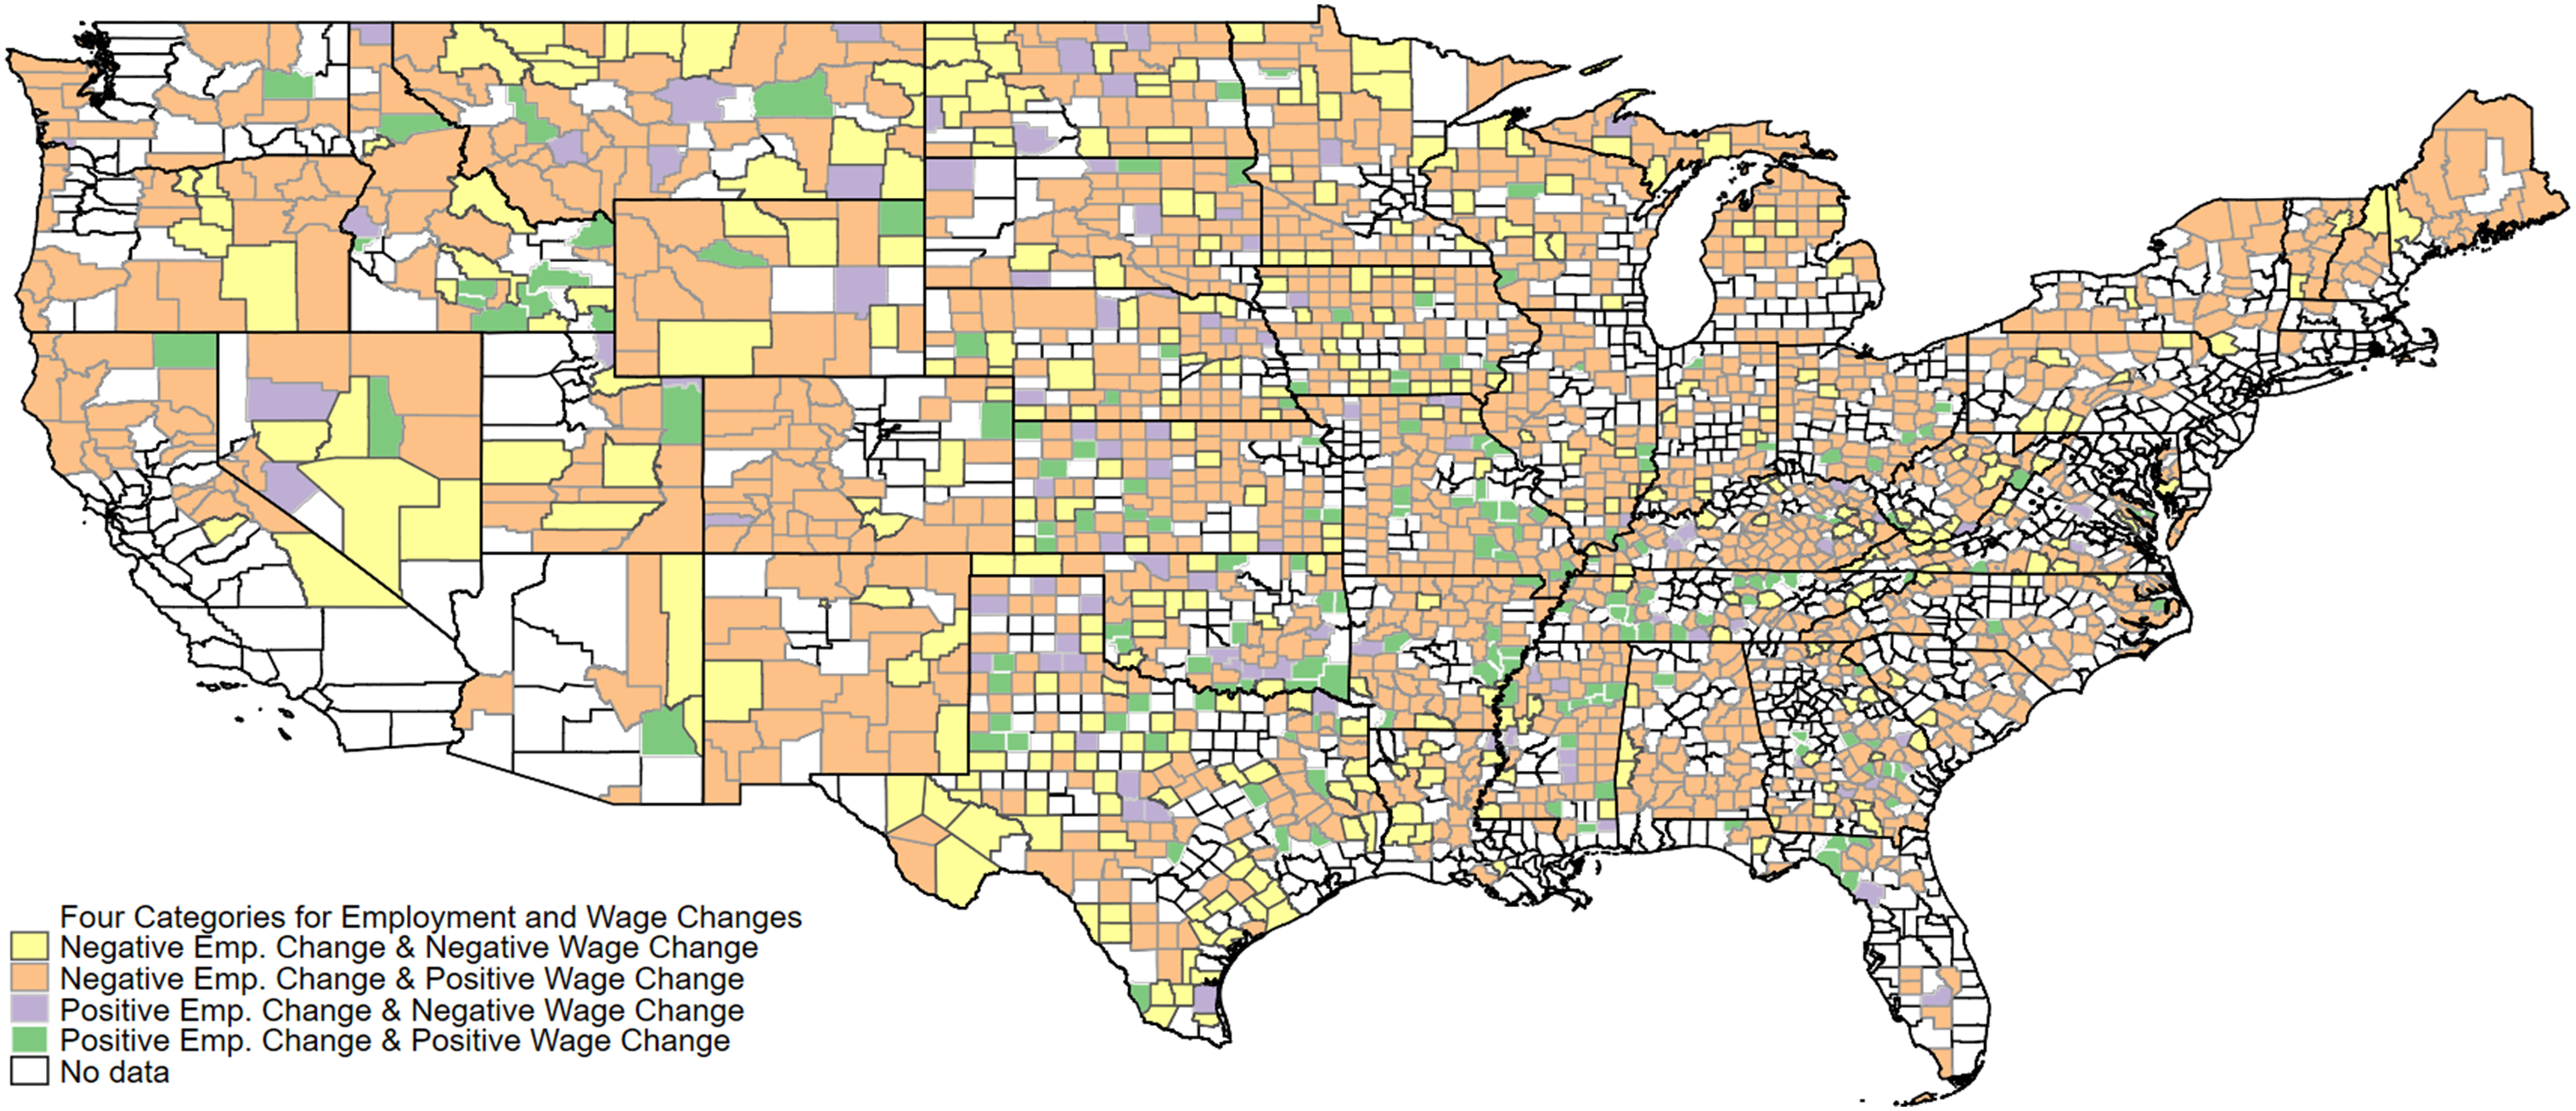
Figure 4 in many ways shows an inverse pattern of the employment changes described in Figure 3. Those areas which saw the most significant declines in employment, such as the Northeast, Southwest, West Coast, and Great Lakes, experienced some of the largest gains in L&H wages over the same period. This pattern is also suggested in Figure 5, which shows that the wage and employment change are negatively related. Yet Figure 5 does not provide evidence of causality but rather suggests that average wages did not decline for workers who remained employed in this industry in places most impacted in terms of employment. Figures 6 and 7 also confirm the conjecture that most counties fell into the category of negative employment and positive wage change. Percent change in leisure and hospitality wages, 2019 Q3–2020 Q3. Scatter plot of employment vs. wage percent change, 2019 Q3–2020 Q3. Categories for employment and wage changes, 2019 Q3–2020 Q3. Categories for employment and wage changes for rural areas, 2019 Q3–2020 Q3.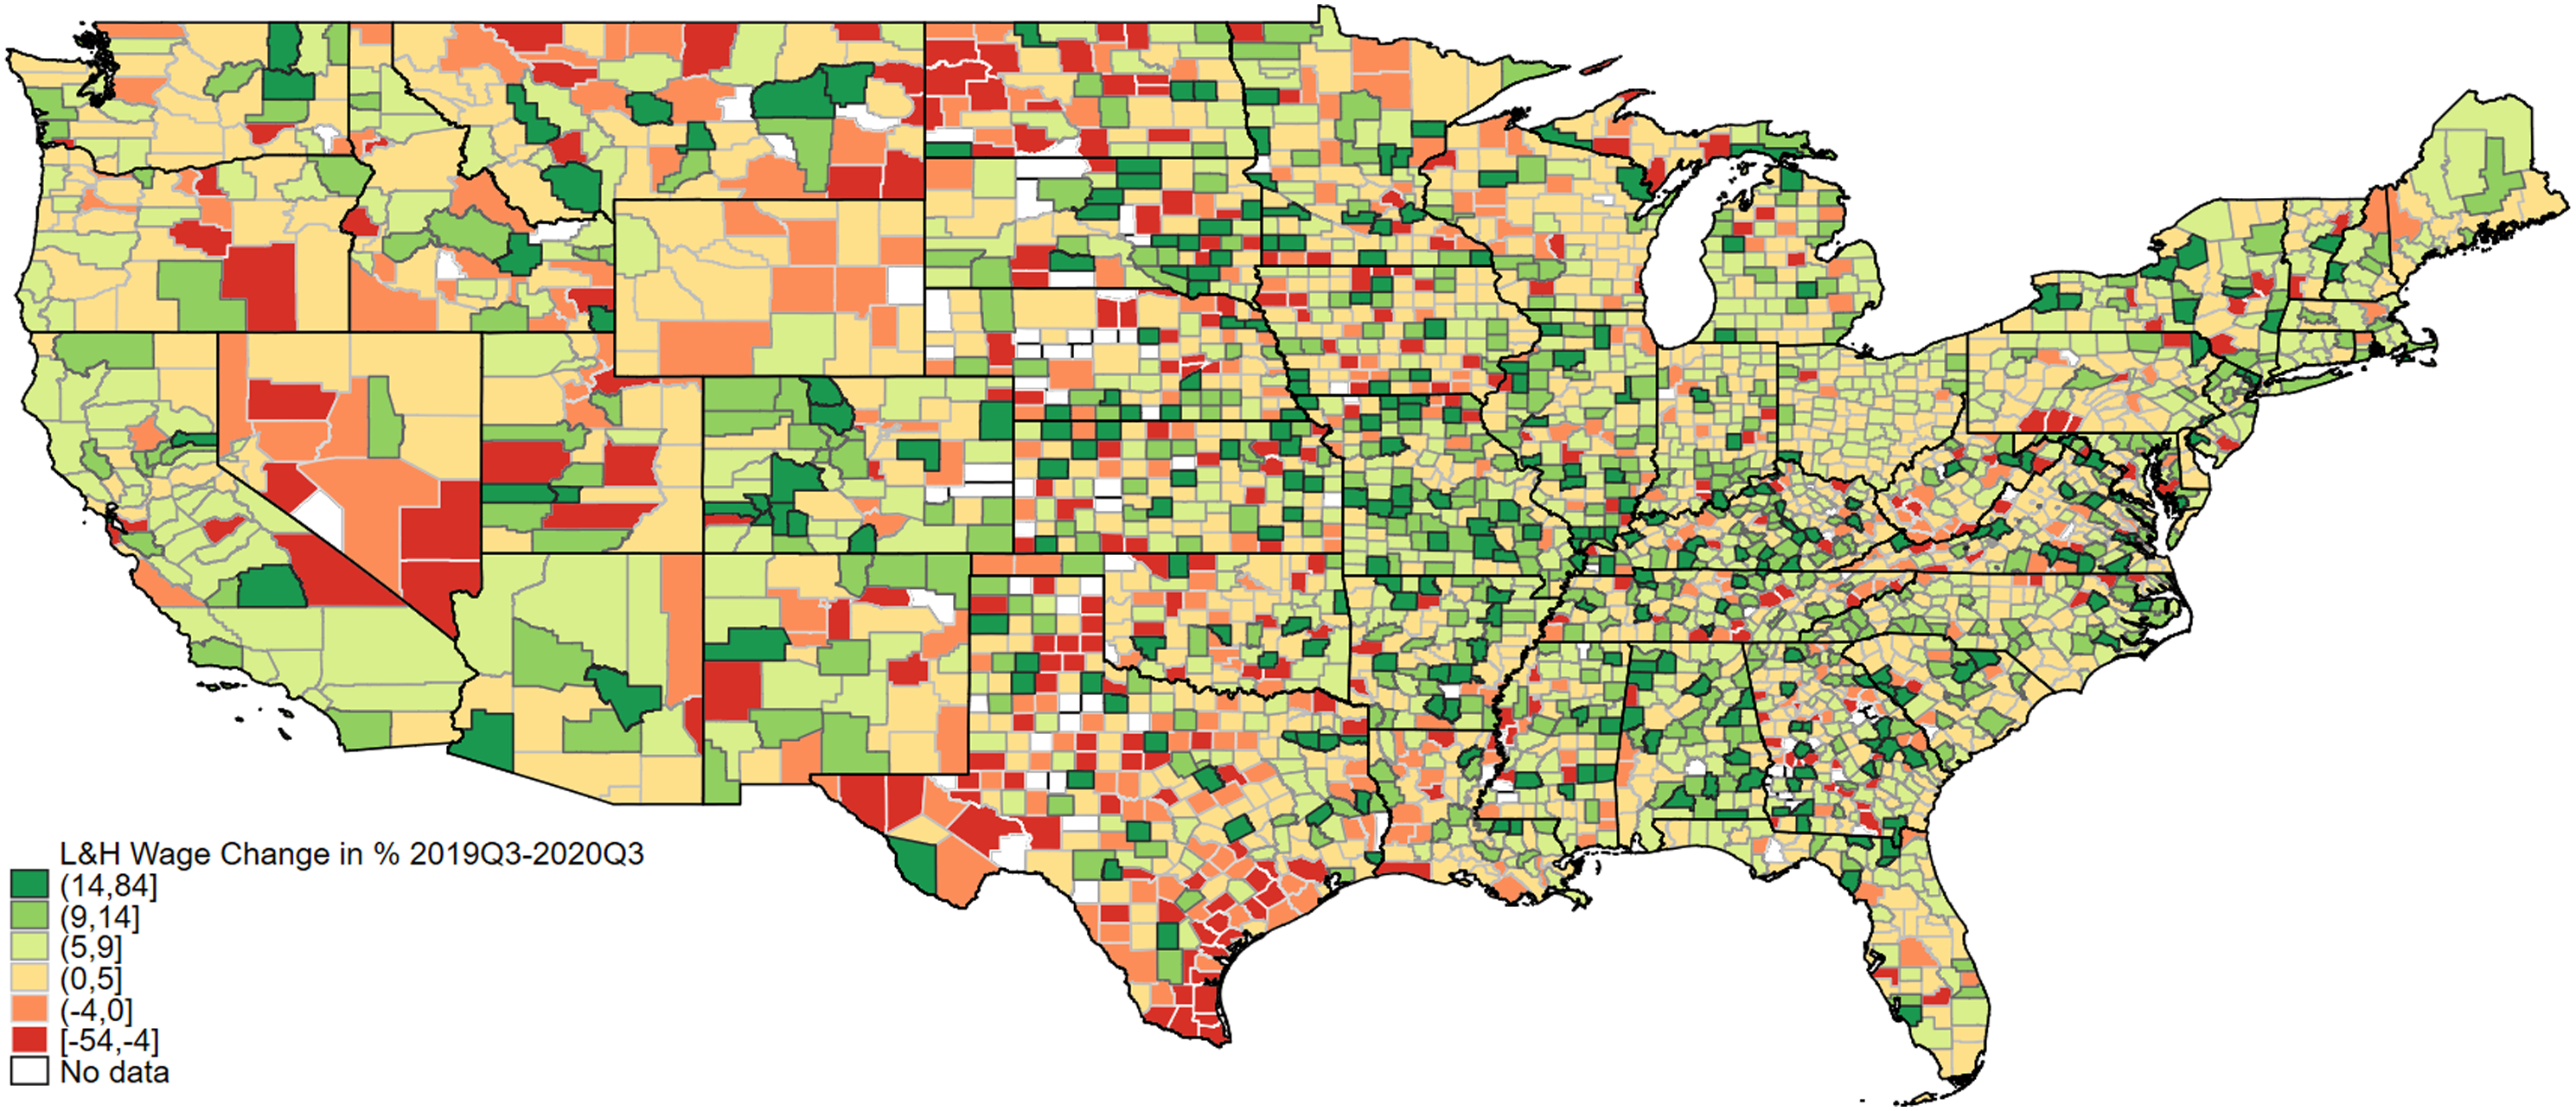
Method and regression model
Our model is built based on the hypothesis that labor markets in counties with different characteristics responded differently to the COVID-19 shock. We examine how county-level regressors affect the employment and wage changes between 2019 and 2020 Q3; this modeling effort follows in the long tradition of economic growth studies in which change over time in a variable is a function of initial levels of that variable (which yields a convergence parameter) and explanatory variables also measured in the initial or starting period over which subsequent change is measured; this also reduces potential endogeneity issues. Earlier studies using similar change models include Davlasheridze et al. (2018), Han and Goetz (2015, 2019), Tsvetkova and Partridge (2016), and Watson and Deller (2021). For example, in their study of economic growth determinants, Han and Goetz (2019) include a set of independent variables related to education, demographics, local amenities, etc. Some of our regressors are similar to those in Han and Goetz (2019), but we include different measures that better fit our model and underlying hypothesis. We explain why we include these control variables after presenting the regression equation below.
We specify and estimate the following regression model using data for the over 3,000 U.S. counties indexed as i, covering the entire contiguous US; as already noted, this modeling structure follows in the tradition of previous studies
Dependent variable
As noted, in addition to the rural-urban continuum codes (RUCC), we include incremental distance to successively larger metropolitan areas in auxiliary sensitivity analyses; these analyses produce consistent results in terms of the primary hypothesis tested here. A strong correlation also exists between the RUCC and population density in that the latter declines consistently on average across the rural-urban continuum (see Figure 8). We report coefficient estimates with Huber and White robust standard errors in all the regression tables to accommodate heteroscedastic standard errors. Rural-Urban continuum and population density (2019).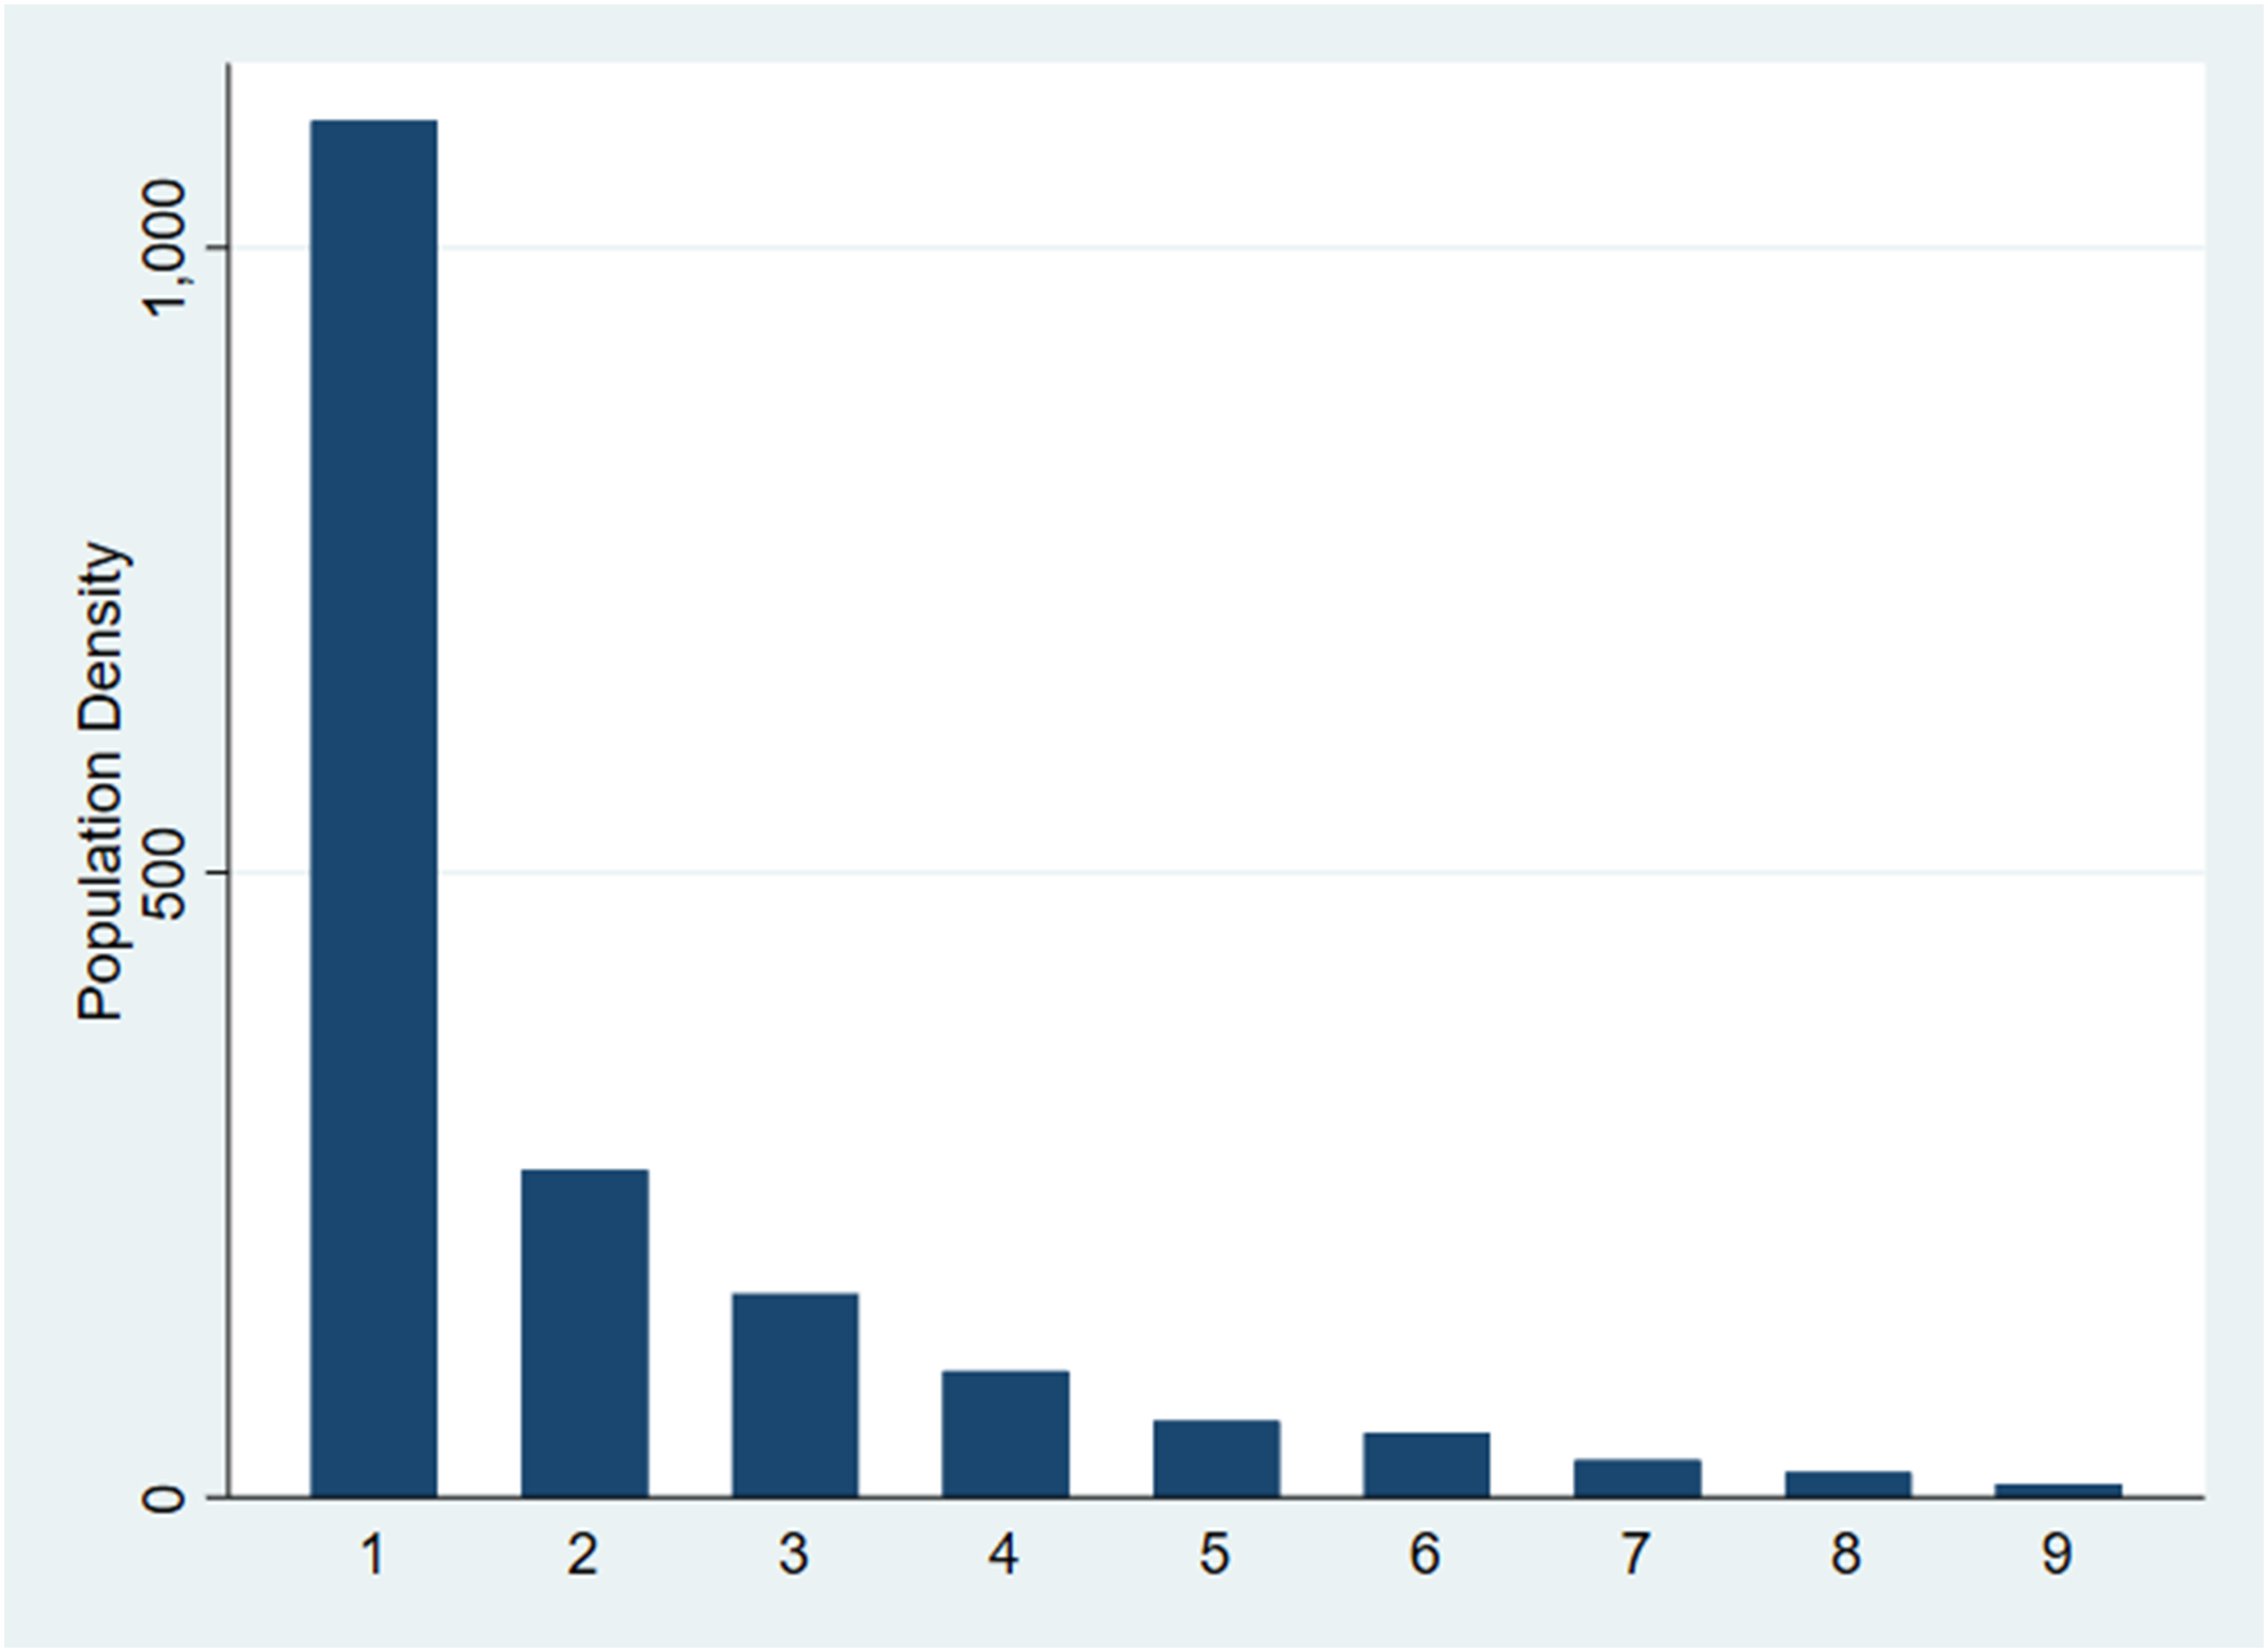
Importantly, our results are consistent across the three different measures of rurality, which increases confidence in the test of our hypothesis that remote, less-populated counties were more likely to experience stable employment in the L&H sector relative to pre-pandemic levels. To ensure that excluding the non-disclosed counties does not bias our main results, we use the sample average to recover the missing values. The results again remain materially unchanged.
The approach used here also meets the test of statistical validity because we are by definition measuring the phenomenon of interest using administrative data: actual change in L&H employment (or wages) as impacted by actual rural status of the county. This ensures both construct and content validity of the results. We would not be able to test for criterion validity except in the future if the nation were to be subjected to another, similar pandemic that resulted in lockdowns and social distancing measures.
Effects of county characteristics on employment and wage change, 2019 Q3–2020 Q3.
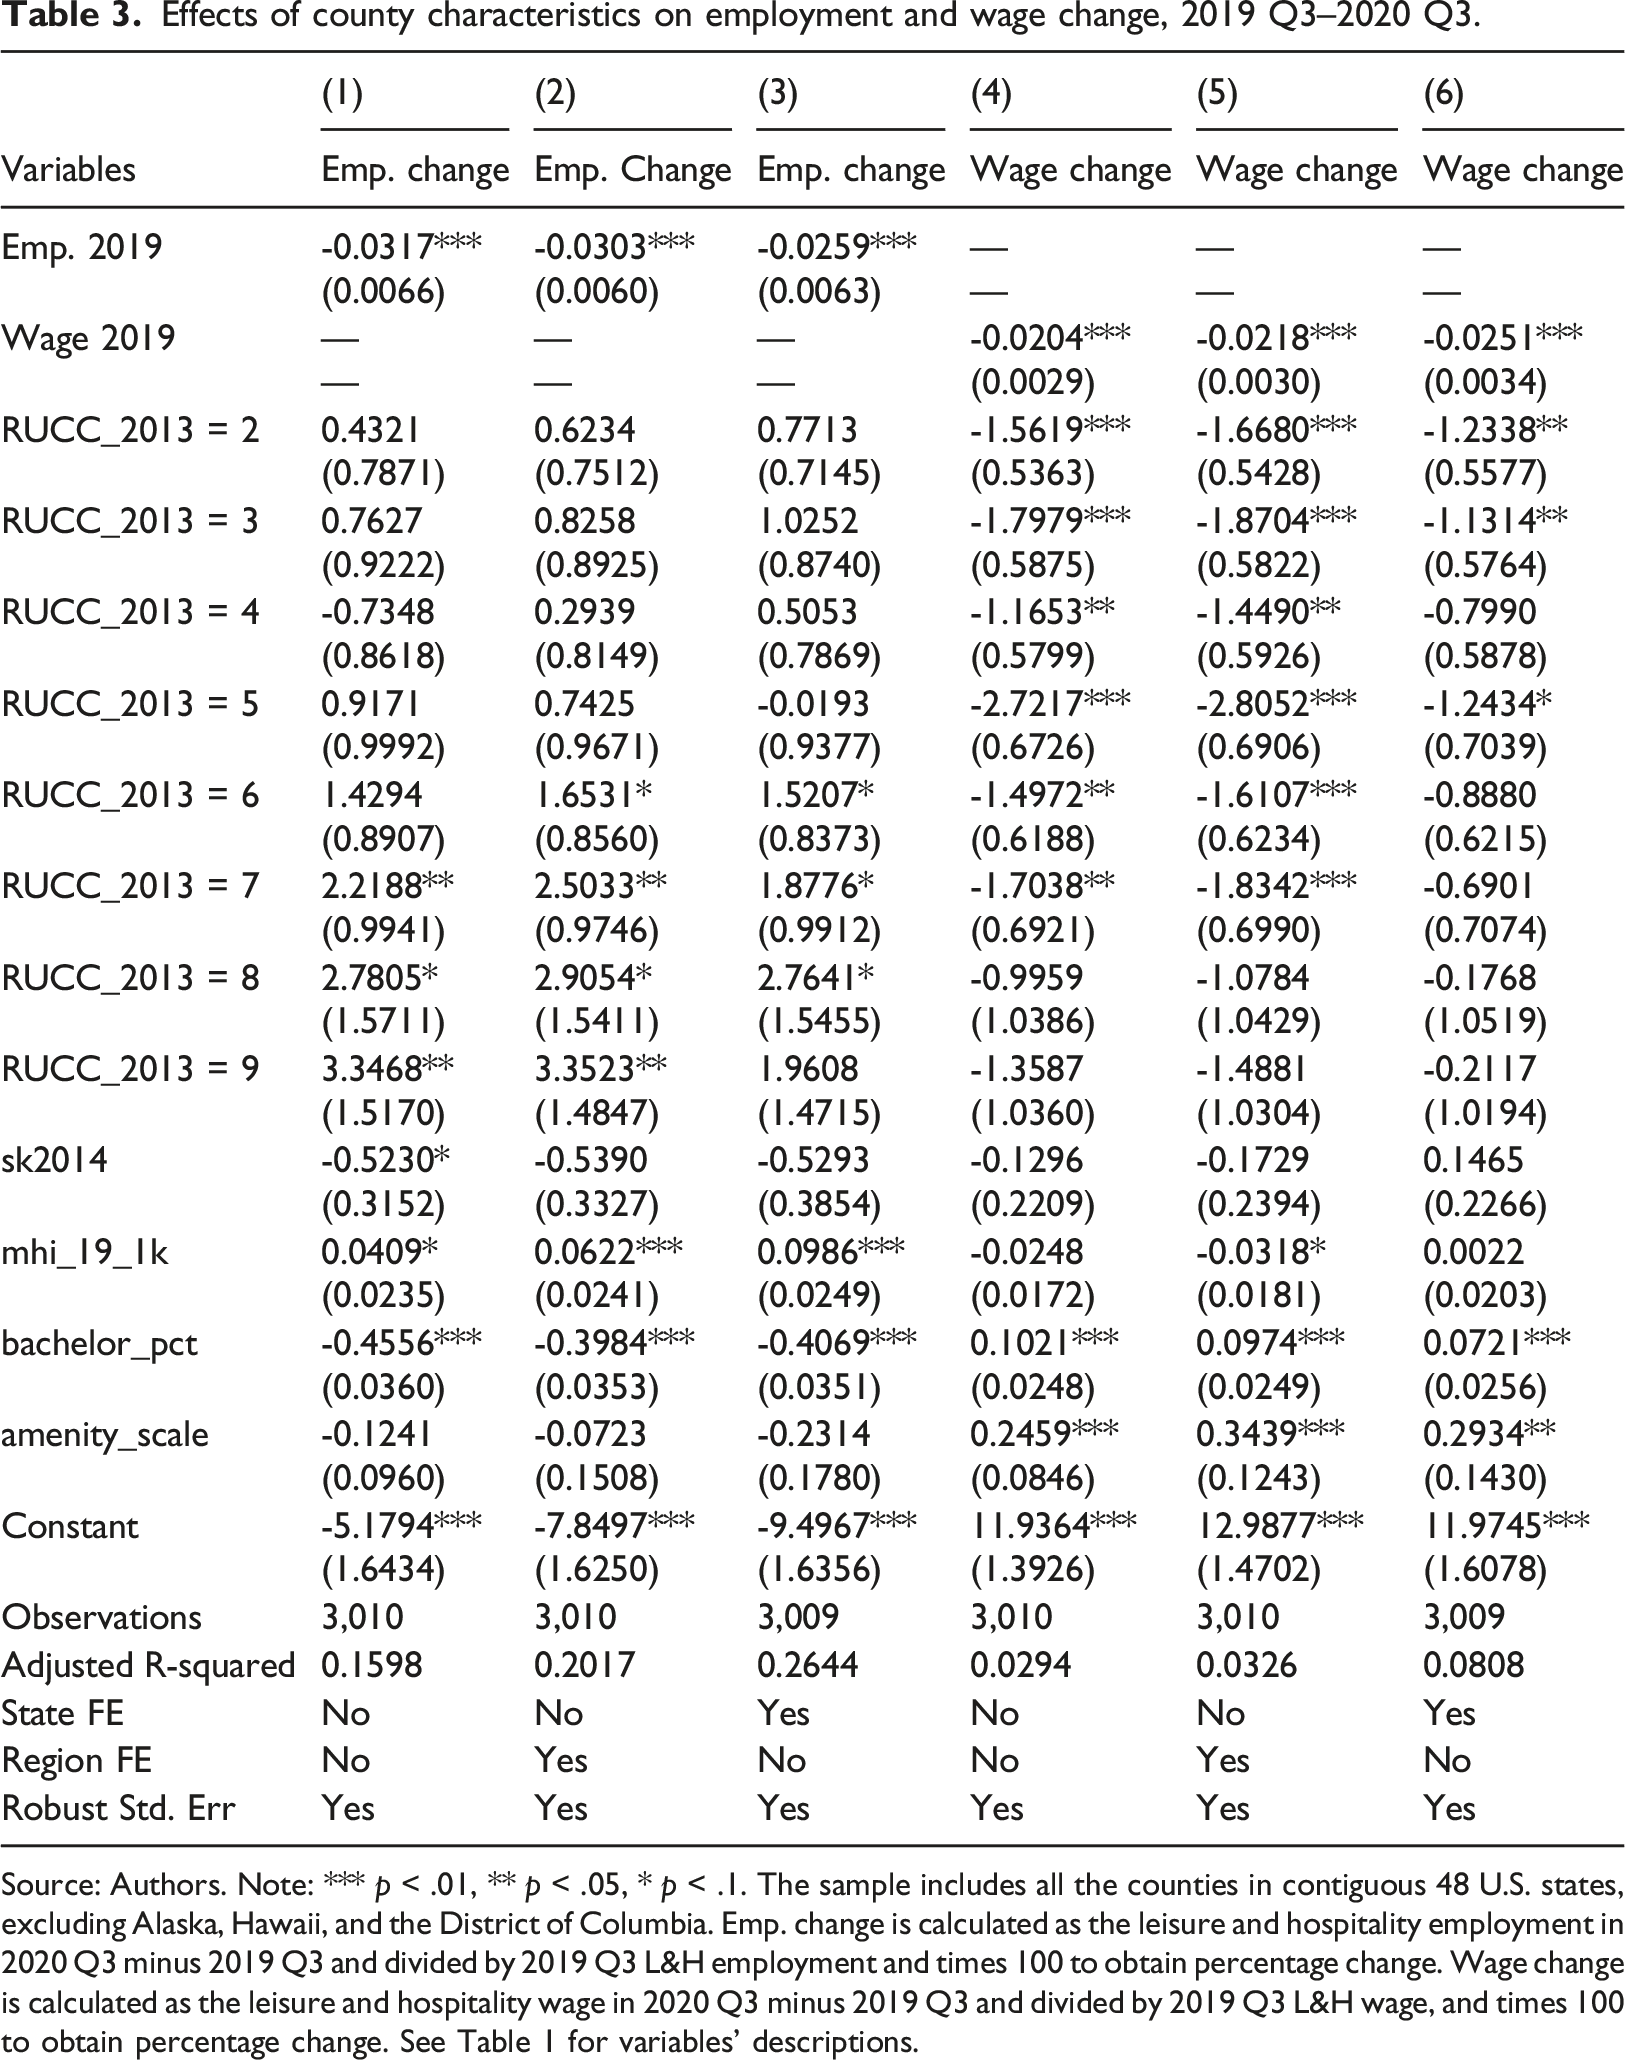
Source: Authors. Note: *** p < .01, ** p < .05, * p < .1. The sample includes all the counties in contiguous 48 U.S. states, excluding Alaska, Hawaii, and the District of Columbia. Emp. change is calculated as the leisure and hospitality employment in 2020 Q3 minus 2019 Q3 and divided by 2019 Q3 L&H employment and times 100 to obtain percentage change. Wage change is calculated as the leisure and hospitality wage in 2020 Q3 minus 2019 Q3 and divided by 2019 Q3 L&H wage, and times 100 to obtain percentage change. See Table 1 for variables’ descriptions.
Results
Main results
Table 3 shows how county-level characteristics affected L&H employment or wage changes from Q3 of 2019 to that of 2020. The negative coefficients on 2019 Q3 L&H employment in the first three columns indicate that counties with higher initial employment were hurt more in the pandemic. For example, places in coastal areas with a large share of L&H employment faced a more considerable employment loss. The regression coefficients for RUCC categories are positive and statistically different from zero, indicating that counties tended to experience smaller losses in L&H employment the smaller and more distant they were from the urban core (RUCC = 1), cet. par. 6
In other words, L&H employment was hit less hard during the first wave of the pandemic in more rural counties. This is particularly true for RUCC categories 6, 7, 8, and 9, which are all small and non-metro areas. For example, in the baseline model without fixed effects in column (1), counties in the RUCC = 7 category had a 2.22% point lower L&H employment decline than counties in the urban core. This compares with a 3.35 percentage point smaller reduction in the most remote and smallest rural counties (RUCC = 9) in the baseline model (note that both codes 7 and 9 counties are non-adjacent to metro areas).
A simple bar graph showing average population density across counties by RUCC (on the x-axis) is shown in Figure 8, indicating that population density declines uniformly across the RUCC. Our auxiliary regression results confirm that counties with lower population density had smaller employment losses (Online Appendix Tables). Likewise, the effect of greater incremental distances to successively larger metro areas was to mitigate the L&H employment losses.
In columns (2) and (3), we present the estimates with different levels of fixed effects. The fixed effects control for unobserved time-invariant heterogeneities that may correlate with our regressors of interest and failing to account for these may cause endogeneity issues. For example, the fixed effects are essential to the extent that states (e.g., Florida) and entire regions (e.g., the South) took different approaches to deal with the pandemic. In Florida, for example, lockdowns and masking requirements were less stringent owing to the milder climate, which allowed more outdoor activity. In column (2), controlling for the region fixed effects does not substantially alter our main effects found in column (1). However, in column (3), using the state fixed effects does reduce the significance levels of RUCC variables. This is not surprising given the state fixed effects remove all variation above the state level.
When accounting for state or regional fixed effects, only two of the four additional control variables are statistically different from zero at the 1% level of significance; income has a statistically significant positive effect and educational attainment a statistically significant negative effect. Although it should be examined in greater depth in future research, this suggests that higher-income counties also experienced less decline in L&H employment, possibly because wealthier households continued to patronize restaurants (with take-out orders or home delivery) during the pandemic.
A cursory comparison of Figures 2 and 3 suggests that areas with relatively low initial rates of L&H employment also had larger increases; this is consistent with the same numerical change producing a larger relative response when calculated from a smaller base. In future work, it would be interesting to incorporate labor migration into such a study; for example, it is plausible that L&H workers laid off in coastal counties returned home to their rural origins and sought employment there; this is beyond the scope of the present study.
In Table 3, columns (4), (5), and (6), we show how county characteristics affected the wage change over 2019–2020 Q3. The significant negative coefficients on the 2019 Q3 wage variable indicates that places with higher initial wages had lower wage growth (larger wage loss) during the pandemic. We find a negative coefficient on some of the RUCC categorical variables. Using RUCC = 1 as the base group, more rural counties have lower wage increases (larger wage loss) over the study period. This is not surprising as average wages usually are higher in metropolitan areas. This can mean higher wage growth in metropolitan areas, supported by the payroll protection program, was necessary to retain the workers who were not laid off during the pandemic, because of the higher risk of contracting COVID-19 in densely settled places. Other control variables such as income or social capital are not statistically significant. The positive coefficients on the amenity scale variable show that higher-amenity areas had larger wage growth (smaller wage loss).
Additional results
To show that our results are robust to different measures of remoteness, we report sensitivity analyses in Online Appendix Tables A1–A5. Results in Table 3, which utilize the RUCC measure of rurality, show that employment in the L&H industry was less impacted in remote and rural counties. These results should be consistent when using other measures of rurality, including distance from large metropolitan areas. Such measures should also be associated with a lower decrease in employment change, consistent with our hypotheses and our findings in Table 3. In Table A1, we use distance to the nearest metropolitan area in place of the RUCC variables. The coefficient on the distance variable is a significant positive number, confirming that rural counties had lower employment losses. For the wage regressions in columns (4), (5), and (6), we find similarly consistent estimates in that places far away from urban areas had lower wage growth (larger wage losses).
In Table A2, based on the urban hierarchy models from Partridge et al. (2008), we further decompose the distances to metropolitan areas of successively larger population thresholds. We find similar results in Table A1, namely that places far from areas with larger populations experienced smaller L&H employment reductions. The wage regressions tell a similar story: counties more distant from larger population areas had lower wage growth (larger wage losses).
In Table A3, we use population density per square mile to replace the RUCC categorical variables. We again find consistent results in that places with higher population densities suffered more from employment loss in the L&H industry, though the significance level is only 10% in column (2). Tables A4 show the results for employment and wages, including both population density and RUCC categories as the main regressors or controls of interest.
Finally, we address spatial spillovers in Table A5. As some counties are very small, workers may have resided in one county and worked in another or commuted to nearby counties due to the COVID-19 shock. Our main results (Table 3) include state-level fixed effects, which can absorb the commuter and migration issues between states but not within states. In Table A5, using the spatial contiguity matrix, we include the error spatial lag term in column (1), the dependent variable spatial lag in column (2), and both the error and the dependent variable spatial lags in column (3). Including these spatial lags does not substantially alter our main results.
Discussion
Our main result in Table 3 is consistent with the narrative that wealthier urbanites fled the urban core (e.g., New York City) to seek out remote rural places, such as Montana, to wait out the pandemic. The smaller the rural county (in terms of population), the greater the relative increase in L&H employment. This result may explain low decline nonmetro areas, which attracted residents from East Coast metro areas. The finding is also consistent with that of Watson and Deller (2021), who identified regions of the U.S. that appeared to benefit from households substituting relatively shorter and cheaper visits to public lands for long distance trips to more expensive destinations. Such findings show a preference for lower density destinations and activities that are perceived as being lower risk. Crucial is our findings that counties adjacent to metro areas, even if rural, had low (Code 8, only significant at 10% in column 1) or no (Codes 4 and 6 with no significance in column 1) statistical significance—they were not meaningfully different from the urban cores they surround. This may indicate people escaped from urban areas to more rural areas that were not adjacent to urban areas; in other words, they did not just vacation in suburban areas.
Conclusion
Public health impacts of the COVID-19 pandemic have changed how people recreate and the types of travel experiences they seek. Data we present here echo the economic changes observed in tourism patterns with greater in participation in outdoor recreation activities and visits to destinations such as National Parks and other public lands where visitors could avoid indoor settings, maintain social distance, and lower the perceived risk of contracting the virus. Based on our examination of county-level changes in L&H employment and wages pre-COVID-19 and in the first wave of the pandemic, we find evidence that the L&H sector was generally better protected from pandemic-related employment shocks in counties that met these new travel criteria—specifically, those counties with low populations that were farther from metro areas. Additionally, our descriptive results show a negative relationship between employment change and average wages, suggesting that workers who could maintain their jobs may have benefited from higher pay.
It remains to be seen if these trends in activity and destination preferences will persist. The rapid increase in visits experienced by some destinations has revealed challenges facing rural communities and outdoor recreation destinations. Although this study has demonstrated that the L&H sector in more rural areas was insulated and, in some cases, benefited from economic decline resulting from the pandemic, recent reports reveal the need to be cognizant of socio-cultural and environmental impacts associated with rapid increases in visitation such as litter, graffiti, and overcrowding of popular areas (e.g., Dodds and Butler, 2019). In the future, rural destinations could consider tourism development policies that emphasize a balanced approach to environmental sustainability, quality of life, and the tourism economy. Whether tourism activity is accelerating or shrinking, understanding how best to weather and respond to shocks to the rural tourism economy is critical.
Previous literature has identified a need for rural destinations especially to balance external destination marketing functions with internal destination development activities that emphasize adapting to change, confronting new avenues of competition, crisis management, generating and using information and research, human and workforce development, mitigating impacts, recognizing creative partnerships, and finding new measures of success (Gretzel et al., 2006; Holden, 2010; Lane & Kastenholz, 2015; Pasape et al., 2013; Presenza et al., 2005). Several private and non-profit entities have recently published toolkits to address these internal activities and help communities address tourism’s impact on community quality of life (e.g., the Global Sustainable Tourism Council and Miles Partnership’s Overtourism Toolkit); work by prominent destination marketing and management organizations like Visit Sedona demonstrate best practices in engaging local actors in community tourism planning and the development of creative policy solutions.
Several authors have called for increased collaboration among federal agencies and between these agencies and community actors to address the growing concerns around rural tourism in particular. These include the USDA Recreation Economies Resource Guide (USDA Rural Development, n.d.), EPA Planning Grants (EPA, n.d.), and the Outdoor Recreation Roundtable Rural Economic Development Toolkit (ORR, n.d.) The Recreation Economy for Rural Communities planning assistance program supports communities in developing strategies that promise to expand outdoor recreation activities while also rebuilding their Main Street economies. The Outdoor Recreation Roundtable Rural Economic Development Toolkit was developed to help communities build an outdoor recreation economy of their own. USDA’s Forest Service, Rural Development, and the National Institute for Food and Agriculture developed Recreation Economies Resource Guide for rural communities to identify resources to develop their recreation economy (EPA, n.d.; ORR, n.d.; USDA Rural Development, n.d.). Finally, Eades and Arbogast (2022) outline a role for the Cooperative Extension Service—a partnership between USDA, land-grant universities, and local governments—in the co-creation of knowledge with rural destination stakeholders, establishment of rural tourism networks, and dissemination of research and best practices among local tourism stakeholders, practitioners, and scholars.
The COVID-19 pandemic provides an opportunity for a better and more nuanced understanding of the factors that result in a sustainable and resilient destination that can weather both economic downturns or a rapid influx of visitors. This, in turn, can inform local, state, and federal policies and programs in ways that strengthen community and destination responses to future economic shocks. Although our research includes some explanatory variables such as social capital, income, amenities, and education, tourism models such as destination lifecycle models, models of sustainability, models of destination competitiveness, and research on destination resilience may indicate additional explanatory variables for future modeling efforts.
Our study uses county level data to evaluate how the COVID-19 pandemic affected employment and wage changes in the U.S. tourism and hospitality sector. Data and methodological limitations, including the use of the USDA amenity data and “distance to the nearest metropolitan area” as a main regressor limited our analysis to the lower 48 US states. The exclusion of Alaska and Hawaii, two states rich in tourism resources, is a noted limitation of this study. Additionally, while our study included social and environmental explanatory variables there likely are other variables that could be included in future analyses. Although other tourism indicator studies exist, many are based on other countries with limited applicability to U.S. domestic communities, especially those in a rural setting. Identifying relevant economic, social, and environmental indicators that can be used by domestic policymakers to holistically evaluate destination competitiveness and ensure that the L&H sector is contributing to a more resilient regional economy should be a priority going forward.
Supplemental Material
Supplemental Material—An early assessment of COVID-19’s impact on tourism in U.S. Counties
Supplemental Material for An early assessment of COVID-19’s impact on tourism in U.S. Counties by Luyi Han, Stephan J. Goetz, Daniel Eades, Jason Entsminger, and Doug Arbogast in Tourism Economics
Footnotes
Acknowledgement
We are grateful to anonymous reviewers for valuable comments. We thank the session participants at the 2021 National Extension Tourism conference.
Declaration of conflicting interests
The author(s) declared no potential conflicts of interest with respect to the research, authorship, and/or publication of this article.
Funding
The author(s) disclosed receipt of the following financial support for the research, authorship, and/or publication of this article: This work was supported in part by the United States Department of Agriculture, National Institute of Food and Agriculture (NIFA) under project #2020-51150-31870 and by the Pennsylvania State University and NIFA Multistate/Regional Research Appropriations under project #NE1749.
Supplemental Material
Supplemental material for this article is available online.
Notes
Author biographies
Luyi Han is a Postdoctoral Scholar in the Northeast Regional Center for Rural Development (NERCRD) at Penn State University. He received his doctoral degree in economics from Oklahoma State University. His research interests include applied microeconomics, regional and urban economics, development economics, labor economics, and energy economics. He is contributing to several NERCRD research efforts, including the NIFA-funded and Census Research Data Center-based rural innovation project as well as to projects on general recovery from COVID-19 including workforce development and economic resiliency.
Stephan J. Goetz is the Director of the Northeast Regional Center for Rural Development and Professor of Agricultural and Regional Economics at Penn State University. Goetz provides leadership for rural and community development research and outreach activities across 13 states. This responsibility includes linking state activities to regional and national initiatives. His research focuses on the determinants and effects of economic growth and development, with current applications of network science principles to economic growth, resilience and innovation. He is the principal investigator on external grants valued at over $15 million.
Daniel Eades is an Associate Professor and Extension Specialist with West Virginia University, working in the areas of rural economics and rural development. His research and teaching employ asset-based and data driven analysis to engage and guide local leaders and community stakeholders in regional economic development decision making and local planning efforts. He holds an M.Sc. in Resource Economics and is currently working on his dissertation for a Ph.D. in Human and Community Development both from West Virginia University.
Jason Scott Entsminger is Associate Director of the Northeast Regional Center for Rural Development and Assistant Research Professor in Agricultural Economics, Sociology, and Education at Penn State University. He holds a PhD in Agricultural and Applied Economics from the University of Missouri. His research focuses on entrepreneurship and the economics of organizations. As Associate Director, he coordinates outreach efforts that build the capacity of community and economic development professionals across the 13 states of the Northeastern U.S. and across the country. This includes research and education on tourism and recreation economies.
Doug Arbogast, PhD is an Extension Associate Professor and Rural Tourism Specialist at West Virginia University in the Family and Community Development unit of the Extension Service. He is responsible for developing and delivering rural tourism development services. He works collaboratively with WVU faculty and students to promote sustainable development of tourism in West Virginia. His duties entail development of proactive applied research, teaching, and service programs in tourism development including sustainable tourism development, rural tourism, tourism planning, tourism management, recreation economies, and regional competitiveness.
References
Supplementary Material
Please find the following supplemental material available below.
For Open Access articles published under a Creative Commons License, all supplemental material carries the same license as the article it is associated with.
For non-Open Access articles published, all supplemental material carries a non-exclusive license, and permission requests for re-use of supplemental material or any part of supplemental material shall be sent directly to the copyright owner as specified in the copyright notice associated with the article.