
Abstract
The impact of campaigns on electoral performance is conditioned in part by contextual effects. The popularity equilibrium model has proven to be an important guide to how the electoral effects of local campaigns vary by a party’s existing level of popularity. Such an equilibrium can, however be disturbed by an electoral shock—a rare event which fundamentally challenges the foundations that underpin predictability in elections. This article analyses the impact of the electoral shock of the UK’s 2016 referendum on EU membership on campaign effects in the subsequent elections of 2017 and 2019. Using a novel theoretical and methodological approach, it shows that while there were observable effects of the Leave vote already present before the referendum, the geography of the effectiveness of Labour and Conservative local campaigns was altered after the referendum. However, it was not until the 2019 election that the shock of the 2016 Leave vote became a particularly important predictor of the electoral efficacy of both parties’ campaigns.
Introduction
There is strong evidence that the electoral consequences of campaigns are conditioned by context (Arceneaux and Nickerson, 2009; Fieldhouse et al, 2014, 2020a; Fisher et al., 2019; Hillygus, 2005; Niven, 2001). A broad literature across many different countries shows that in general, campaigns deliver electoral payoffs (Andre and Depauw, 2016; Carty and Eagles, 1999; Fisher et al., 2011, 2019; Gschwend and Zittel, 2015; Sudulich et al., 2013). However, their effects vary depending on electoral context. In a period of relative electoral stability (that is in the absence of electoral shocks) this creates an equilibrium such that the electoral effects of campaigns can be predicted by a party’s existing level of popularity—campaigns will be most effective in electoral terms where parties are not unusually unpopular or popular (Fisher et al., 2019; Fieldhouse et al., 2020a). This is referred to this as popularity equilibrium—a relatively stable state of affairs whereby the effectiveness of campaigns shifts in response to existing levels of popularity, but where equilibrium is maintained between that level of popularity and the conditions under which campaigns are more or less electorally effective (Fieldhouse et al., 2020a; Fisher et al., 2011, 2019).
But what happens when there is an electoral shock? Popularity equilibrium can adjust to significant changes in parties’ electoral fortunes, such as after the British general election of 1997, and indeed through periods of electoral volatility (Fieldhouse et al., 2020a). Electoral volatility in the UK has been driven by both longer-term changes, including a decline in party identification and party system fragmentation (the growth of new, smaller parties) together with short-term electoral shocks (Fieldhouse et al., 2020b). In this article we argue that these electoral shocks may bring about changes in the importance of key contextual variables which influence the effectiveness of campaigns. More specifically we test in the aftermath of such a shock, predicting the likely electoral effectiveness of campaigns is enhanced by accounting for the impact of the shock as well as previous and existing levels of popularity. We test this phenomenon using the examples of the 2015, 2017 and 2019 British general elections—before and after the referendum on the UK’s continuing membership of the European Union, held in 2016. The article represents the first analysis of the impact of electoral shocks on campaign effectiveness and provides a novel theoretical and methodological approach to better understand the impact of electoral shocks.
Theory
The underlying principle in this article is that the electoral effectiveness of local campaign efforts will not be entirely within the control of the political party undertaking the campaign. Effectiveness may also be conditioned by electoral context. Previous work highlights the importance of prior electoral performance and the principle of popularity equilibrium, where the maximum electoral effectiveness of a party’s campaigns is likely to occur where a party is neither very unpopular nor very popular (Fisher et al., 2019; Fieldhouse et al., 2020a). The maximum effectiveness of a party’s campaigns is driven by popularity. While district (micro) level popularity is correlated with national (macro) levels of popularity, it is also the case that parties’ levels of popularity display significant geographical variation. Popularity equilibrium captures the fact that parties’ electoral performance across different constituencies is not randomly distributed but is conditioned by that existing level of popularity. (Fisher et al., 2019; Fieldhouse et al., 2020a). Popularity therefore refers to the existing level of support in the district or constituency – measured typically by the level of electoral performance at the previous election. Fieldhouse et al. (2020a) show that over time, prior electoral popularity is a strong predictor of campaign effectiveness. Using the principle of popularity equilibrium (for which they devise a model), they show that over the six British general elections between 1992 and 2015, the effectiveness of the party election campaigns is conditioned by the level of popularity (as measured by prior electoral performance). Critically, maximum effectiveness occurs where parties are neither too unpopular nor too popular.
Electoral shocks can, however, fundamentally change electoral dynamics. The principle of electoral shocks is informed by the idea of shocks in public policy and economics. In both, relative stability is the norm. However, when there are shocks such as economic crises, or when rules no longer confer legitimacy (Clift and Fisher, 2004), significant changes in outcomes follow, sometimes leading to permanent and dramatic shifts in policy. In the context of electoral politics, shocks are disturbances which represent a sharp change in the status quo outside the normal course of politics; are highly salient and noticeable over prolonged time periods, and are relevant to party politics (Fieldhouse et al., 2020b, 32). Shocks can produce a significant increase in vote-switching because of the strategic response of political parties (Fieldhouse et al., 2020b:31). Critically, they do not imply a quick return to a former equilibrium. Examples in the British electoral context include the global financial crisis of 2007-8 which significantly affected Labour’s reputation for economic competence, the Scottish independence referendum of 2014 which resulted in party choice being framed by the constitutional question (Johns and Mitchell, 2016; Fieldhouse and Prosser, 2018), and the referendum on the UK’s continuing membership of the European Union in 2016, where party identities subsequently became increasingly tied to a Leave or Remain position.
Electoral shocks mean that issues most closely associated with the shock become more salient. Not only do voters become more informed about such an issue, they are also more cognisant of the parties’ positions on the matter (Fieldhouse et al., 2020b: 40-1). As a consequence, the issue becomes more significant in voters’ decision-making. Equally, the electoral shock affects parties’ image. An electoral shock can re-shape perceptions of parties’ positions, priorities and standpoints, and relatedly, their social imagery (which social groups the party is seen to represent). This is likely to affect the efficacy of parties’ campaigns as the changes generated by the shock are likely to have a geographically uneven impact leading to a change in the geography of support. If there is an electoral shock, therefore, the popularity equilibrium may be fundamentally disturbed such that prior local electoral performance may be significantly reduced in its capacity to condition the electoral effects of local campaigns.
There are two reasons this may be so. First, popularity still matters, but critically, an electoral shock can alter where a party is now more or less popular. A substantial change in the social basis of party support and a resulting shift in the geography of support will render previous vote share a less good predictor of current popularity. Because campaign effectiveness is normally estimated as the effect of campaign effort after controlling for previous vote or electorate share (Fisher et al, 2011, 2019; Fieldhouse et al., 2020a), if the latter becomes a poor predictor of the former then any estimate of campaign effectiveness will become less precise.
The second reason that an electoral shock may affect where local campaigns are most effective is that electoral shocks can abruptly and significantly increase the salience of an associated issue and trigger a strategic response from parties (Fieldhouse et al. 2020b). As a consequence, local campaigns have the potential to expose the parties’ positions on these issues to the local electorate. Insofar as local voters are receptive to the party’s message around the newly salient issue, the local campaign may attract or repulse voters accordingly. Places where a party were previously strong may suddenly become less fertile ground for mobilising supporters if traditional supporters are not sympathetic to the party on the newly salient issue. The geographical distribution of attitudes towards the newly salient issue, therefore, will condition the effectiveness of local campaigns over and above that which is predicted by the popularity equilibrium model.
The vote in the 2016 referendum on the UK’s continuing membership of the European Union is an example of such an electoral shock (Fieldhouse et al. 2020b). The result of the referendum, whereby UK citizens voted to leave the EU, represented a fundamental challenge to, and ultimately a shift in, British policy built up over more than 40 years, and arguably since Britain first sought to join the European Economic Community (as was) in the early 1960s. As a consequence of the referendum vote, the process of withdrawal became the principal preoccupation of British politics following the referendum – particularly in the period from 2018-2019 with the various Parliamentary wrangles over the withdrawal agreement (Thompson, 2020). It ultimately led both to the fall of the Prime Minister David Cameron immediately after the referendum, but also his successor - Theresa May - in 2019 as Parliament refused to endorse her proposed withdrawal agreement. Not only that, the results of the European Parliament elections in May 2019 (in which the UK had previously not intended taking part having originally been due to withdraw from the EU on March 31st 2019) emphasized the threat to both main GB-level parties. Labour secured just 10.8% of the vote, while the Conservatives achieved only 8.8%, finishing fifth behind the Greens.
The Leave vote in 2016 cut across party lines—slightly more so in the case of the Conservatives. Wave 9 of the BES Panel (collected after the 2016 referendum) shows that the Leave: Remain split amongst 2015 voters was 59:41 for the Conservatives compared with 34:66 for Labour (Fieldhouse et al., 2015). As Evans and Menon (2017: 90) note, the referendum represented a fundamental challenge to party affiliations, with the underlying values behind the choice of referendum vote cutting across party loyalties. Moreover, party cues in the referendum vote were generally weak – in part because of the mixed or weak messages emanating from both parties (Clarke et al., 2017: 451–4). If cues were weak, there is little surprise that Leave or Remain voting was not strongly tied to existing partisan dispositions.
The response of the parties to the referendum result differed, however. The Conservatives opted for a clear pro-Brexit stance, albeit one where the type of Brexit was not yet defined (Evans and Menon, 2017:93). By 2019, the message was even clearer – Get Brexit Done – following the lengthy difficulties in Parliament over the withdrawal agreement (Thompson, 2020). Labour, however, sought to follow a more ambiguous stance on Brexit – seeking both to appeal to those who wished to Remain, and its own voters who had favoured Leave. These responses were reflected in the parties’ manifestos. In the 2017 Conservative manifesto, Brexit was listed as the second of five ‘giant challenges’ with the word appearing 17 times. By 2019, Brexit was the first section of the manifesto and the word was mentioned 61 times. 1 By way of comparison, 10 pages were devoted to Labour’s 124-page 2017 manifesto, with the word appearing 24 times. In 2019, just five pages (of 105) were devoted directly to Brexit, the word appearing 21 times.
The Conservatives’ post-referendum position had an important effect on voter perceptions. Fieldhouse et al. (2020b: 169) show that while Leave voters saw the party as being very pro-EU integration in 2015, by 2017 they saw the party as being very strongly against. By way of contrast, Labour became, in effect, the default choice for Remainers and those seeking a softer Brexit, in part due to the fact that the Liberal Democrats had not yet recovered from the collapse in electoral viability in 2015, and because Green voters began moving over to Labour after Jeremy Corbyn became Labour leader (Fieldhouse et al., 2020b: 176-86). In effect, the shock of the EU referendum result significantly ‘increased the link between attitudes towards the EU and Conservative versus Labour voting’ (Fieldhouse et al., 2020b: 184), with record levels of electoral volatility in the 2017 election in terms of voters switching between the Conservative and Labour parties relative to their vote in 2015 (Fieldhouse et al., 2020b: 23-4). Indeed, while partisan affiliation might be expected to condition the effects of electoral shocks, the EU referendum vote had a stronger impact on the subsequent vote choice of stronger partisans of major parties than amongst weaker partisans or non-identifiers (Fieldhouse et al., 2020b: 45).
As is clear, in keeping with Fieldhouse et al.’s (2020b) definition of shocks the referendum result represented a sharp change in the status quo outside the normal course of politics; it was highly salient and was relevant to party politics with the potential to reshape perceptions of what parties stood for and who they represented.
The issue also became highly salient for the public. At the time of the 2015 election, the issue of Europe did not even make the top 10 most important issues facing Britain. Just 2 years later in 2017, Brexit was the second most important issue (behind the NHS), while in 2019, it was seen as the most important issue (Ipsos-MORI). And, public opinion continued to show deep splits on the issue (Evans and Menon, 2017: 115). If the referendum result represented an electoral shock for voters, we might expect, therefore, that it may change where parties’ campaigns are most effective. More specifically, an electoral shock could significantly affect the impact of prior levels of popularity on conditioning campaign effectiveness and implies that as the impact of electoral shock played out, Conservative campaigns should have become increasingly effective in pro-Leave areas whilst Labour campaigns should have become more effective in pro-Remain areas.
We can suggest, therefore, that, following an electoral shock, the popularity equilibrium model becomes a less powerful predictor of campaign effectiveness which will instead vary according to the local distribution of opinion on the salient issue. In other words, depending on how attitudes towards the newly salient issue are correlated geographically with previous levels of support, a shock may significantly weaken the relationship between campaign effectiveness and previous electorate share. Moreover, the newly salient issue may become an important factor conditioning where campaigns are most effective. We seek to test the empirical basis for this in the article by asking the following question:
Does a model incorporating the result of the EU referendum vote provide a better explanation of variation in the effectiveness of Labour and Conservative campaigns in 2017 and 2019 than one based on previous share of the electorate alone?
If the referendum vote resulted in a fundamental shift in respect of campaign effectiveness, we would expect that at the 2015 general election, there should be a weak relationship between Brexit support (as measured by the Leave vote in the 2016 referendum) and the effectiveness of campaigns in 2015. While the issue of Europe was already prominent (with the Conservatives offering a referendum in their manifesto), the issue of EU withdrawal was not yet hugely salient for much of the population. Even if Brexit was already beginning to exert an influence over party preferences, this would not necessarily impact on campaign effectiveness. The theory of popularity equilibrium rests on the premise that for maximum effectiveness parties must have a pool of untapped and receptive voters to win over. Following the argument above, we hypothesise that, because the referendum occurs after the 2015 general election, this local availability of such a pool was not determined by the distribution of Leave and Remain voters, who were still ‘up-for-grabs’ and potentially open to the influence of an effective local campaign. We therefore anticipate the referendum vote to have minimal effect on the efficacy of the major parties’ campaign effectiveness in 2015. At the very least, while we may observe the effects of the subsequent Leave vote in the year before the referendum, the effects on the conditioning of campaign effects will be weaker than in the subsequent elections of 2017 and 2019. In 2017, a year after the referendum, we should start to observe a stronger impact of the referendum result on campaign effectiveness. And, we expect this impact to continue (and perhaps even grow stronger) by the next election in 2019, on account of the significant parliamentary turmoil in the period after the 2017 election, the replacement of Theresa May by Boris Johnson as leader of the Conservative Party and Prime Minister, and the impending departure of the UK from the European Union as the 2-year period following the invocation of Article 50 which was due to fall on 31st March 2019, but which ultimately fell on 31st January 2020.
In summary, we should expect that the geographical distribution of Leave and Remain voters should condition the effectiveness of parties’ campaigns after the referendum such that Conservative campaigns are more effective in constituencies with a higher Leave vote, and Labour campaigns in constituencies with a higher Remain vote.
Our hypotheses are therefore as follows:
Including the geography of the Leave vote will improve the explanatory power of the models assessing the conditioning of campaign effectiveness in 2017 and 2019, but not in 2015.
There was no relationship between the geographic distribution of Leave voting and the electoral effectiveness of Labour and Conservative campaigns in 2015
After the referendum—in 2017 and 2019—Conservative campaigns were more effective in constituencies with a higher Leave vote
After the referendum—in 2017 and 2019—Labour campaigns were more effective in constituencies with a lower Leave vote
Data and method
Data are drawn from the British Constituency Campaign Studies of 2015, 2017 and 2019 (Fisher et al., 2015; 2017; 2019). 2 In these extensive studies, questionnaires were sent to the electoral agents of all candidates for the Conservative, Labour, Liberal Democrats, Scottish National Party, Plaid Cymru, UKIP (2015 and 2017) and the Brexit Party (2019) in order to capture the intensity of the district or constituency level campaigns. The surveys include questions on various aspects of party candidates’ campaigns: preparation, organisation, manpower, use of computers, use of telephones, polling day activity, use of direct mail, level of doorstep canvassing, leafleting, and electronic campaigning. Details of response rates in each election are shown in the Appendix. Data from the surveys were used to create an index of campaign intensity in each election year. This is calculated by creating additive scales for the components of a district or constituency campaign (identified above) for all of the surveyed parties. These scales were entered into a Principal Components Analysis (PCA) to create an index of campaign intensity for each election. Using conventional cut-off criteria, the PCAs suggest one factor is sufficient to represent the variance in the original variables in the index in each election year (see appendix Table A1). The PCAs produced scores which were then standardised around a mean of 100 to create the campaign intensity index for each election. 3 The absolute levels of the indexes can be compared directly across parties within the same year, but not over time as the indexes of campaign intensity reflect campaign developments such that additional variables are entered into the scale in each election to ensure we are capturing as accurate picture of the range of campaign activity as possible.
We can observe the impact of prior electoral performance as represented by the popularity equilibrium model on campaign effectiveness for most parties at each of the elections from 1992 to 2015 (Fieldhouse et al., 2020a; Fisher et al., 2019). If our theory about electoral shocks is correct, we should observe the impact of prior electoral performance on campaign effectiveness for both parties in 2015 such that the Leave vote had little impact, but to a lesser extent in both 2017 or 2019, where we expect the Leave vote to be a significant moderator of campaign effectiveness for each party. We do this by regressing each party’s share of the electorate at a given election on that party’s campaign intensity index, controlling for the share of the electorate at the previous election and personal incumbency (Fieldhouse et al. 2020a). Share of the electorate is used because it captures both voter mobilization and vote choice. We include share of the electorate in the previous election to account for reverse causality and unobserved variables that are correlated with previous electorate share, such as demographics. Because previous electorate share also captures previous campaign efforts, insofar as campaign efforts are correlated over time, the true extent of campaign effects may be under-estimated. Personal incumbency is used as a control because it is often a strong predictor of electoral success and can be enhanced through personalised campaigns (Eder et al., 2015; Gschwend and Zittel, 2015; De Winter and Baudewyns, 2015; Zittel, 2015).
Following previous research (Fisher et al., 2019; Fieldhouse et al., 2020a), to test how campaign effectiveness varies with popularity, we include its interaction with campaign effort in the model, together with a squared version of the lagged dependent variable (share of the electorate at the previous election) and its interaction with our measure of campaign effort to allow for a curvilinear variation of the effect of campaigning as prior electorate share increases as predicted by the popularity equilibrium model. While our analysis covers the whole of Great Britain (where the Conservatives and Labour field candidates in almost every seat), we control for country, reflecting the different patterns of party competition (given the SNP and Plaid Cymru stand in every Scottish/Welsh seat) 4 and because the effective number of competing parties is likely to affect electoral performance irrespective of campaign effort. In addition, the performance of the SNP in each of these three elections has been especially strong, the party winning 50% of the Scottish vote in 2015; 37% in 2017 and 45% in 2019. We also control for the presence of UKIP (2015 and 2017) and Brexit Party (2019) candidates, reflecting the increased level of party competition in those elections.
In the analyses below, the Popularity Equilibrium Model (Model 1) is specified as follows:
Share of the Electorate = β1Share of the Electoratet-1 + β2Campaign Intensity + β3Share of the Electorate2t-1 + β4Share of the Electoratet-1 * Campaign Intensity + β5Share of the Electorate2t-1 * Campaign Intensity + β6Party + β7Party * Share of the Electoratet-1 + β8Party * Campaign Intensity + β9Party * Campaign Intensity * Share of the Electoratet-1 + β10Party * Share of the Electorate2t-1 * Campaign Intensity + β11Personal Incumbency + β12Scotland + β13Wales + β14Wales * Party + β15Scotland * Party + β16UKIP/Brexit Party Candidate +ε
To take account of the possibility that each party’s electorate share (after controlling for previous electorate share etc.) was related to support for Brexit, in Model 2 we additionally include the estimates of the size of the Leave vote in each constituency (Hanretty, 2017) together with an interaction of these with party.
Thus, Model 2 is:
Share of the Electorate = β1Share of the Electoratet-1 + β2Campaign Intensity + β3Share of the Electorate2t-1 + β4Share of the Electoratet-1 * Campaign Intensity + β5Share of the Electorate2t-1 * Campaign Intensity + β6Party + β7Party * Share of the Electoratet-1 + β8Party * Campaign Intensity + β9Party * Campaign Intensity * Share of the Electoratet-1 + β10Party * Share of the Electorate2t-1 * Campaign Intensity + β11Personal Incumbency + β12Scotland + β13Wales + β14Wales * Party + β15Scotland * Party + β16UKIP/Brexit Party Candidate + β17Leave Vote + β18Party * Leave Vote +ε
To examine the extent to which the effectiveness of the Labour and Conservative campaigns were related to the 2016 referendum vote, we build an alternative Combined Model (Model 3). Model 3 further builds on Model 2 to test whether both popularity and Brexit support simultaneously moderate campaign effectiveness. Thus:
Share of the Electorate = β1Share of the Electoratet-1 + β2Campaign Intensity + β3Share of the Electorate2t-1 + β4Share of the Electoratet-1 * Campaign Intensity + β5Share of the Electorate2t-1 * Campaign Intensity + β6Party + β7Party * Share of the Electoratet-1 + β8Party * Campaign Intensity + β9Party * Campaign Intensity * Share of the Electoratet-1 + β10Party * Share of the Electorate2t-1 * Campaign Intensity + β11Personal Incumbency + β12Scotland + β13Wales + β14Wales * Party + β15Scotland * Party + β16UKIP/Brexit Party Candidate + β17Leave Vote + β18Party * Leave Vote + β19Campaign Intensity * Leave Vote + β20 Party * Campaign Intensity * Leave Vote +ε
Following Fieldhouse et al. (2020a) beta regression is used. The principal reason is that modelling shares of the electorate expressed as a percentage can be problematic because predicted values of Y can fall outside of the range zero to one hundred. Beta regression is a type of regression model suitable for situations in which the response is continuous, bounded by zero and one, and beta distributed (Ferrari and Cribari-Neto, 2004). The beta distribution is defined by two parameters representing the mean and variance of the response, making the model sufficiently flexible to handle a variety of situations. The model allows for asymmetry in proportions and facilitates interpretation of coefficients on the original scale. Before modelling, share of the electorate is divided by 100 to ensure that it lies between 0 and 1 as required by beta regression. 5 Reflecting the use of constituencies as the unit of analysis, where there may be multiple responses from different parties, we use clustered standard errors.
Overall, we are seeking to assess whether the incorporation of the level of the Leave vote into the models improves fit and then assess whether the level of the Leave vote conditioned where parties’ campaigns were most effective. It is commonplace to use various R2 statistics and likelihood ratio tests to assess the fit of a model. Yet given that adding terms to a model will always improve fit, it can be difficult to reject more complex models with larger samples as it becomes far more difficult to determine ‘actual’ from more trivial improvement. As a consequence, there is a tendency to ‘overfit’ and for models to be less parsimonious than they should be. In seeking to avoid the ‘overfitting’ problem some researchers will eliminate parameters in a systematic manner thereby exposing the risk that this more simplified model will not explain the data. To offset these problems of model selection, quantifiable measures of the expected value of information are used to compare the relative plausibility of different models and as such determine which best approximates the data. Here we use two common information measures - the AIC (Akaike’s Information Criterion) and BIC (Bayesian Information Criterion) to simultaneously assess overall fit and compare different non-nested or in our case nested models (Long and Freese, 2014; Raftery, 1995; Yang, 2005). Both the AIC and BIC are penalized likelihood criteria as they involve the calculation of a maximum log-likelihood and a penalty term. So as more parameters are added, the fit improves but any extra contribution to model fit must counterbalance the penalty that comes from their inclusion. In other words, there are penalties for those additional variables that do not significantly improve fit. Using the maximum likelihood estimate and the number of parameters, the AIC estimates the information lost in the model. As such it is a useful measure to avert ‘overfitting’. The BIC uses a Bayesian set-up to assess overall fit and compare models and differs from the AIC in that it imposes a larger penalty for a higher number of parameters (Schwarz, 1978). The BIC is always higher than the AIC but a lower BIC specifies lower penalty terms while a smaller AIC indicates less information lost. For both measures, the best model is the one that provides the minimum or more negative AIC and BIC value (Burnham and Anderson, 2002; Kass and Raftery, 1995). Here we use both information measures and the magnitude change between models to aid model selection. 6
We test the models for the Conservatives and Labour for each election in the series (2015, 2017 and 2019). Of course, the referendum occurred in 2016, after the 2015 election. However, we run the model for 2015 to test whether the referendum marked a shift in the relationship between the constituency Leave vote and campaign effectiveness. In effect, as the referendum occurred after the 2015 election, this provides a placebo test for the Brexit electoral shock. Our expectation is that any effects of the constituency Leave vote will be weak or non-existent in 2015, but will become more evident in the subsequent elections.
Results
The Leave vote and model fit
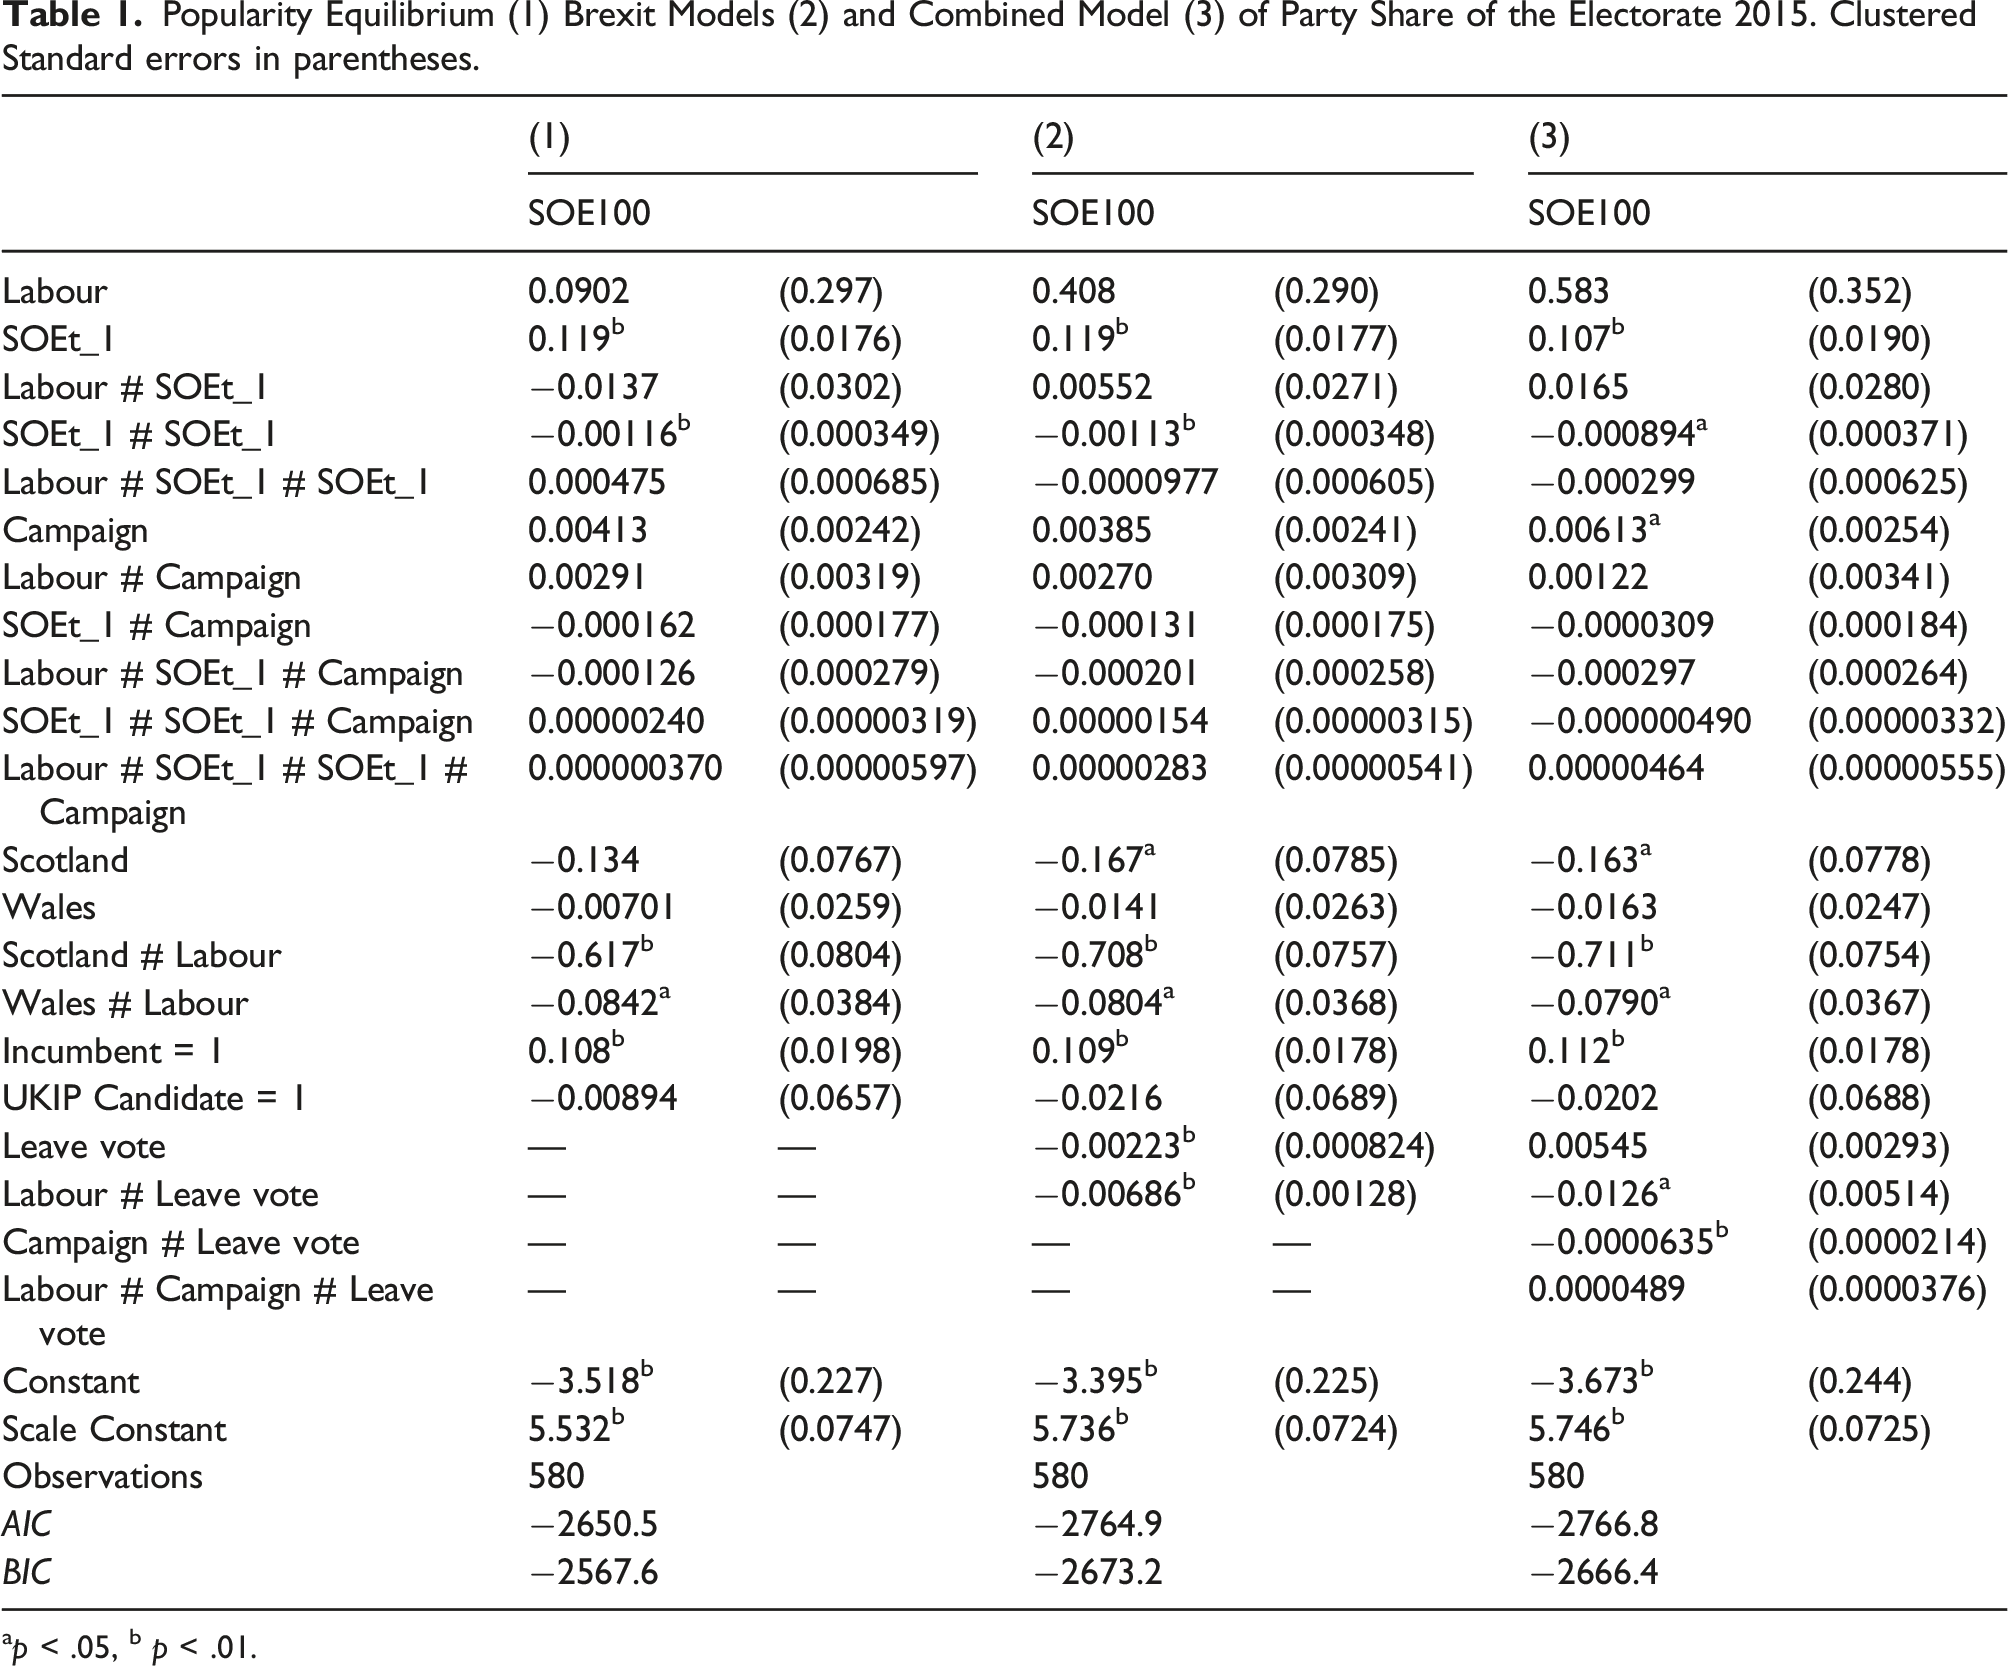
Popularity Equilibrium (1) Brexit Models (2) and Combined Model (3) of Party Share of the Electorate 2015. Clustered Standard errors in parentheses.
ap < .05, b p < .01.
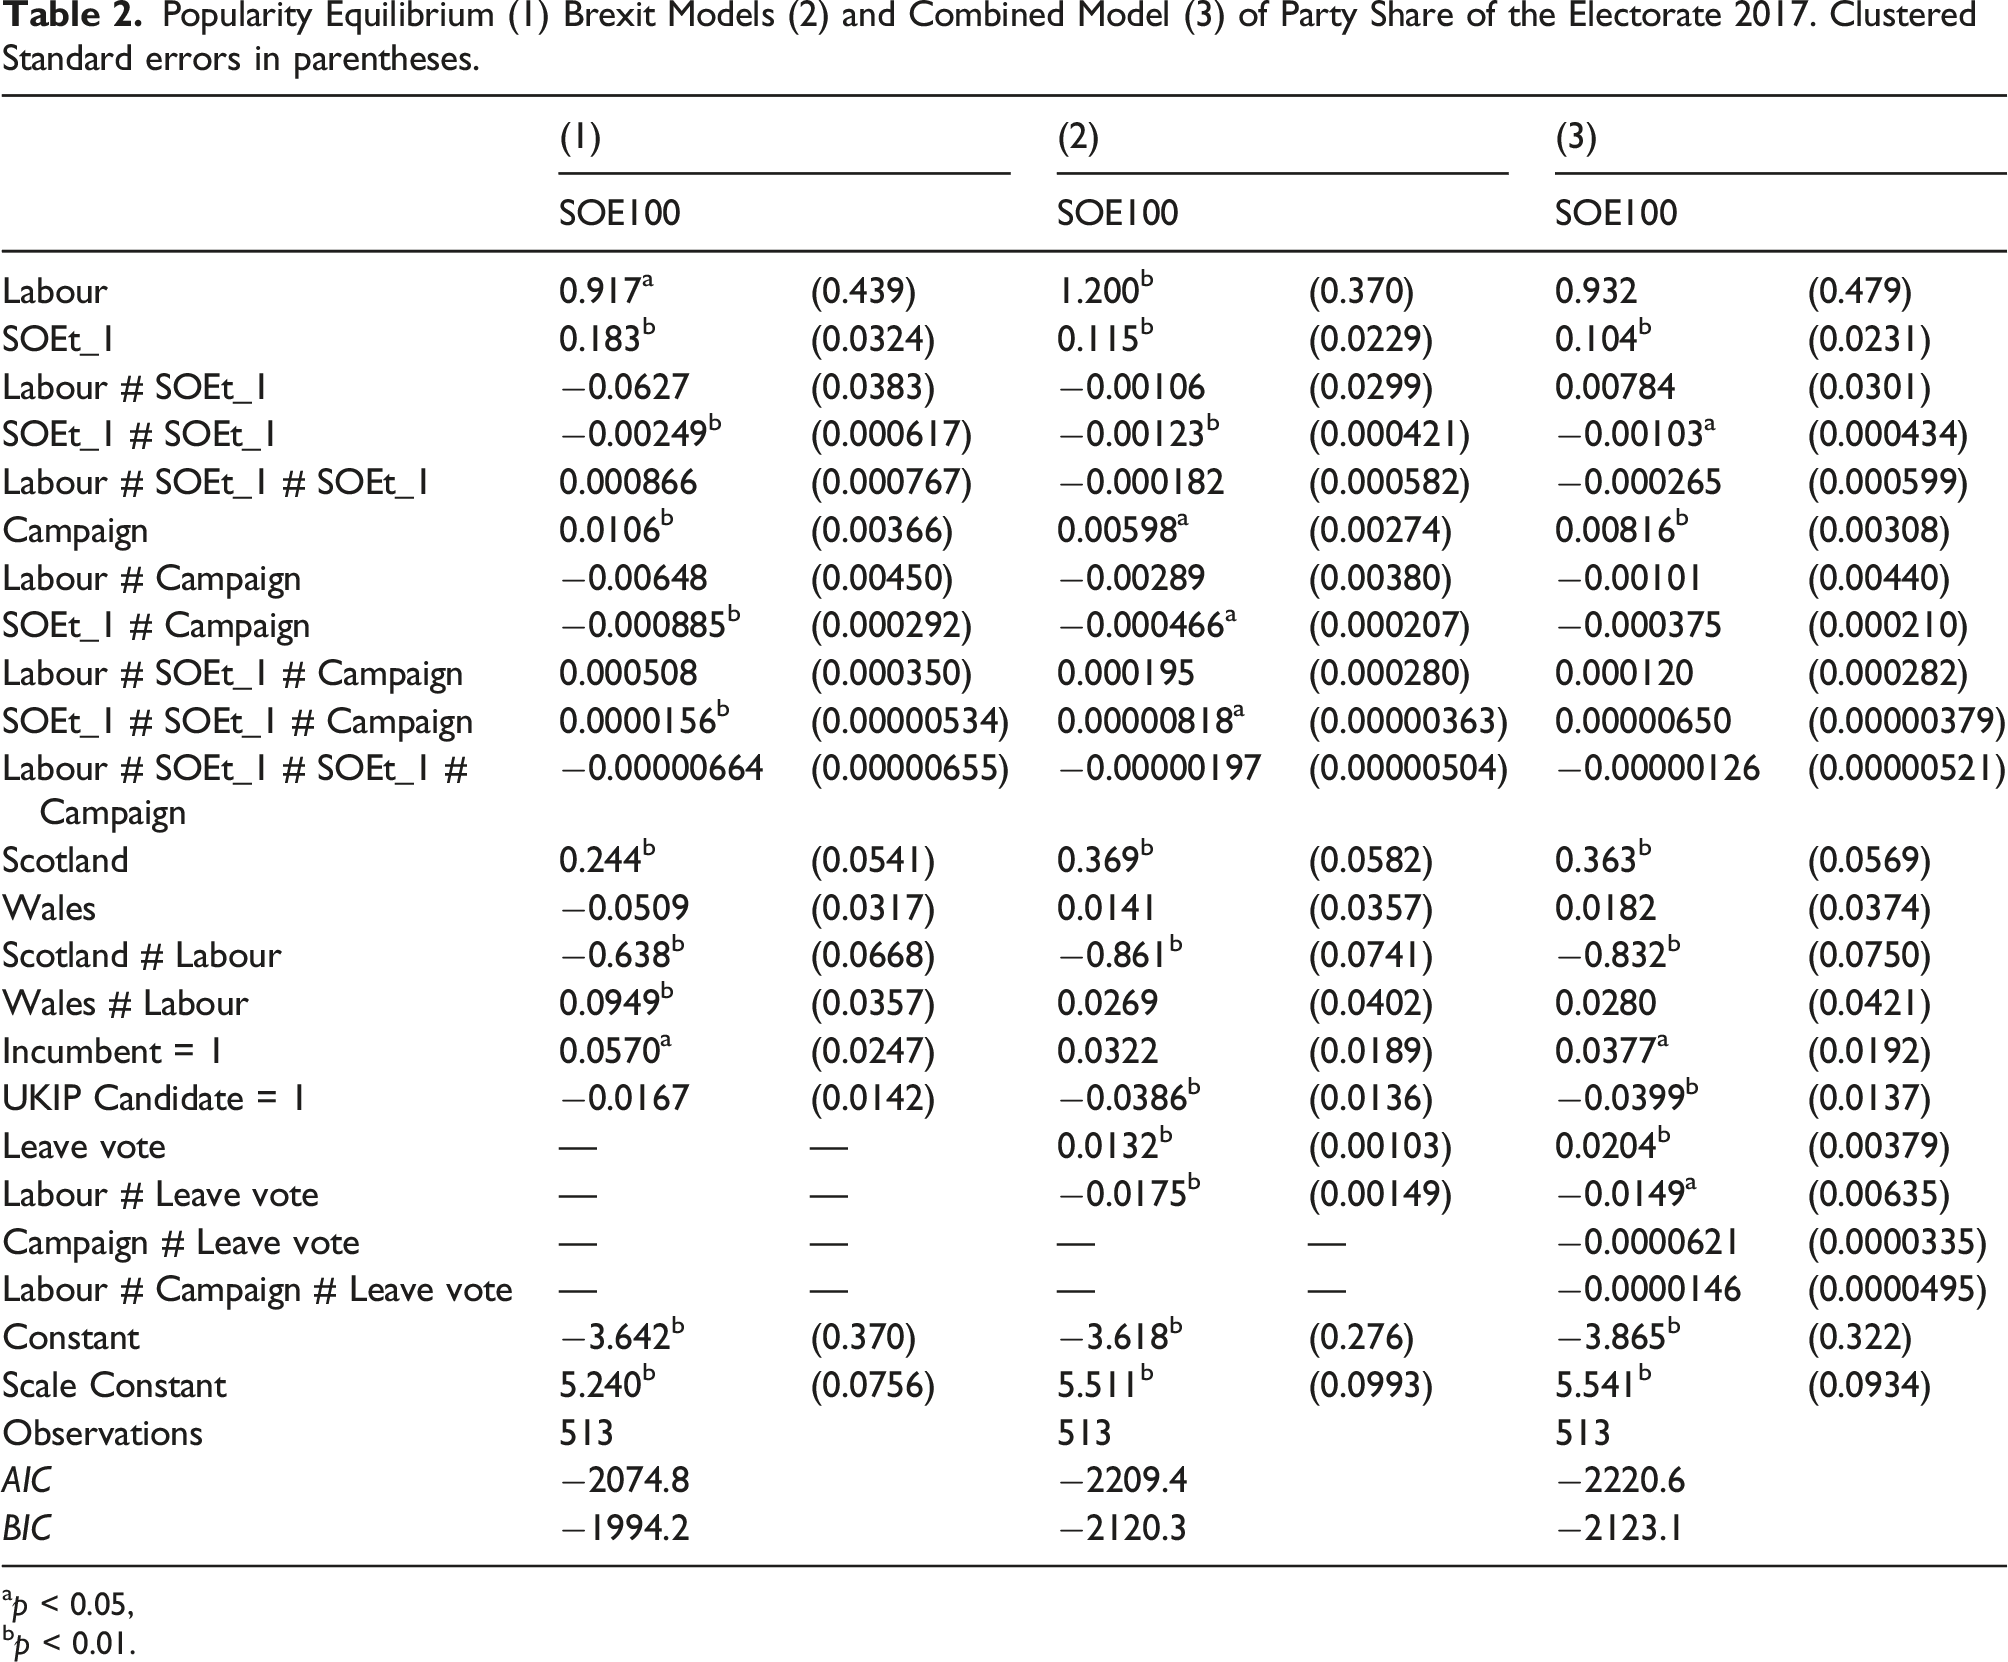
Popularity Equilibrium (1) Brexit Models (2) and Combined Model (3) of Party Share of the Electorate 2017. Clustered Standard errors in parentheses.
ap < 0.05,
bp < 0.01.
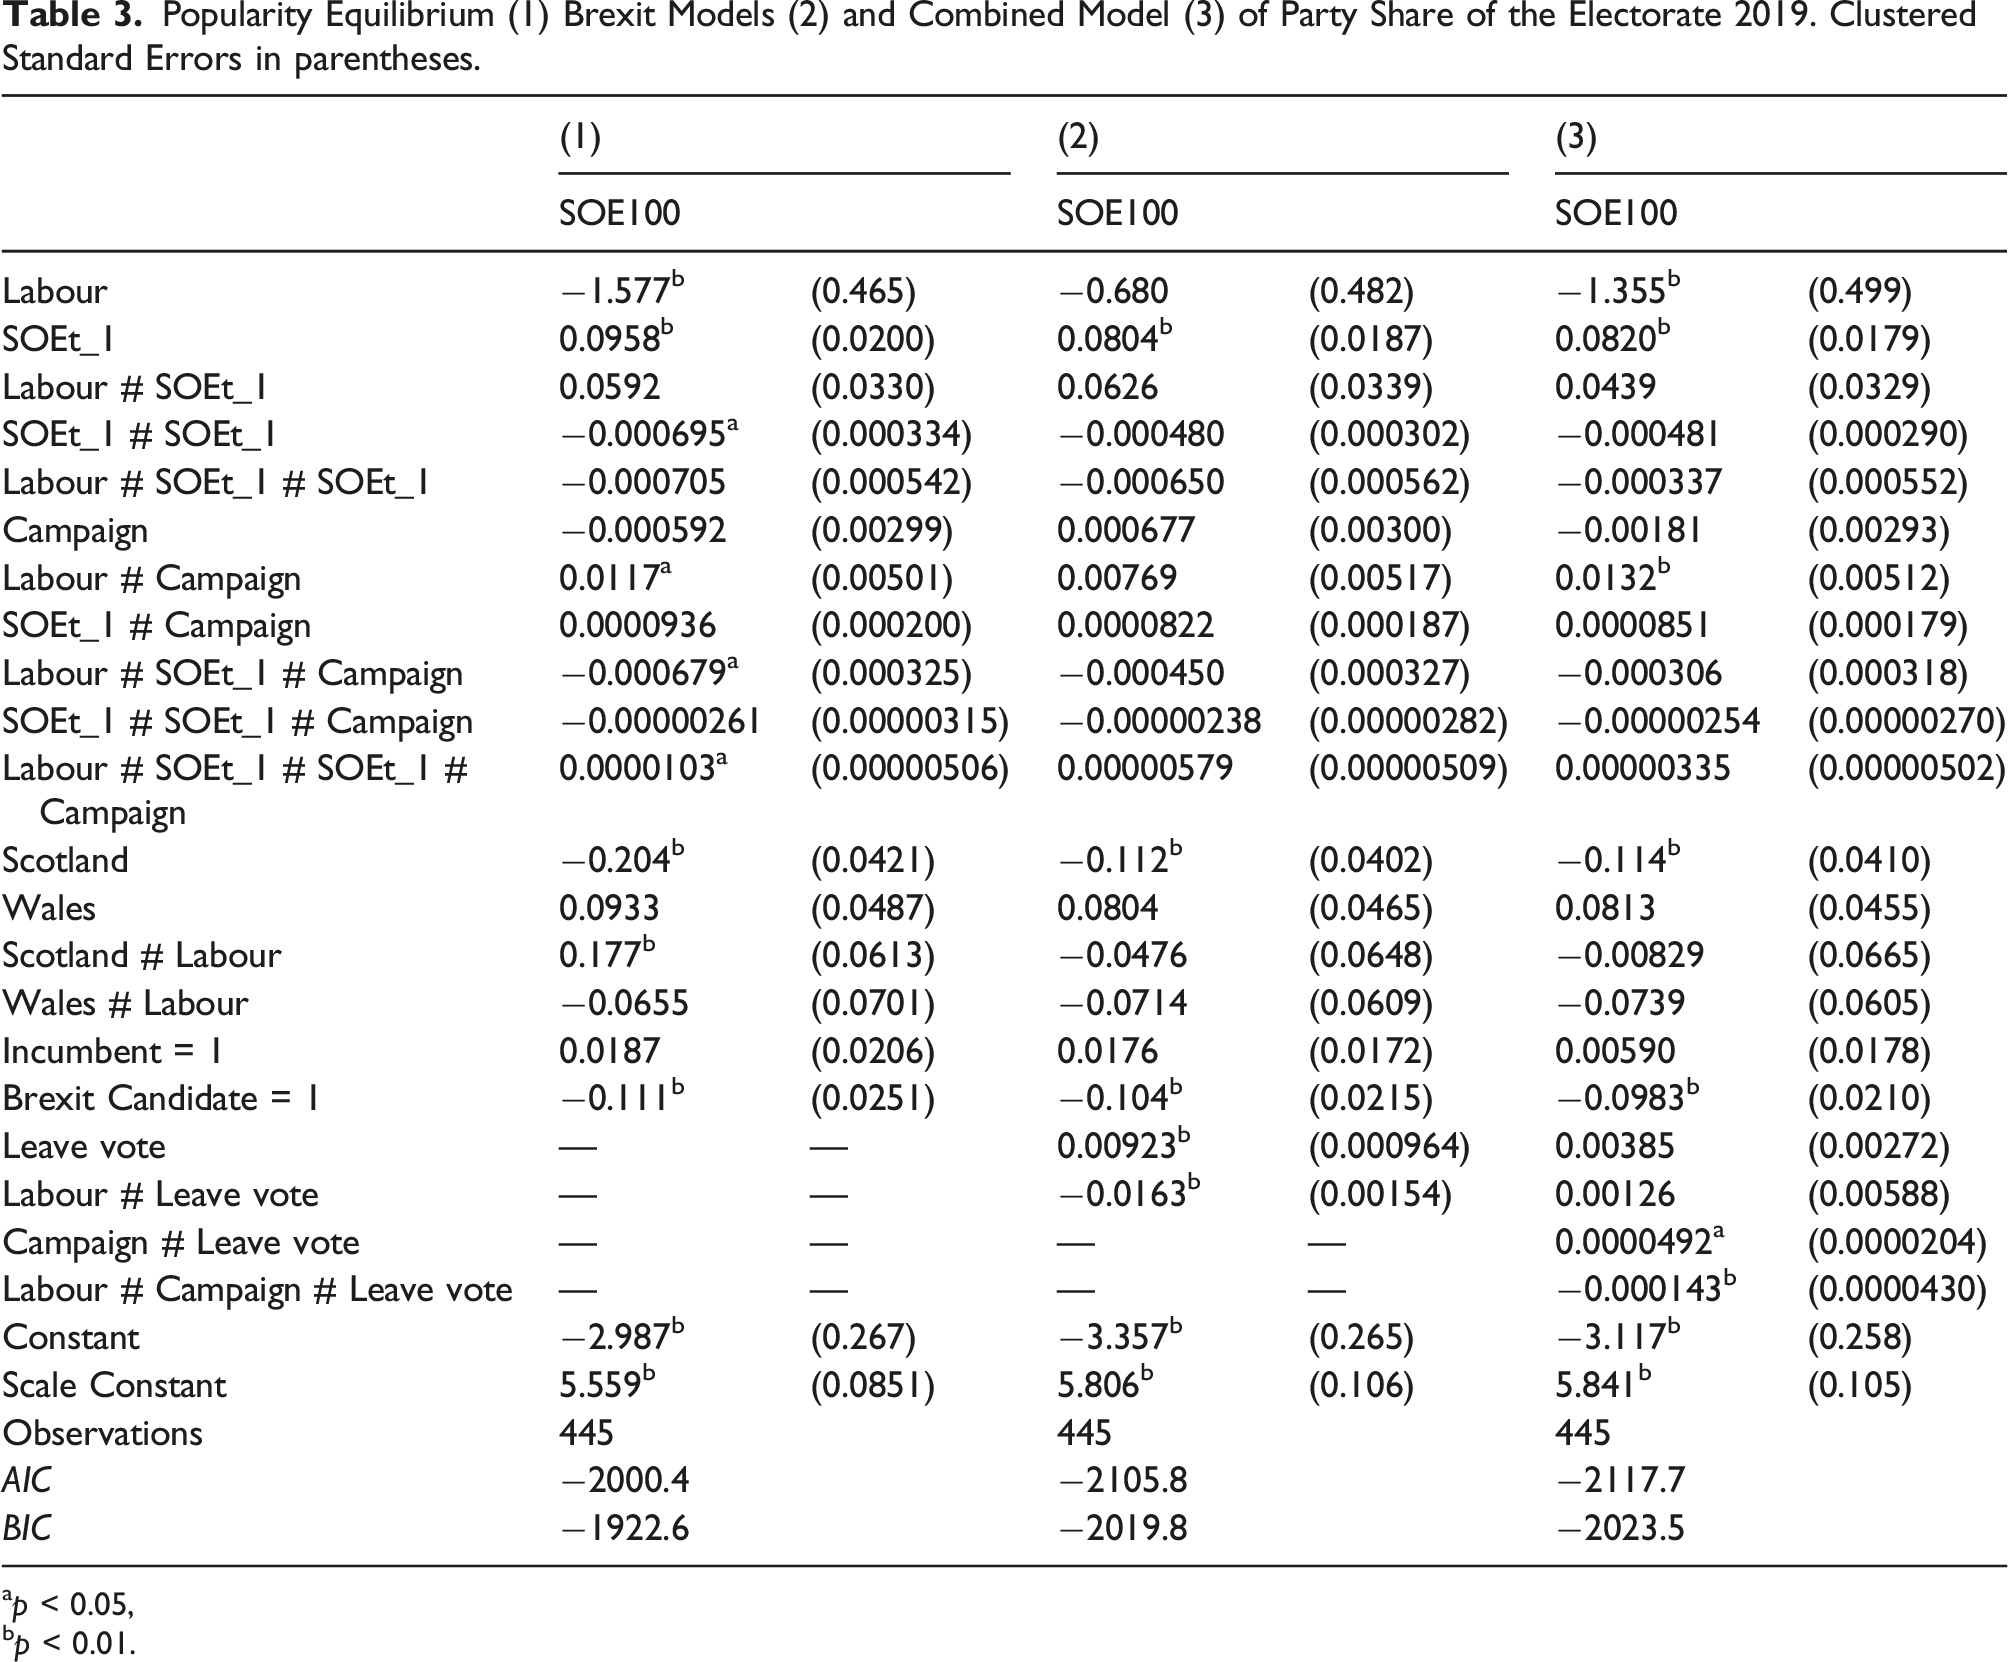
Popularity Equilibrium (1) Brexit Models (2) and Combined Model (3) of Party Share of the Electorate 2019. Clustered Standard Errors in parentheses.
ap < 0.05,
bp < 0.01.
However, Table 1 also shows that the models including information about existing popularity and the Leave vote (Models 2 and 3) also generate a better model fit than Model 1 in the election held in the year before the referendum. This suggests that the impact of support for Brexit was already apparent on share of the electorate in 2015 - perhaps not surprising given the success of UKIP and the salience of immigration (Evans and Mellon, 2019). At first sight, this finding appears to run counter to our arguments about the effects of electoral shock. We would expect to - and indeed do - find that the Leave vote improves model fit in 2017 and 2019, but we also observe an improvement in fit in 2015. However, it is important to note that the dependent variable (which determines model fit) is share of the electorate, not campaign effectiveness – which is assessed through the conditional marginal effect of the campaign intensity index (see below). More importantly, while Model 2 represents an improvement in fit on Model 1, Model 3—which includes an interaction between Leave vote and campaign intensity – represents only a marginal improvement in model fit compared with Model 2 using AIC. Conversely, the BIC suggests Model 2 has a better fit than Model 3. This suggests that the Leave vote is helping to explain share of the electorate in 2015, but that the interaction between the Leave vote and campaign intensity does not. Moreover, although Table 1 also shows that the coefficients for the interactions of the Leave vote and campaign intensity in 2015 (Model 3) are statistically significant, pointing to the presence of Leave vote effects on campaign effectiveness in 2015, those coefficients are negative and the coefficient for the main effect indicates that both parties’ share of the electorate was lower where the Leave vote was higher.
Overall, the evidence in respect of model fit supports our hypotheses. The inclusion of the Leave vote improves model fit in all three elections, but critically, it is only in the elections after the referendum that the effects of the interactions between the Leave vote and campaign intensity does so (in Model 3). Thus,
Average marginal effects of the campaigns by the Leave Vote
If our hypotheses are correct we would expect to see a change in the relationship between the efficacy of the campaign and local Brexit preferences after the referendum. We therefore examine the relationship between the Leave vote and the average marginal effect of each party’s campaigns using results from our preferred combined model (Model 3).
8
Our expectation was that there would be little or no effect in the Leave vote on the efficacy of parties’ campaigns in 2015, prior to the referendum (
Figures 1–3 illustrate the average marginal effects of the campaigns by the constituency Leave vote for each party in each of the three elections using results from Model 3 (2015, 2017 and 2019). The figures illustrate how the Leave vote moderated the effectiveness of each party’s campaigns. As beta regression was employed, share of the electorate is expressed as a proportion and the y axis has a range of 0–1. Figures 4 and 5 additionally present the average marginal effects by party, allowing direct comparison over time. These results are generated from a (separate) model using the data pooled across years with interaction effect of year with all the other terms in the model. The coefficients for this model are in the online supplementary material. Average marginal effect of conservative and labour campaigns (2015) by leave. Average marginal effect of conservative and labour campaigns (2017) by leave vote. Average marginal effect of conservative and labour campaigns (2019) by leave vote. Average marginal effect of conservative campaigns 2015-2019 by leave vote. Average marginal effect of labour campaigns 2015-2019 by leave vote.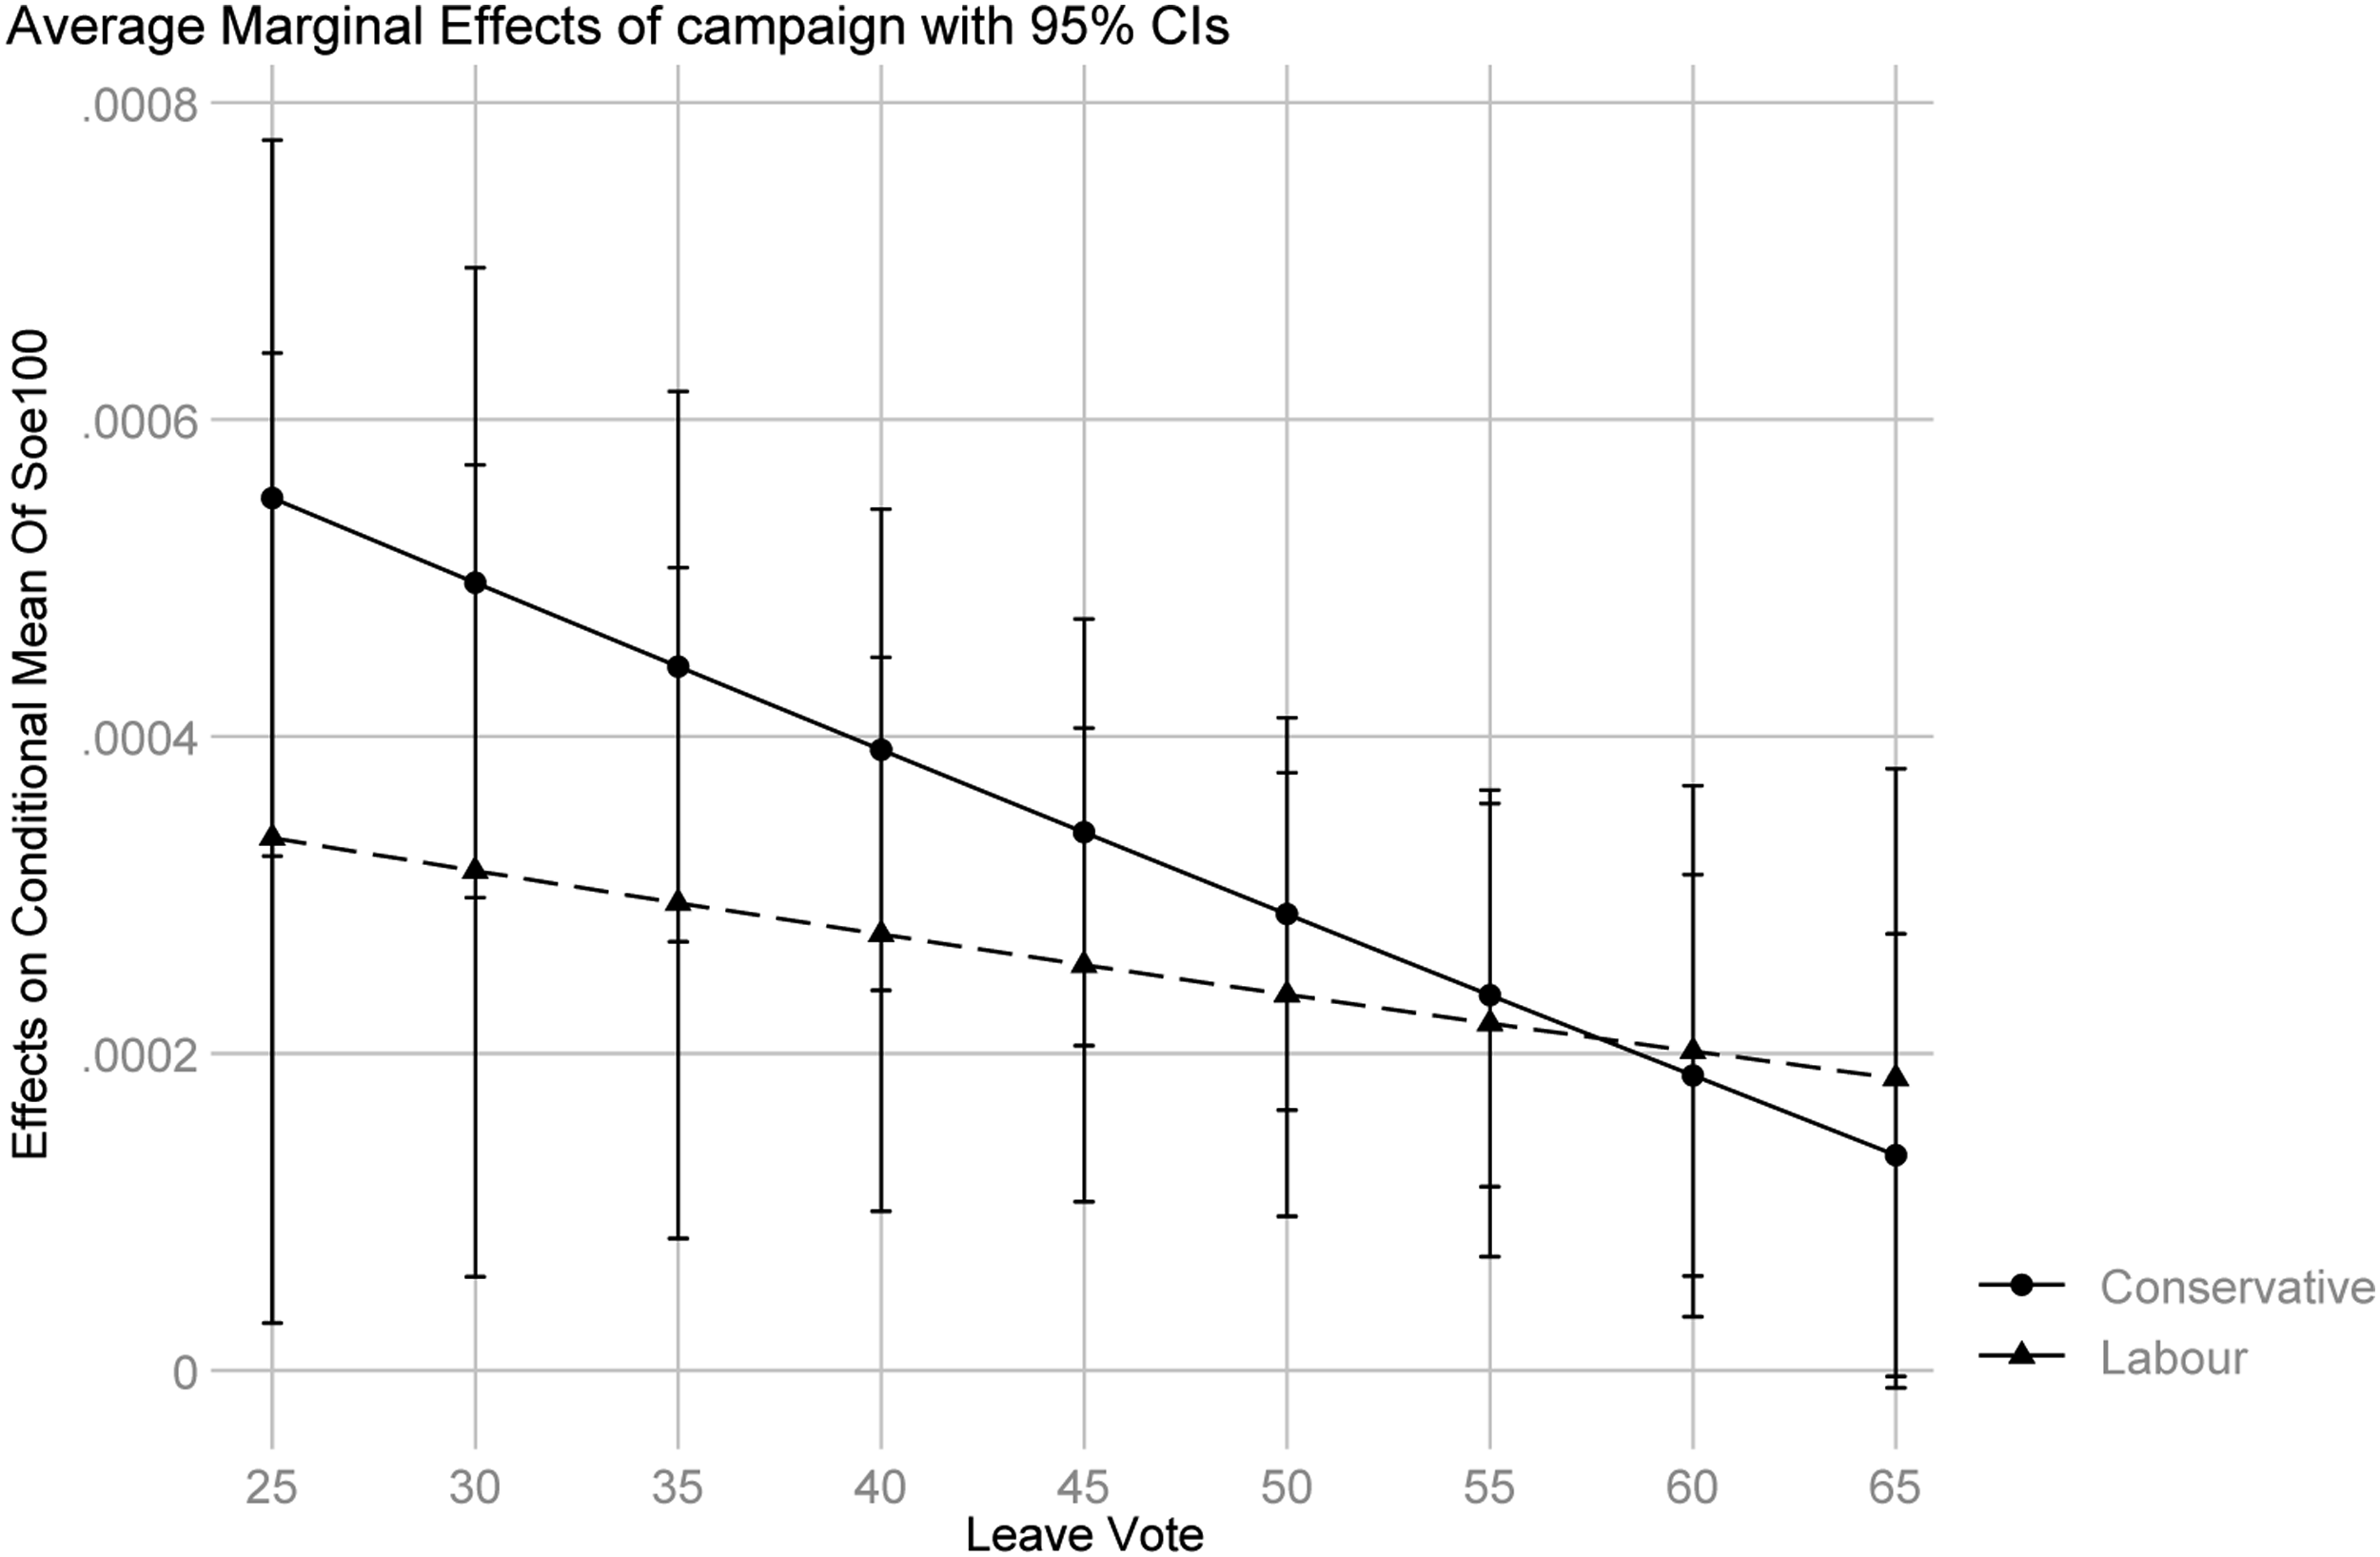
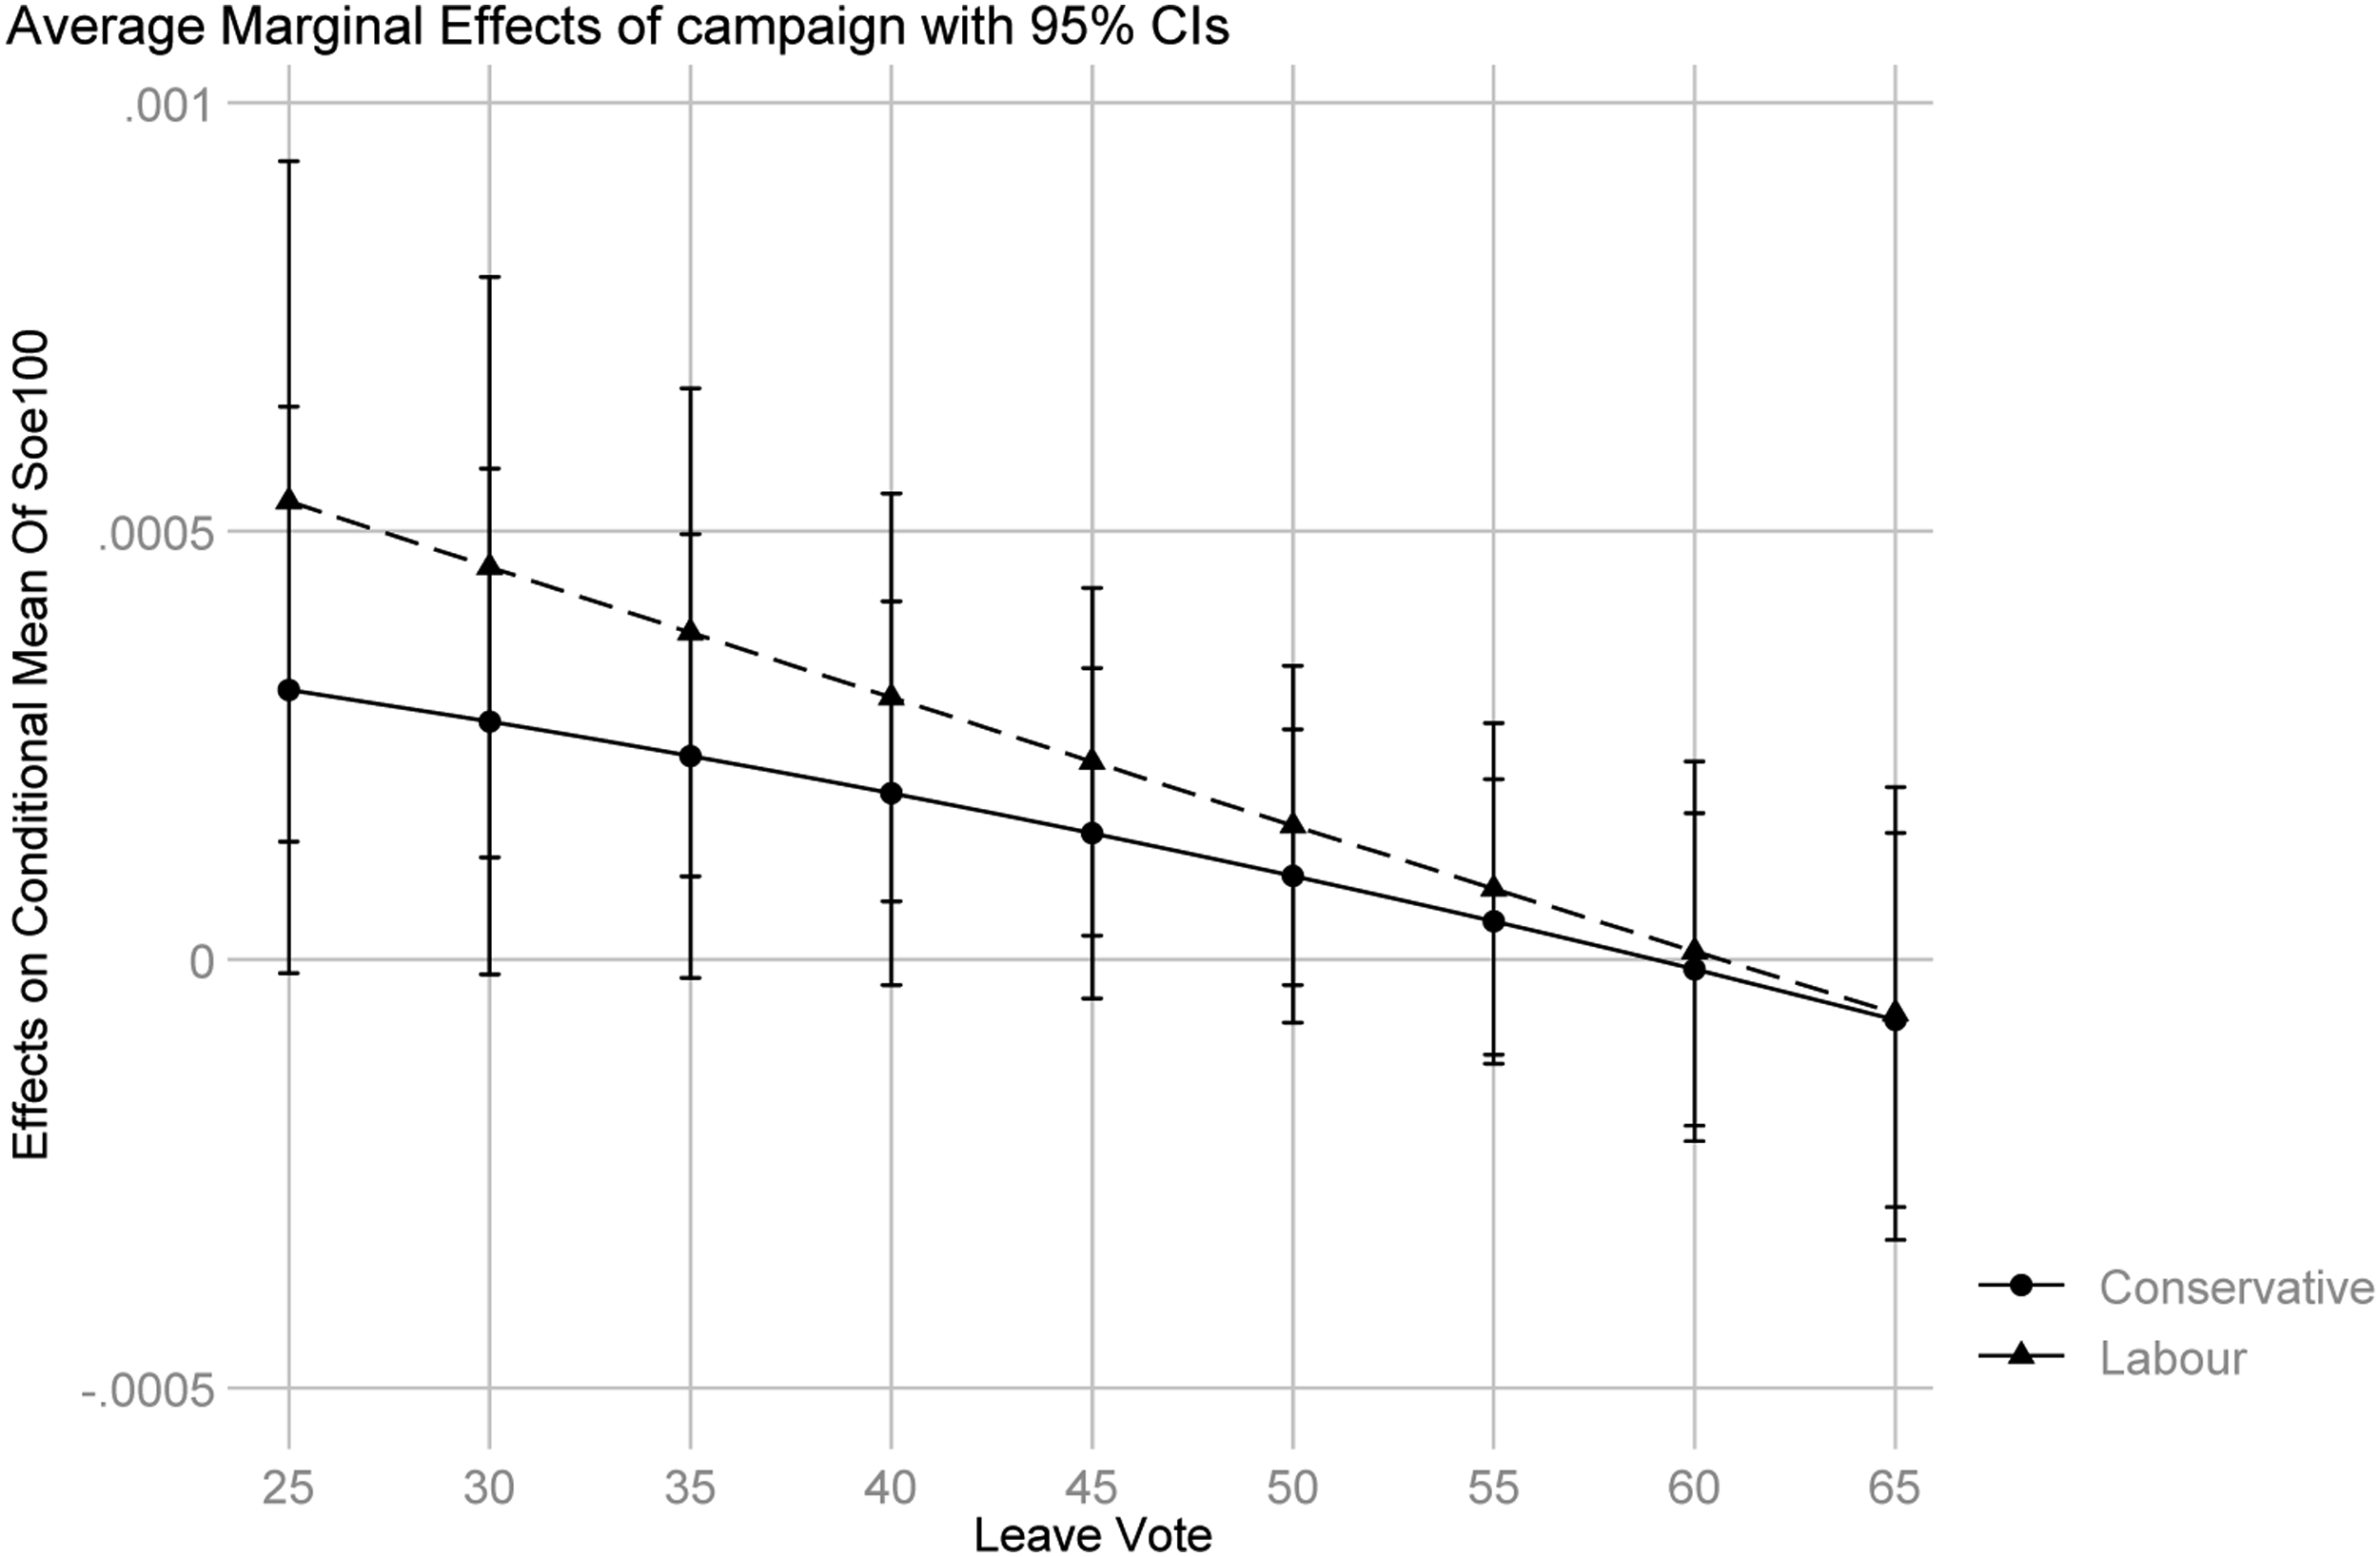
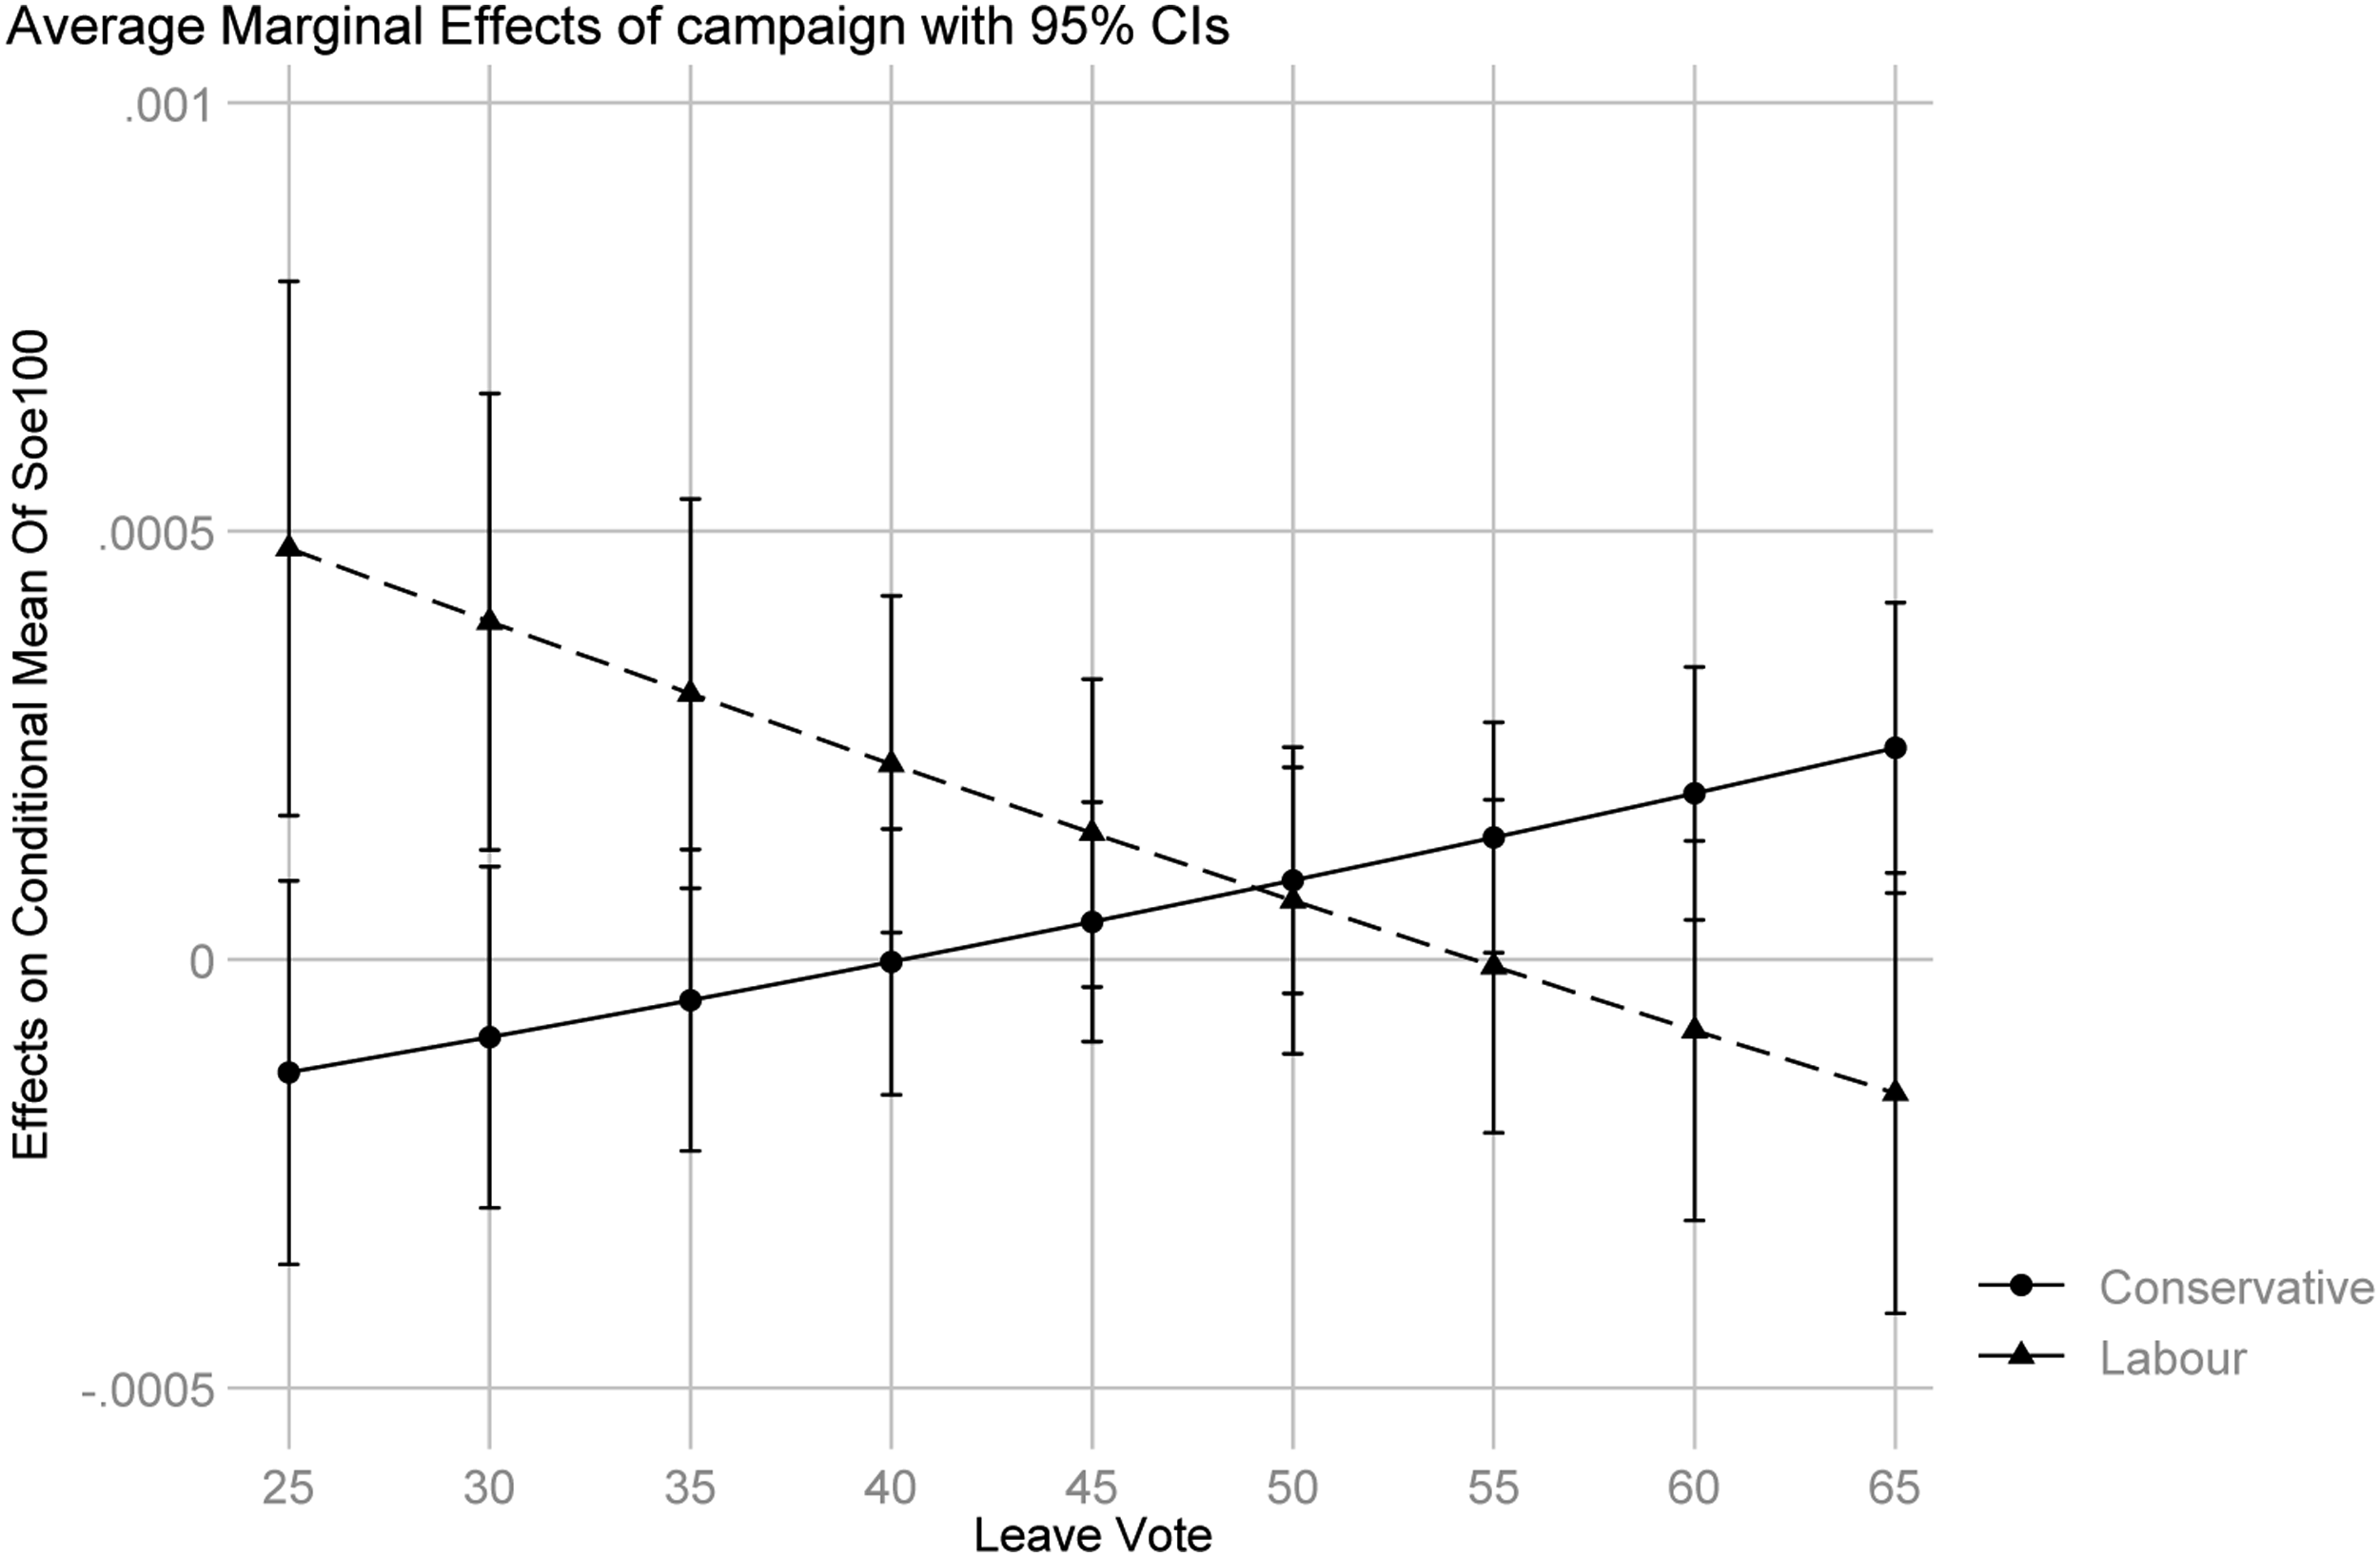
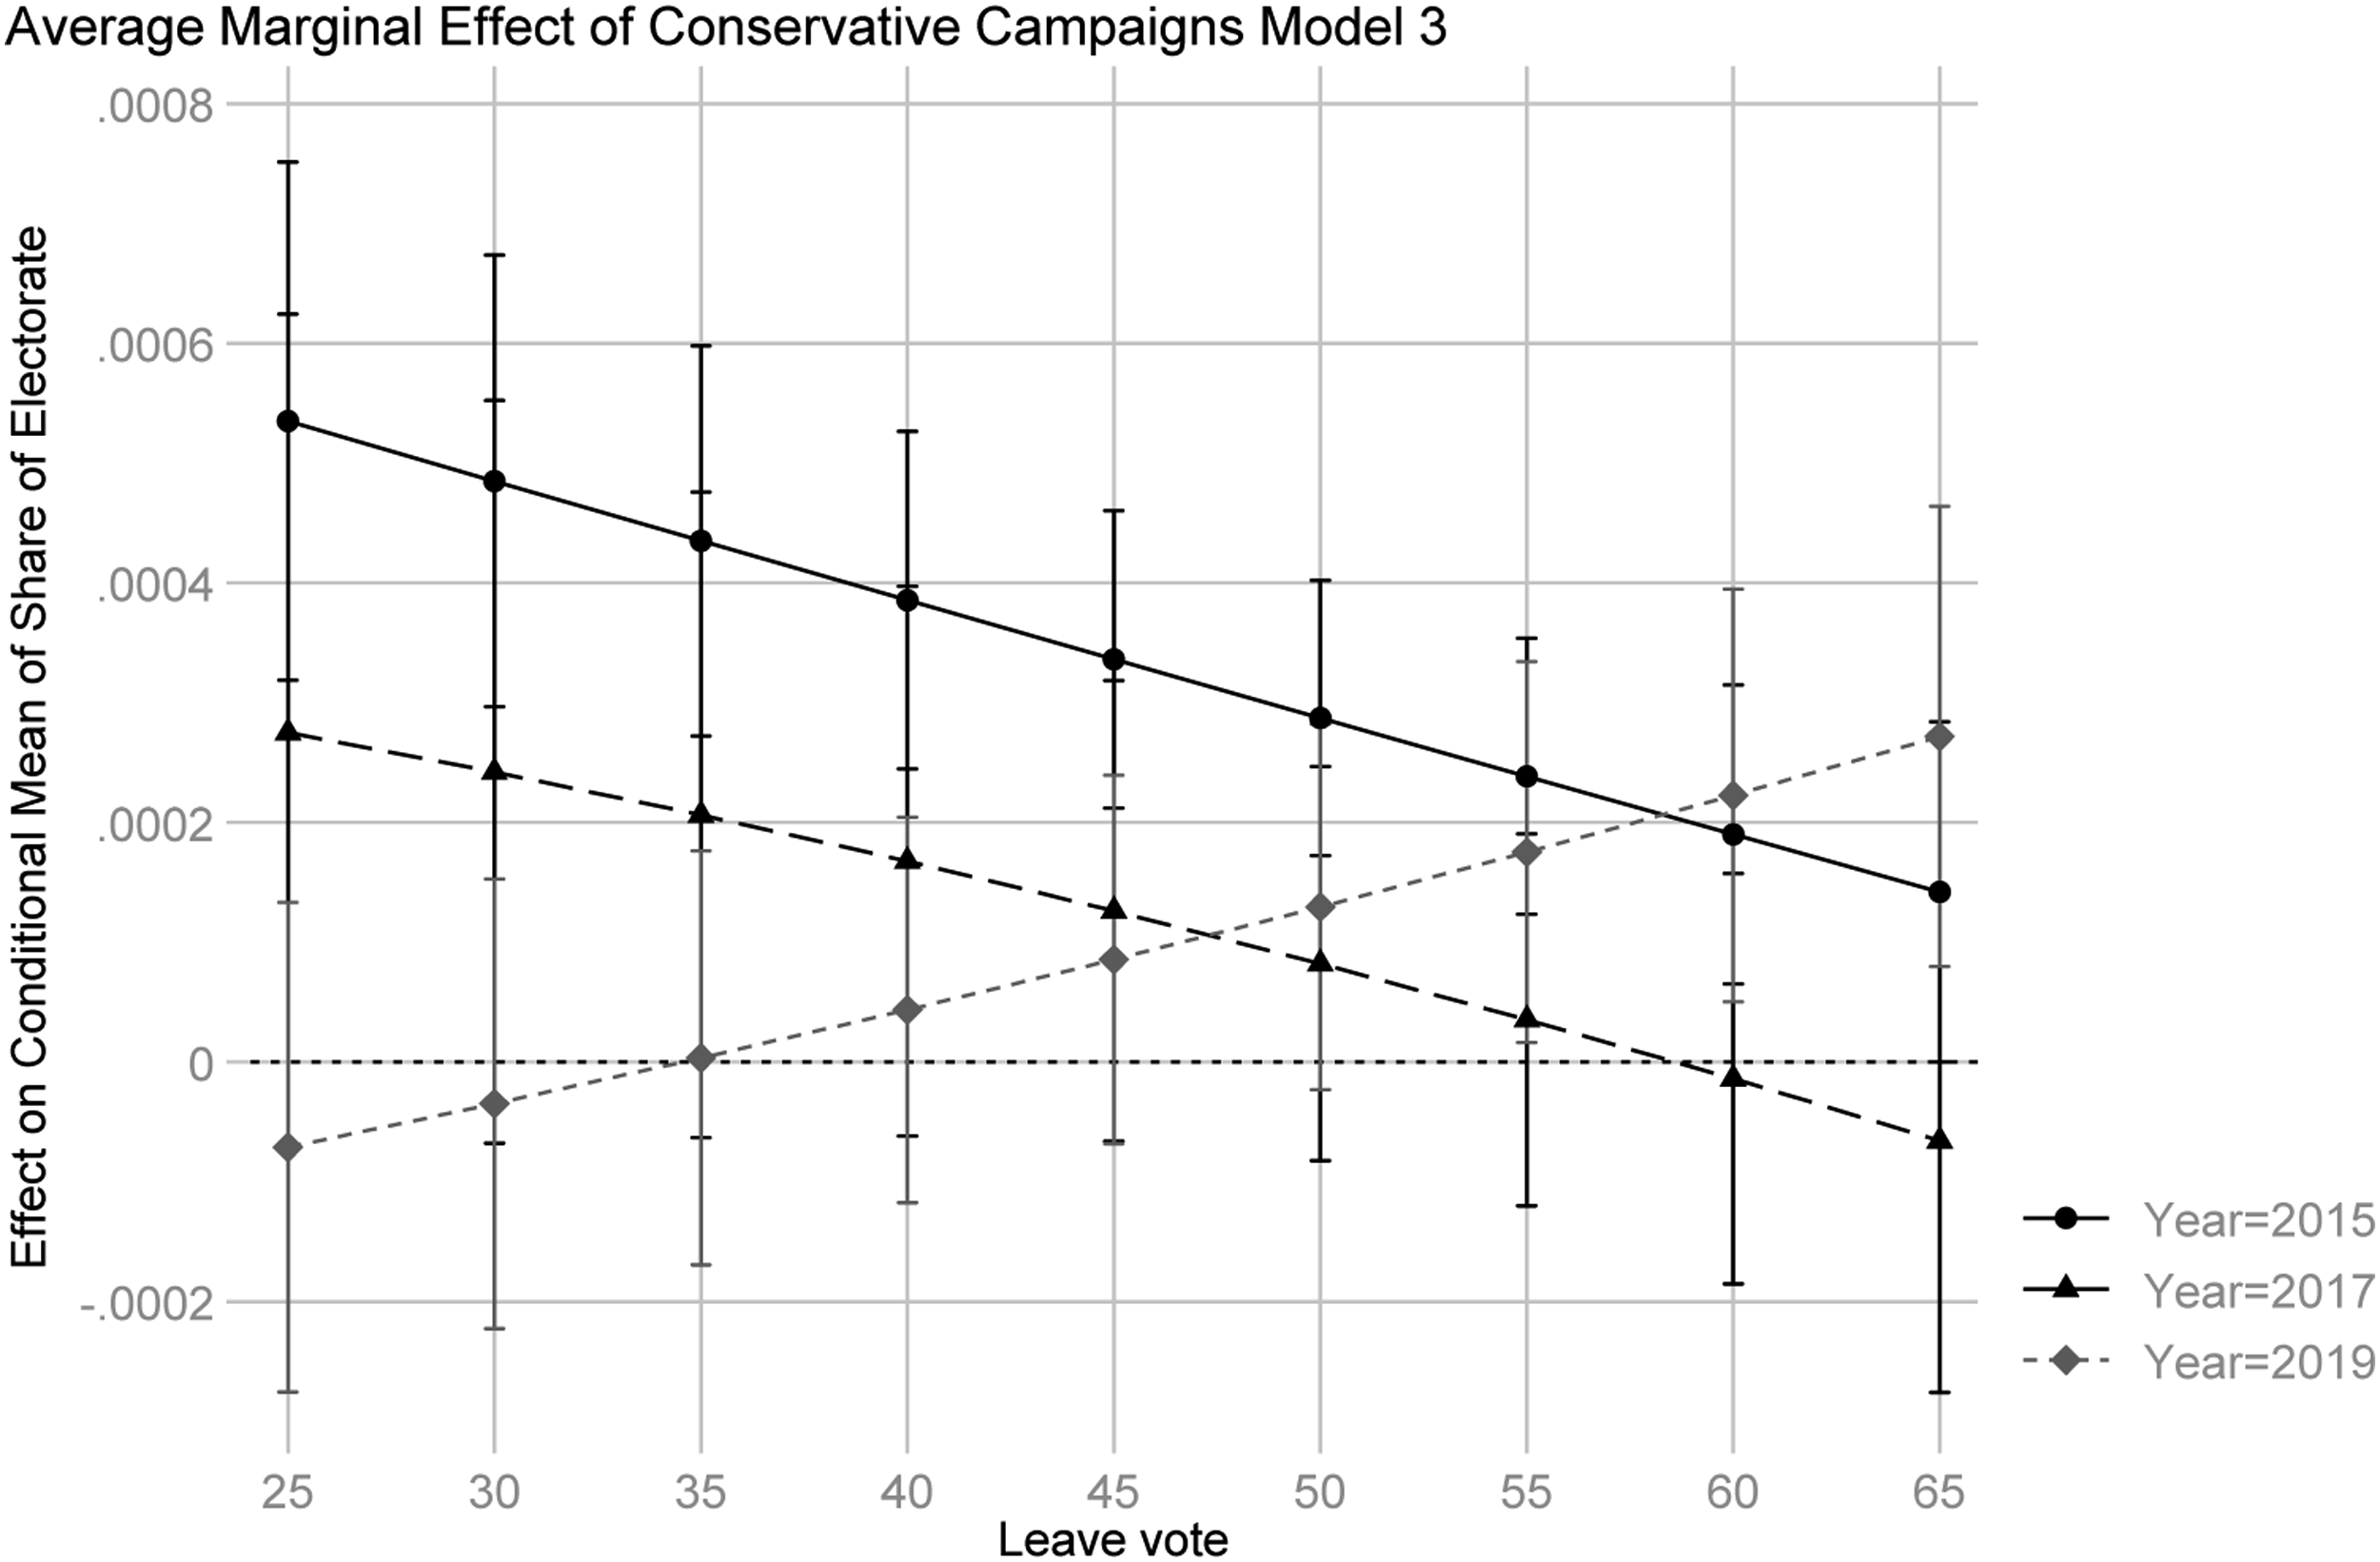
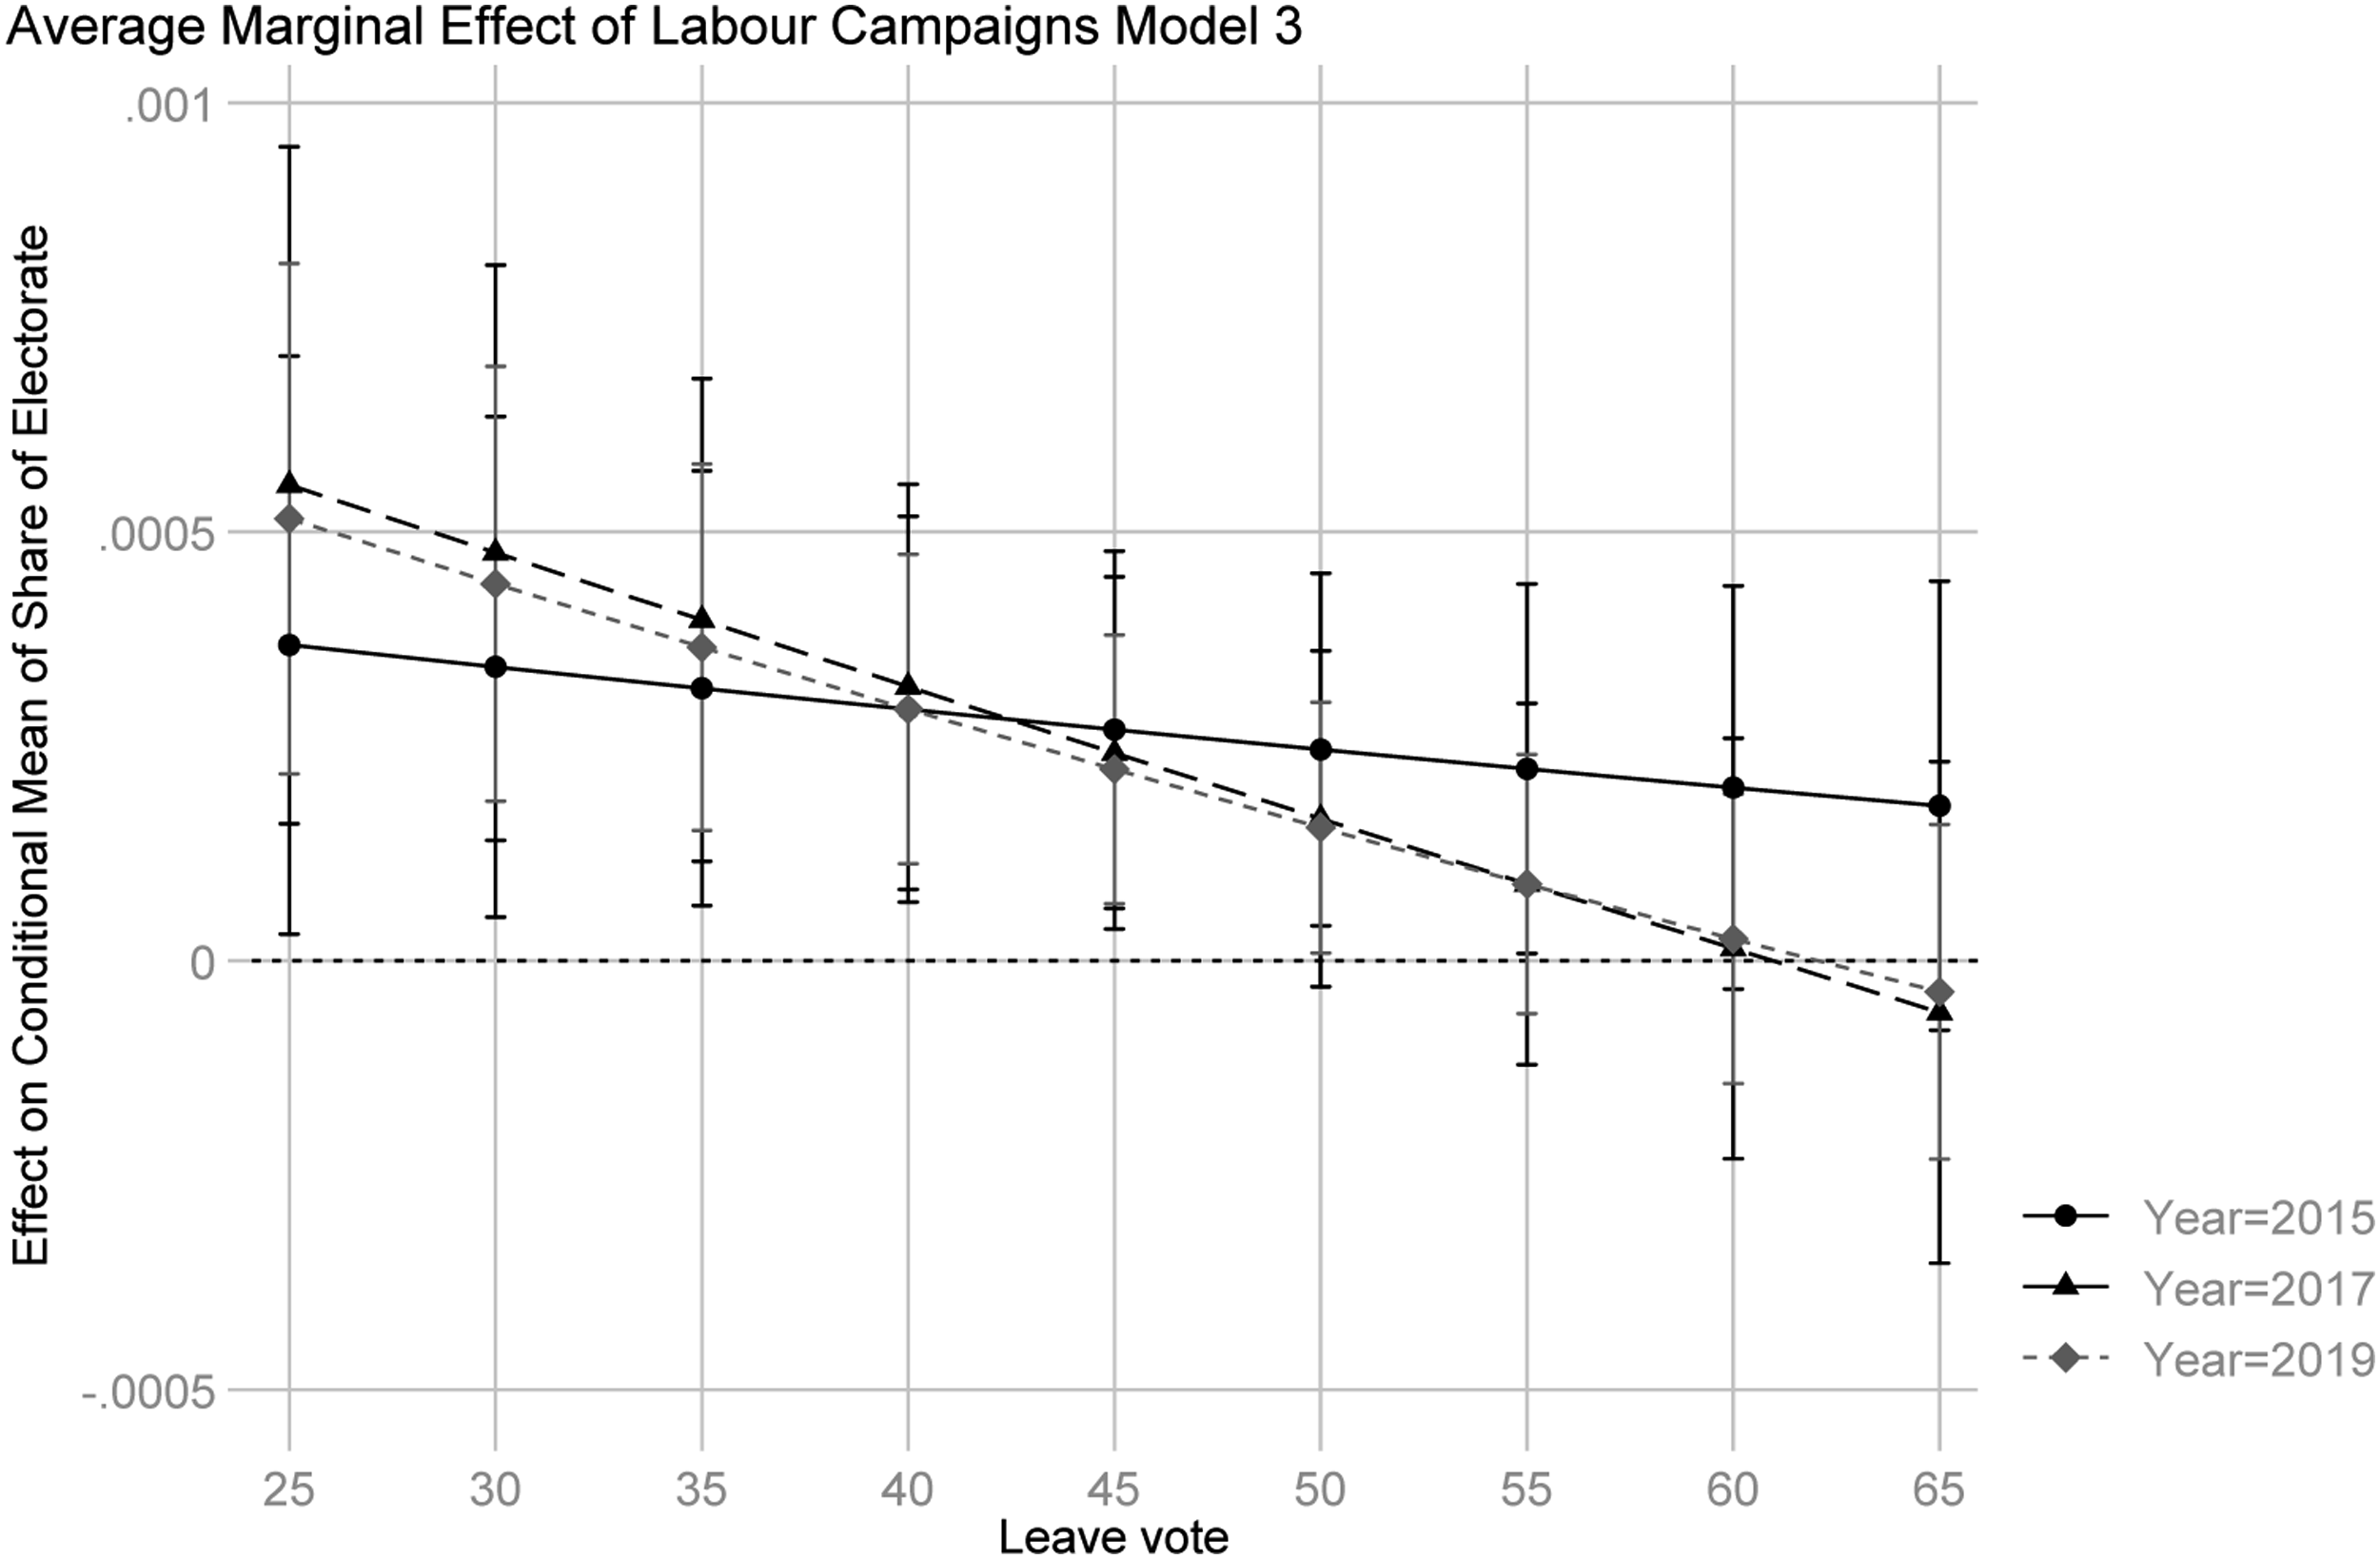
Figure 1 shows that as predicted, 2015 was different from subsequent elections in respect of the impact of the constituency Leave vote on campaign effects. While for Labour there was no discernible effect related to the constituency Leave vote, for the Conservatives we can observe a small effect such that the party’s campaigns were less effective in constituencies where the Leave vote was subsequently higher, reflecting competition from UKIP in 2015 and the fact that, on average, voters viewed the Conservatives in 2015 as being pro-EU (Fieldhouse et al., 2020b). However, the average marginal effects of the two parties’ campaigns are not significantly different from each other at any value of the Leave vote, and overall, it confirms that prior to the referendum, campaign effectiveness was only very weakly related to the Leave vote. There was no relationship in respect of Labour, while in the case of the Conservatives, the very small effect observed was such that the party's campaigns were slightly more effective in more Remain leaning areas.
Figure 2 illustrates the results from 2017. Again, we observe that the average marginal effects of each parties’ campaigns were not different to a statistically significant degree at any value of the Leave vote. Both parties’ campaigns were marginally less effective in areas with the highest Leave votes, though as Figures 4 and 5 show, were not significantly different from their average marginal effects in 2015 at any level of the Leave vote. This suggests that in 2017, despite the Leave vote improving model fit, there was little evidence of any change in how the Leave vote moderated the effectiveness of the parties’ campaigns as predicted by
Figure 3 illustrates the patterns found in the 2019 election. Here, we observe —as predicted—the effects of Brexit on the parties’ campaigns. Conservative campaigns were now more effective in seats with a higher Leave vote—a reversal of the patterns observed in the 2015 and 2017 campaigns. By way of contrast, Labour’s campaigns were again less successful in seats with higher Leave votes and more effective in Remain areas, with the difference between the two parties’ campaigns being statistically significant. However, as Figure 5 illustrates, the impact of the Leave Vote on Labour’s campaigns was not substantially different from the previous two elections.
Overall, we can observe the following: Conservative campaigns went from being slightly more effective in Remain areas before the referendum to being clearly more effective in Leave areas by 2019. By way of contrast, while Labour’s campaigns were more effective in Remain seats in 2019 as predicted, the impact of the Leave vote on Labour’s campaign effectiveness did not change significantly over the three elections. Thus, while Table 1 shows that the effects of the Leave vote were already helping to explain variation in overall effectiveness of the parties’ campaigns, the substantive effects occurred after the referendum. Critically, however, the substantive effect did not occur until 2019.
To summarize, we therefore find broad support for our hypotheses in respect of electoral shocks.
Assessing overall campaign effects
Overall average marginal effects of campaigns (%).
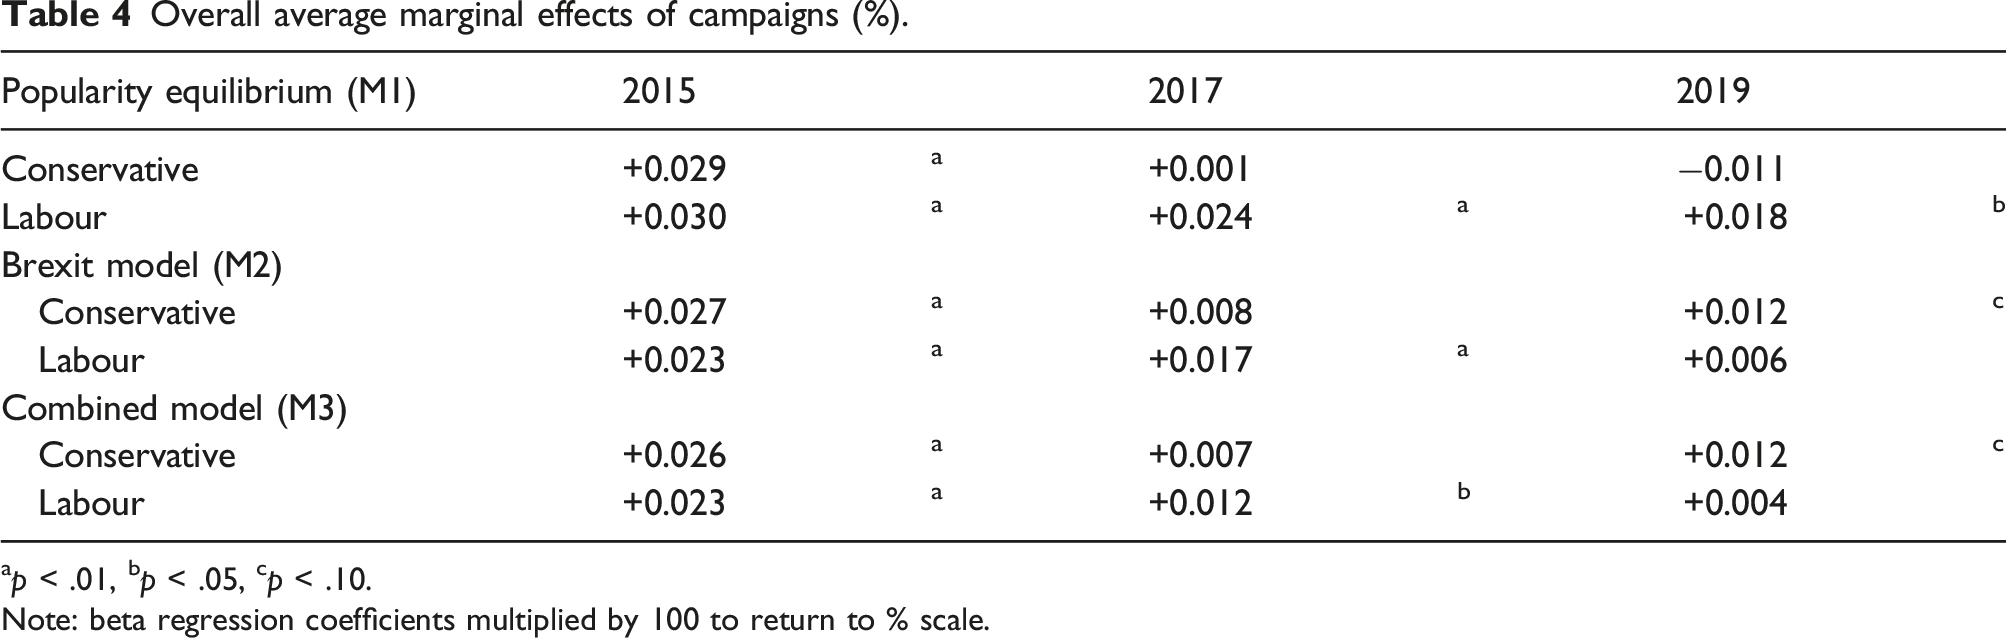
ap < .01, bp < .05, cp < .10.
Note: beta regression coefficients multiplied by 100 to return to % scale.
As a further check, we assess whether the apparent exogeneity of the constituency Leave vote on campaign effectiveness is confirmed by examining the distribution of parties’ campaign intensity. It is well established that campaign intensity is not equally distributed across all districts or constituencies. The distribution is principally a function of electoral competition, local organisational resource and electoral context (Fisher, 2000; Fisher et al., 2006; Fisher et al, 2011, 2019; Fieldhouse et al., 2020a). In a period of electoral stability, these resource decisions are likely to (and generally do) lead to electoral payoffs, because parties have a good idea of their likely electoral impact, given the importance of prior levels of popularity in the conditioning of electoral effects. As Fieldhouse et al. (2020a: 538) show, the electoral impact of campaign intensity is subject to increasing marginal returns. That being so, parties should perform better electorally where they campaign more intensively. In this context, then – parties’ decisions about the distribution of resource will be an important aspect influencing the level of their electoral impact.
Distribution of campaign intensity by degree of electoral competition 2017 & 2019.
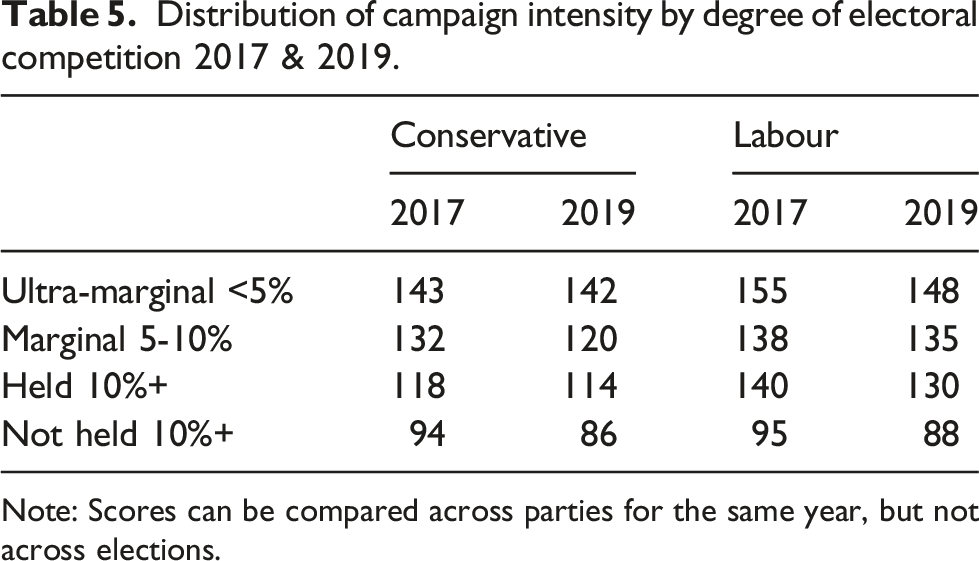
Note: Scores can be compared across parties for the same year, but not across elections.
As Table 5 shows, the distribution of campaign intensity by both the Conservative and Labour parties in both 2017 and 2019 was strongly driven by prior electoral performance, with the key drivers being the marginality of the seat based on the result of the previous election and whether or not the seat was already held by the party. Thus, we can observe that campaign intensity, was, on average, strongest in the most marginal seats (Ultra-Marginal <5%), and weakest where parties had little chance of election victory (Not Held 10%+). Such a distribution was consistent with previous elections, whereby the distribution of campaign effort was strongly related to the electoral status of seats (as measured by results at the previous election) and where this occurred, parties’ campaigns delivered electoral payoffs (Fisher et al., 2019). Table 5 illustrates, therefore that parties were continuing to distribute effort based on the principles of prior popularity.
Distribution of campaign intensity by Leave vote 2017 & 2019.
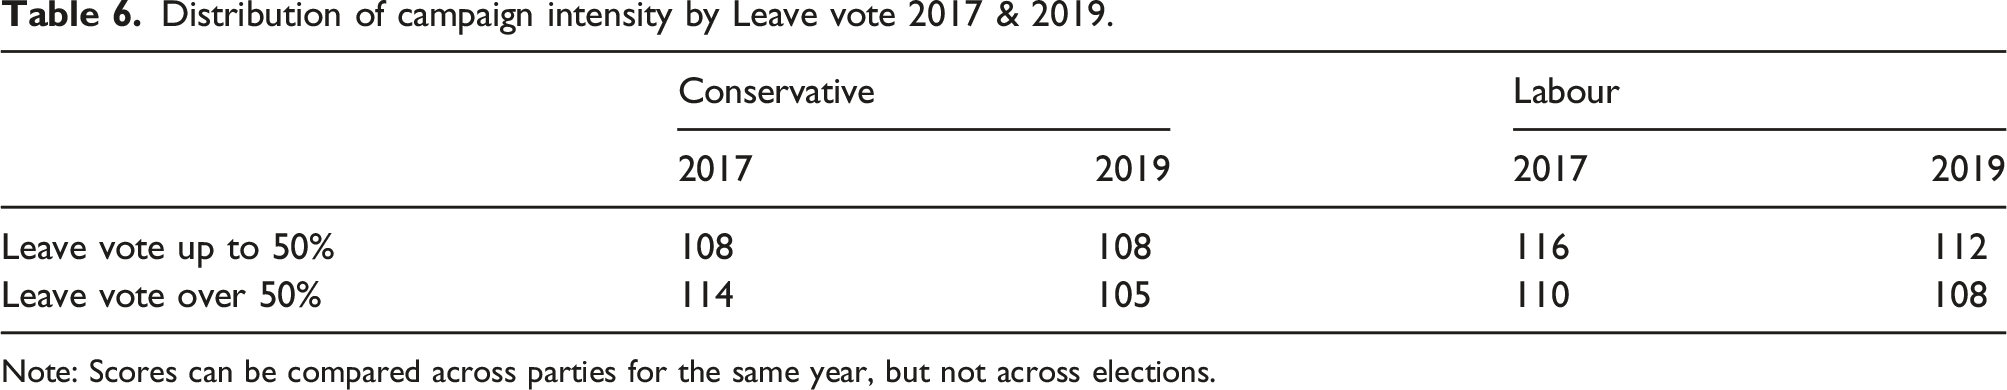
Note: Scores can be compared across parties for the same year, but not across elections.
Discussion & conclusions
The electoral impact of campaigns is strongly conditioned by context. In periods of relative electoral stability (albeit ones where there is electoral volatility), the most important contextual factor is underlying popularity, and the geography of campaign effectiveness can be described by popularity equilibrium (Fisher et al., 2019; Fieldhouse et al., 2020a). In such circumstances, parties’ campaigns are most electorally effective where they are neither too unpopular nor too popular. However, this article has sought to test the impact of an electoral shock on local campaign effectiveness and how local campaign effectiveness is affected by such a shock. The 2016 referendum on the UK’s membership of the European Union was one such shock. As Fieldhouse et al. (2020b) show, Brexit significantly increased the link between EU attitudes and voting for either the Conservatives or Labour. And, what is clear from this article is that the 2016 vote helped explain the electoral impact of parties’ campaigns over the two general elections held in the three and a half years following the referendum and to a limited extent in the election held the year beforehand. The fact that there were two general elections in such a short period of time allowed us to test not only whether the effects of the shock were apparent in the first election after the referendum, but whether the effects persisted two and half years later. And if they were there, had the effects faded, become more pronounced, or stayed the same? Our analysis suggests that while there is some evidence of a Brexit effect in 2017 the full effects of the shock in terms of the effectiveness of parties’ campaigns were delayed until the 2019 election.
The impact of the Leave vote is demonstrated by a series of factors. At the outset, we can observe that the incorporation of information about the Leave vote did indeed improve the prediction of parties’ share of the electorate and explanation of variation in the efficacy of parties’ campaigns in 2017 and 2019. In 2015, the impact was less evident and focussed principally on share of the electorate rather than campaign effectiveness.
First, when we examine the average marginal effects of parties’ campaigns, the impact of the constituency Leave vote on campaign effectiveness becomes apparent for both parties; though this is delayed until 2019. Only by 2019 can we observe an effect of the constituency Leave vote on the electoral effectiveness of campaigns that is differentiated by party. In 2017, despite the clear fact that the party was the first choice of Leave voters (Fieldhouse et al. 2020b) it appears that voters in Leave areas were not receptive to the Conservative campaign. This most likely reflects the shortcomings of Theresa May as a campaigner combined with the generally ineffective Conservative campaign messaging, particularly on the issue of Brexit (Bale and Webb, 2018). Certainly, the 2017 Conservative manifesto - while Eurosceptic – was not radically so (Volkens et al., 2020). By 2019 voters in Leave areas were much more receptive to Conservative campaigns with Boris Johnson (a leading ‘Brexiteer’) at the helm with a simple pro Brexit campaign slogan - Get Brexit Done. And, as we observed, the 2019 Conservative manifesto was comfortably the party’s most Eurosceptic in the post-war period (Volkens et al., 2020). As noted above, the impact of electoral shocks on electoral choice is conditional on the strategic response of parties, and this is equally true of its effect on campaign effectiveness. Although we had anticipated an impact of Leave voting in 2017 it seems the strategic response of the Conservatives in 2019 accounts for a much stronger impact on campaign effectiveness in 2019: that is Labour campaigns delivered stronger electoral payoffs in more Remain-leaning seats, while Conservative ones delivered stronger payoffs in more Leave-leaning seats. This marked a clear change from the pre-2016 position at the 2015 election. Second, we can observe that the electoral shock impacted negatively on campaign effects overall: that is, they were, on average, notably lower for both parties in the two elections following the 2016 referendum, than in the previous six elections. Third, the effect of the constituency Leave vote on campaign effectiveness was exogenous to the parties’ own efforts in terms of the distribution of campaign effort. Thus, there is evidence of the impact of the electoral shock on campaign effectiveness in both post referendum elections, but this was not fully realised until the second election in 2019.
The 2016 referendum evidently had a seismic effect on British politics and a very significant one on electoral behaviour and campaign effectiveness. What is unclear at this stage is whether the electoral shock of 2016 will fade in importance over time, or whether it forms the basis of a new alignment in politics, embedding the effect long after the issue itself loses relevance. If it does fade, it is not yet apparent how quickly this will occur, particularly as we have seen, the impact of 2016 was more fully felt in the election of 2019 rather than the one 2 years previously. Equally, the result may produce a new basis of party alignment (Fieldhouse et al. 2020c). Just as class became institutionalized into the fabric of politics and survived long after the original cleavage had withered away, so alignment may emerge around the 2016 result. Even if this occurs we should expect the popularity equilibrium model to return to normal as the Brexit vote will be baked into the previous vote shares of the major parties post-2019. Regardless of this, what is very clear is that electoral shocks do not just affect voters but, in the short run, they also disrupt the equilibrium of party campaigns, and change where those campaigns are most electorally effective.
Supplemental Material
Supplemental Material - Delayed shock? How Brexit conditioned campaign effects in British general elections
Supplemental Material for Delayed shock? How Brexit conditioned campaign effects in British general elections by Justin Fisher, Edward Fieldhouse and David Cutts in Party Politics
Footnotes
Declaration of Conflicting Interests
The author(s) declared no potential conflicts of interest with respect to the research, authorship, and/or publication of this article.
Funding
The author(s) disclosed receipt of the following financial support for the research, authorship, and/or publication of this article: This work was supported by the Economic and Social Research Council (Grant Numbers: ES/M007251/1; ES/R005052/1; ES/T015187/1).
Supplemental Material
Supplemental material for this article is available online.
Notes
Author biographies
References
Supplementary Material
Please find the following supplemental material available below.
For Open Access articles published under a Creative Commons License, all supplemental material carries the same license as the article it is associated with.
For non-Open Access articles published, all supplemental material carries a non-exclusive license, and permission requests for re-use of supplemental material or any part of supplemental material shall be sent directly to the copyright owner as specified in the copyright notice associated with the article.