
Abstract
Political parties in Africa and other developing countries are known to forge clientelist rather than programmatic ties to voters. Yet this does not mean that parties reward strong legislator-voter ties. In this paper, I argue for the case of Nigeria that lawmakers seeking to advance their political careers are incentivized to direct public resources to party members and senior party elites rather than serve their constituents in general. I draw on interviews with 8th National Assembly (2015–2019) lawmakers as well as quantitative data on MP re-election, targeted bills and motions, and the use of constituency development funds to demonstrate the predominance of narrow clientelism in Nigeria. I also place the Nigerian case in comparative perspective to argue that the extent to which legislators devote attention to constituents is likely to exist on a continuum, with the causes and consequences of this variation requiring further attention from scholars.
Introduction
African parties are known to show little ideological or programmatic differences, while mainly relying on clientelistic ties to voters (e.g. Erdmann, 2004; Wantchekon, 2003). This also has implications for legislators, who are not necessarily evaluated for their lawmaking and oversight roles in parliament. Constituency service, or the ability of lawmakers to bring development to their electorates holds greater weight for most voters (Adida et al., 2020; Barkan, 2009: 7–8; Bleck and van de Walle, 2019: 179–183). Then who do parties prefer as their Members of Parliament (MPs)?
The importance of clientelistic ties to voters for electoral success would appear to suggest that parties seek out local ‘big men’ (Driscoll, 2020), well-known in the community, wealthy, and with accountable ties to community members. Yet this logic appears to run counter to important empirical observations, the first being the high turnover rates of African MPs. In her study of legislative turnover in 12 African countries, Warren (2019: 81) finds re-election rates between 30% and 50%, whereas the average re-election rate in advanced industrial democracies has been estimated at around 65% (Gouglas et al., 2018; Matland and Studlar, 2004). While electoral volatility is regarded as the main reason for legislative turnover in advanced democracies, turnover of chief executives remains infrequent in Africa, and the president’s party usually retains a comfortable majority over time (Bleck and van de Walle, 2019: 126–127). Most MPs hence lose out in the party selection process, as also shown by Warren (2019: 82).
High turnover rates suggest that many MPs do not appear to be successful big men as they often do not represent their constituencies over multiple electoral cycles. Of course, MPs may not have it easy to please their constituents, even as members of the often more resourceful ruling party. They only have limited control over resources as lawmakers (Bleck and van de Walle, 2019: 180), reside in the capital away from their constituents for long periods, while developmental needs in their (sizable) constituencies may be too large to sufficiently please the electorate. As a consequence, MPs may quickly lose popularity, and be replaced by the party in order to preserve its electoral success.
Weghorst (2015: 140–148), for instance, has argued for the case of Tanzania that the ruling party pre-emptively removes incumbent officeholders that have been too absent in their constituencies, to protect its hold on power. In line with this, Collord (2021) shows in her case study of the cashew export levy in Tanzania’s parliament that MPs are sensitive to local pressures in producing regions. However, she also shows that the ruling party is strong enough to quell internal resistance due to local interests if need be. For the case of Cameroon, Morse (2021) has argued that the change to multiparty elections has caused pressures from voters for constituency service. He shows that the composition of parliament has changed over time with the ruling party increasingly preferring and renominating business leaders and civil servants. He theorizes that this may be because these groups perform better at directing resources to constituents. Evidence from these cases appears to suggest that, in general, parties do seek out candidates that serve local constituent interests, but many lawmakers may not measure up to the challenge, in turn leading to high turnover.
Further empirical evidence, however, indicates that MPs in a number of African countries do not actually devote strong attention to the needs of their constituents. Acheampong (2020) argues that only a small fraction of Ghanaians are actually familiar with their MP and that intra-party clientelism, targeted to those who are incorporated in relevant networks rather than the citizenry as a whole, determines re-election. This is in line with earlier findings by Ichino and Nathan (2012) on the importance of intra-party clientelism in winning electoral positions in Ghana. It also corresponds to findings from Ofosu (2019: 971), who shows that Ghanaian MPs in general only use about 25% of the constituency development funds (CDFs) allocated to them because strict spending procedures require a lot of efforts that MPs do not find rewarding enough.
Evidence from Uganda is similarly indicative of weak legislator-voter ties. Humphreys and Weinstein (2012) investigated the effect of informing voters about their MPs’ parliamentary performance (e.g. attendance, debate activity, use of constituency funds) through the presentation of scorecards. They found that survey respondents adjusted their voting intentions as expected when presented with the scorecards. However, there was only weak evidence that MPs who knew their parliamentary behaviour would be monitored, cared enough to actually improve their scores. Information campaigns on MPs’ performance also did not affect their eventual re-election. This may be because MP performance was not salient enough for voters and information not sufficiently widespread (see Adida et al., 2020)
In a related project, Grossman and colleagues (2020) investigate how citizens made use of the uSpeak initiative in the Ugandan parliament, which allowed citizens to directly send messages to their MPs. They find that uptake was low and relate this to the low responsiveness by MPs. System evidence indicated that many MPs did not respond to citizen messages, and the majority did not read many (or any) of the messages sent. MPs apparently did not deem it important to cater to the interests of their constituents.
The foregoing demonstrates that different forms of clientelism can be used by lawmakers, and that the relevance of each for political careers may differ across settings. Importantly, all these forms of clientelism can in turn be distinguished from public policy or programmatic policies, which focus on national economic growth, health sector reform etc. (e.g. Wantchekon, 2003: 409). Bussel (2019) distinguishes between noncontingent ‘constituency service’ and partisan distribution directed to party members. Relatedly, van de Walle (2007) distinguishes between mass and elite clientelism, with the former serving constituents in general, while the latter mainly concentrates resources in the hands of political elites.
I argue that partisan and elite clientelism prevail in the case of Nigeria, resulting in limited efforts for constituency service and weak legislator-voter ties. In line with findings on Ghana (Acheampong, 2020; Ichino and Nathan, 2012), this happens regardless of electoral configurations such as Single Member Districts (SMDs) and primaries, which have been associated with more constituency-focused efforts in other contexts (e.g. Alemán, 2018; Bagashka and Clark, 2016; Crisp et al., 2004). As in the case of Botswana (Warren, 2019: 113–155), high-level elite interests remain protected regardless of the potential democratizing effects of primaries.
My argument is based on both qualitative and quantitative evidence. First, I rely on secondary sources and interviews with Nigerian 8th National Assembly (2015–2019) MPs to demonstrate that resources are important for party nomination, but generally not used for the purpose of constituency service. This is followed by quantitative analyses of targeted bills and motions, as well as the use of constituency development funds and how they influence MPs’ re-election. These demonstrate that MPs are not rewarded for targeted legislative efforts, while they only devote minimal efforts to building local infrastructure. Rather than that high turnover rates can be explained by the difficulties ‘willing but unable’ MPs face in serving their constituents, I explain turnover as the result of a purposeful elite strategy to encourage rotation and prevent challengers from arising, as well as an information gap with regard to the resources that are needed to win the candidacy.
It is important to note that while Nigeria shows important similarities to the cases of Ghana and Uganda, it may still be a more extreme case of narrow clientelism. As shown by the most recent Afrobarometer round, distrust towards the National Assembly in Nigeria runs exceptionally high in contrast to the other cases discussed (see Figure 1). The trust question may be a only a rough proxy for how lawmakers engage with their constituents in general and can also be influenced by general government performance. Nevertheless, the degree to which lawmakers serve constituents is most likely to exist on a continuum, the causes and consequences of which warrant further investigation.
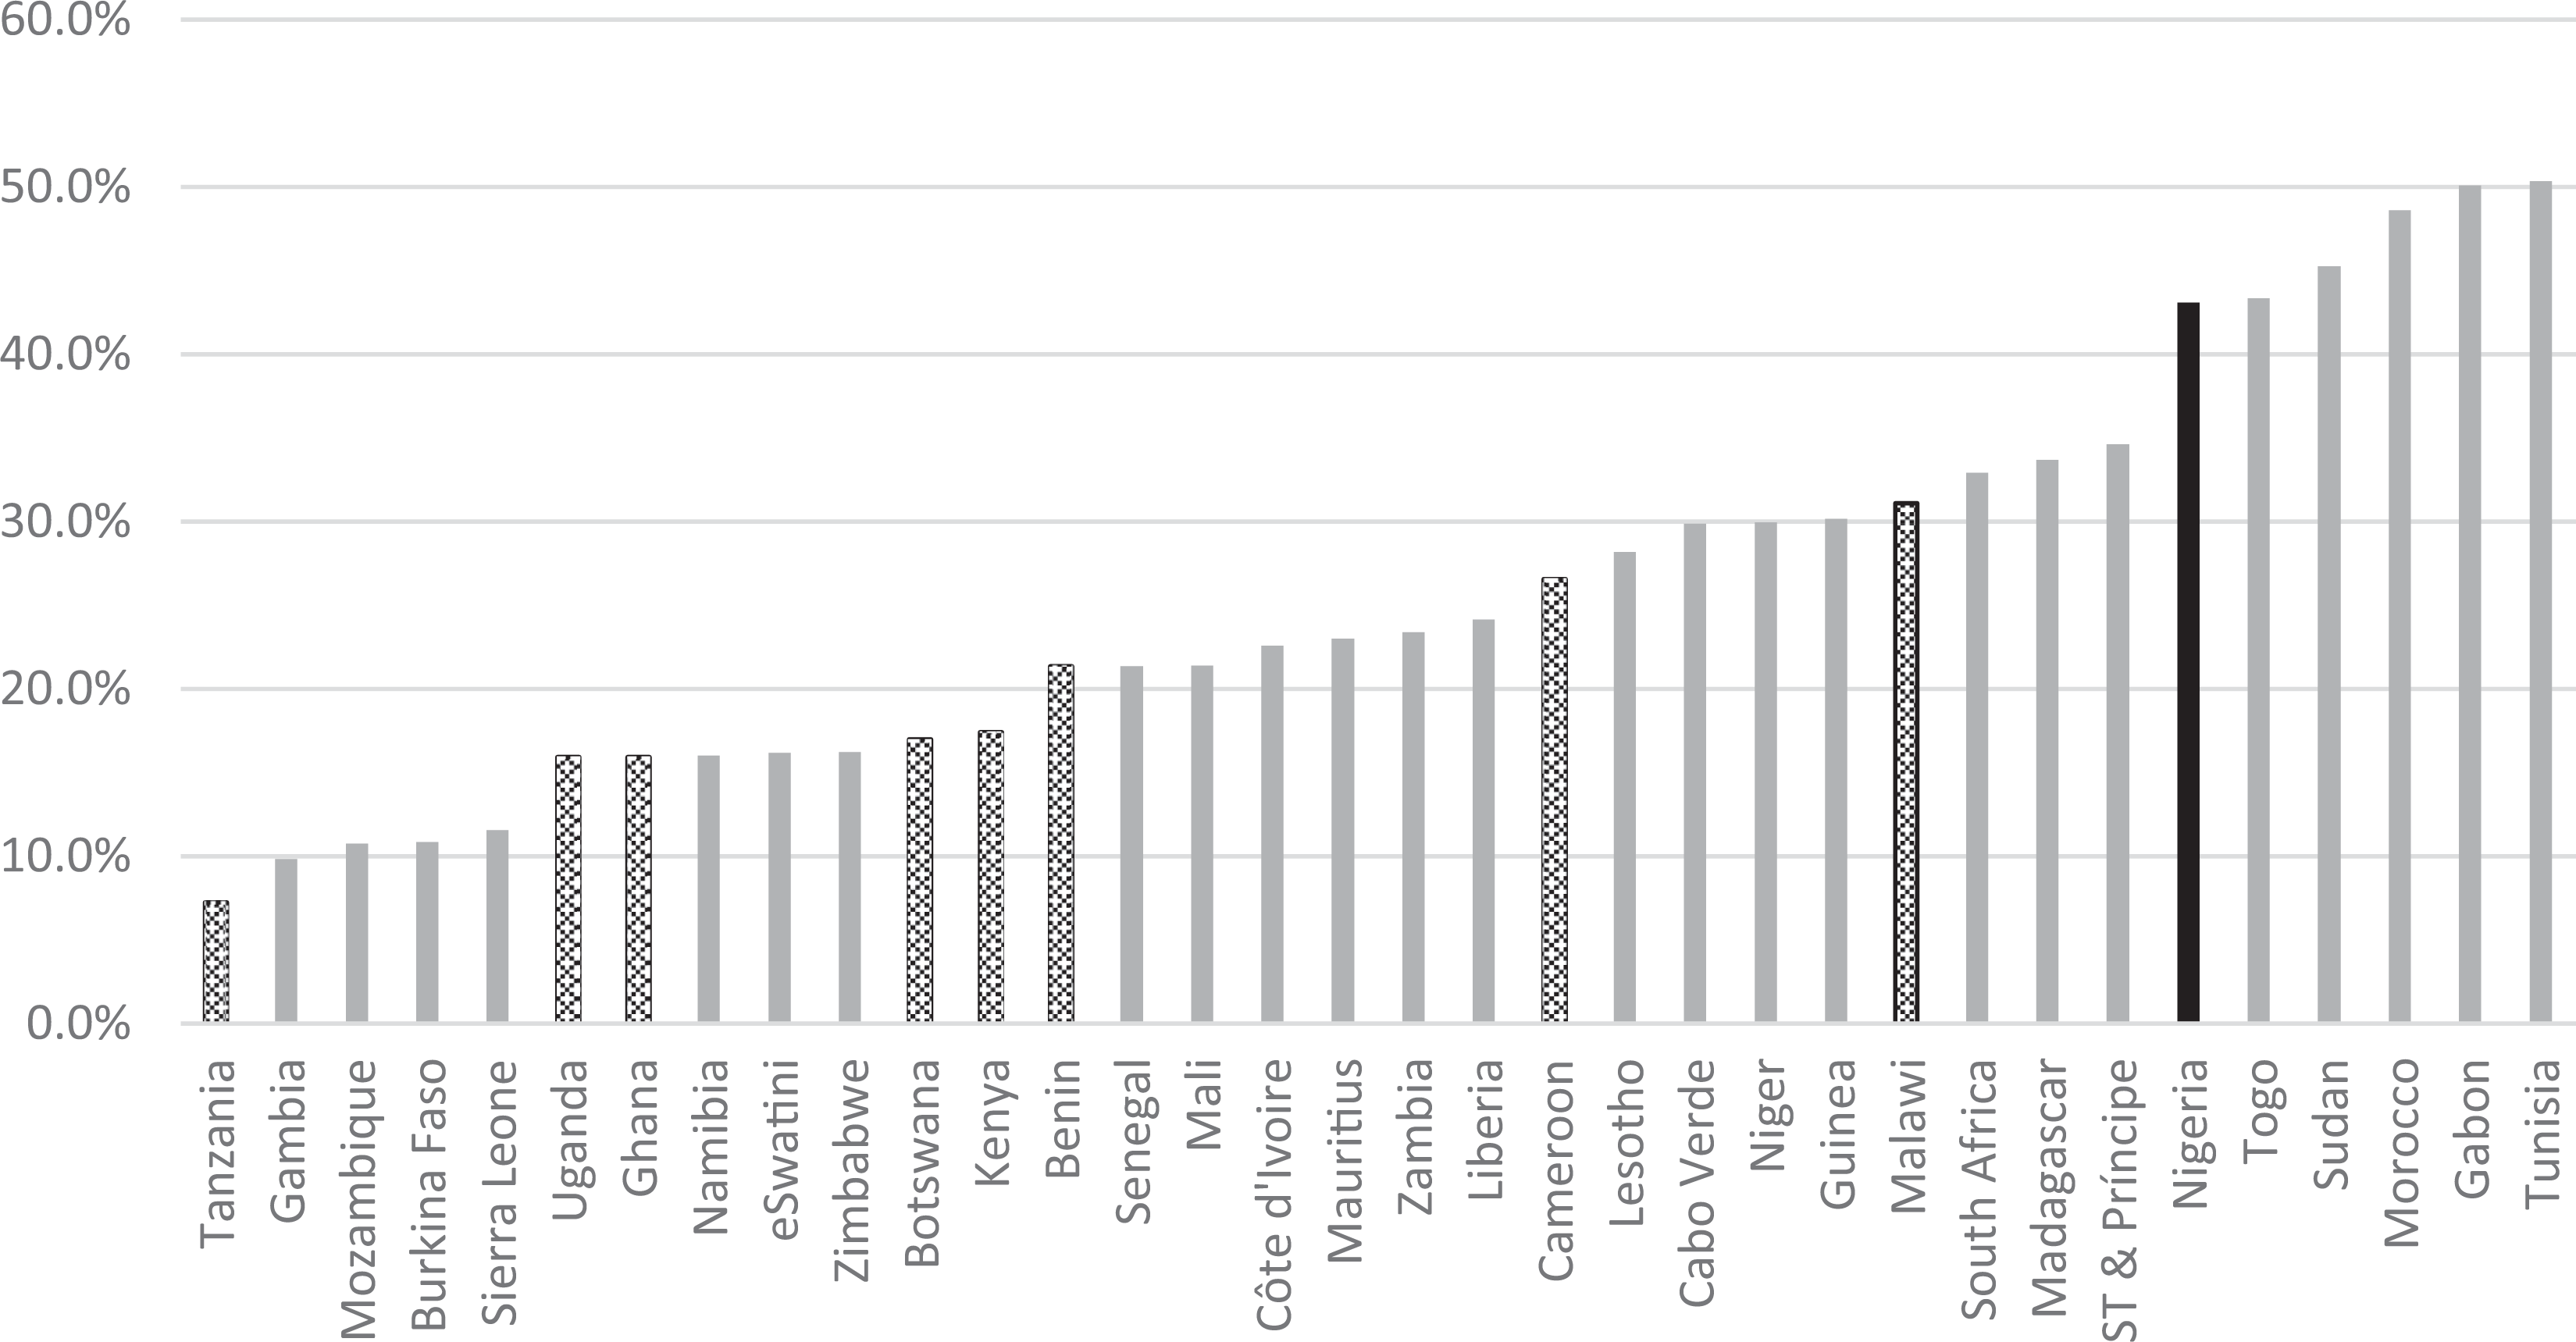
Percentage of citizens who trust parliament ‘Not at All’. Note: Afrobarometer Round 7 data, combined weights applied. Case of Nigeria indicated in black, other cases mentioned in the paper indicated with dotted bars.
The Nigerian context
Since the transition from military rule to multiparty democracy in 1999, Nigeria has held six presidential elections and six concurrent National Assembly elections. The Peoples Democratic Party (PDP) held the presidency and majority in parliament until 2015, when the first lawful turnover of power since independence took place with the electoral victory of the All Progressives Congress (APC). The APC brought together several opposition parties and was also able to tap into internal PDP factionalism to bring over key stalwarts from that party (LeVan, 2019: 57–66; Lewis and Kew, 2019). Because of Nigeria’s ethnic party ban, both parties are broad-based inter-ethnic coalitions, although support for the PDP is largely centred in the South-East and Niger Delta region, while the APC is stronger in the South-West and the North. The APC and PDP are now the dominant parties at the federal, state, and local levels. Regardless of turnover, the country remains categorized as ‘partly free’ by Freedom House (2020).
Members of the federal parliament, the National Assembly (NASS), are elected in SMDs. For the 360 members of the House, these are the federal constituencies, for the 109 Senators, these are the senatorial districts. Nigeria’s 36 states each elect 3 senators, while the Federal Capital Territory (FCT) of Abuja elects 1. Representatives are elected based on population numbers with the largest states electing 24 members (Kano and Lagos), and the smallest only 5 (Bayelsa and Nassarawa). The FCT elects 2 House members. At the subnational level, each of the 36 states of Nigeria elects a House of Assembly.
The focus of this study lies on the federal level, which has substantial spending power and policy prerogatives. The federal level retains around 50% of total revenue (Suberu, 2001: 45) and is responsible for important development sectors such as education, health, and road infrastructure, concurrent with the state governments. Furthermore, while state lawmakers also make use of constituency development funds, these projects are more institutionalized at the federal level (Orimogunje, 2015). Weak legislator-voter ties can hence not be explained by federal lawmakers not carrying responsibility for development issues relevant to the general citizenry.
The National Assembly cannot be regarded as a rubber-stamp parliament as it sponsors and approves a high number of private bills (Omotola, 2014), has vetoed the president on key legislation (Suberu, 2018), and – perhaps most famously – has rejected president Obasanjo’s third term bid in 2006. One major weakness of the Assembly has been its high turnover rate, leading to a loss of experience, and potentially hampering institutionalization (Polsby, 1968).
Figure 2 shows the proportion of lawmakers that were retained for each new assembly since the 1999–2003 legislature, called the 4th Assembly. Rates for the Senate and House are quite similar. Furthermore, differences between Nigeria’s main regions are limited (see Figure A1 in Appendix). Rates are clearly low, even when the ruling party remained the same. Interestingly, the victory of the APC in 2015 was actually accompanied by a higher re-election rate, due to PDP members switching their membership to the APC.
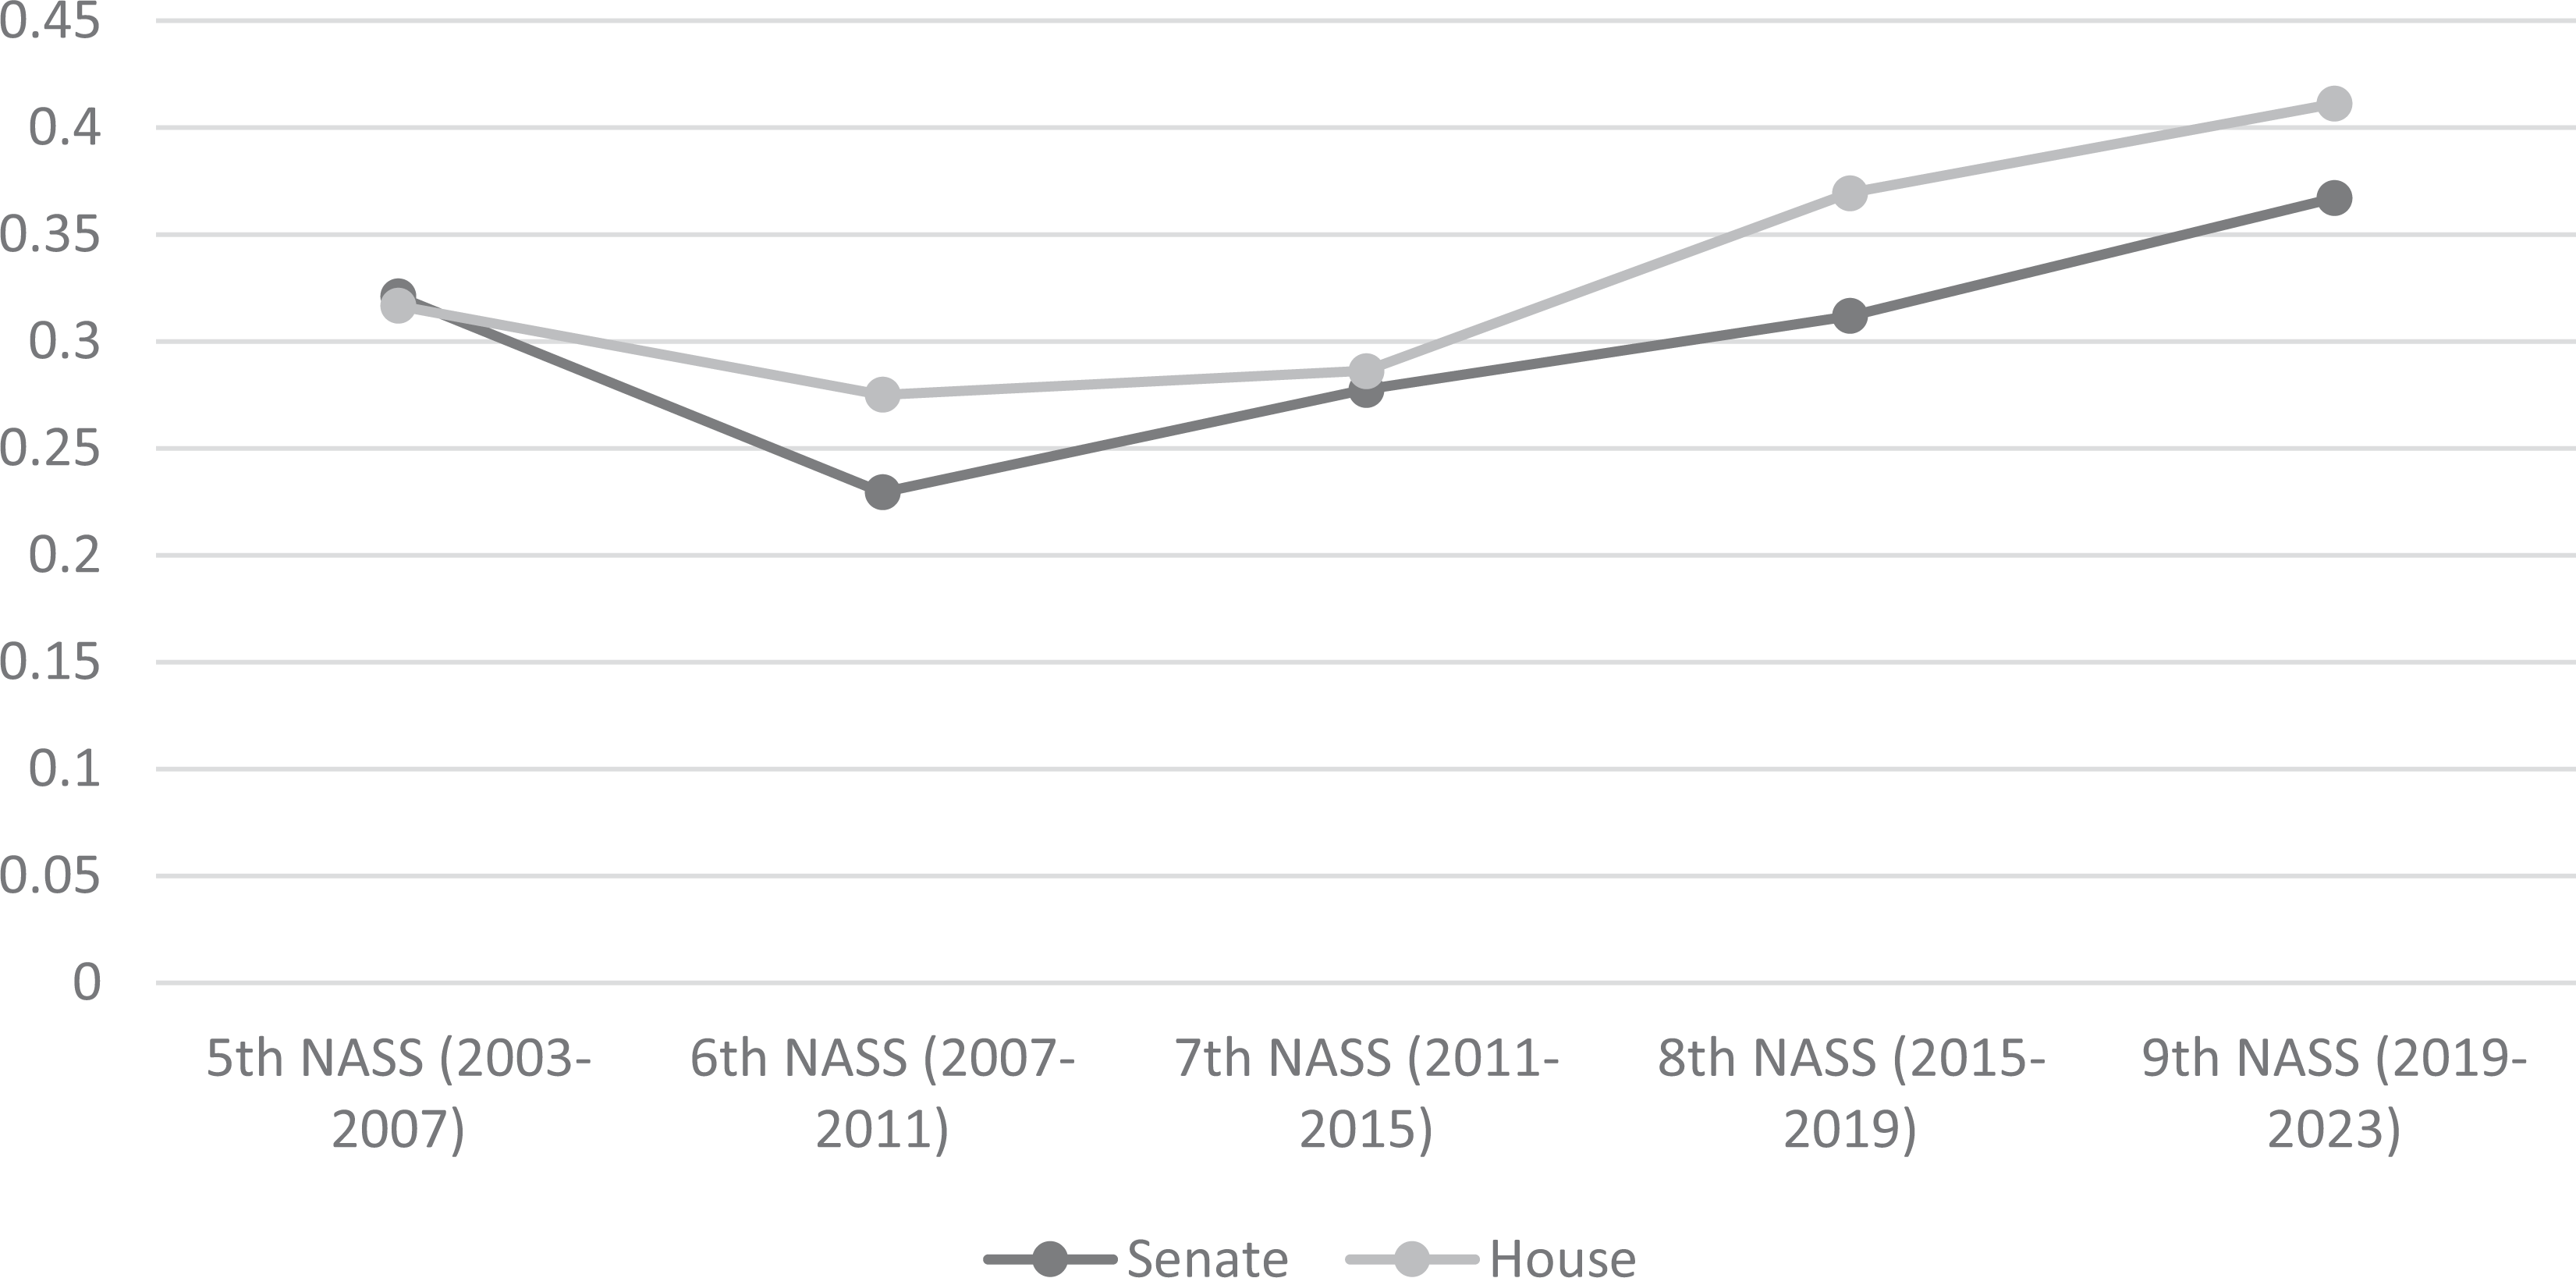
National Assembly re-election rates. Note: Based on lists of 4th to 7th Assembly MPs provided by Ungawa (2014) and author data. Data from Ungawa does not take into account deaths and seat changes due to court cases. For comparability, author data does not take into account deaths, and uses the sample of MPs who first held a constituency seat.
In 2019, about 40% of MPs were re-elected, yet the APC retained its parliamentary majority with about 60% of the seats. The PDP as the largest opposition party was also able to retain most of its seats. In line with other African countries, the largest hurdle for MPs is hence found at the party selection level. For both the APC and the PDP, this selection occurs through primaries. This procedure was taken over from the US system with the start of the Second Republic (1979–1983) and was re-introduced with Nigeria’s Fourth Republic.
Importantly, Nigerian federal lawmakers can be regarded as ‘re-election seekers’ (Mayhew, 1974). Only 15% of 8th NASS lawmakers did not seek to be re-elected to the same or another position (see below). This means that the actions they (do not) undertake can be regarded as important for advancing their political careers. In the following section, I discuss the importance of elite and intra-party clientelism in these endeavours by drawing on secondary sources as well as data from interviews conducted with legislators and party activists in Abuja and Lagos during several visits between 2017 and 2019. 1
MP resources and party selection
In line with the general observation that parties largely determine MPs’ (re-)election in Africa (Warren, 2019: 81–82), interviewees strongly stress the importance of the party in the electoral process: ‘;Political parties are important. 80–85% vote for the party, whether they like you or not’ (MP A, APC, Abuja, November–December 2017); ‘A party makes winning an election easier, because they have the structures. No matter how popular you are, if you have a weak party it has no access to these things while you need these ingredients’ (MP B, PDP, Abuja, November–December 2017); ‘Getting the party ticket is crucial. It’s the battleground of the primaries, once you win these, you are likely to win the elections’ (MP C, PDP, Abuja, November–December 2017); ‘After the Assembly candidates get the ticket, they are not campaigning their own campaign, the party steps in’ (APC member, Lagos, January 2019).
The importance of gaining the party ticket of course raises attention to the factors that help an aspirant get past this hurdle. Clearly, resources are a key factor in this process: ‘People are under pressure, in politics you need three things: 1) money 2) money 3) money. People now in the run-up to elections are out looking for livelihood’. (MP D, APC Abuja, November–December 2017). Yet who are the beneficiaries of this clientelism?
Nigerian MPs have relatively good access to resources that could be used to help their constituents. First, Nigerian MPs have generous allowances (Kazeem, 2017). Part of these allowances are intended for lawmakers’ constituency offices: ‘I have built constituency offices with 100 staff responsible for education, health care, women etc. they collect complaints and receive people’. (MP D, APC, Abuja, May–June 2017). Lawmakers also make use of CDFs, or zonal intervention projects (Busari, 2018). 100 billion naira is included yearly in the federal government budget for these projects. Lawmakers are each entitled to a part of the funds, with more going to Senators and principal officers. The funds are used by nominating development projects, which are then executed by the responsible ministry, department or agency (MDA).
Similar projects are often also added by MPs to the general annual budget when it comes to the NASS for approval (BudgIT, 2018a). This strategy is referred to as ‘budget padding’. Finally, lawmakers may also use bills and motions to serve constituents. They may sponsor private bills to establish new federal institutions such as universities and medical centres in their constituencies: ‘In the third year they want to establish a federal institute in their constituency’ (Legal advisor, Abuja, August 2018). Motions can be used to bring problems of their constituents to the attention of the executive (e.g. bad roads, disease outbreaks).
The resources and instruments available to Nigerian lawmakers to serve constituents may well be larger than in other countries (Economist, 2013), yet this is not reflected in their popularity. After all, many reports have been written on how Nigerian MPs misuse these funds. Lawmakers serve themselves by diverting constituency development funds for private gain and by using their position in committees to direct inflated public procurement contracts to their own businesses and those of their allies, with little verification done on their execution (see e.g. Fashagba, 2009; Sahara Reporters, 2019; Suberu, 2018). This behaviour indicates that Nigerian MPs are not incentivized by their parties to serve their constituents.
The deviant case of the 8th NASS representative for the Mushin 1 federal constituency in Lagos state further supports the observation that most MPs have only weak personal ties to voters. Formerly a member of the APC, he lost the primaries, switched to a smaller party and won the 2015 elections: ‘People vote for the party, at least that used to be the case. People have voted for the individual last time. Someone was popular but did not get the party ticket, he switched to the Accord party and won while before Accord was not popular here’ (interview religious leader Mushin, Jan 2019). As the quote demonstrates, only few lawmakers can rely on their popularity among constituents to get re-elected without the help of the main party.
MPs remain incentivized to distribute resources, but these appear primarily targeted to a narrow audience of senior party elites and lower ranking party members. Intra-party contests cost substantial sums of money. Indeed, nomination forms themselves are already expensive. For the 2019 elections, the PDP was reported to ask 4 million naira for Senate positions and 1.5 million for House members (Vanguard, 2018). The respective prices for the APC were 8 million and 3.85 million naira. In line with findings by Ichino and Nathan (2012) in Ghana, the primaries themselves are associated with the distribution of money to party delegates (indirect primaries) and members (direct primaries): ‘With APC and PDP, people have to compete, lobby, and have funding to emerge as candidate’. (APC member, Lagos, January 2019); ‘Winning the primaries is very difficult. The individual candidate’s money is of key importance’. (MP E, APC, Abuja, November–December 2017). ‘The party delegates need to be paid, they distribute down to the ward level’ (PDP member, November–December 2017).
The strong monetary aspect of intra-party competition gives an advantage to wealthy candidates, but also allows senior elites to retain control over candidate selection processes. Many candidates receive support from wealthy elites, or ‘godfathers’ (e.g. Omotola, 2010). Part of the misuse of public funds is hence for private gain and compensation for personal costs incurred in the election campaign, but a substantial share is also used to repay godfathers. Another way senior elites retain control regardless of primaries is through prior vetting of candidates and the use of fraud and violence during primaries, which is widespread.
Nevertheless, it is also important to emphasize additional factors that influence re-selection chances. Not only the amount of resources may be important, but also the support from party leaders: ‘Support of the governor is also important, the governor is the owner of the party in the state’ (MP F, APC, Abuja, November–December 2017); ‘Governors control the political structures down to the wards. When you go to primaries, the governor is likely to dominate the process and you need his support’ (MP B, PDP, Abuja, November–December 2017).
Finally, informal norms may also determine candidate selection. Zoning regulations, in which candidacy is rotated between regional (and often ethnic) groups to promote power-sharing, also play a role: ‘For example, a senatorial district that exists out of five Local Government Areas and the position moves from one to the other. There is no top-down restriction of one or two terms, it depends on their local agreement. Sometimes there are disagreements and people still contest and say it is democratic’. (PDP National Organizing Secretariat, Abuja, July 2018).
As the quote reveals, zoning is not equally respected everywhere and lawmakers can still gain the electoral ticket if they have sufficient support. The turnover rates in Figure 2 could suggest a two-term drop with the start of the 6th Assembly, a feature that is potentially not found for the 8th Assembly given that the APC’s success in recruiting former PDP members was often related to opposition to zoning rules (LeVan, 2019: 57–66). Nevertheless, the drop is not very pronounced, indicating that zoning regulations are not necessarily key in explaining turnover.
A more general norm against staying in office may, however, also deter candidates from attempting to get re-elected: ‘The low probability of re-election is partly because of the money and zoning of positions, but also because of how politics are seen: once you had your turn, you had your turn’. (Political Scientist, Abuja, November–December 2017); ‘When you say you want to be re-elected, people will say “don’t be greedy”’. (MP B, PDP, Abuja, November–December 2017).
By drawing on qualitative evidence about resource distribution in the context of elections, this section has advanced the argument that parties incentivize narrow forms of clientelism focused on partisans and senior elites. In the following section, I provide further quantitative evidence by looking at lawmakers’ use of targeted bills and motions, as well as the implementation of zonal intervention projects.
Constituency service and MP re-(s)election
To determine the strength of MPs’ ties to constituents and the importance of these ties for political careers, it is necessary to first investigate how many MPs actually vie for re-election and the extent to which their vote shares depend on the party platform used. To do so I have manually collated a dataset of all lawmakers that sat in Nigeria’s 8th National Assembly (2015–2019). Second, I investigate the use of targeted bills and motions and whether they impact individual MP re-election. Finally, I analyse the use of constituency development funds in the run-up to elections. The latter is done only at the aggregate level because of the limitations of the available data.
Data limitations also apply to the electoral data used. Indeed, analysing election results in Nigeria is complex due to the use of fraud in both primary and official elections, as well as party switching. Fraud allegations may lead to court cases, which can lead to seat changes when they are won by challengers (see Figure 3). The analyses below attempt to take these factors into account as much as possible, yet a degree of measurement error with regard to the electoral results needs to be assumed.
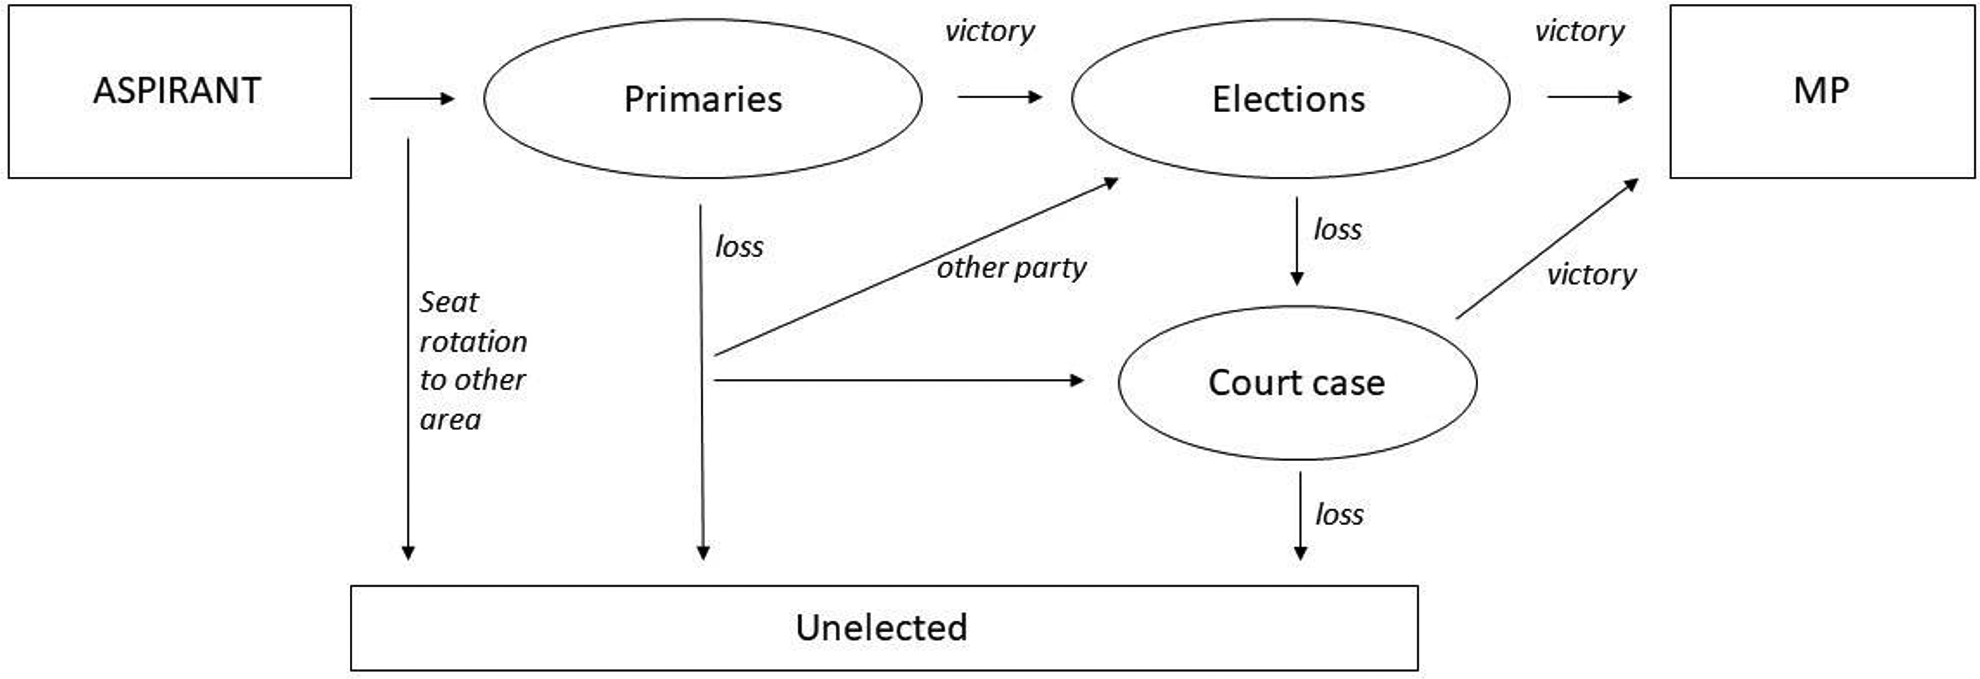
From aspirant to MP.
Re-election seekers and party dependence
The MP dataset records for each of the 493 surviving lawmakers of the 8th NASS (120 Senators and 373 Representatives) whether they were able to get re-elected in the 9th National Assembly (2019–2023). I include all MPs who held a seat during the 8th NASS, regardless of whether they lost the seat during this period because of court cases.
I record whether 8th NASS MPs pursued an additional term in the 9th NASS, whether they won their party primaries, and whether they won the official elections. I made use of the INEC candidate lists as well as the officially reported electoral results. For information on primaries I mainly relied on web searches. The MP dataset, auxiliary datasets (bills, motions, constituency funds), and syntax are available as supplementary data.
Of the 493 lawmakers, 370 (75%) pursued re-election to the same seat (see Table 1). Of the 123 that did not pursue re-election, 51 ran for another position (e.g. House members deciding to run for Senate). Of the other 72, some voiced their decision not to run again (e.g. because of local zoning arrangement), while for others, I did not find any evidence indicating they participated in the primaries. Hence, at least 85% of MPs sought an electoral position for the 2019 general elections.
Number of MPs at each step of the re-election process.
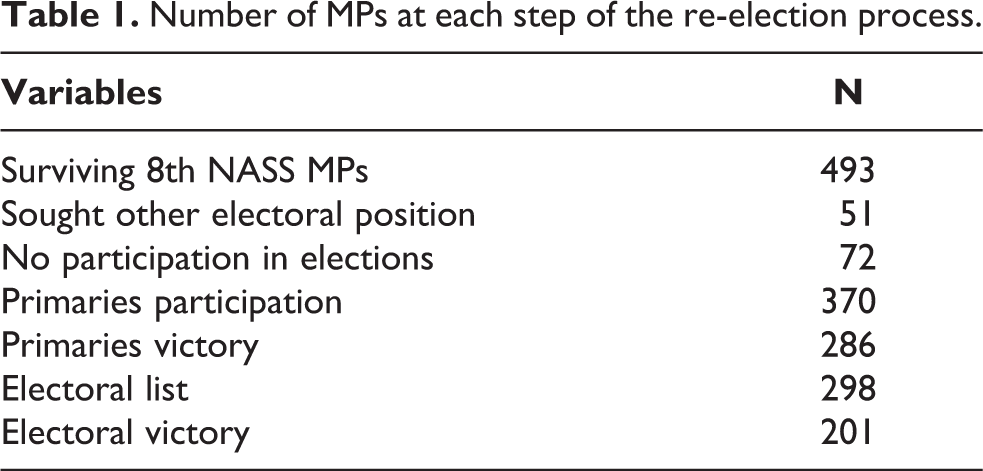
Of the 370 pursuing re-election, 286 won their party primaries, but 298 made it to the electoral list because some defected to smaller parties after losing the primaries to be able to run again. 201 (41% of all MPs) succeeded in re-gaining their seat at the 2019 polls. 2
As mentioned, this individual MP re-election rate is associated with a higher party re-election rate. To measure party re-election, I compare party seats at the start of each legislature. At the constituency level, we find that 380 of the 469 seats (81%) went to the same party. The majority of changes concerned switches from the APC to the PDP and vice versa. For the MPs that made it to the 2019 elections – and for which both the 2015 and 2019 electoral results were available – we find that MPs who switched parties in anticipation of (or after) not getting a good ticket were largely unable to retain or strengthen their 2015 vote share, and lost out (Figure 4). Indeed MPs’ 2019 vote share is largely determined by the previous vote share of the party they joined for the 2019 elections (Figure 5). This further confirms the importance of the party in securing re-election.
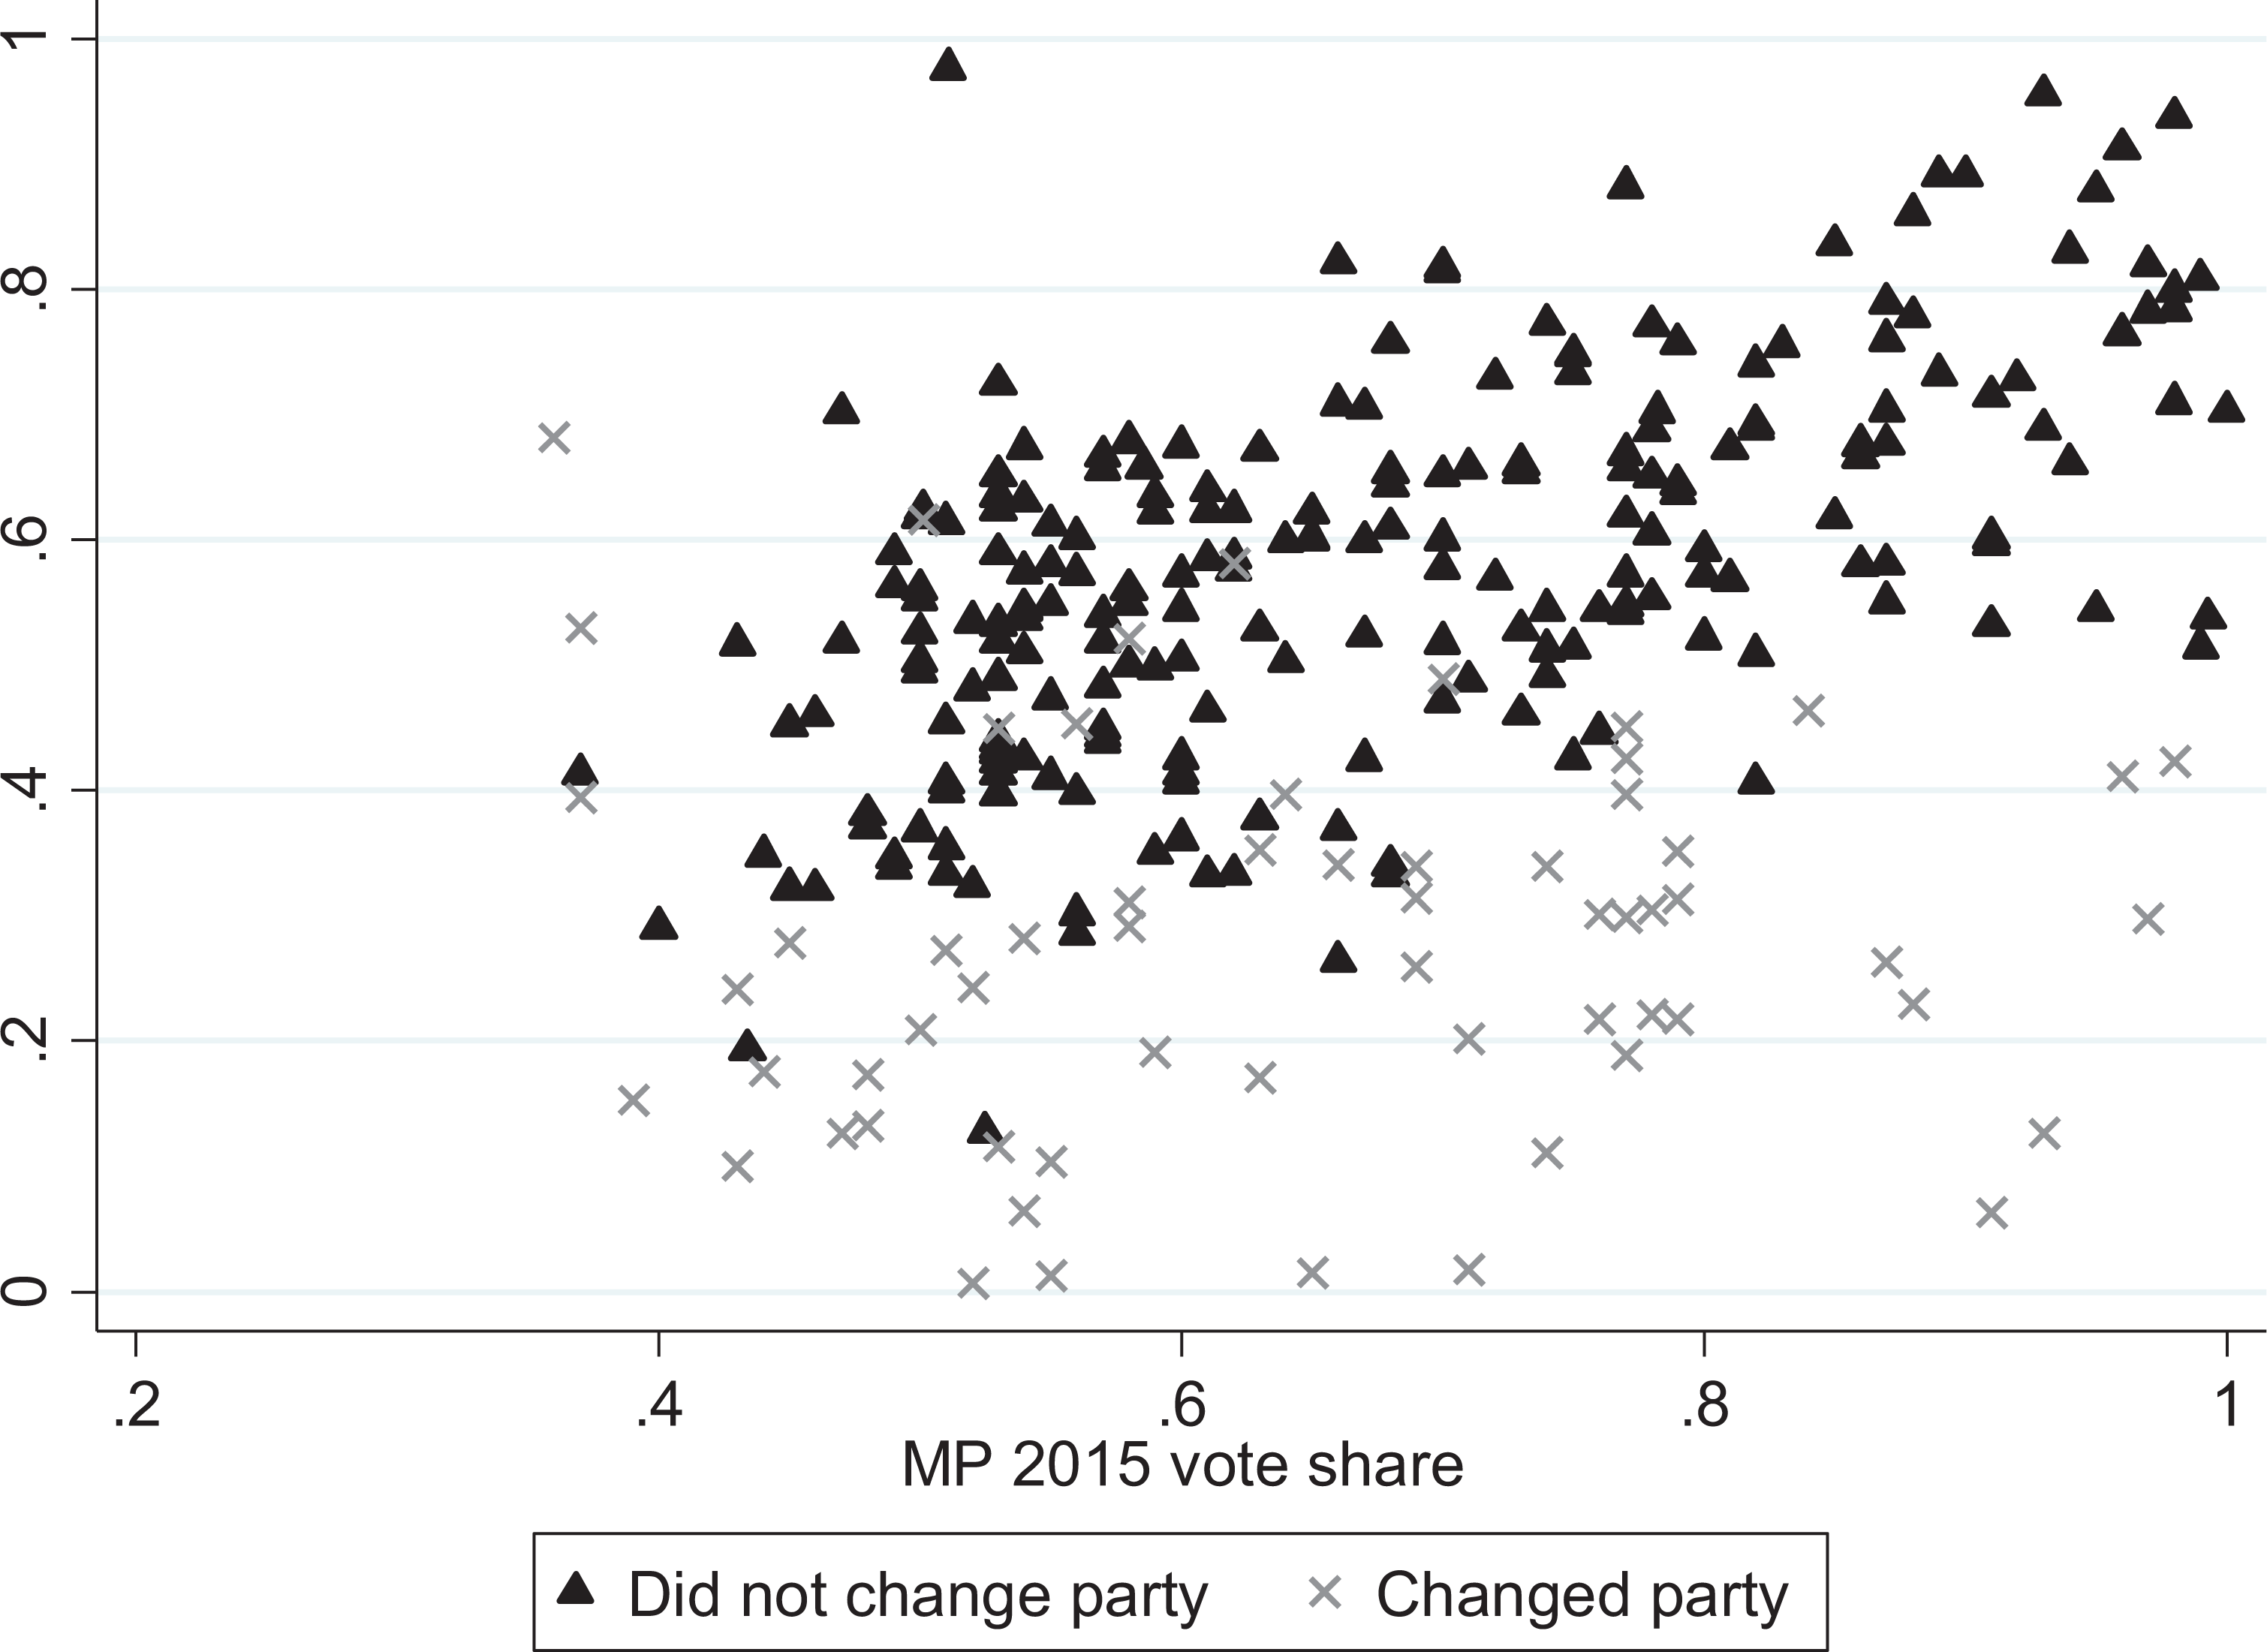
MPs 2019 vote share plotted against their 2015 vote share.
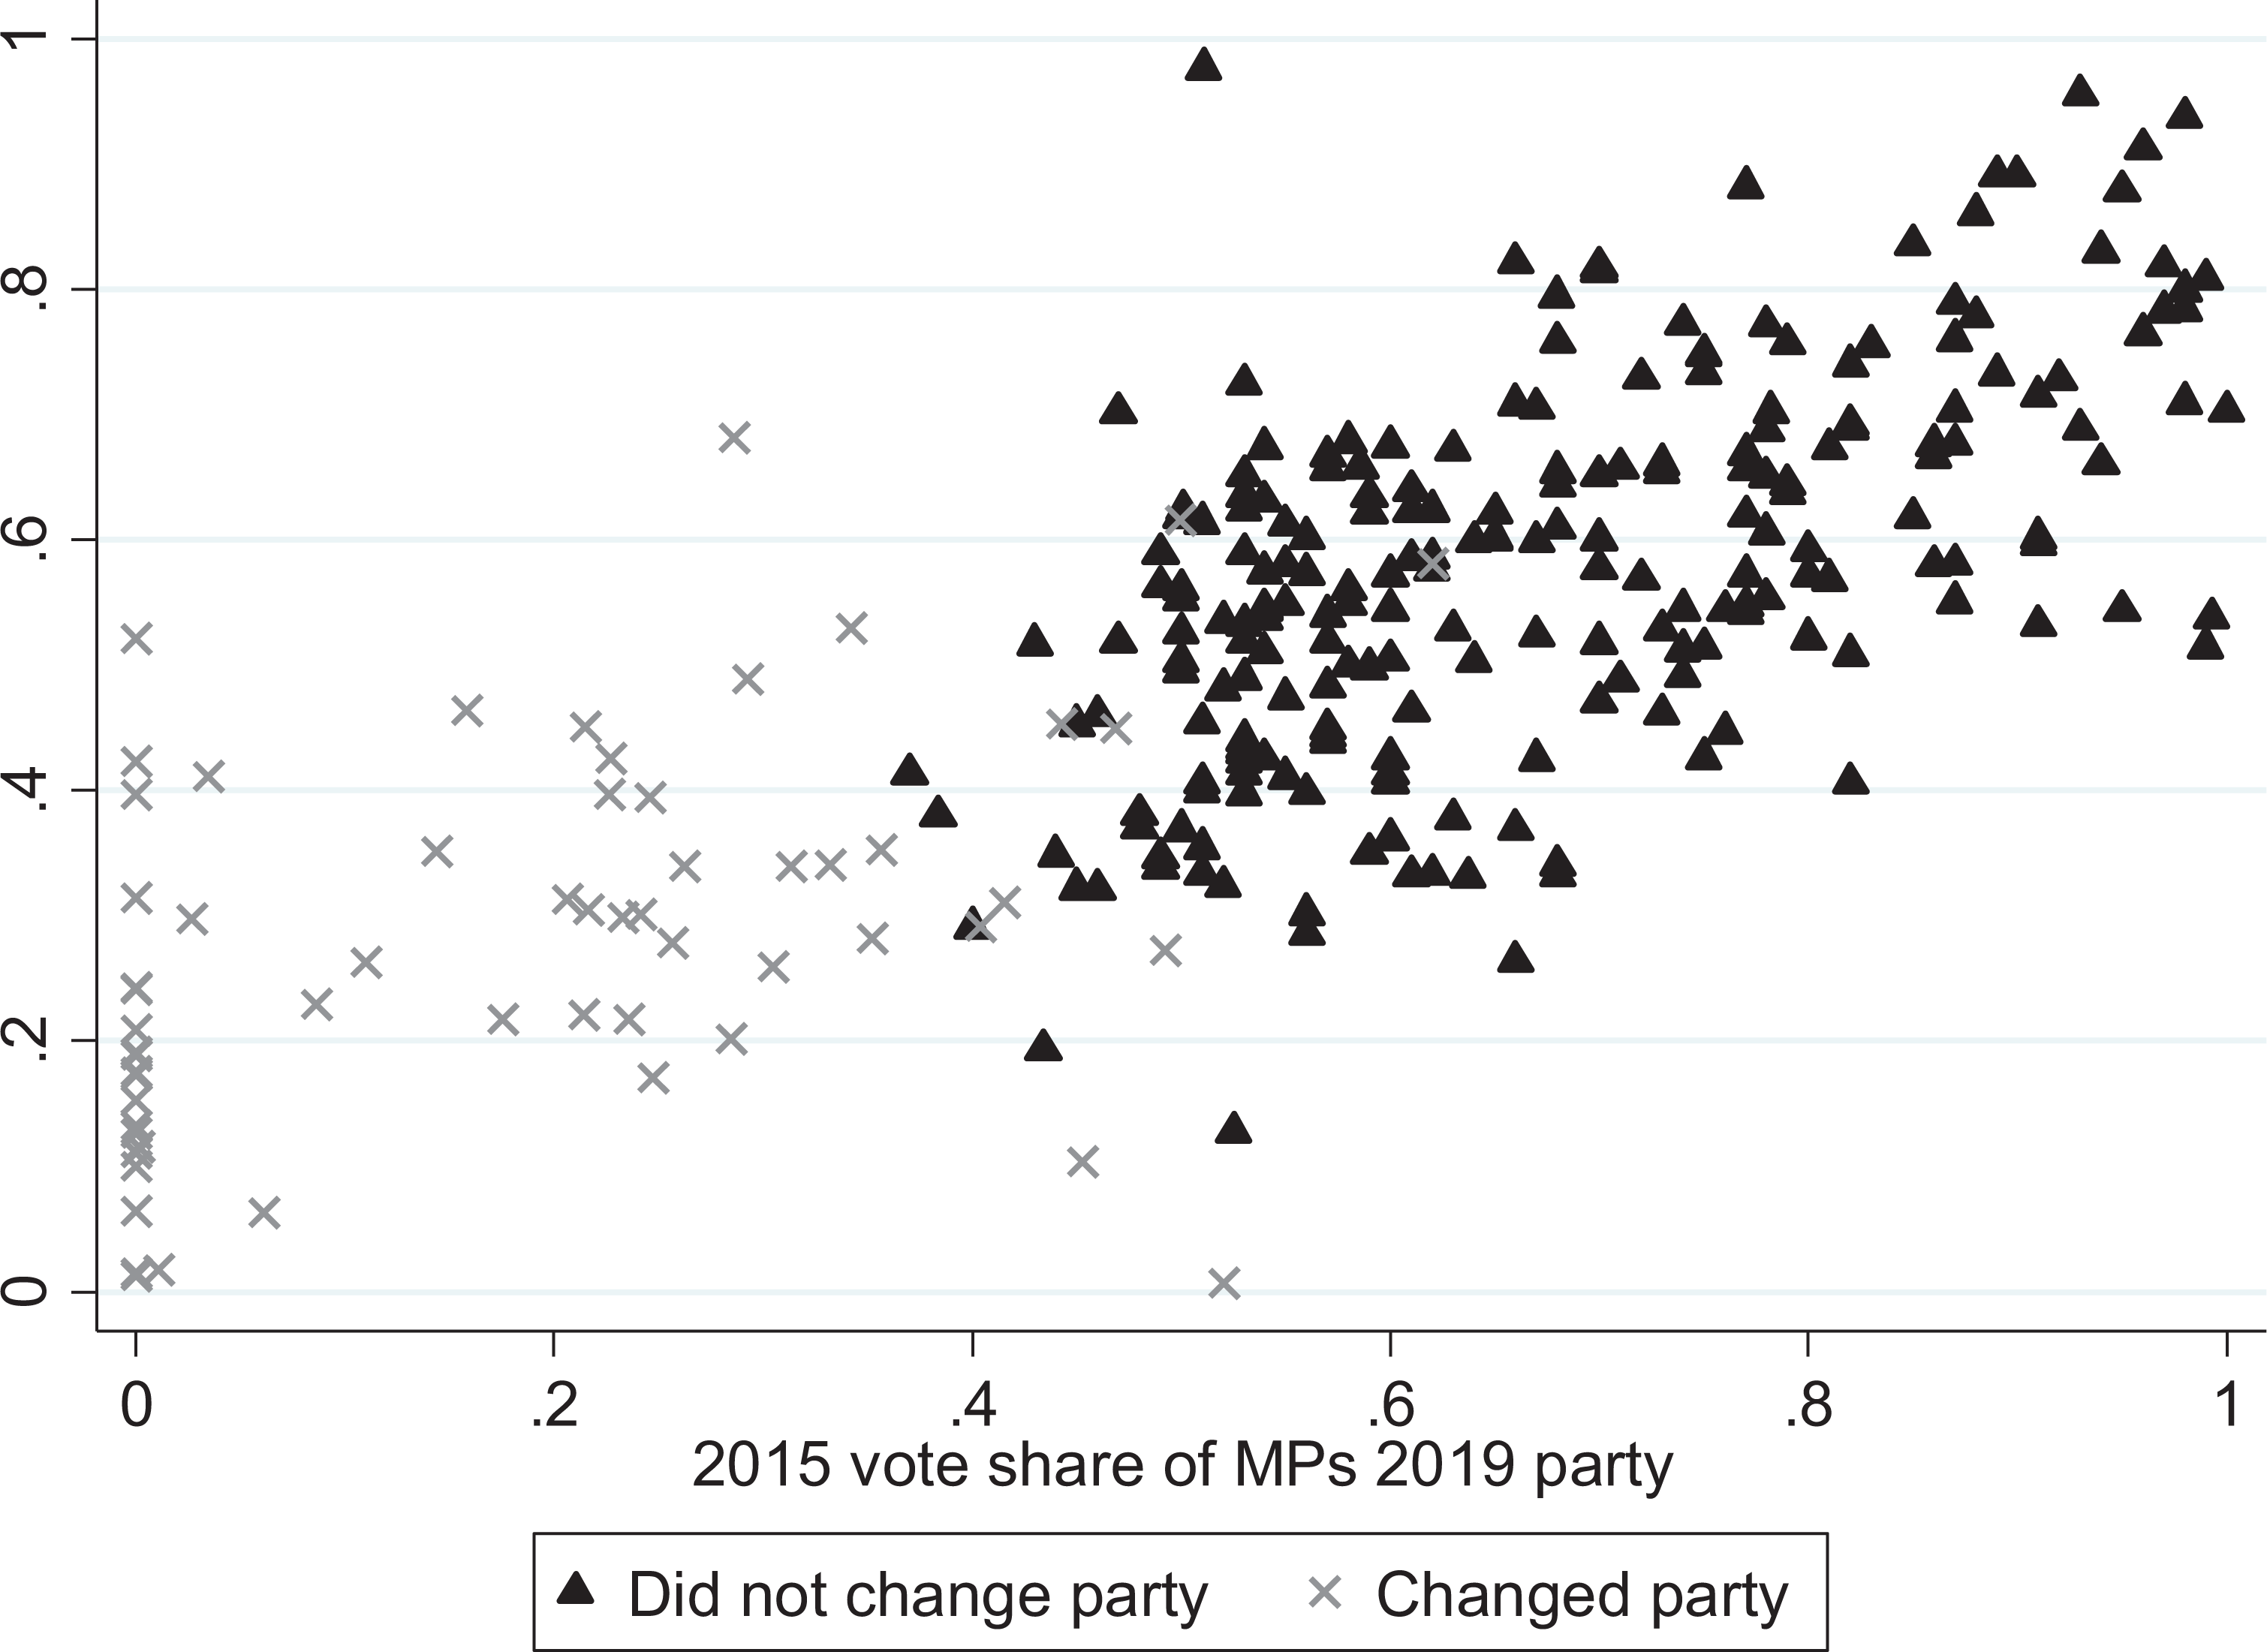
MPs 2019 vote share plotted against the 2015 vote share of their 2019 party. Note: Parties that did not produce a candidate in 2015 were given the value of 0%.
Targeted bills and motions
I first investigate the extent to which Nigerian MPs’ private bills and motions are targeted to their constituencies. The use of such targeted initiatives has been considered indicative of personal vote-seeking and the forging of legislator-voter ties (e.g. Alemán, 2018; Bagashka and Clark, 2016; Crisp et al., 2004). Information on bill sponsorship was drawn from the Policy and Legal Advocacy Centre (PLAC) bills tracking website, which has only started keeping records with the start of the 8th NASS. 3 Data on motion sponsorship was drawn from Votes & Proceedings and Order Papers available on the National Assembly website. 4 I only take into account substantive motions and exclude technical motions and motions announcing the death of societal figures.
I code bills as targeted when they aim to establish a new institution to serve MPs’ state. The FCT is counted as a separate ‘state’ and more than one state can be targeted by a specific bill (e.g. establishment of a North East Development Commission). 5 Motions are coded as targeted when they draw attention to a problem within MPs’ state(s). The state is chosen over the constituency itself because MPs do not often mention specific constituencies but rather highlight problems in wider areas of concern.
Figures 6 and 7 show the distribution of (targeted) private bill and motion sponsorship in Nigeria’s 8th Assembly’s House and Senate. 6 Overall, a high number of bills are sponsored. This is partly due to the limited hurdles for MPs to introduce bills to the floor as no prior permission from the party is needed. In line with differences in membership, more bills and motions are introduced in the House than in the Senate. For both chambers, the fourth year, when primaries and elections become MPs’ major concern, the introduction of new bills and motions declines sharply. Interestingly, the first year is also a highly active one, which may be surprising given high turnover rates and the incoming of inexperienced MPs. It has, however, become common practice for Assembly members to reintroduce leftover bills from the previous Assembly at the beginning of a new one. 25% of all private bills were passed in the 8th NASS.
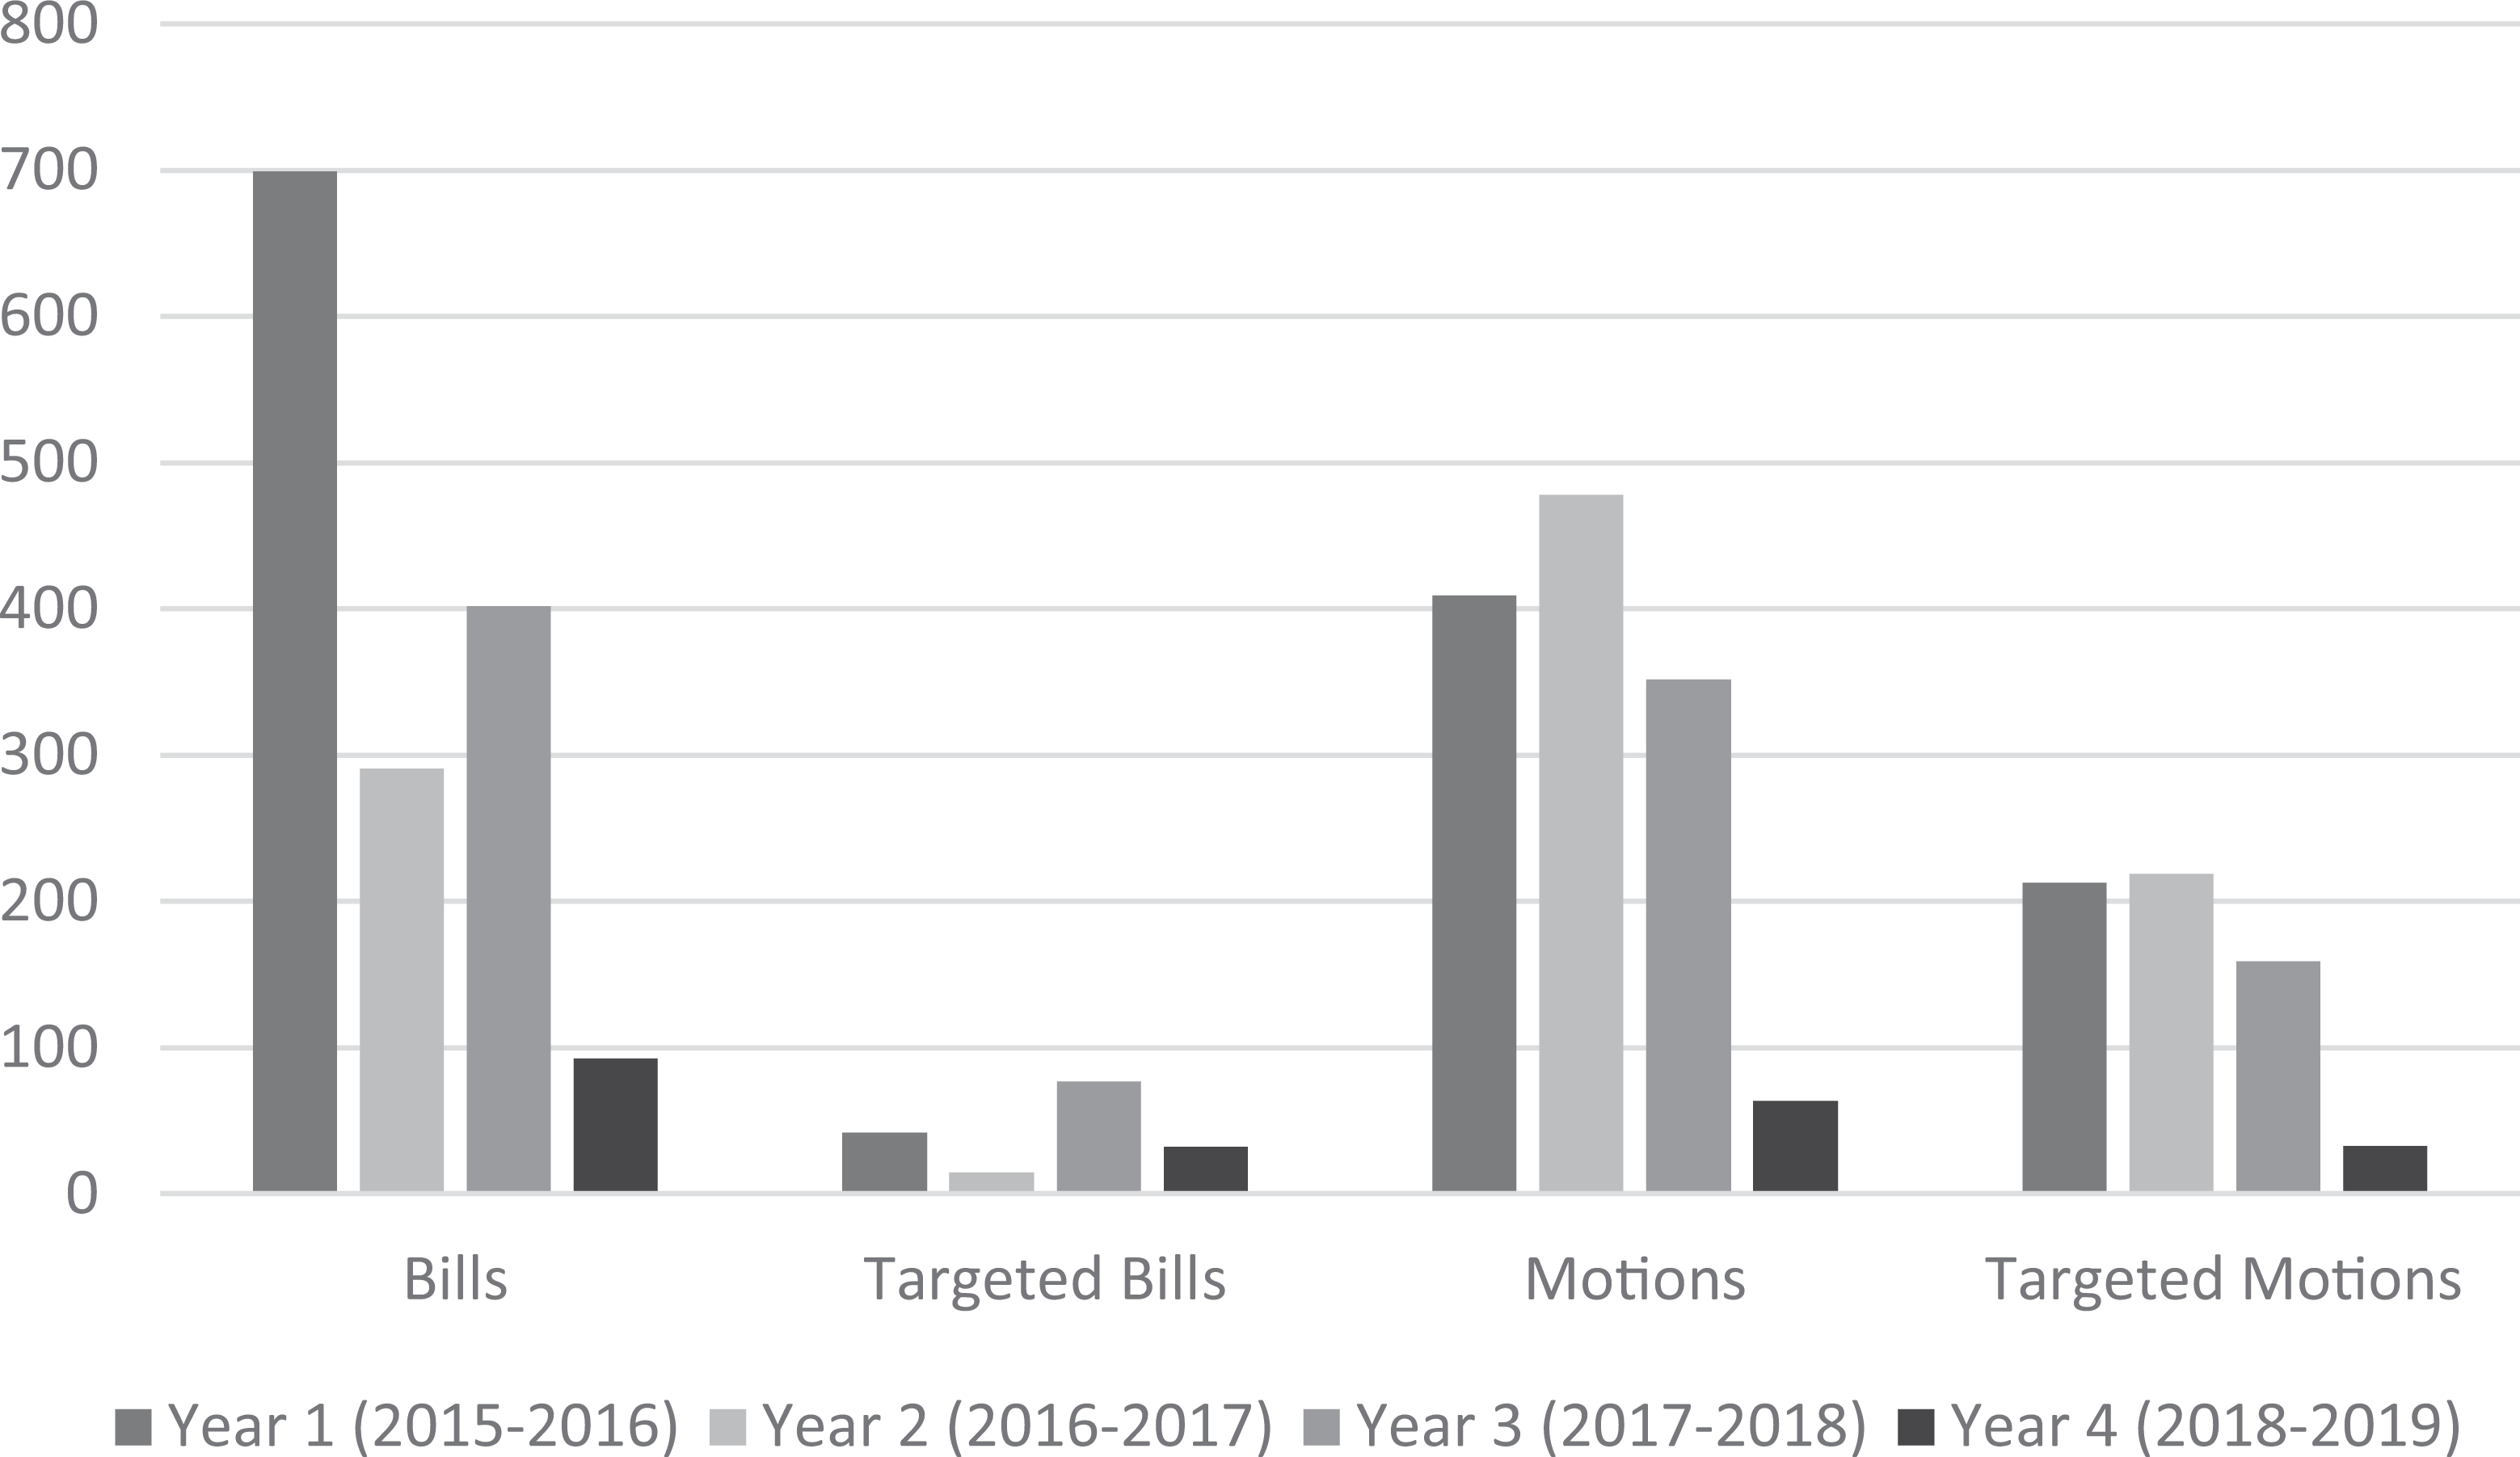
Introduction of bills and motions in Nigeria’s 8th House.
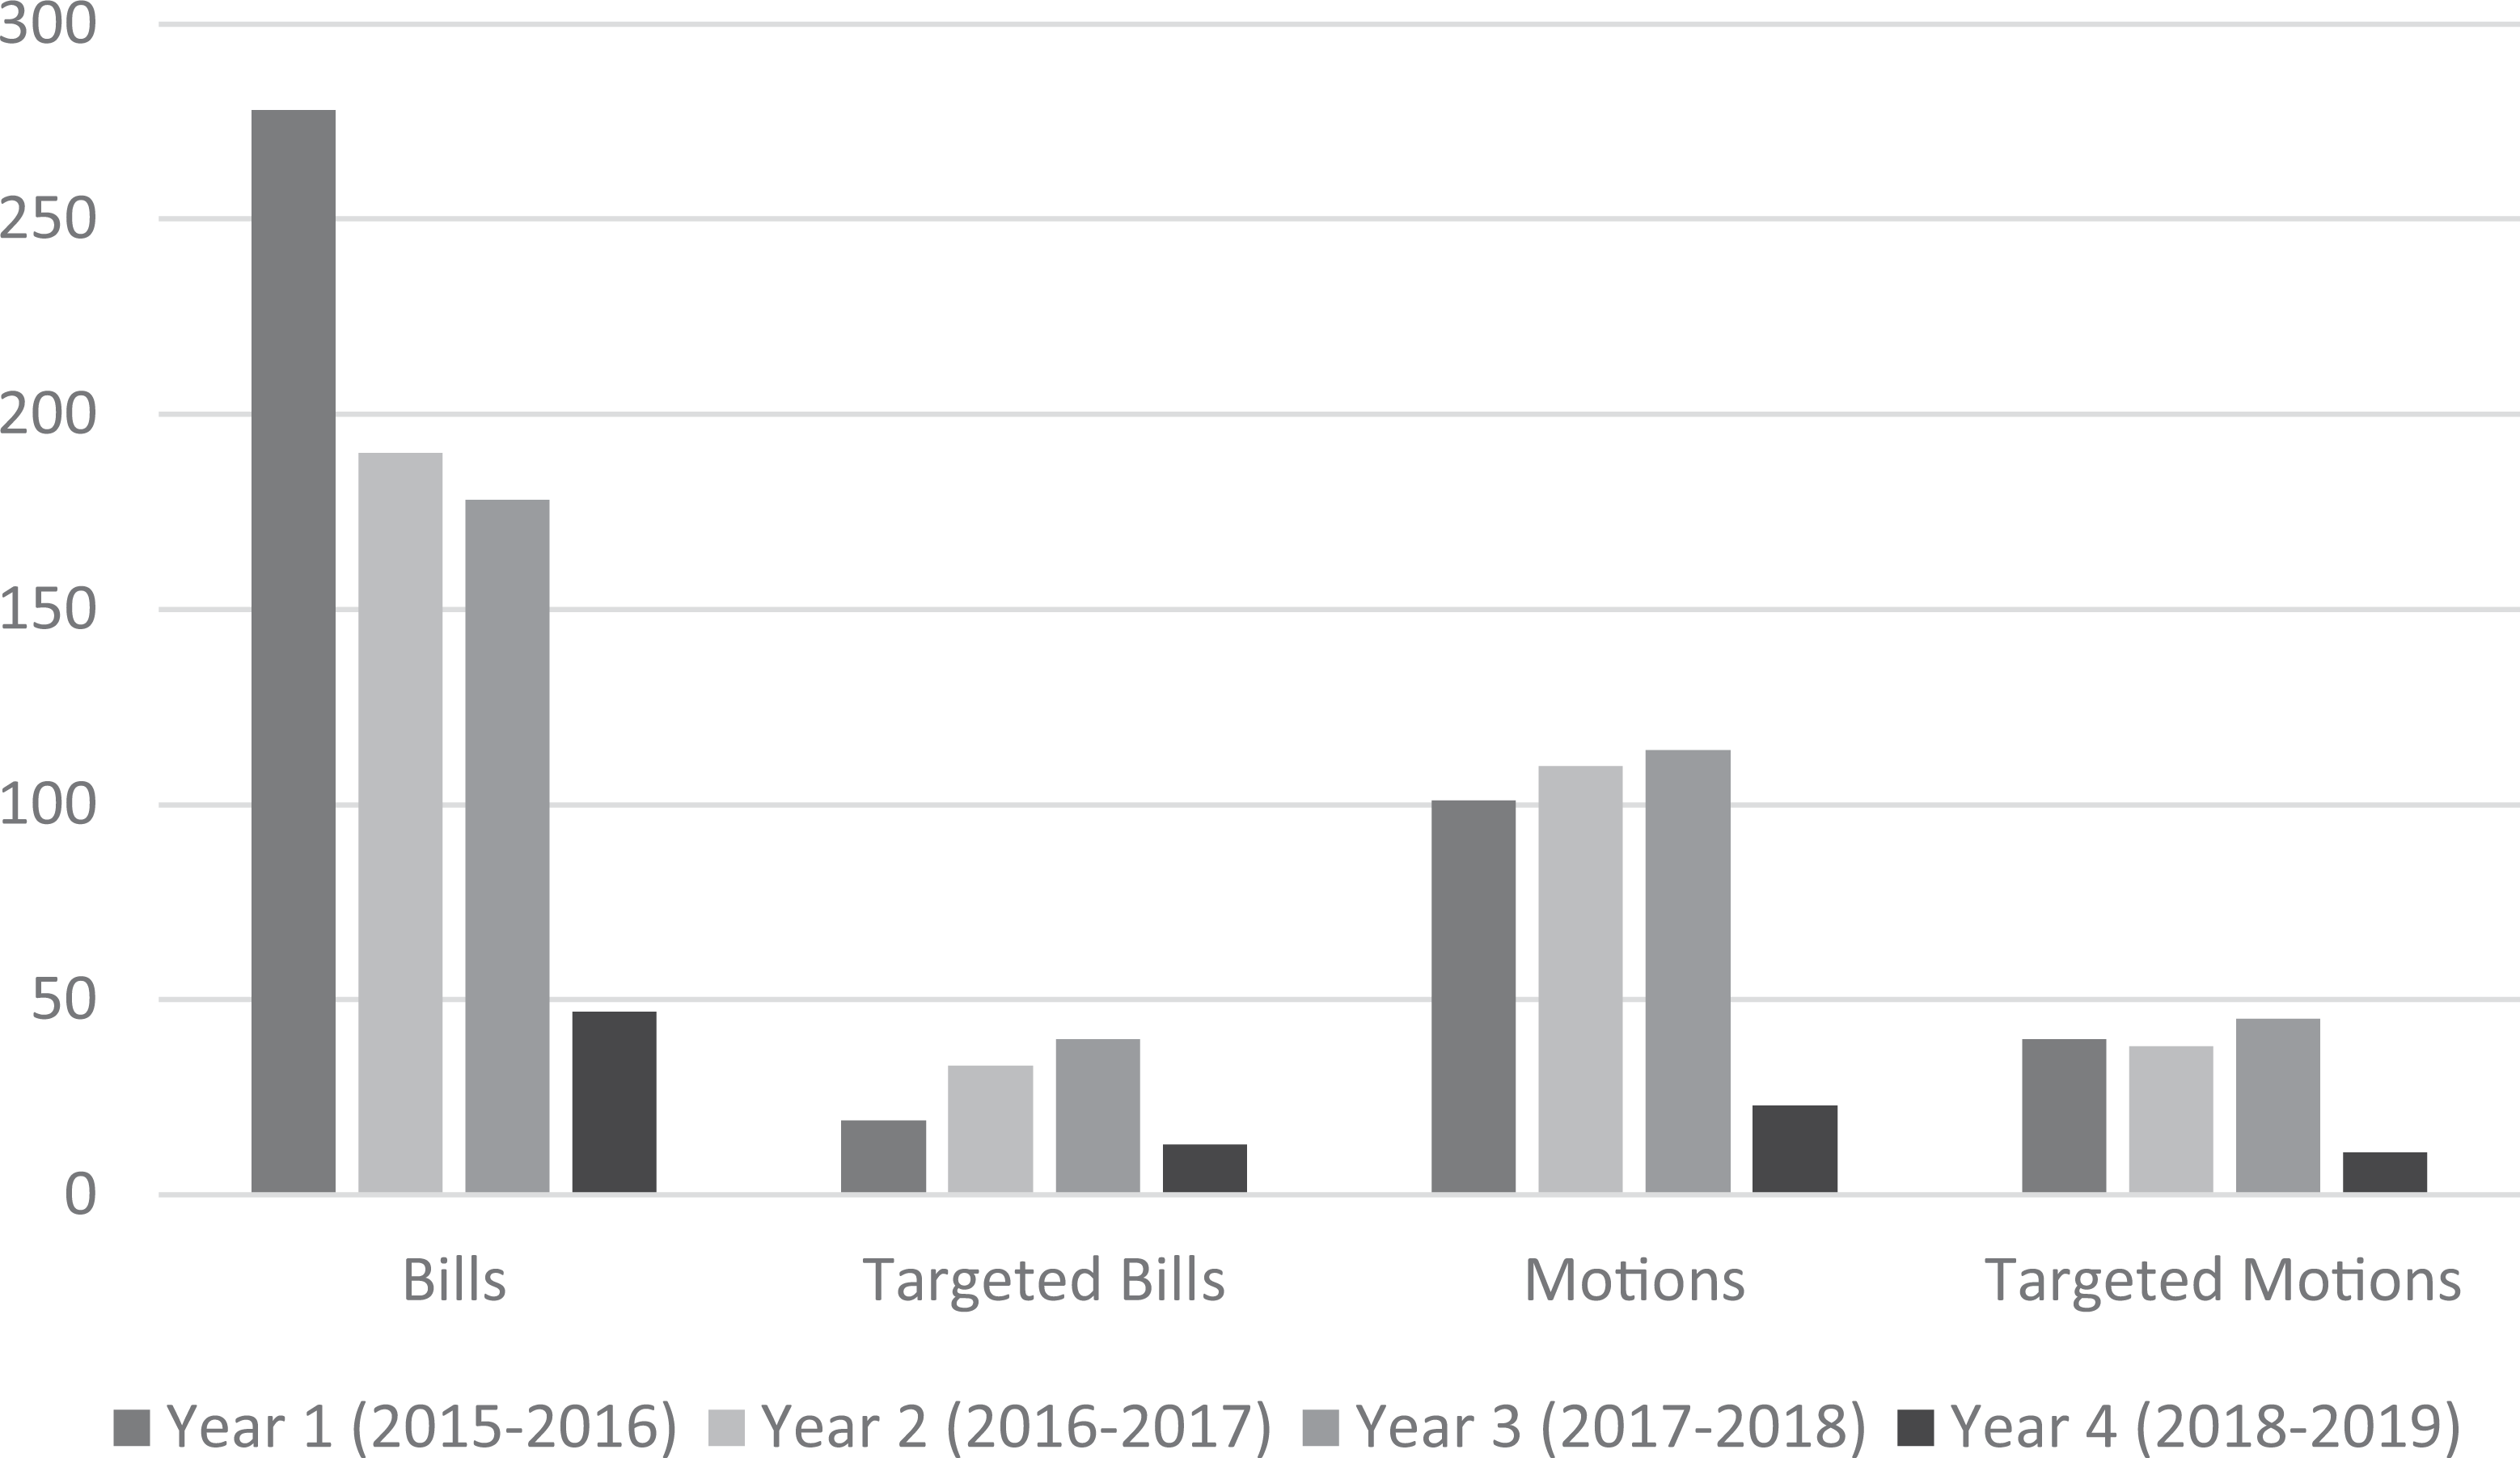
Introduction of bills and motions in Nigeria’s 8th Senate.
12% of all private bills are targeted, but the adoption rate for these bills is higher, around 40%. It is difficult to determine whether the ratio of targeted bills to all private bills can be considered high or low in the African context due to a lack of comparative evidence. The proportion does appear somewhat higher than those for Italian legislatures (Marangoni and Tronconi, 2011: 425) and somewhat lower than for past Colombian legislatures (Crisp and Ingall, 2002: 741). For both chambers, more targeted bills were introduced in the third legislative year. This is in line with interview data that pointed out that MPs try to establish new institutions in their home region in the third year in preparation for the elections. The increase appears relatively limited, however. The number of motions and targeted motions appears to be similar during the first 3 legislative years. The share of motions that is targeted is higher than for bills, around 50%. Most motions are adopted, only around 10% of motions are deferred or withdrawn. It has to be mentioned, however, that while many motions are passed by the Assembly, they are often ignored by the executive.
The aggregate data on targeted bills and motions cannot directly inform us about the importance of legislator-constituent ties. Furthermore, in some cases – though rarely – MPs sponsor targeted initiatives not directed towards their own state. Yet it is possible to link bill and motion sponsorship to individual MPs and determine whether this has an effect on MPs’ re-election trajectories. Indeed, individual MPs differ strongly in the attention they devote to bill and motion sponsorship with some sponsoring many and others few or none (see Table A1 in Appendix). Table 2 shows the relationship between sponsorship and re-election in the form of logistic regression coefficients. Each independent variable is added separately in bivariate models given the correlations between them. More extensive models controlling for party, vote margin, committee chairmanship, region, gender, age etc. support these results (see Tables A2 and A3 in Appendix). 7
Logistic regression coefficients for the relationship between sponsorship and re-election.
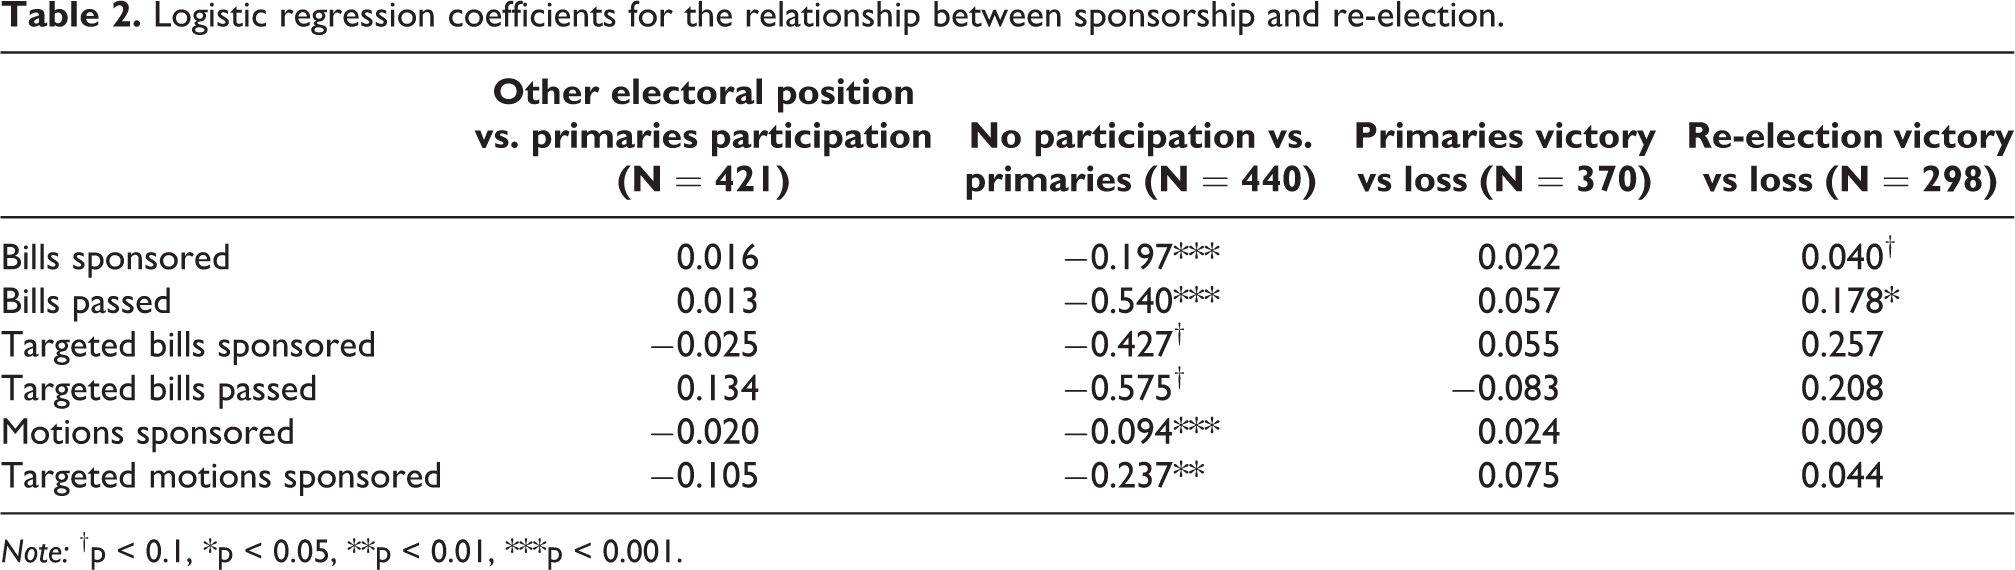
Note: †p < 0.1, *p < 0.05, **p < 0.01, ***p < 0.001.
The results in Table 2 indicate that both bill and motion sponsorship, whether targeted or not, have no influence on the decision to go for another, higher electoral position. Investment in sponsorship is hence not likely to be viewed by politicians as an instrument to advance their political careers. Interestingly, sponsorship is negatively related to the decision not to participate in the primaries or go for another elected position. The causal relationship is uncertain, however. Perhaps lawmakers who did not put a lot of effort into sponsorship are given the signal that re-election is unlikely because of this. Or, lawmakers who know from the beginning they will probably not have another term invest less in sponsorship. The latter may imply that rotation rules based on locality actually foster less initiative in favour of that locality.
Victory at the primaries itself is again unrelated to sponsorship. This indicates that party delegates and members do not hold these actions in high regard in the nomination process. The effect of bill sponsorship appears a positive predictor of victory in the official elections. This result should be treated with caution, however, given that voters are likely to be poorly informed about lawmakers sponsorship activities. In general, the results indicate that constituency focus is not rewarded by parties, also because there are no clear differences between the effects of general and targeted sponsorship. Similar results also apply to specifically non-targeted bills. MPs are also not punished, however. Adida and colleagues (2020) argue that in Benin voters punish MPs who engage extensively in legislative tasks because these MPs (are perceived to) devote less time to constituency service. Such perceptions do not appear present among party selectorates in Nigeria.
The implementation of constituency development projects
Lawmakers’ use of CDFs has received substantial scholarly attention in recent years. Harris and Posner (2019), for example, gather publicly available data on Kenyan MPs’ constituency projects and their locations to analyse whether MPs largely serve their own electoral supporters (drawing on polling station data) and ethnic group. They demonstrate that after controlling for other factors such as poverty no clear evidence of selective targeting is found. Ejdemyr and colleagues (2018), on the other hand, gather government data on the location of boreholes funded by Malawian MPs and find that MPs are more likely to target areas where ethnic groups live segregated, and that the targeting is more often directed to coethnics. Bussel (2019) uses public data on state lawmakers’ use of CDFs in Karnataka state of India. By matching the projects to electoral data, she finds lawmakers mainly target electoral strongholds. According to her argument, this is in contrast to federal lawmakers’ predominant focus on noncontingent constituency service. Ofosu (2019) analyses Ghanaian lawmakers’ use of CDFs based on local administrative data and finds that MPs use more of the available funds in constituencies with tighter past election monitoring.
Nigeria appears different from these cases. A first indication of this is the fact that data on the use of CDFs is not made available by the government, nor even collected. In response to complaints in some areas of the country about a lack of federal presence (in the form of federal roads, educational establishments, health facilities etc.), the government has for some time decided to gather data on the location of federal projects throughout the country (see Demarest et al., 2020). However, even though funding is allocated in the government budget for this endeavour, not much has come out of it yet. 8
Given media and civil society complaints about the lack of project implementation and embezzlement, this data gap is not coincidental. While Harris and Posner (2019) do note the possibility of non-existent projects in Kenya, this risk is estimated as limited. Similarly, Ofosu (2019: 970) argues Ghanaian data are reliable because ultimate accountability lies with local governments who are subjected to strict auditing. In Nigeria, the risk is undoubtedly more serious. Fortunately, civil society actors have taken it upon themselves to track constituency projects and verify their implementation on the ground. BudgIT’s ‘Tracka’ project started with the 8th NASS and has covered the implementation of projects in an increasing number of states over time, 26 out of 36 in the last year of the 8th NASS. Their reports have partly been made publicly available, but extended versions were gathered directly from the NGO’s Lagos office (BudgIT, 2017, 2018b, 2019).
The Tracka programme officers gather information on constituency projects budgeted at MDAs, track their implementation, inform communities about intended projects, and assist them in contacting their representatives for follow-up to ensure the project is finished as intended. This is a laudable endeavour, also because the officers can experience threats on their inspection visits (see e.g. BudgIT, 2019: 124–131). Nevertheless, for analysis purposes, some drawbacks of the gathered data need to be kept in mind. First, given that the project supports communities in getting projects implemented, there is a risk that the data provide a more optimistic picture than is generally the case. This risk is limited, however. Not only because the implementation rates of the projects covered in the reports are already very low, but also because reports repeatedly indicate how programme officers were not able to get a response from MPs, or even got threats from MPs that they would abandon the project altogether if not left alone (BudgIT, 2018b: 131). Similar to the Ugandan case (Grossman et al., 2020; Humphreys and Weinstein, 2012), the idea of being monitored did apparently not lead to more activism from lawmakers.
Other drawbacks may be more important. While the data was gathered for 26 states in the last year of 8th NASS monitoring, it appears not all communities within a state were tracked. Furthermore, programme officers may put different degrees of effort in their verification of project execution, and may use different standards to categorize projects as completed. Finally, while many projects are listed by location, it is often not possible to determine whether a project was nominated by the senator of the senatorial district, or the representative of the underlying federal constituency. This is only mentioned occasionally in the reports. 9
For the reasons cited above, I do not match the data to individual legislators, but only use it in an aggregate manner. Regardless of data quality issues, important lessons can still be drawn. A first insight pertains to the type of projects nominated. Harris and Posner (2019: 125) report that 90% of Kenya’s constituency development funds are spent on public infrastructure in the form of schools, roads, and water works, while Bussel (2019: 276) reports that Indian state MPs spend over 90% on public infrastructure and community facilities.
In contrast, Nigerian MPs actually spent only limited amounts on public (club) goods. Tracka reports at least 50% of funding goes to so-called ‘empowerment’ projects (BudgIT, 2018: 165). These projects concern the distribution of tricycles, motorcycles, sewing machines etc. in local communities. The distribution is done by MPs themselves rather than the responsible agency. The monitoring of such projects is difficult for Tracka officers as no specific location or time is given. While it cannot always be verified whether goods were distributed among community members in general (or even at all), feedback from community members often indicates partisanship in distribution. 10 The amount allocated to empowerment projects also appears to become more important in the run-up to elections (BudgIT, 2019: 206). Other projects that allow for more selective targeting are medical outreach programmes, provision of agricultural or fishing equipment etc. A majority of the projects hence cater to private individuals.
Whereas other countries may target public goods to electoral strongholds (India, see Bussel, 2019) or coethnics (Malawi, see Ejdemyr et al., 2018), clientelist practices by Nigerian MPs appear even narrower. In Ghanaian constituencies with low election monitoring, MPs also devote more CDFs to private goods than in Kenya, with a more or less 50/50 division between private and public goods (Ofosu, 2019: 971). Nevertheless, when Ghanaian MPs provide public goods, their execution is guaranteed by procurement and auditing rules for local governments. In Nigeria, the implementation rate of public infrastructure projects is low. Rather than being completed in a year time, as in Kenya (Harris and Posner, 2019: 126), projects are continuously repeated in the budget, without actual implementation.
Figure 8 shows the project completion rates for the last 2 years of the 8th NASS (BudgIT, 2018b, 2019). I include the completion rates according to the reports’ own overview statistics (ratio of completed to total projects), but I also use two alternative measures given that goods distribution projects are hard to monitor. The first is based on the number of public infrastructure projects that were completed, even if only partially (but usable), or if substandard materials appeared to have been used (‘completed infrastructure-relaxed’). The second is based on the number of public infrastructure projects that were completed, without complaints (‘completed infrastructure-strict’). The measures take the ratio of completed infrastructure projects to total projects.
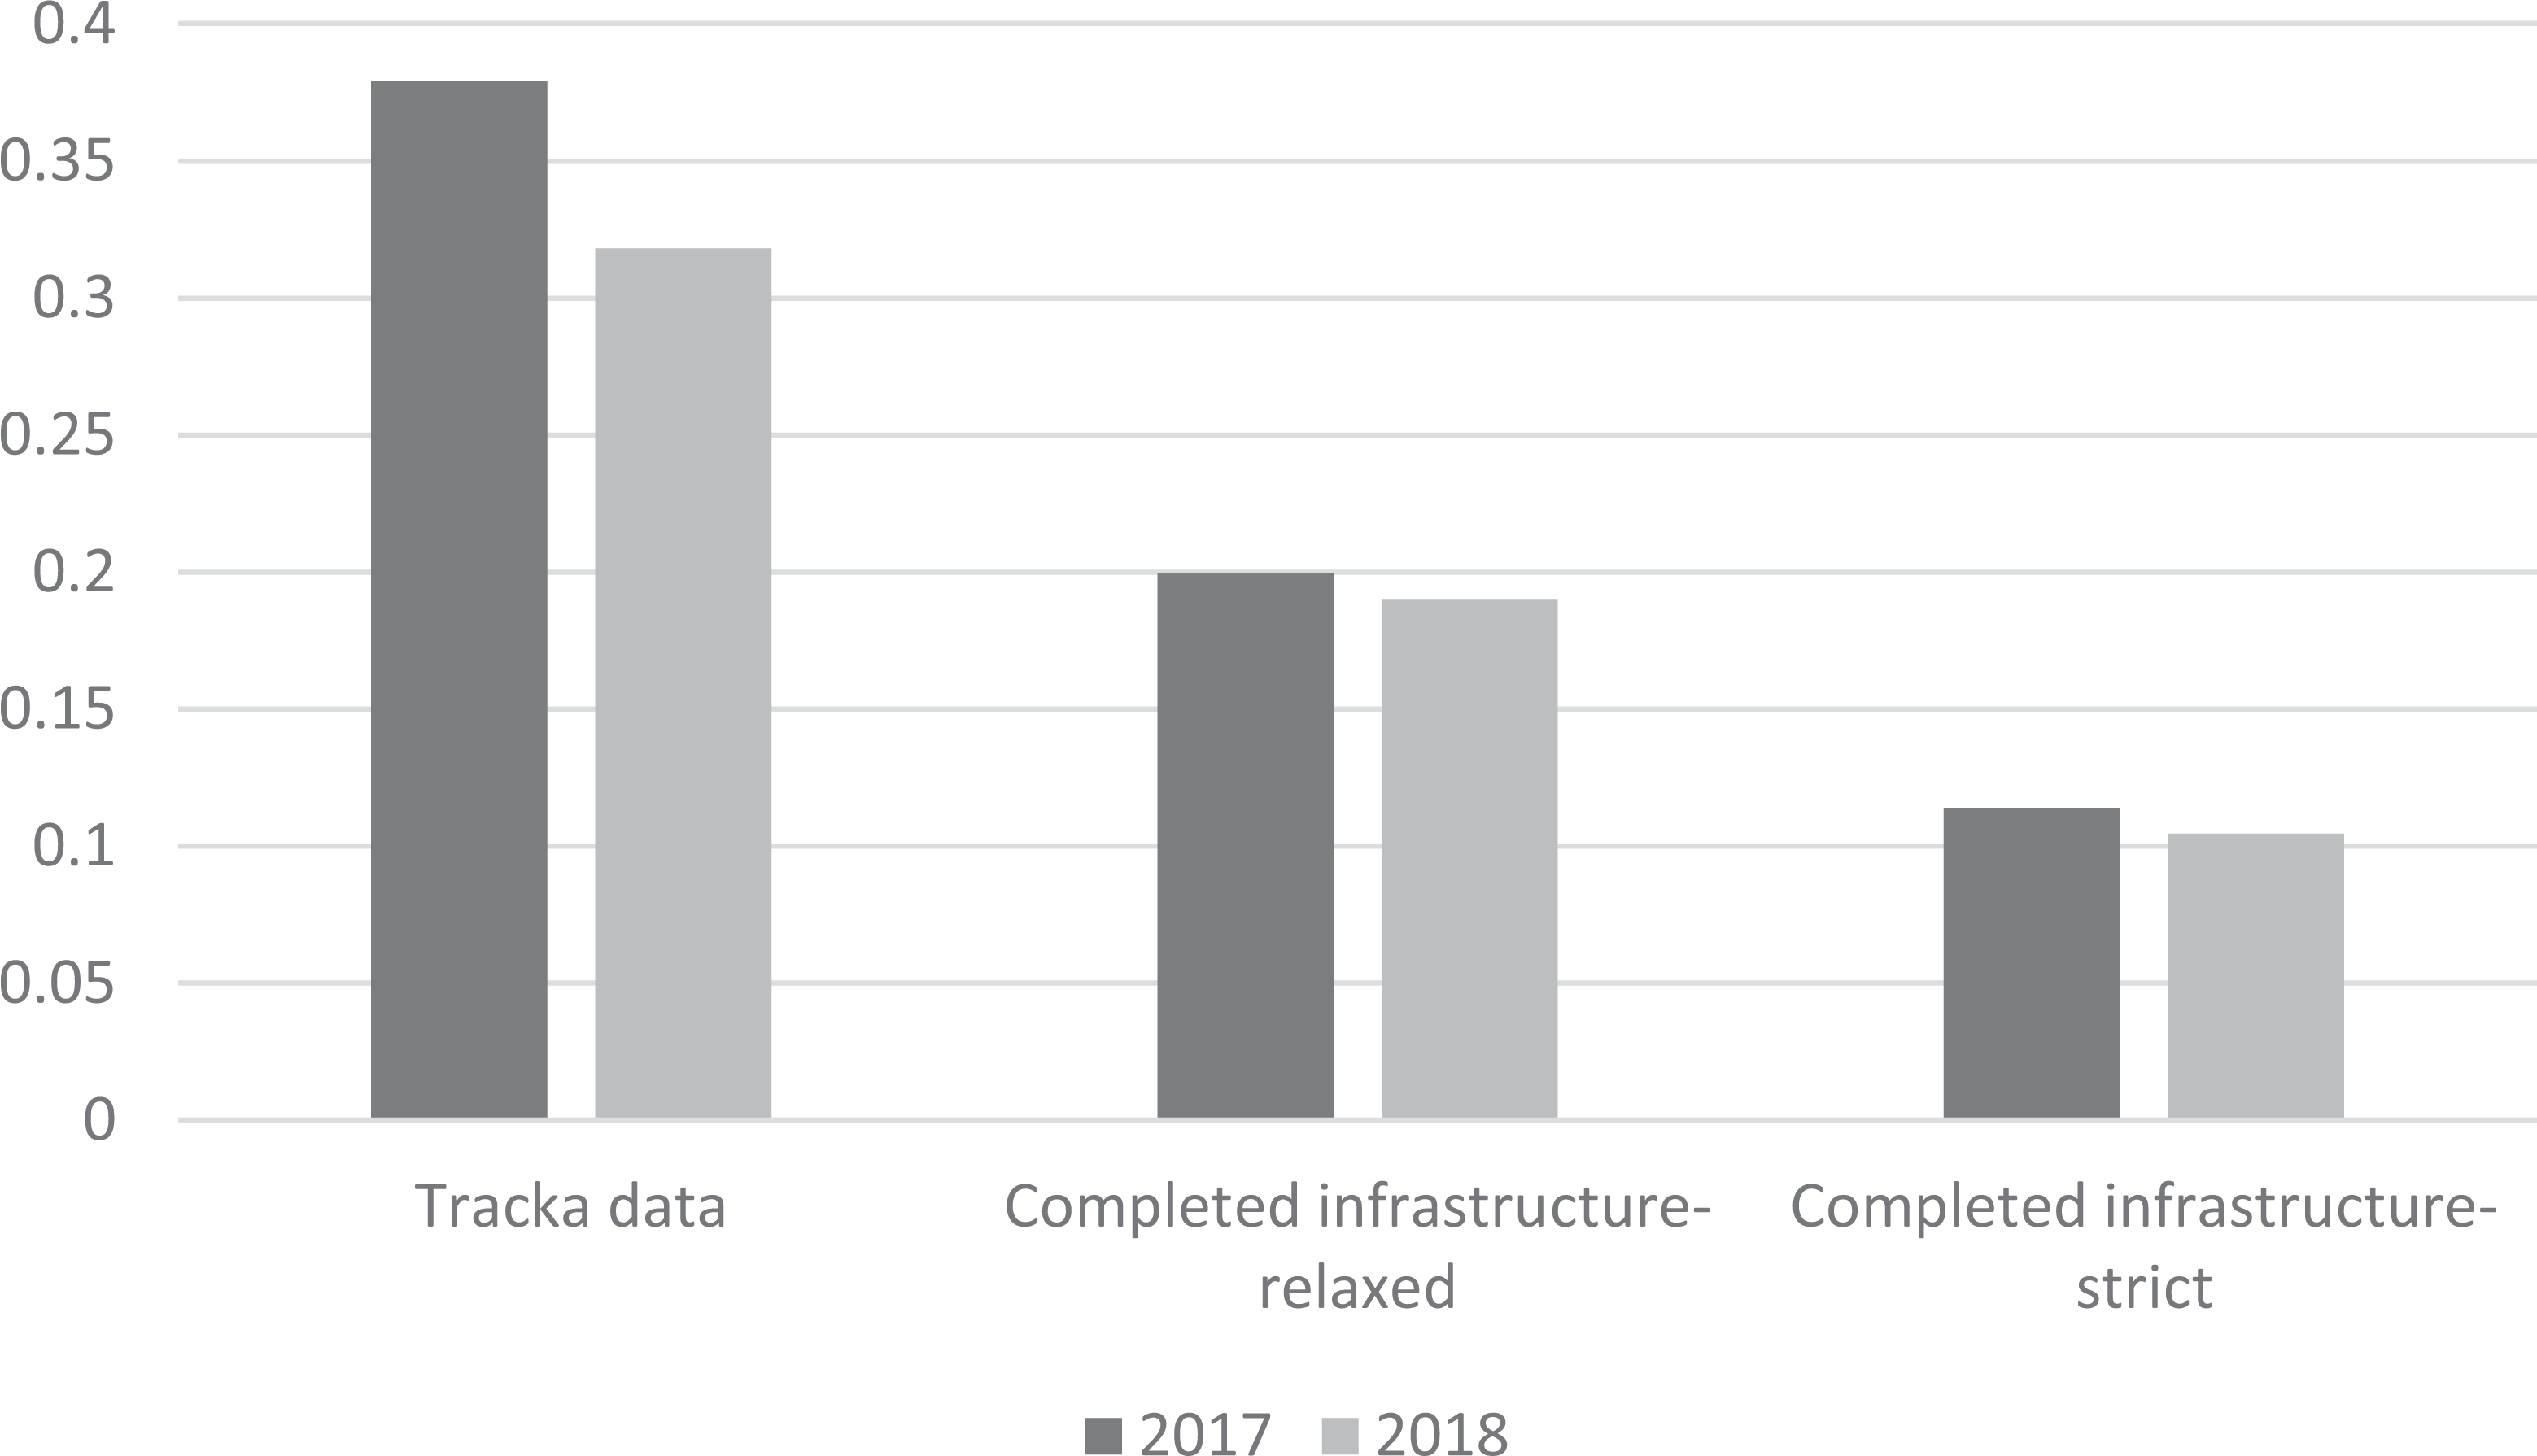
Constituency project completion rates. Source: BudgIT (2018b, 2019).
Figure 8 confirms the limited attention devoted by lawmakers to public infrastructure. There is variation over states, but none have a (relaxed) infrastructure completion rate over 50% (see Figures A2 and A3 in Appendix). Lawmakers also do not appear to boost their efforts in serving constituents when primaries and elections are drawing close. As discussed above, they may even prefer more private goods distribution in the run-up to elections (see also Ofosu, 2019: 975). The 2019 BudgIT report was finished mid-2019. This means that projects that were not fully completed by that time were not likely to ever be completed because of high turnover.
Budget implementation rates under Buhari’s first government have, of course, not been very high in general, with performance between 50% and 70% (e.g. Premium Times, 2018; Udo, 2016). These numbers focus on spending and not actual implementation as the Tracka reports do, indicating that actual implementation may also be that low for federal government projects. I do not find strong evidence that opposition MPs in particular are hindered in the implementation of their constituency projects by the APC administration, however. While completion rates are slightly lower for PDP-majority states, this (non-significant) difference may also be due to measurement error (see Table A4 in Appendix). Together, with the qualitative evidence, this supports the notion that poor constituency service forms part of MPs’ own purposeful behaviour, rather than being caused by external factors.
Conclusion
This paper has argued that Nigerian lawmakers have weak ties to their constituents and that political parties do not reward generalized constituency service. While most MPs seek to continue their political careers, serving constituents through the use of targeted legal initiatives or public infrastructure projects is not considered an important condition to achieve this. Narrow forms of clientelism in which resources are directed to party members and senior elites prevail. Nigerian MPs prefer to use constituency funds for private, partisan goods distribution rather than infrastructure, while embezzlement and contract inflation serve the businesses of senior ‘godfathers’. By drawing on evidence from other developing country cases, I have also shown that Nigerian party politics appear to rely on exceptionally narrow forms of clientelism in contrast to other cases (e.g. India, Kenya, Malawi, Tanzania). This indicates that important cross-national variation exists in MPs’ constituency focus and that findings from one (African) developing country may not hold for another.
Recent advances in the literature on African legislatures indicate potential explanations for this variation. Ofosu (2019) has most specifically argued that MPs’ constituency service depends on the quality and competitiveness of elections. Given that voters generally want constituency service (e.g. Wantchekon, 2003), high-quality elections and competition are likely to support local public goods provision. Parties will adapt recruitment strategies and no longer prioritize partisan clientelism. As discussed before, Nigerian primaries and elections are subjected to fraud and other forms of manipulation, indicating that the argument may apply here as well. Nevertheless, other cases do not necessarily fit this argument. Constituency service has been seen as important in Tanzania (Weghorst, 2015: 140–148) and Cameroon (Morse, 2021), while ruling party dominance and electoral manipulation are high in both countries. The latter also suggests that constituency service is not necessarily dependent on democracy scores.
Institutional legacies may also play a role. Kenyan MPs’ focus on public infrastructure (Harris and Posner, 2019) may stem from experiences with early post-independence harambee (‘self-help’) projects, which made local goods provision a crucial way to advance one’s political career (see Opalo, 2019: 214–215). Long spates of military rule, oil wealth, and deep-rooted ‘prebendalism’ (Joseph, 1987) have arguably not fostered this behaviour in Nigeria. This legacy may have also caused a lack of organization at the grassroots level and the formation of interest groups that may push MPs to serve local interests (Collord, 2021), or spread information about MP performance at a high enough level to influence voting behaviour (Adida et al., 2020; Humphreys and Weinstein, 2012). These explanations for narrow clientelism require further research, however.
I now turn to further implications for the Nigerian case itself. Firstly, while Nigeria’s main political parties show little programmatic differences, and may be considered weak because of frequent party switches, they do appear exceptionally strong in their gatekeeper roles. The strength of a party within a particular locality appears largely separated from the candidates it nominates, with people primarily voting for the party. This strength may not necessarily lie in the party as such, however, but rather with the most wealthy elites who determine which candidates to sponsor. Indeed, while the 2015 elections did bring a turnover of power, this was to a large extent caused by key stalwarts switching from the PDP to the APC.
Secondly, even though parties incentivize narrow partisan and elite clientelism, this is no guarantee for re-election. Turnover rates remain high and cannot solely be attributed to electoral volatility or zoning regulations. One explanation is that turnover is also part of elite strategies to retain power. As mentioned in interviews, governor support can be an important factor besides resources. This support may be withdrawn if a candidate could become a threat. Reports on rifts between ‘godfathers’ and ‘godsons’ in Nigerian media support the idea that elites may wish to avoid threats from former protégées. Another explanation may be due to information gaps. Candidates know that substantial resources are needed to win a party ticket, but do not necessarily know how much others bring to the table. This could result in bidding wars, with prices increasing at each turn, and frequent turnover.
A final observation is that parties remain strong in particular localities regardless of politicians’ limited focus on constituency service. Parties’ – or senior elites’ – choice not to incentivize constituency service may in fact even ensure that voter support can be retained with only temporal and private (i.e. vote buying) clientelistic efforts rather than the provision of durable services. Unfortunately for many Nigerian citizens, this undermines a virtuous cycle in which politicians compete by not only providing some personal patronage to voters, but by gradually providing more durable benefits in terms of infrastructure and job creation to win votes.
Research Data
Research Data abstract for Elite clientelism in Nigeria: The role of parties in weakening legislator-voter ties
Research Data abstract for Elite clientelism in Nigeria: The role of parties in weakening legislator-voter ties by Leila Demarest in Party Politics
Research Data
Research Data abstract for Elite clientelism in Nigeria: The role of parties in weakening legislator-voter ties
Research Data abstract for Elite clientelism in Nigeria: The role of parties in weakening legislator-voter ties by Leila Demarest in Party Politics
Research Data
Research Data abstract for Elite clientelism in Nigeria: The role of parties in weakening legislator-voter ties
Research Data abstract for Elite clientelism in Nigeria: The role of parties in weakening legislator-voter ties by Leila Demarest in Party Politics
Research Data
Research Data abstract for Elite clientelism in Nigeria: The role of parties in weakening legislator-voter ties
Research Data abstract for Elite clientelism in Nigeria: The role of parties in weakening legislator-voter ties by Leila Demarest in Party Politics
Research Data
Research Data abstract for Elite clientelism in Nigeria: The role of parties in weakening legislator-voter ties
Research Data abstract for Elite clientelism in Nigeria: The role of parties in weakening legislator-voter ties by Leila Demarest in Party Politics
Supplemental material
Supplemental Material, sj-docx-1-ppq-10.1177_13540688211030219 - Elite clientelism in Nigeria: The role of parties in weakening legislator-voter ties
Supplemental Material, sj-docx-1-ppq-10.1177_13540688211030219 for Elite clientelism in Nigeria: The role of parties in weakening legislator-voter ties by Leila Demarest in Party Politics
Footnotes
Acknowledgements
The author would like to thank the National Institute for Legislative and Democratic Studies (NILDS) in Abuja, Nigeria, for hosting her and providing a valuable entryway to parliamentary politics in Nigeria. She also thanks her interviewees for their time, BudgIT Nigeria for data sharing, and anonymous reviewers and colleagues for their comments on earlier drafts of this paper.
Declaration of conflicting interests
The author(s) declared no potential conflicts of interest with respect to the research, authorship, and/or publication of this article.
Funding
The author(s) disclosed receipt of the following financial support for the research, authorship, and/or publication of this article: This research was supported by the Research Foundation Flanders (FWO) with two long-term travel grants for Abuja: May-June 2017 (V426117N), July–September 2018 (V427418N).
Supplemental material
Supplemental material for this article is available online.
Notes
References
Supplementary Material
Please find the following supplemental material available below.
For Open Access articles published under a Creative Commons License, all supplemental material carries the same license as the article it is associated with.
For non-Open Access articles published, all supplemental material carries a non-exclusive license, and permission requests for re-use of supplemental material or any part of supplemental material shall be sent directly to the copyright owner as specified in the copyright notice associated with the article.